
Real Time Multipurpose Smart Waste Classification Model for Efficient Recycling in Smart Cities Using Multilayer Convolutional Neural Network and Perceptron

 ,
,  ,
,  , ,
, ,  and
and
Abstract
:1. Introduction
2. Literature Review
3. Methodology
3.1. Data Acquisition
3.2. Pre-Processing of Data
3.3. Multilayer Neural Network
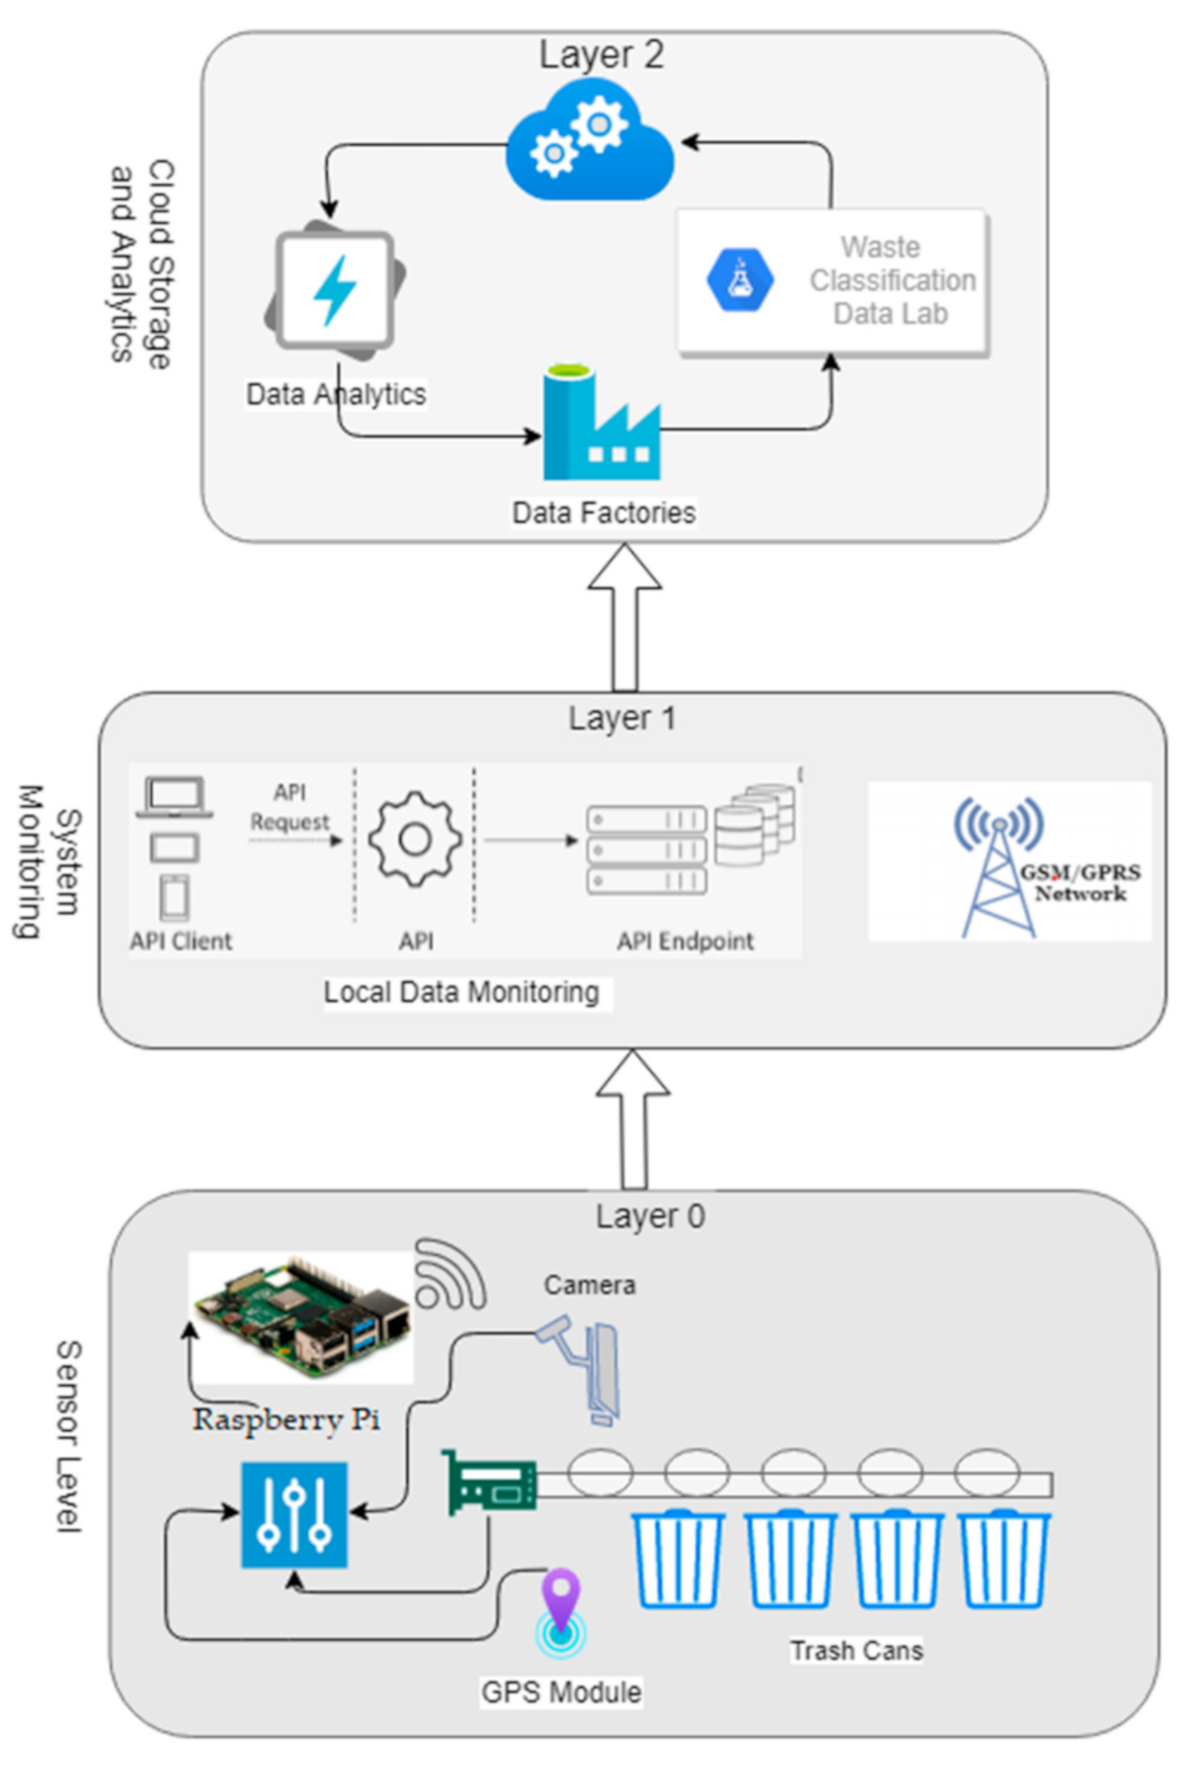
3.4. System Model
3.5. Basic Structure
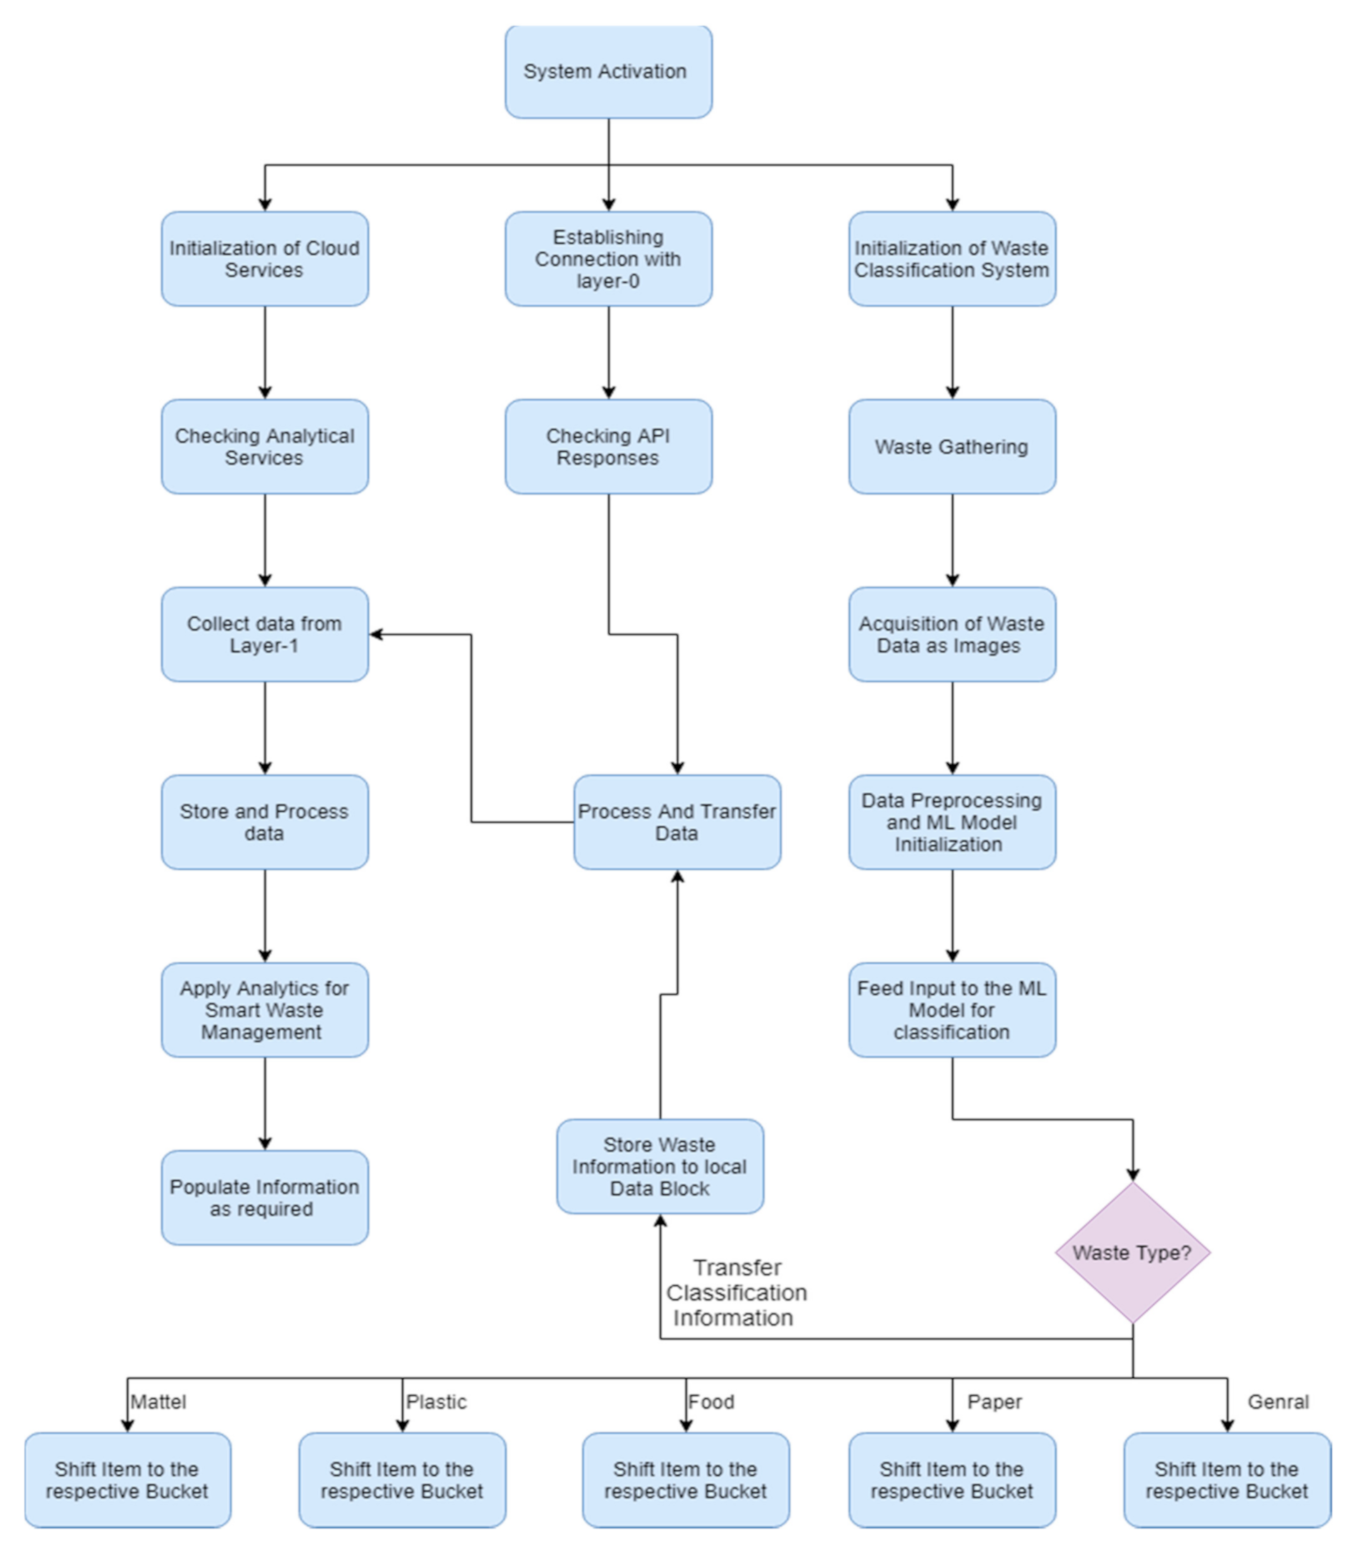
3.6. Working Structure
3.7. System Specification and Limitations
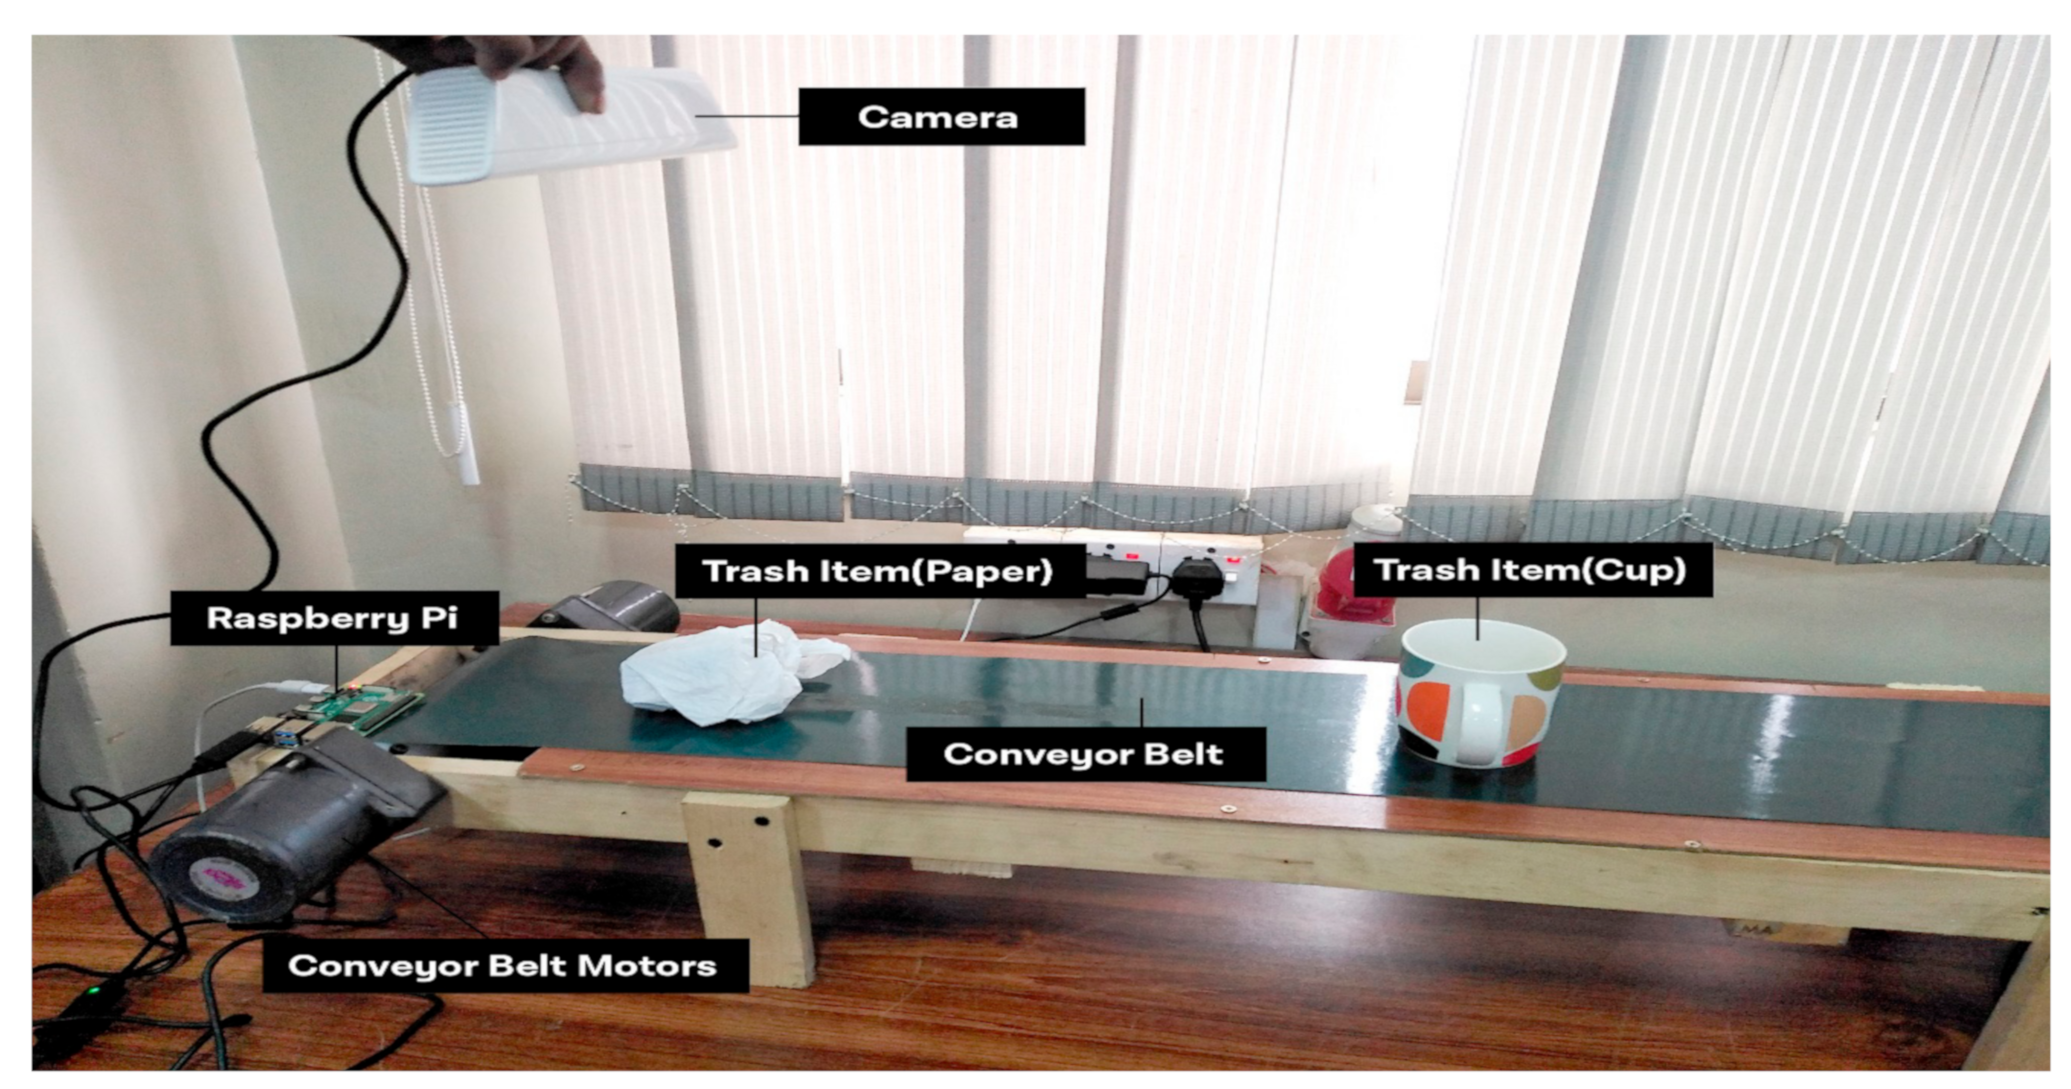
4. Experimental Setup
4.1. Sensor-Level System Model
4.2. Local System Monitoring and Management
4.3. Cloud Storage and Analytics
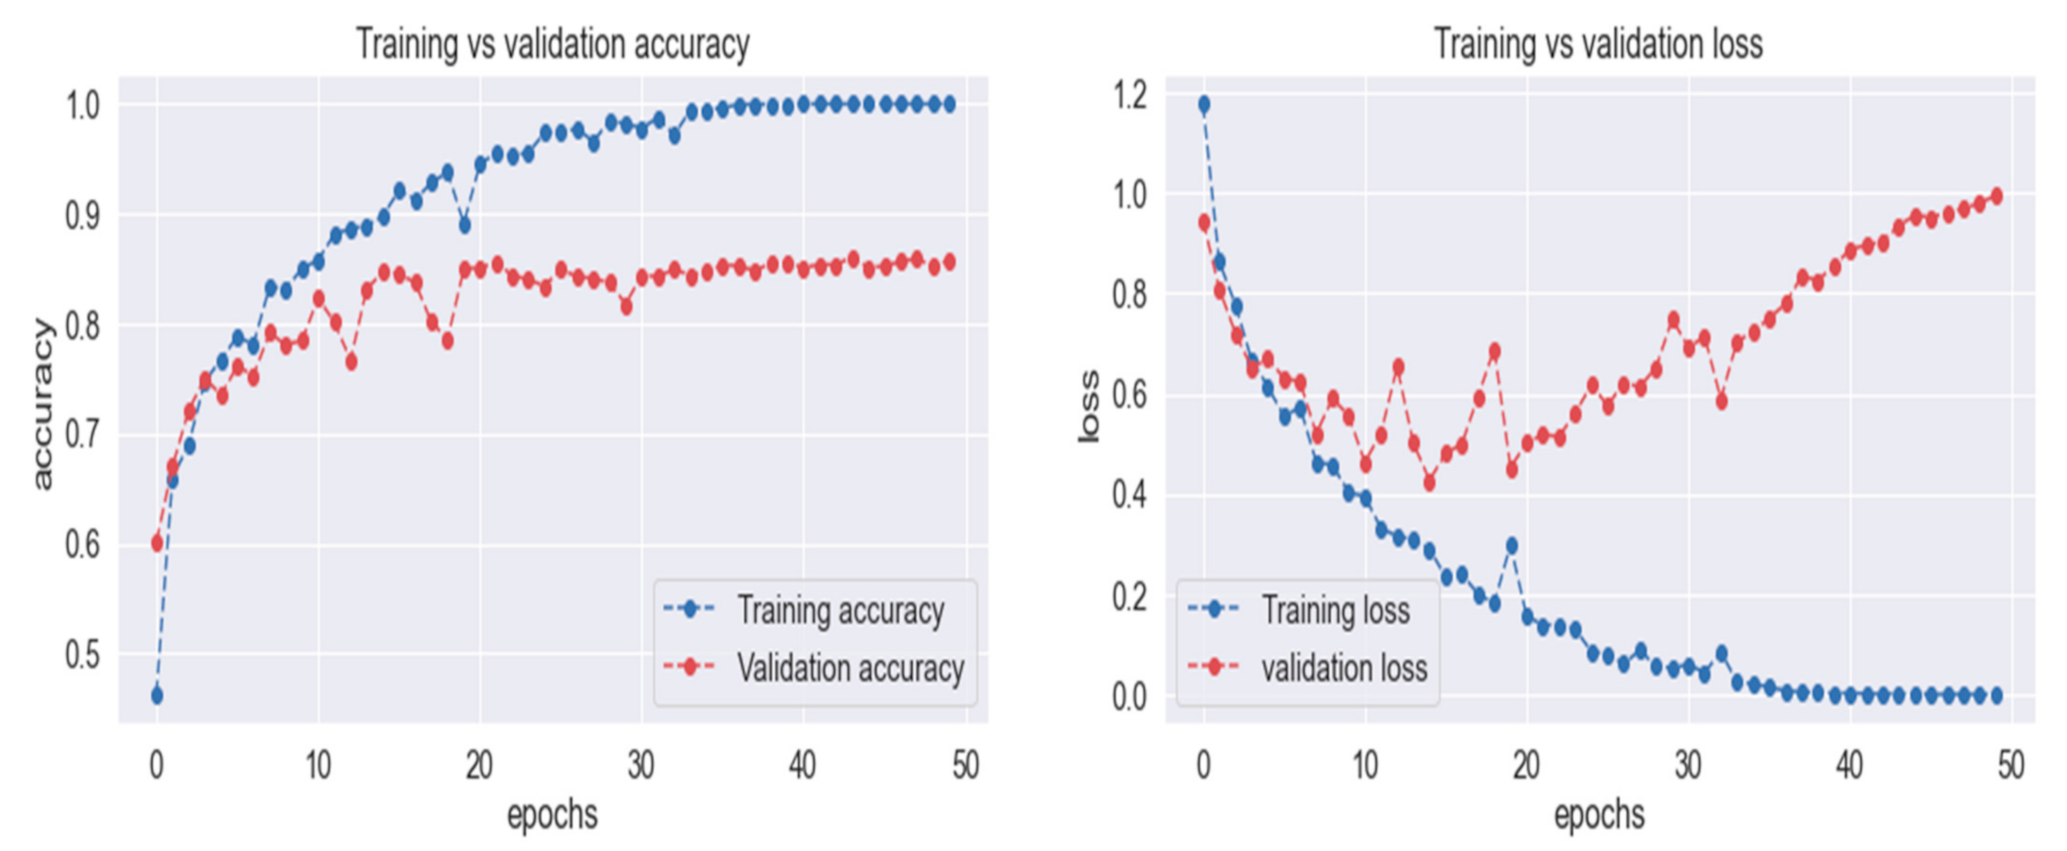
5. Results and Discussion
5.1. Confusion Matrix
5.2. Performance Evaluation Criteria
6. Conclusions
Author Contributions
Funding
Institutional Review Board Statement
Informed Consent Statement
Data Availability Statement
Acknowledgments
Conflicts of Interest
References
- Melikoglu, M. Reutilisation of food wastes for generating fuels and value added products: A global review. Environ. Technol. Innov. 2020, 19, 101040. [Google Scholar] [CrossRef]
- Catania, V.; Ventura, D. An approch for monitoring and smart planning of urban solid waste management using smart-M3 platform. In Proceedings of the 15th Conference of Open Innovations Association FRUCT, St. Petersburg, Russia, 21–25 April 2014. [Google Scholar]
- Hoornweg, D.; Bhada-Tata, P. What a Waste: A Global Review of Solid Waste Management; Urban Development Series; Knowledge Papers No. 15; World Bank: Washington, DC, USA, 2012; Available online: https://openknowledge.worldbank.org/handle/10986/17388 (accessed on 10 July 2021).
- Sanderson, R. Environmental Protection Agency Office of Federal Activities’ Guidance on Incorporating EPA’s Pollution Prevention Strategy into the Environmental Review Process; EPA: Washington, DC, USA, 1993. [Google Scholar]
- Tai, J.; Zhang, W.; Che, Y.; Feng, D. Municipal solid waste source-separated collection in China: A comparative analysis. Waste Manag. 2011, 31, 1673–1682. [Google Scholar] [CrossRef]
- Al-Salem, S.; Lettieri, P.; Baeyens, J. Recycling and recovery routes of plastic solid waste (PSW): A review. Waste Manag. 2009, 29, 2625–2643. [Google Scholar] [CrossRef]
- Tocan, M. Waste Recycling-Possible Solutions for the Romanian Challenges. Available online: https://ideas.repec.org/p/eub/wpaper/2018-02.html (accessed on 10 July 2021).
- Simonyan, K.; Zisserman, A. Very deep convolutional networks for large-scale image recognition. arXiv 2014, arXiv:1409.1556. [Google Scholar]
- Al-Saffar, A.A.M.; Tao, H.; Talab, M.A. Review of deep convolution neural network in image classification. In Proceedings of the 2017 International Conference on Radar, Antenna, Microwave, Electronics, and Telecommunications (ICRAMET), Jakarta, Indonesia, 23–24 October 2017. [Google Scholar]
- Adedeji, O.; Wang, Z. Intelligent Waste Classification System Using Deep Learning Convolutional Neural Network. Procedia Manuf. 2019, 35, 607–612. [Google Scholar] [CrossRef]
- Chu, Y.; Huang, C.; Xie, X.; Tan, B.; Kamal, S.; Xiong, X. Multilayer Hybrid Deep-Learning Method for Waste Classification and Recycling. Comput. Intell. Neurosci. 2018, 2018, 5060857. [Google Scholar] [CrossRef] [PubMed] [Green Version]
- Vo, A.H.; Son, L.H.; Vo, M.T.; Le, T. A Novel Framework for Trash Classification Using Deep Transfer Learning. IEEE Access 2019, 7, 178631–178639. [Google Scholar] [CrossRef]
- Hoornweg, D.; Bhada-Tata, P. A Global Review of Solid Waste Management; Urban Development & Local Government Unit World Bank: Washington, DC, USA, 2012. [Google Scholar]
- Gray, J.; Evans, N.; Taylor, B.; Rizzo, J.; Walker, M. State of the evidence: The connection between breast cancer and the environment. Int. J. Occup. Environ. Health 2009, 15, 43–78. [Google Scholar] [CrossRef] [PubMed]
- Kuchaiev, O.; Ginsburg, B. Factorization tricks for LSTM networks. arXiv 2017, arXiv:1703.10722. [Google Scholar]
- Zeiler, M.D.; Fergus, R. Visualizing and understanding convolutional networks. In European Conference on Computer Vision; Springer: Berlin, Germany, 2014. [Google Scholar]
- Lin, M.; Chen, Q.; Yan, S. Network in network. arXiv 2013, arXiv:1312.4400. [Google Scholar]
- Yang, M.; Thung, G. Classification of Trash for Recyclability Status; CS229 Project Report. 2016. Available online: http://cs229.stanford.edu/proj2016/report/ThungYang-ClassificationOfTrashForRecyclabilityStatus-report.pdf (accessed on 10 July 2021).
- Zheng, Y.Y.; Kong, J.L.; Jin, X.B.; Wang, X.Y.; Su, T.L.; Zuo, M. CropDeep: The crop vision dataset for deep-learning-based classification and detection in precision agriculture. Sensors 2019, 19, 1058. [Google Scholar] [CrossRef] [PubMed] [Green Version]
- Liu, B.; Zhang, Y.; He, D.; Li, Y. Identification of Apple Leaf Diseases Based on Deep Convolutional Neural Networks. Symmetry 2017, 10, 11. [Google Scholar] [CrossRef] [Green Version]
- Le, T.; Vo, M.T.; Vo, B.; Hwang, E.; Rho, S.; Baik, S.W. Improving Electric Energy Consumption Prediction Using CNN and Bi-LSTM. Appl. Sci. 2019, 9, 4237. [Google Scholar] [CrossRef] [Green Version]
- Xie, S.; Girshick, R.; Dollar, P.; Tu, Z.; He, K. Aggregated Residual Transformations for Deep Neural Networks. In Proceedings of the 2017 IEEE Conference on Computer Vision and Pattern Recognition, Honolulu, HI, USA, 21–26 July 2017. [Google Scholar]
- He, K.; Zhang, X.; Ren, S.; Sun, J. Deep Residual Learning for Image Recognition. In Proceedings of the 2016 IEEE Conference on Computer Vision and Pattern Recognition (CVPR), Seattle, WA, USA, 1 June 2016. [Google Scholar]


| Part Name | Details | |
|---|---|---|
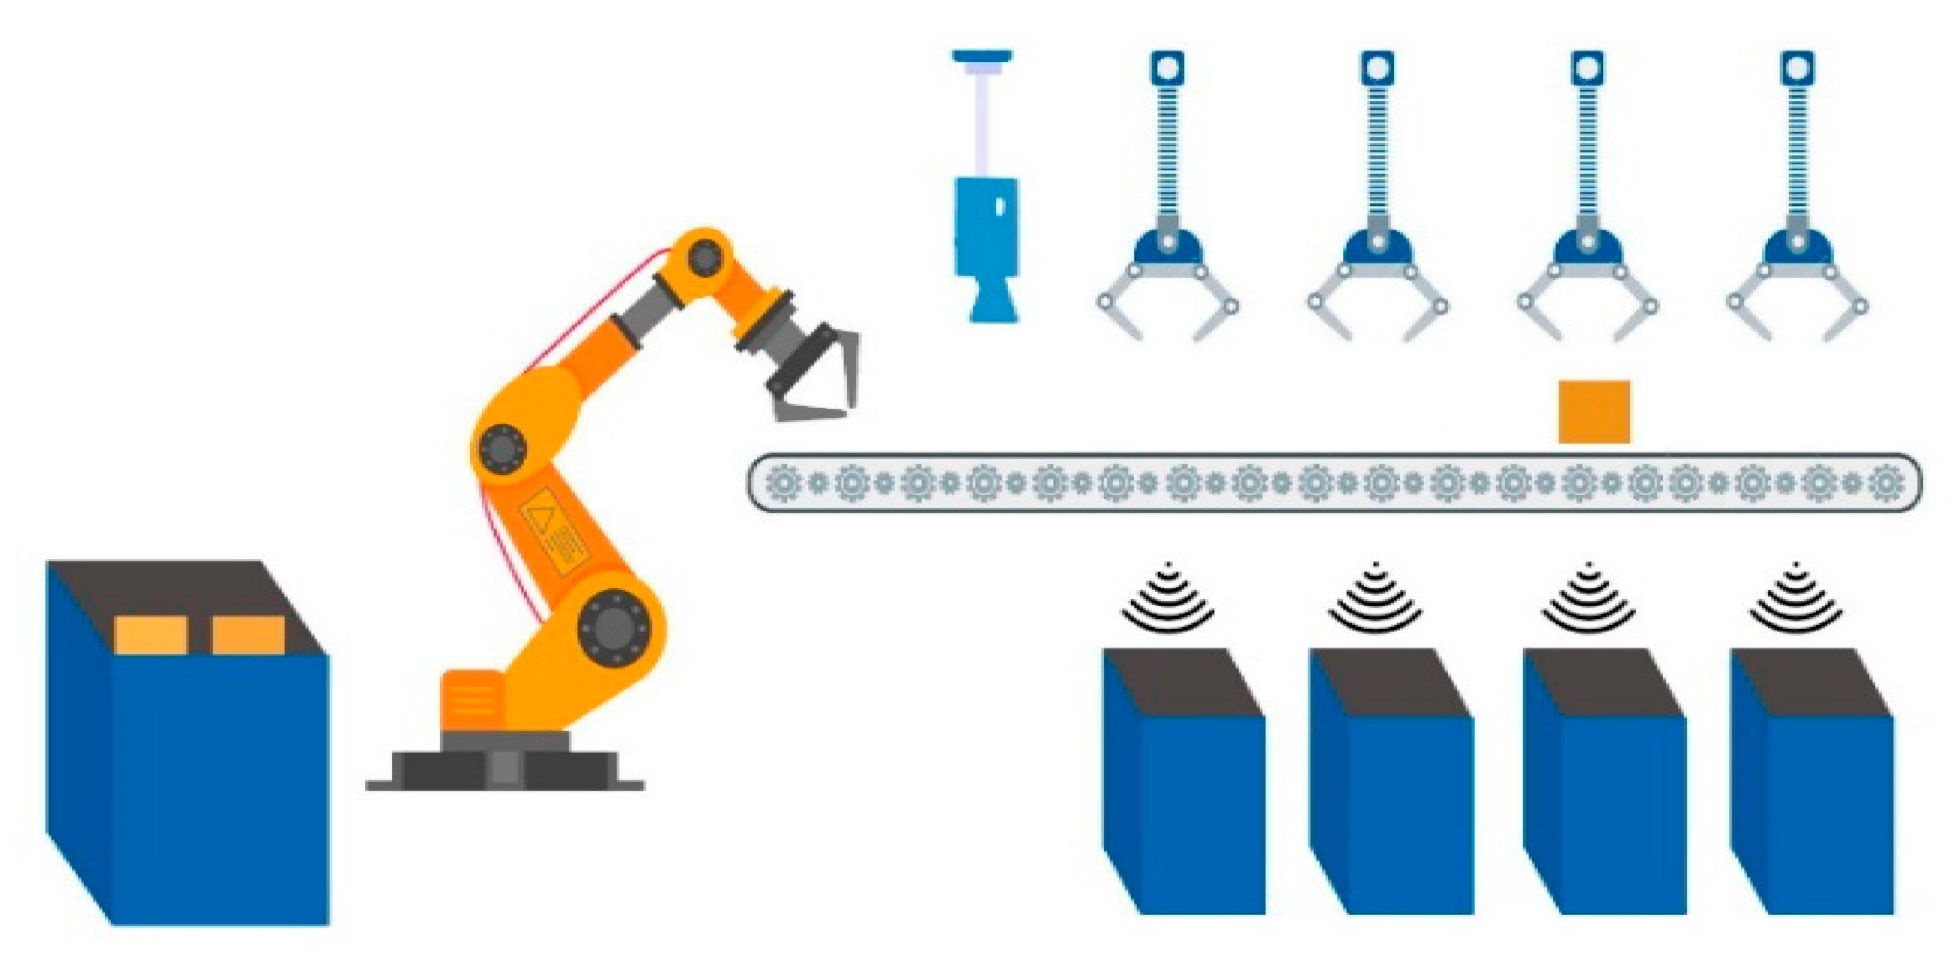
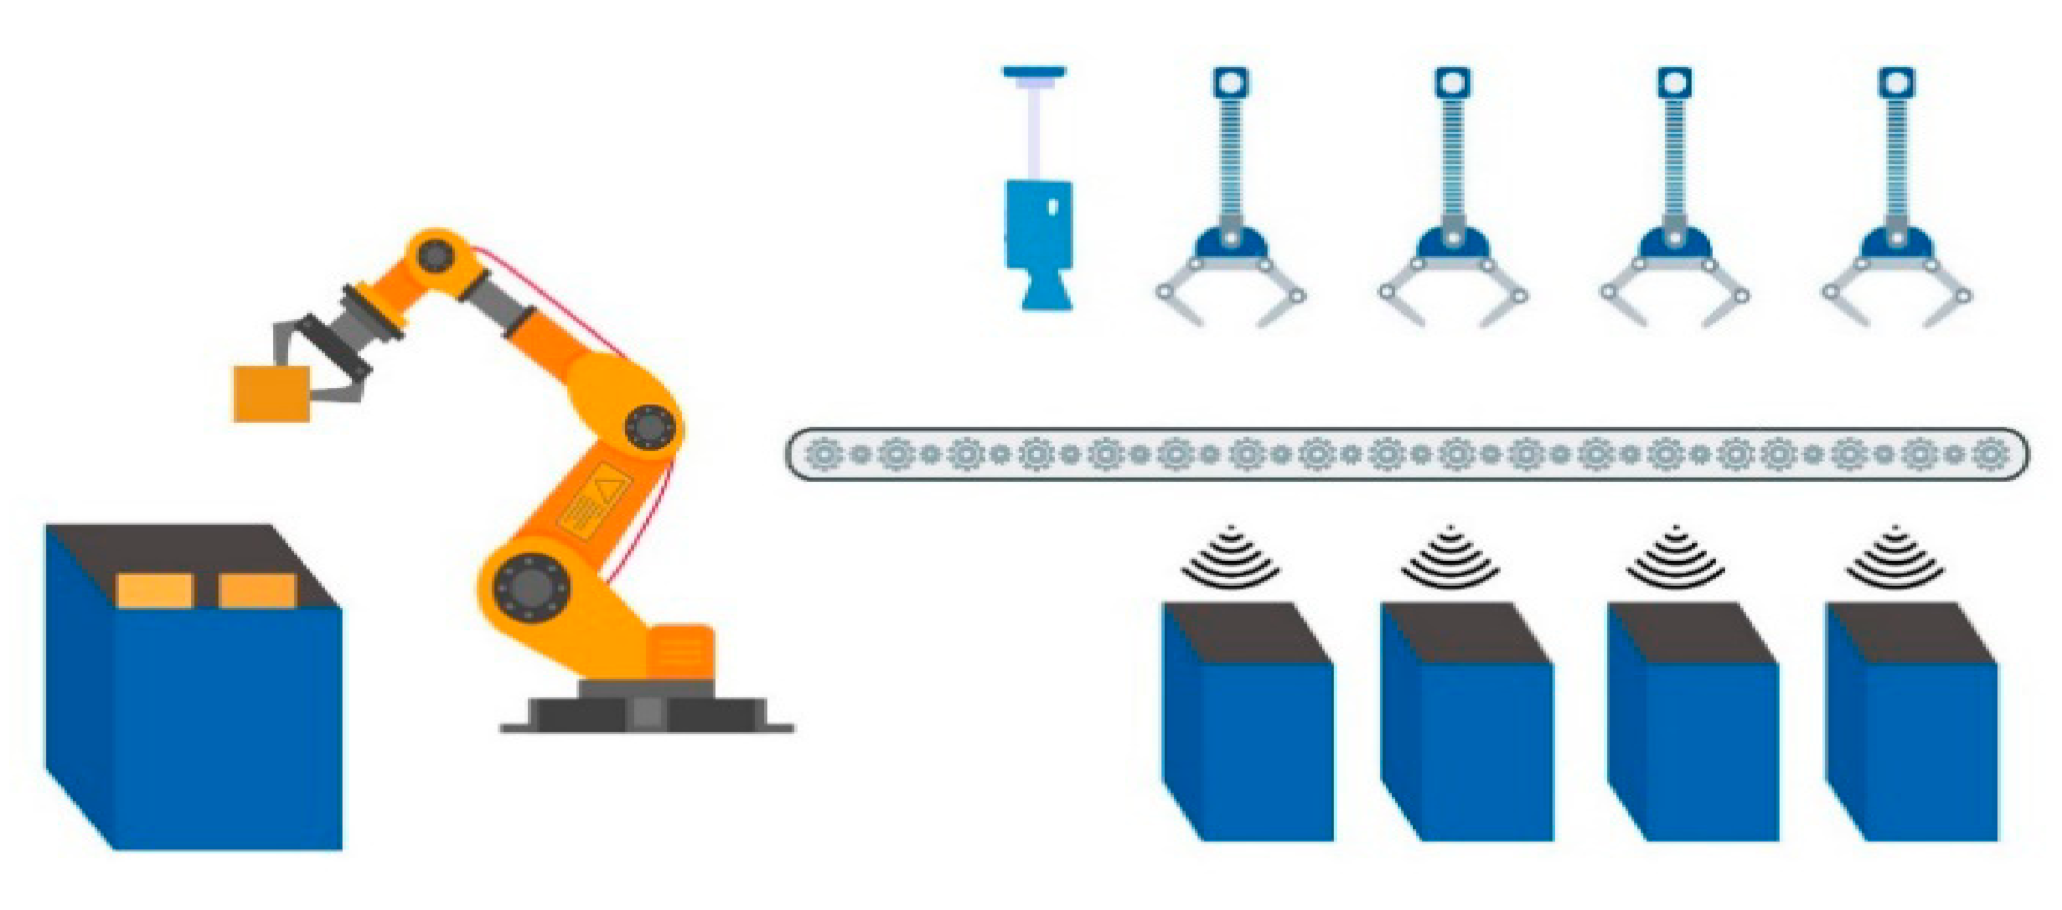
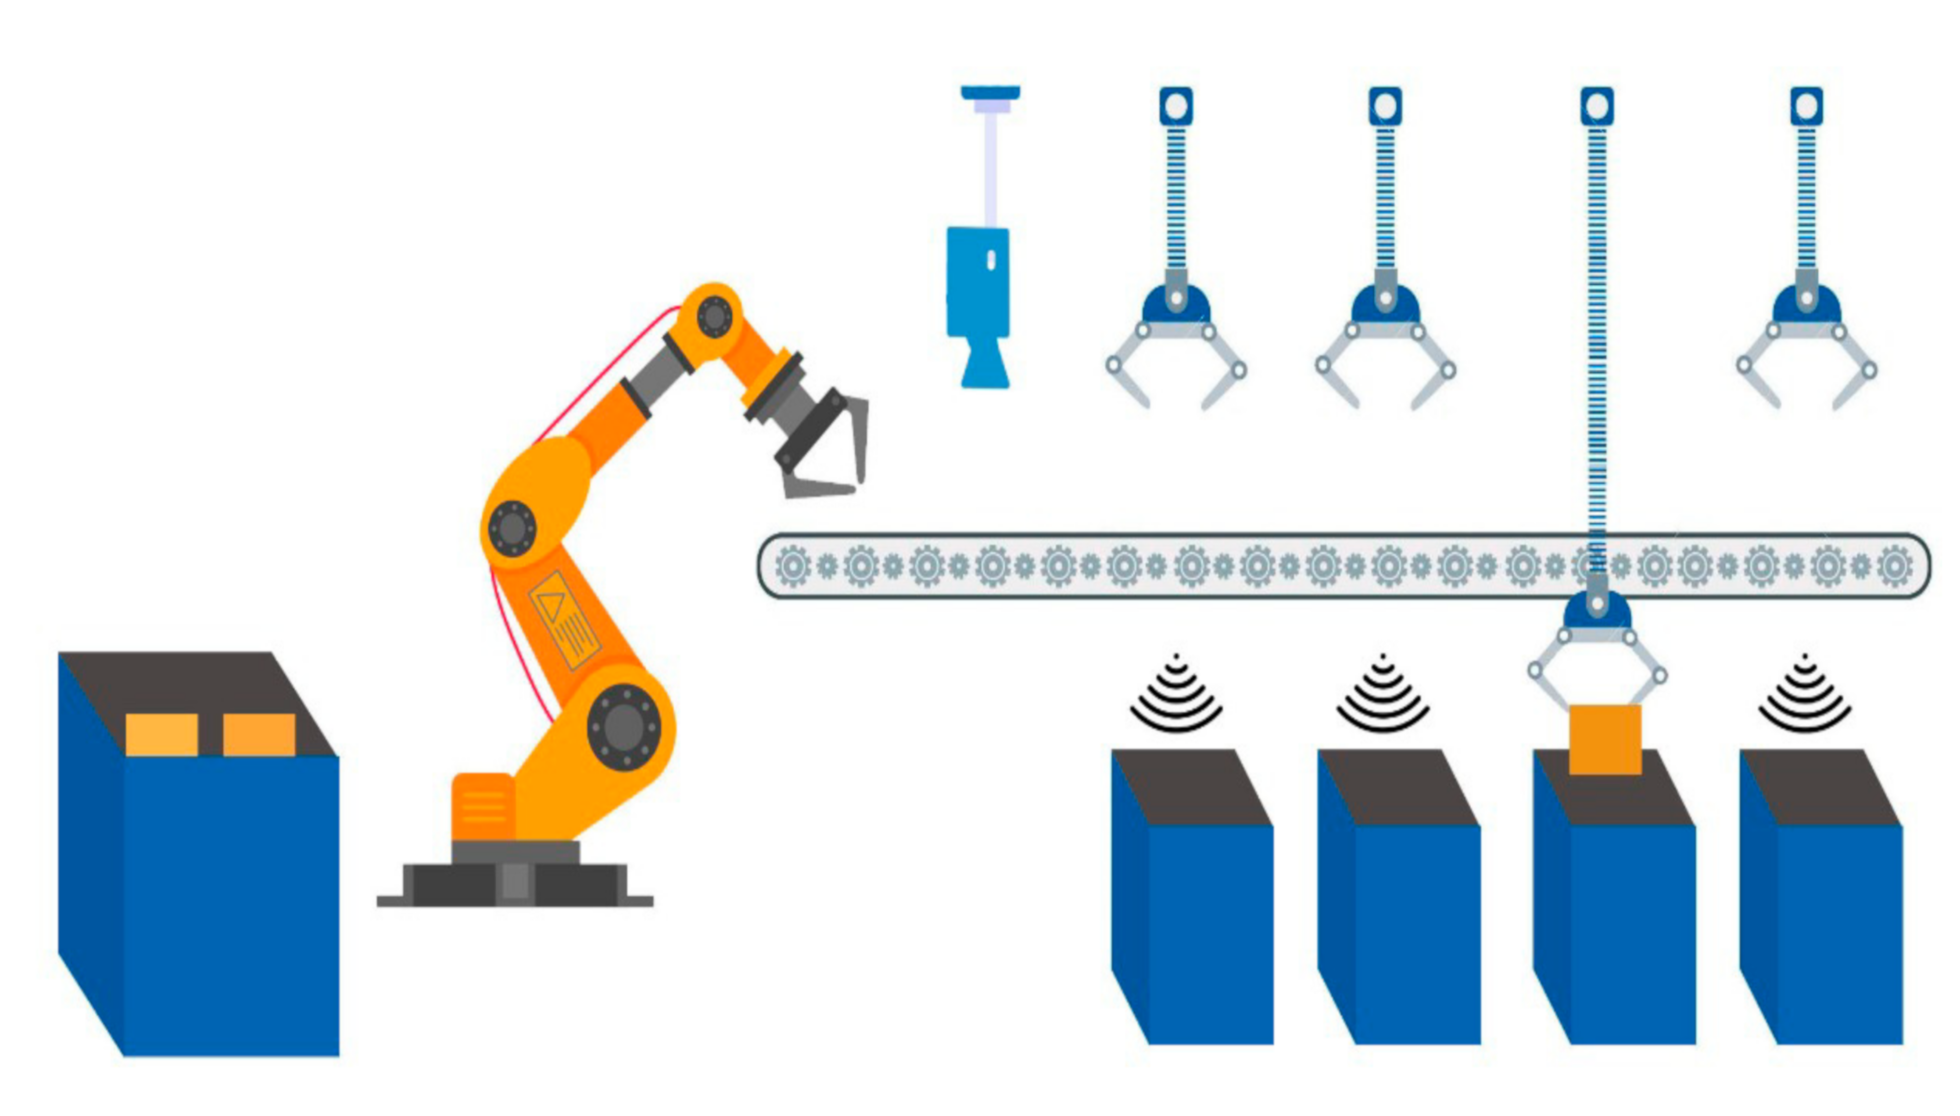
| Robotic Arm | Task | The core functionality of this robotic arm is to pick a single item from a trash bucket and place it on the conveyor belt. |
| Specification | It can pick and place trash item of around 2 KG. The arm is capable of shifting 15 items per minute. | |
| Limitations | Claw of arm is capable of picking items of 12 cm to 20 cm. The weight limitation of arm is 2 KG. | |
| Conveyor Belt | Task | Functionality of moving conveyor belt is to move within a specific speed range defined as 12 complete rotations in a minute. |
| Specification | Trash items will be moved after classification to their corresponding buckets. It can carry items of around 2 KG in weight. | |
| Limitations | Speed of the movement cannot be increased in this step, because this architecture is also configured with the classification process, so the specified time interval is also added to the total time of rotation. Weight limitation cannot be increased in this step, because this will also slow down the belt movement process. Using heavy motors and refined mechanical model can increase the weight limitation. | |
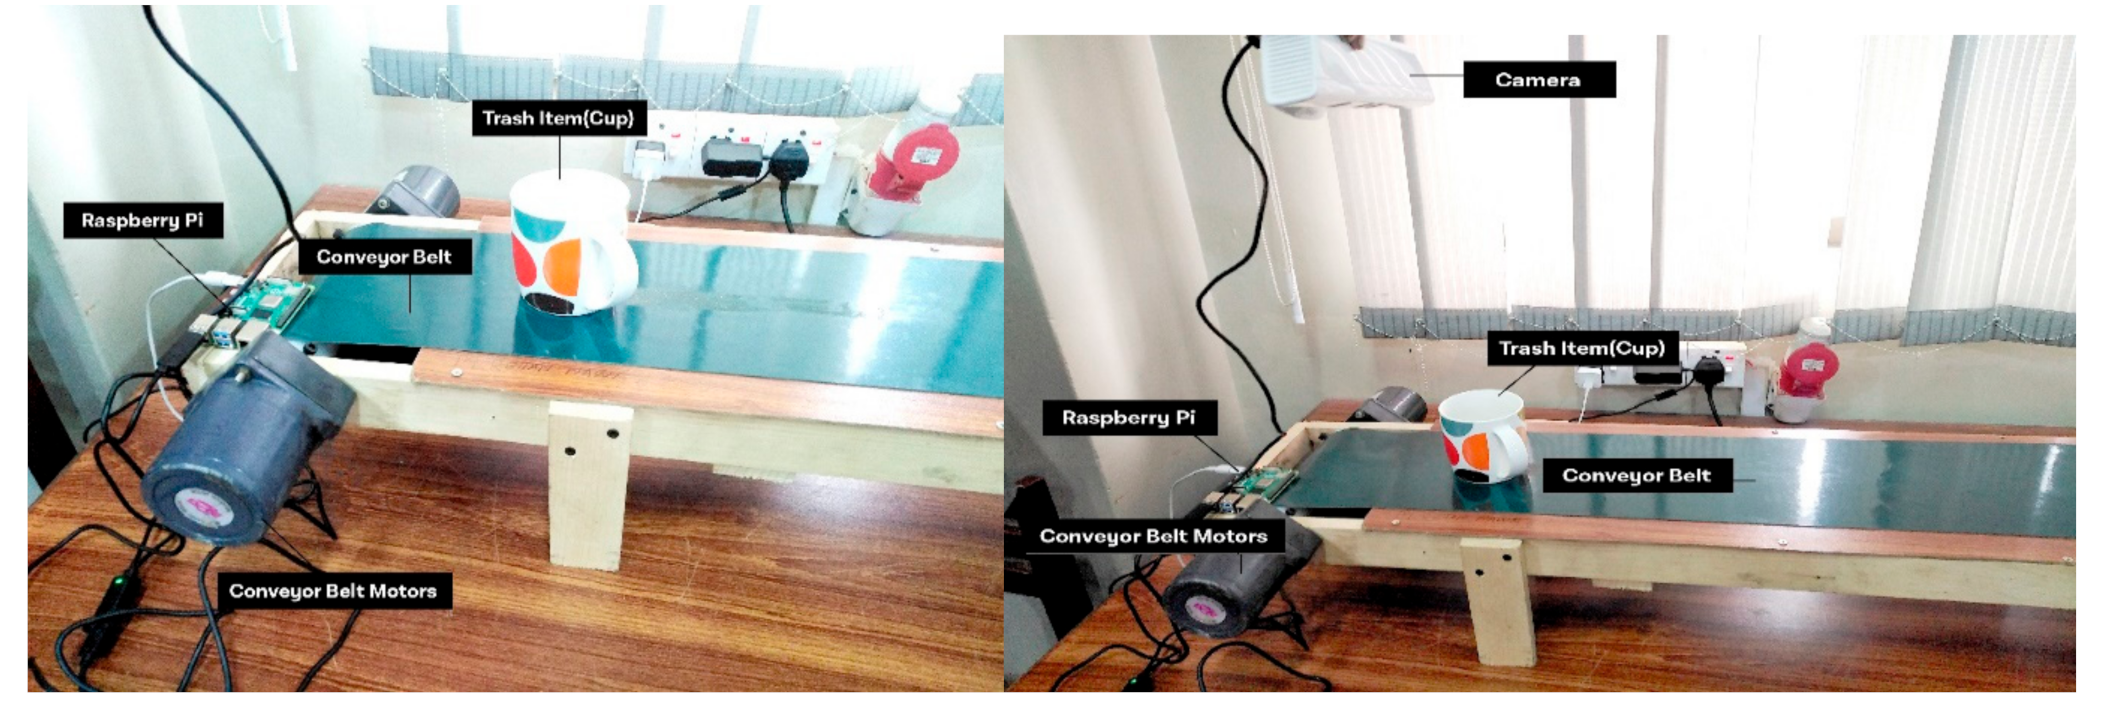
| Camera | Task | Capturing images of the trash items and transferring them to the connected Raspberry Pi module for classification process. |
| Specification | It has GPU support that increases the overall image capturing and transferring process. | |
| Limitations | There is no limitation for this module of the system. | |
| Raspberry Pi | Task | A tiny processor providing control structure for the classification process. With connected local server configured on Jetson Nano, it can transfer required data to the other module of the architecture for the next process. |
| Specification | Can run machine learning model for classification process. A portable device that is easy to program and configure. | |
| Limitations | Low computation power can affect the performance of the local system, not over-line. | |
| Precision | Recall | F1-Score | Support | |
|---|---|---|---|---|
| Food | 0.99 | 1.00 | 0.99 | 83 |
| Plastic | 1.00 | 0.95 | 0.98 | 62 |
| General | 1.00 | 1.00 | 1.00 | 72 |
| Metal | 0.99 | 1.00 | 0.99 | 92 |
| Paper | 0.95 | 0.97 | 0.96 | 40 |
| Precision | Recall | F1-Score | Support | |
|---|---|---|---|---|
| Accuracy | 0.99 | 349 | ||
| Macro avg. | 0.99 | 0.99 | 0.99 | 349 |
| Weighted avg. | 0.99 | 0.99 | 0.99 | 349 |
| Food | Plastic | General | Metal | Paper | |
|---|---|---|---|---|---|
| Food | 83 | 0 | 0 | 0 | 0 |
| Plastic | 0 | 59 | 0 | 1 | 2 |
| General | 0 | 0 | 72 | 0 | 0 |
| Metal | 0 | 0 | 0 | 92 | 0 |
| Paper | 1 | 0 | 0 | 0 | 39 |
| Reference | Dataset | Model | Precision | Recall | Accuracy | No. of Groups of Classes |
|---|---|---|---|---|---|---|
| (Yinghao Chu et al., 2018) | Self-generated | CNN | 88.6% | 6.8% | 87.7% | 2 |
| MHS | 97.1% | 92.3% | 91.6% | |||
| Our Model | Self-generated | MLP | 98.1% | 8.4% | 99% | 5 |
| CNN | 98% | 98% | 99% |
Publisher’s Note: MDPI stays neutral with regard to jurisdictional claims in published maps and institutional affiliations. |
© 2021 by the authors. Licensee MDPI, Basel, Switzerland. This article is an open access article distributed under the terms and conditions of the Creative Commons Attribution (CC BY) license (https://creativecommons.org/licenses/by/4.0/).
Share and Cite
Gondal, A.U.; Sadiq, M.I.; Ali, T.; Irfan, M.; Shaf, A.; Aamir, M.; Shoaib, M.; Glowacz, A.; Tadeusiewicz, R.; Kantoch, E. Real Time Multipurpose Smart Waste Classification Model for Efficient Recycling in Smart Cities Using Multilayer Convolutional Neural Network and Perceptron. Sensors 2021, 21, 4916. https://0-doi-org.brum.beds.ac.uk/10.3390/s21144916
Gondal AU, Sadiq MI, Ali T, Irfan M, Shaf A, Aamir M, Shoaib M, Glowacz A, Tadeusiewicz R, Kantoch E. Real Time Multipurpose Smart Waste Classification Model for Efficient Recycling in Smart Cities Using Multilayer Convolutional Neural Network and Perceptron. Sensors. 2021; 21(14):4916. https://0-doi-org.brum.beds.ac.uk/10.3390/s21144916
Chicago/Turabian StyleGondal, Ali Usman, Muhammad Imran Sadiq, Tariq Ali, Muhammad Irfan, Ahmad Shaf, Muhammad Aamir, Muhammad Shoaib, Adam Glowacz, Ryszard Tadeusiewicz, and Eliasz Kantoch. 2021. "Real Time Multipurpose Smart Waste Classification Model for Efficient Recycling in Smart Cities Using Multilayer Convolutional Neural Network and Perceptron" Sensors 21, no. 14: 4916. https://0-doi-org.brum.beds.ac.uk/10.3390/s21144916