
A Novel Microwave Resonant Sensor for Measuring Cancer Cell Line Aggressiveness

 ,
,  , , , , and
Abstract
:1. Introduction
2. Materials and Methods
2.1. Sensor Design and Realization
2.2. Cell Culture and Sample Preparation
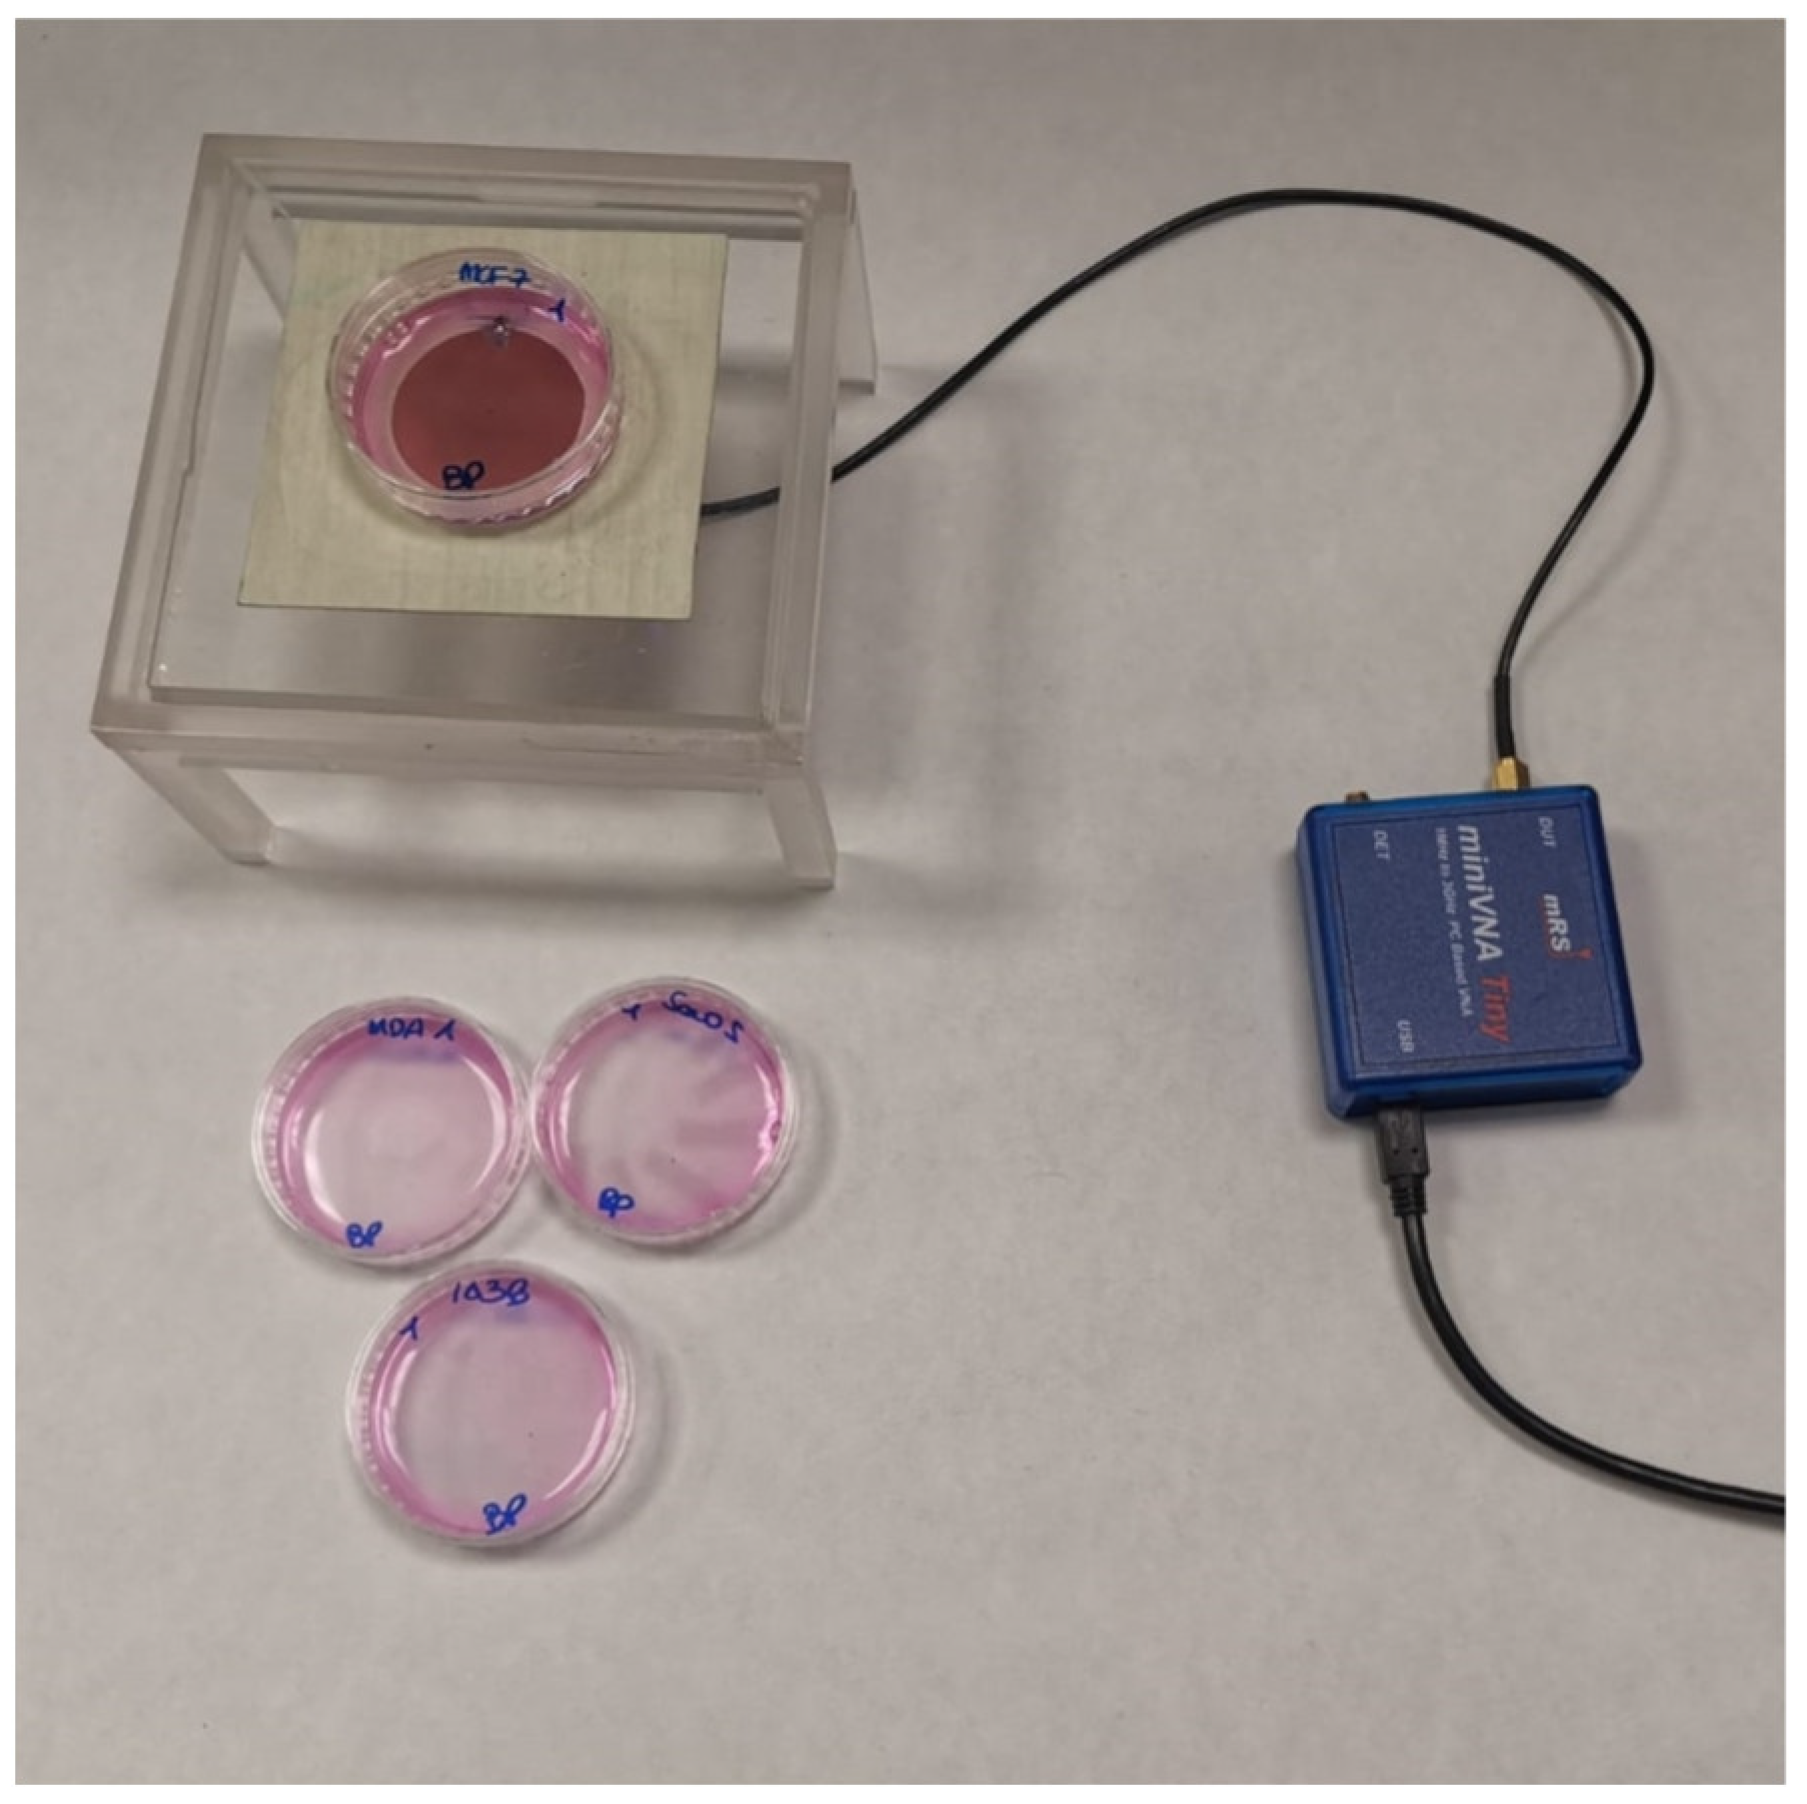
2.3. Experimental Procedure
2.4. Data Elaboration Process
2.5. Statistics
3. Results
4. Discussion
5. Conclusions
Author Contributions
Funding
Institutional Review Board Statement
Informed Consent Statement
Data Availability Statement
Conflicts of Interest
References
- Hoon, W.F.; Seok, Y.B.; Jack, S.P.; Seng, L.Y.; Keng, L.O. Dielectric Properties Measurement and PH Analysis for Drinking Water. In IOP Conference Series. Materials Science and Engineering; IOP Publishing: Bristol, UK, 2021; Volume 2339. [Google Scholar]
- D’Alvia, L.; Palermo, E.; Del Prete, Z.; Pittella, E.; Pisa, S.; Piuzzi, E. A Comparative Evaluation of Patch Resonators Layouts for Moisture Measurement in Historic Masonry Units. In Proceedings of the 2019 IMEKO TC4 International Conference on Metrology for Archaeology and Cultural Heritage, Florence, Italy, 4–6 December 2019. [Google Scholar]
- D’Alvia, L.; Piuzzi, E.; Cataldo, A.; Del Prete, Z. Permittivity-Based Water Content Calibration Measurement in Wood-Based Cultural Heritage: A Preliminary Study. Sensors 2022, 22, 2148. [Google Scholar] [CrossRef] [PubMed]
- Fallahi, H.; Sebek, J.; Prakash, P. Broadband Dielectric Properties of Ex Vivo Bovine Liver Tissue Characterized at Ablative Temperatures. IEEE Trans. Biomed. Eng. 2021, 68, 90–98. [Google Scholar] [CrossRef] [PubMed]
- Nelson, S.O. Measurement and Applications of Dielectric Properties of Agricultural Products. IEEE Trans. Instrum. Meas. 1992, 41, 116–122. [Google Scholar] [CrossRef]
- Grenier, K.; Dubuc, D.; Chen, T.; Artis, F.; Poupot, M.; Fournie, J.-J. Microwave Dielectric Spectroscopy: An Emerging Analyzing Technique for Biological Investigations at the Cellular Level. In Proceedings of the 2013 IEEE Topical Conference on Biomedical Wireless Technologies, Networks and Sensing Systems, Austin, TX, USA, 20–23 January 2013; IEEE: Piscataway, NJ, USA, 2013; pp. 40–42. [Google Scholar]
- Marinković, Z.; Gugliandolo, G.; Latino, M.; Campobello, G.; Crupi, G.; Donato, N. Characterization and Neural Modeling of a Microwave Gas Sensor for Oxygen Detection Aimed at Healthcare Applications. Sensors 2020, 20, 7150. [Google Scholar] [CrossRef]
- Mohd Shah, S.R.; Asan, N.B.; Velander, J.; Ebrahimizadeh, J.; Perez, M.D.; Mattsson, V.; Blokhuis, T.; Augustine, R. Analysis of Thickness Variation in Biological Tissues Using Microwave Sensors for Health Monitoring Applications. IEEE Access 2019, 7, 156033–156043. [Google Scholar] [CrossRef]
- Tlili, M.; Deshours, F.; Alquié, G.; Kokabi, H.; Hardinata, S.; Koskas, F. Microwave Resonant Sensor for Non-Invasive Characterization of Biological Tissues. IRBM 2018, 39, 445–450. [Google Scholar] [CrossRef]
- Deshours, F.; Alquié, G.; Kokabi, H.; Rachedi, K.; Tlili, M.; Hardinata, S.; Koskas, F. Improved Microwave Biosensor for Non-Invasive Dielectric Characterization of Biological Tissues. Microelectron. J. 2019, 88, 137–144. [Google Scholar] [CrossRef]
- Mattsson, V.; Ackermans, L.L.G.C.; Mandal, B.; Perez, M.D.; Vesseur, M.A.M.; Meaney, P.; Ten Bosch, J.A.; Blokhuis, T.J.; Augustine, R. MAS: Standalone Microwave Resonator to Assess Muscle Quality. Sensors 2021, 21, 5485. [Google Scholar] [CrossRef]
- Dei, D.; Grazzini, G.; Luzi, G.; Pieraccini, M.; Atzeni, C.; Boncinelli, S.; Camiciottoli, G.; Castellani, W.; Marsili, M.; Lo Dico, J. Non-Contact Detection of Breathing Using a Microwave Sensor. Sensors 2009, 9, 2574–2585. [Google Scholar] [CrossRef]
- Celik, N.; Gagarin, R.; Youn, H.; Iskander, M.F. A Noninvasive Microwave Sensor and Signal Processing Technique for Continuous Monitoring of Vital Signs. IEEE Antennas Wirel. Propag. Lett. 2011, 10, 286–289. [Google Scholar] [CrossRef]
- Li, Z.; Xue, Q.; Wang, Q.; Zhang, H.; Duan, X. Biomolecules Detection Using Microstrip Sensor with Highly-Ordered Nanowires Array. In Proceedings of the 2019 IEEE SENSORS, Montreal, QC, Canada, 27–30 October 2019; IEEE: Piscataway, NJ, USA, 2019; pp. 1–4. [Google Scholar]
- Wang, L. Microwave Sensors for Breast Cancer Detection. Sensors 2018, 18, 655. [Google Scholar] [CrossRef] [PubMed] [Green Version]
- Ngai, E.C.; Shavit, R. Versatile Low-Cost Microwave Helmet Brain Sensor for Monitoring Parkinson Disease. In Proceedings of the 2021 IEEE International Conference on Microwaves, Antennas, Communications and Electronic Systems (COMCAS), Tel Aviv, Israel, 1–3 November 2021; IEEE: Piscataway, NJ, USA, 2021; pp. 448–451. [Google Scholar]
- Mahmud, M.; Islam, M.; Misran, N.; Almutairi, A.; Cho, M. Ultra-Wideband (UWB) Antenna Sensor Based Microwave Breast Imaging: A Review. Sensors 2018, 18, 2951. [Google Scholar] [CrossRef] [PubMed] [Green Version]
- Chen, L.; Xie, W.; Luo, Y.; Ding, X.; Fu, B.; Gopinath, S.C.B.; Xiong, Y. Sensitive Silica-alumina Modified Capacitive Non-Faradaic Glucose Sensor for Gestational Diabetes. Biotechnol. Appl. Biochem. 2022, 69, 840–847. [Google Scholar] [CrossRef] [PubMed]
- Martellosio, A.; Pasian, M.; Bozzi, M.; Perregrini, L.; Mazzanti, A.; Svelto, F.; Summers, P.E.; Renne, G.; Bellomi, M. 0.5–50 GHz Dielectric Characterisation of Breast Cancer Tissues. Electron. Lett. 2015, 51, 974–975. [Google Scholar] [CrossRef]
- Mohammed, B.J.; Naqvi, S.A.R.; Manoufali, M.; Bialkowski, K.; Abbosh, A.M. Changes in Epidermal Dielectric Properties Due to Skin Cancer across the Band 1 to 50 GHz. In Proceedings of the 2018 Australian Microwave Symposium (AMS), Brisbane, Australia, 6–7 February 2018; IEEE: Piscataway, NJ, USA, 2018; pp. 77–78. [Google Scholar]
- Gavazzi, S.; Limone, P.; De Rosa, G.; Molinari, F.; Vecchi, G. Comparison of Microwave Dielectric Properties of Human Normal, Benign and Malignant Thyroid Tissues Obtained from Surgeries: A Preliminary Study. Biomed. Phys. Eng. Express 2018, 4, 047003. [Google Scholar] [CrossRef]
- Lazebnik, M.; Okoniewski, M.; Booske, J.H.; Hagness, S.C. Highly Accurate Debye Models for Normal and Malignant Breast Tissue Dielectric Properties at Microwave Frequencies. IEEE Microw. Wirel. Compon. Lett. 2007, 17, 822–824. [Google Scholar] [CrossRef]
- Baghban, R.; Roshangar, L.; Jahanban-Esfahlan, R.; Seidi, K.; Ebrahimi-Kalan, A.; Jaymand, M.; Kolahian, S.; Javaheri, T.; Zare, P. Tumor Microenvironment Complexity and Therapeutic Implications at a Glance. Cell Commun. Signal. 2020, 18, 59. [Google Scholar] [CrossRef] [Green Version]
- Martin, G.S. Cell Signaling and Cancer. Cancer Cell 2003, 4, 167–174. [Google Scholar] [CrossRef] [Green Version]
- He, H.; Shao, X.; Li, Y.; Gihu, R.; Xie, H.; Zhou, J.; Yan, H. Targeting Signaling Pathway Networks in Several Malignant Tumors: Progresses and Challenges. Front. Pharmacol. 2021, 12, 1373. [Google Scholar] [CrossRef]
- Jögi, A.; Vaapil, M.; Johansson, M.; Påhlman, S. Cancer Cell Differentiation Heterogeneity and Aggressive Behavior in Solid Tumors. Upsala J. Med. Sci. 2012, 117, 217–224. [Google Scholar] [CrossRef]
- Parekh, A.; Das, D.; Das, S.; Dhara, S.; Biswas, K.; Mandal, M.; Das, S. Bioimpedimetric Analysis in Conjunction with Growth Dynamics to Differentiate Aggressiveness of Cancer Cells. Sci. Rep. 2018, 8, 783. [Google Scholar] [CrossRef] [PubMed] [Green Version]
- Chaffer, C.L.; Weinberg, R.A. A Perspective on Cancer Cell Metastasis. Science 2011, 331, 1559–1564. [Google Scholar] [CrossRef] [PubMed]
- Sánchez-Calderón, D.; Pedraza, A.; Mancera Urrego, C.; Mejía-Mejía, A.; Montealegre-Páez, A.L.; Perdomo, S. Analysis of the Cost-Effectiveness of Liquid Biopsy to Determine Treatment Change in Patients with Her2-Positive Advanced Breast Cancer in Colombia. Clin. Outcomes Res. 2020, 12, 115–122. [Google Scholar] [CrossRef] [PubMed] [Green Version]
- Takeuchi, H.; Kitagawa, Y. Sentinel Lymph Node Biopsy in Gastric Cancer. Cancer J. 2015, 21, 21–24. [Google Scholar] [CrossRef]
- Tamra, A.; Dubuc, D.; Rols, M.-P.; Grenier, K. Microwave Monitoring of Single Cell Monocytes Subjected to Electroporation. IEEE Trans. Microw. Theory Tech. 2017, 65, 3512–3518. [Google Scholar] [CrossRef] [Green Version]
- Watts, C.; Hanham, S.M.; Armstrong, J.P.K.; Ahmad, M.M.; Stevens, M.M.; Klein, N. Microwave Dielectric Sensing of Free-Flowing, Single, Living Cells in Aqueous Suspension. IEEE J. Electromagn. RF Microw. Med. Biol. 2020, 4, 97–108. [Google Scholar] [CrossRef] [Green Version]
- Nikolic-Jaric, M.; Romanuik, S.F.; Ferrier, G.A.; Bridges, G.E.; Butler, M.; Sunley, K.; Thomson, D.J.; Freeman, M.R. Microwave Frequency Sensor for Detection of Biological Cells in Microfluidic Channels. Biomicrofluidics 2009, 3, 034103. [Google Scholar] [CrossRef] [Green Version]
- Carraro, S.; D’Alvia, L.; Cerminara, F.; Del Prete, Z.; Rizzuto, E. Design and Response Analysis of a Circular Patch Resonator for Adherent Cell Culture Detection. In Proceedings of the 2021 IEEE International Symposium on Medical Measurements and Applications (MeMeA), Lausanne, Switzerland, 23–25 June 2021; IEEE: Piscataway, NJ, USA, 2021; pp. 1–6. [Google Scholar]
- Kumar, G.; Ray, K.P. Broadband Microstrip Antenna Array, 1st ed.; Artech House Inc: Norwood, MA, USA, 2002; pp. 65–67. [Google Scholar]
- Odelstad, E.; Raman, S.; Rydberg, A.; Augustine, R. Experimental Procedure for Determination of the Dielectric Properties of Biological Samples in the 2–50 GHz Range. IEEE J. Transl. Eng. Health Med. 2014, 2, 4300108. [Google Scholar] [CrossRef]
- Sihvola, A.H.; Kong, J.A. Effective Permittivity of Dielectric Mixtures. IEEE Trans. Geosci. Remote Sens. 1988, 26, 420–429. [Google Scholar] [CrossRef]
- D’Alvia, L.; Pittella, E.; Rizzuto, E.; Piuzzi, E.; del Prete, Z. A Portable Low-Cost Reflectometric Setup for Moisture Measurement in Cultural Heritage Masonry Unit. Meas. J. Int. Meas. Confed. 2022, 189, 110438. [Google Scholar] [CrossRef]
- Longo, M.; Peruzzi, B.; Fortunati, D.; De Luca, V.; Denger, S.; Caselli, G.; Migliaccio, S.; Teti, A. Modulation of Human Estrogen Receptor Alpha F Promoter by a Protein Kinase C/c-Src-Dependent Mechanism in Osteoblast-like Cells. J. Mol. Endocrinol. 2006, 37, 489–502. [Google Scholar] [CrossRef] [PubMed] [Green Version]
- Ren, L.; Mendoza, A.; Zhu, J.; Briggs, J.W.; Halsey, C.; Hong, E.S.; Burkett, S.S.; Morrow, J.; Lizardo, M.M.; Osborne, T.; et al. Characterization of the Metastatic Phenotype of a Panel of Established Osteosarcoma Cells. Oncotarget 2015, 6, 29469–29481. [Google Scholar] [CrossRef] [PubMed] [Green Version]
- Comşa, Ş.; Cîmpean, A.M.; Raica, M. The Story of MCF-7 Breast Cancer Cell Line: 40 Years of Experience in Research. Anticancer. Res. 2015, 35, 3147–3154. [Google Scholar] [PubMed]
- Minn, A.J.; Kang, Y.; Serganova, I.; Gupta, G.P.; Giri, D.D.; Doubrovin, M.; Ponomarev, V.; Gerald, W.L.; Blasberg, R.; Massagué, J. Distinct Organ-Specific Metastatic Potential of Individual Breast Cancer Cells and Primary Tumors. J. Clin. Investig. 2005, 115, 44–55. [Google Scholar] [CrossRef] [PubMed] [Green Version]
- Petersan, P.J.; Anlage, S.M. Measurement of Resonant Frequency and Quality Factor of Microwave Resonators: Comparison of Methods. J. Appl. Phys. 1998, 84, 3392–3402. [Google Scholar] [CrossRef] [Green Version]
- Chen, L.F.; Ong, C.K.; Neo, C.P.; Varadan, V.V.; Varadan, V.K. Microwave Electronics: Measurement and Materials Characterization; John Wiley & Sons: Hoboken, NJ, USA, 2004. [Google Scholar]
- Gyüre, B.; Márkus, B.G.; Bernáth, B.; Murányi, F.; Simon, F. A Time Domain Based Method for the Accurate Measurement of Q-Factor and Resonance Frequency of Microwave Resonators. Rev. Sci. Instrum. 2015, 86, 094702. [Google Scholar] [CrossRef] [Green Version]
- Gyüre-Garami, B.; Sági, O.; Márkus, B.G.; Simon, F. A Highly Accurate Measurement of Resonator Q-Factor and Resonance Frequency. Rev. Sci. Instrum. 2018, 89, 113903. [Google Scholar] [CrossRef] [Green Version]
- Suresh, S. Biomechanics and Biophysics of Cancer Cells. Acta Mater. 2007, 55, 3989–4014. [Google Scholar] [CrossRef] [Green Version]
- Nyfors, E. Industrial Microwave Sensors—A Review. Subsurf. Sens. Technol. Appl. 2000, 1, 23–43. [Google Scholar] [CrossRef]
- Costanzo, S. Non-Invasive Microwave Sensors for Biomedical Applications: New Design Perspectives. Radioengineering 2017, 26, 406–410. [Google Scholar] [CrossRef]
- Macit, Z.; Aydinalp, C.; Yilmaz, T.; Sert, A.B.O.; Kok, F.N. Broadband Microwave Dielectric Property Comparison of Human Fetal Osteoblastic (HFOB) and Osteosarcoma (SaOS-2) Cell Lines. In Proceedings of the 2020 14th European Conference on Antennas and Propagation (EuCAP), Copenhagen, Denmark, 15–20 March 2020; IEEE: Piscataway, NJ, USA, 2020; pp. 1–4. [Google Scholar]
- Zhang, L.Y.; Bounaix Morand Du Puch, C.; Dalmay, C.; Lacroix, A.; Landoulsi, A.; Leroy, J.; Mélin, C.; Lalloué, F.; Battu, S.; Lautrette, C.; et al. Discrimination of Colorectal Cancer Cell Lines Using Microwave Biosensors. Sens. Actuators A Phys. 2014, 216, 405–416. [Google Scholar] [CrossRef]
- Johnston, L.; Wang, G.; Hu, K.; Qian, C.; Liu, G. Advances in Biosensors for Continuous Glucose Monitoring Towards Wearables. Front. Bioeng. Biotechnol. 2021, 9, 733810. [Google Scholar] [CrossRef] [PubMed]
- Lala, A.; Barghash, M.H.; Giustino, G.; Alvarez-Garcia, J.; Konje, S.; Parikh, A.; Ullman, J.; Keith, B.; Donehey, J.; Mitter, S.S.; et al. Early Use of Remote Dielectric Sensing after Hospitalization to Reduce Heart Failure Readmissions. ESC Heart Fail. 2021, 8, 1047–1054. [Google Scholar] [CrossRef] [PubMed]
- Amir, O.; Azzam, Z.S.; Gaspar, T.; Faranesh-Abboud, S.; Andria, N.; Burkhoff, D.; Abbo, A.; Abraham, W.T. Validation of Remote Dielectric Sensing (ReDSTM) Technology for Quantification of Lung Fluid Status: Comparison to High Resolution Chest Computed Tomography in Patients with and without Acute Heart Failure. Int. J. Cardiol. 2016, 221, 841–846. [Google Scholar] [CrossRef] [Green Version]
- Bohunicky, B.; Mousa, S.A. Biosensors: The New Wave in Cancer Diagnosis. Nanotechnol. Sci. Appl. 2010, 4, 1–10. [Google Scholar] [CrossRef] [PubMed] [Green Version]
- Tothill, I.E. Biosensors for Cancer Markers Diagnosis. Semin. Cell Dev. Biol. 2009, 20, 55–62. [Google Scholar] [CrossRef] [PubMed]
- Raimondi, L.; De Luca, A.; Costa, V.; Amodio, N.; Carina, V.; Bellavia, D.; Tassone, P.; Pagani, S.; Fini, M.; Alessandro, R.; et al. Circulating Biomarkers in Osteosarcoma: New Translational Tools for Diagnosis and Treatment. Oncotarget 2017, 8, 100831–100851. [Google Scholar] [CrossRef] [Green Version]


| Mean ± SD | Frequency (fr) [MHz] | Return Loss (min|S11 (f)|) [dB] | FWHM [MHz] | Fitting Error |
|---|---|---|---|---|
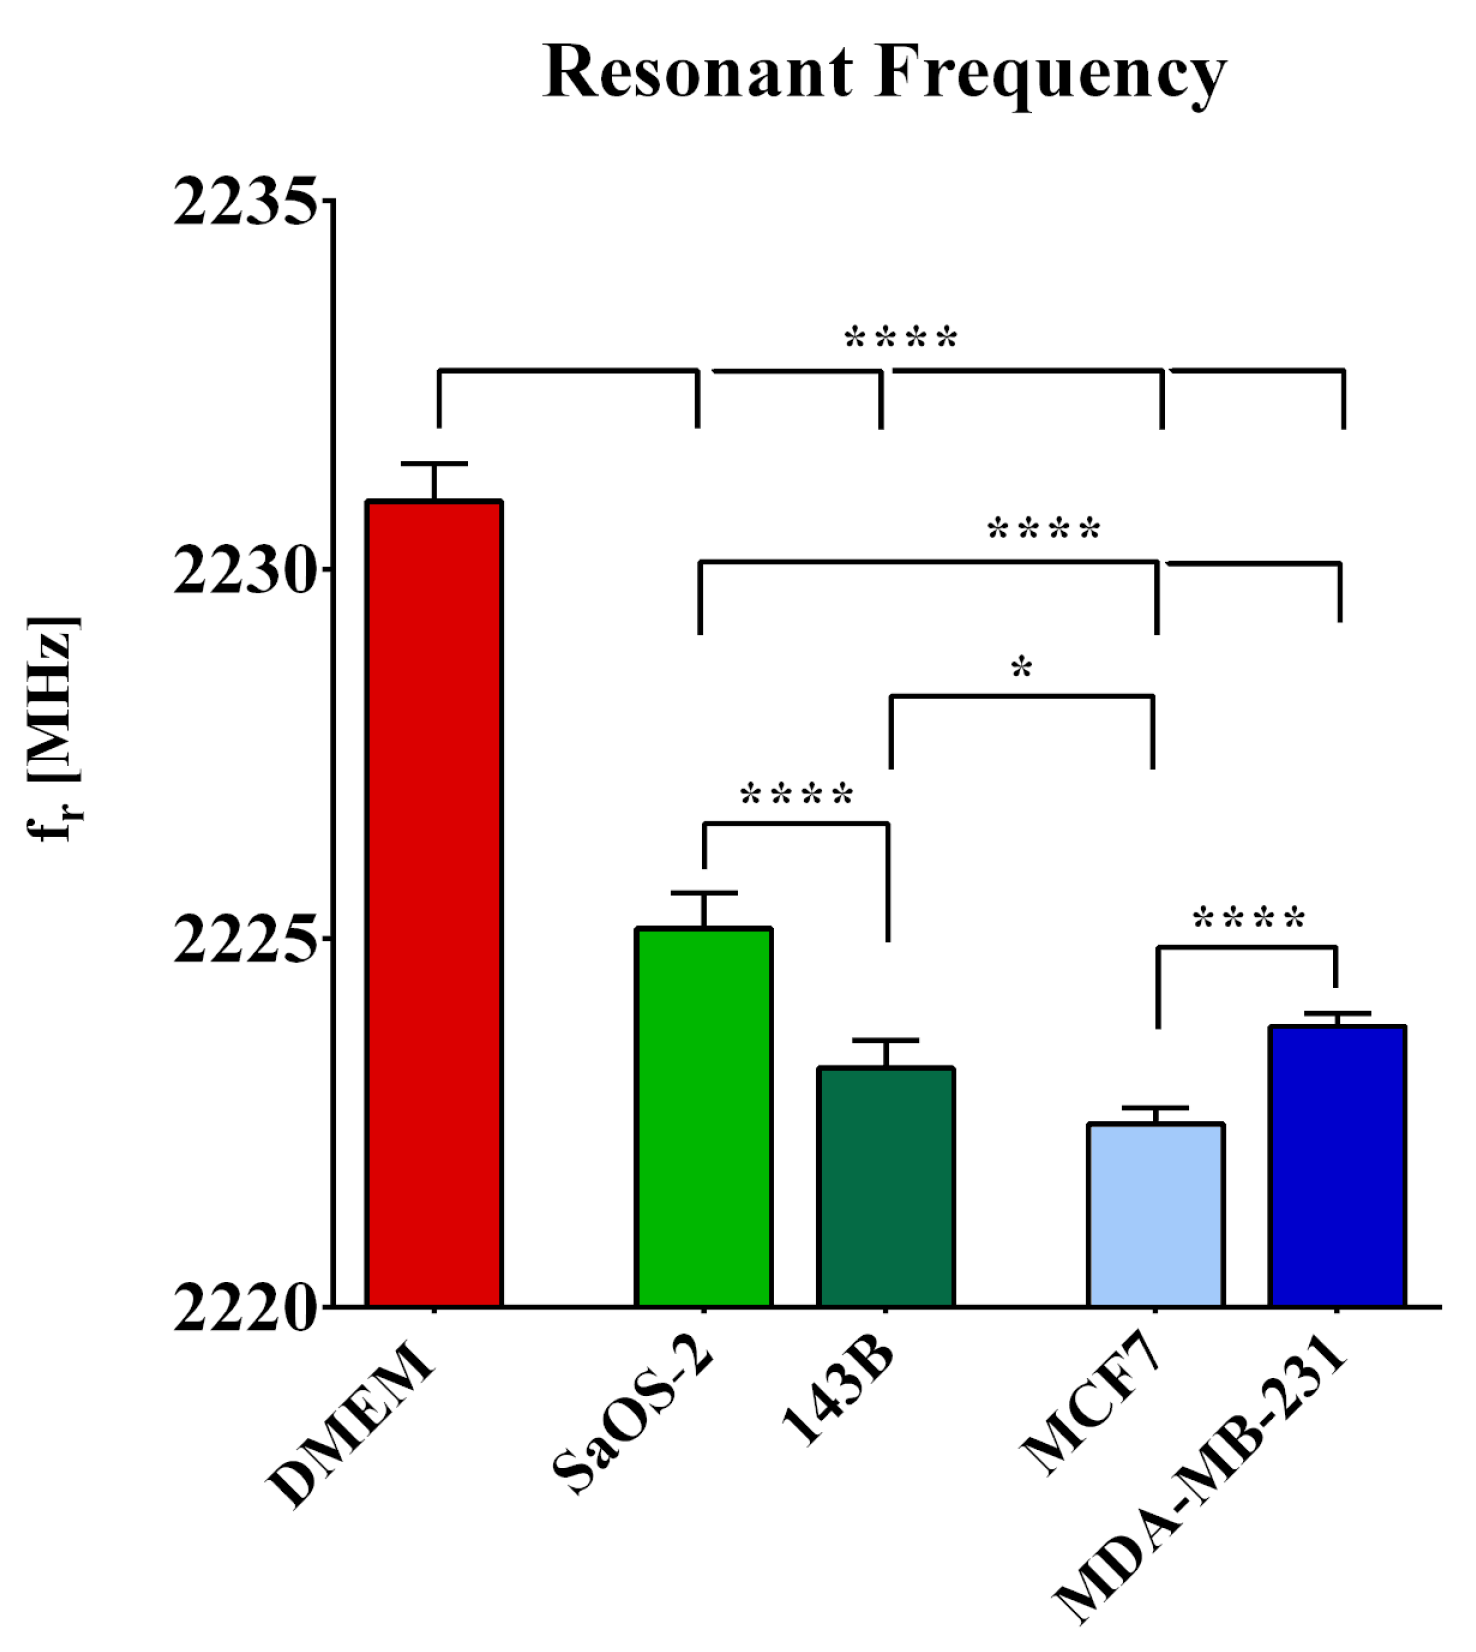
| DMEM | 2230.92 ± 0.51 | −13.87 ± 0.46 | 43.59 ± 2.87 | 303.01 ± 39.99 |
| SaOS-2 | 2225.14 ± 0.48 | −13.97 ± 0.84 | 45.11 ± 4.38 | 283.74 ± 64.02 |
| 143B | 2223.24 ± 0.38 | −14.29 ± 1.07 | 44.14 ± 4.12 | 271.96 ± 70.30 |
| MCF7 | 2222.48 ± 0.22 | −13.41 ± 0.45 | 46.89 ± 1.64 | 297.81 ± 35.06 |
| MDA-MB-231 | 2223.81 ± 0.17 | −13.37 ± 0.57 | 47.17 ± 1.67 | 271.42 ± 36.40 |
| Factors | Statistic | df | F | Prob > F |
|---|---|---|---|---|
| Cell line | 0.0120 | 4 | 29.59 | <0.0001 |
| Days | 0.4096 | 2 | 5.81 | <0.0001 |
| Resonant Frequency (fr) | Return Loss min|S11 (f)| | FWHM | ||||||||||
|---|---|---|---|---|---|---|---|---|---|---|---|---|
| Coeff. | SE | t | p > |t| | Coeff. | SE | t | p > |t| | Coeff. | SE | t | p > |t| | |
| Cell line | ||||||||||||
| SaOS-2 | –5.792 | 0.198 | –29.190 | <0.001 | 0.035 | 0.316 | 0.110 | 0.913 | 2.109 | 1.112 | –0.154 | 0.067 |
| 143B | –7.611 | 0.196 | –38.870 | <0.001 | –0.437 | 0.312 | –1.400 | 0.171 | 0.264 | 1.098 | –1.969 | 0.811 |
| MCF-7 | –8.461 | 0.210 | –40.370 | <0.001 | 0.054 | 0.334 | 0.160 | 0.874 | 0.091 | 1.175 | –1.480 | 0.444 |
| MDA-MB-231 | –7.126 | 0.206 | –34.580 | <0.001 | 0.095 | 0.329 | 0.290 | 0.774 | 1.198 | 1.155 | –1.152 | 0.307 |
| Days | ||||||||||||
| D2 | 0.066 | 0.226 | 0.29 | 0.770 | 1.345 | 0.360 | 3.73 | 0.001 | 7.372 | 1.266 | 5.82 | <0.001 |
| D3 | –0.008 | 0.168 | –0.05 | 0.963 | 0.870 | 0.268 | 3.24 | 0.003 | 5.840 | 0.0943 | 6.19 | <0.001 |
Publisher’s Note: MDPI stays neutral with regard to jurisdictional claims in published maps and institutional affiliations. |
© 2022 by the authors. Licensee MDPI, Basel, Switzerland. This article is an open access article distributed under the terms and conditions of the Creative Commons Attribution (CC BY) license (https://creativecommons.org/licenses/by/4.0/).
Share and Cite
D’Alvia, L.; Carraro, S.; Peruzzi, B.; Urciuoli, E.; Palla, L.; Del Prete, Z.; Rizzuto, E. A Novel Microwave Resonant Sensor for Measuring Cancer Cell Line Aggressiveness. Sensors 2022, 22, 4383. https://0-doi-org.brum.beds.ac.uk/10.3390/s22124383
D’Alvia L, Carraro S, Peruzzi B, Urciuoli E, Palla L, Del Prete Z, Rizzuto E. A Novel Microwave Resonant Sensor for Measuring Cancer Cell Line Aggressiveness. Sensors. 2022; 22(12):4383. https://0-doi-org.brum.beds.ac.uk/10.3390/s22124383
Chicago/Turabian StyleD’Alvia, Livio, Serena Carraro, Barbara Peruzzi, Enrica Urciuoli, Luigi Palla, Zaccaria Del Prete, and Emanuele Rizzuto. 2022. "A Novel Microwave Resonant Sensor for Measuring Cancer Cell Line Aggressiveness" Sensors 22, no. 12: 4383. https://0-doi-org.brum.beds.ac.uk/10.3390/s22124383