
Nonlinear Dynamic Measures of Walking in Healthy Older Adults: A Systematic Scoping Review


1
Sport and Health Sciences Department, College of Life and Environmental Sciences, St Luke’s Campus, University of Exeter, Exeter EX1 2LU, UK
2
College of Medicine and Health, St Luke’s Campus, University of Exeter, Exeter EX1 2LU, UK
3
Physical Education and Sports Science Department, National Institute of Education, Nanyang Technological University, Singapore 637616, Singapore
*
Author to whom correspondence should be addressed.
Sensors 2022, 22(12), 4408; https://0-doi-org.brum.beds.ac.uk/10.3390/s22124408
Submission received: 19 April 2022
/
Revised: 1 June 2022
/
Accepted: 7 June 2022
/
Published: 10 June 2022
(This article belongs to the Special Issue Sensor Technologies for Gait Analysis)
Abstract
:Background: Maintaining a healthy gait into old age is key to preserving the quality of life and reducing the risk of falling. Nonlinear dynamic analyses (NDAs) are a promising method of identifying characteristics of people who are at risk of falling based on their movement patterns. However, there is a range of NDA measures reported in the literature. The aim of this review was to summarise the variety, characteristics and range of the nonlinear dynamic measurements used to distinguish the gait kinematics of healthy older adults and older adults at risk of falling. Methods: Medline Ovid and Web of Science databases were searched. Forty-six papers were included for full-text review. Data extracted included participant and study design characteristics, fall risk assessment tools, analytical protocols and key results. Results: Among all nonlinear dynamic measures, Lyapunov Exponent (LyE) was most common, followed by entropy and then Fouquet Multipliers (FMs) measures. LyE and Multiscale Entropy (MSE) measures distinguished between older and younger adults and fall-prone versus non-fall-prone older adults. FMs were a less sensitive measure for studying changes in older adults’ gait. Methodology and data analysis procedures for estimating nonlinear dynamic measures differed greatly between studies and are a potential source of variability in cross-study comparisons and in generating reference values. Conclusion: Future studies should develop a standard procedure to apply and estimate LyE and entropy to quantify gait characteristics. This will enable the development of reference values in estimating the risk of falling.
1. Introduction
Maintaining a healthy gait into old age is key to preserving the quality of life and reducing the risk of falling. An estimated 28–35% of people older than 65 fall annually [1]. Fractures and serious injuries occur in about one-quarter of falls [1,2]. Age is an independent risk factor for falling, and hence, all older people are at risk of falls. There are four main categories that confer a higher risk of falling: environmental, behavioural, socioeconomic and biological factors [1,3,4]. Biological factors of gait and balance are the most common and important risk factors since they underpin the risks posed by other factors [5]. The chance and extent of gait instability leading to falls also increase with age [6,7,8,9].
There are more than 12 clinical fall risk assessment tools for older people, among which the Berg Balance Scale [10], Functional Reach Test [11], and Timed ‘Up & Go’ test [11], physical and fall self-confidence assessment methods are commonly used for fall prediction. Although clinical assessment could provide useful motor outcomes to detect the early signs of balance alteration and then provide key information about fall risk, they may not be sufficient to predict falls in older populations. For a better understanding of gait instability in older adults and their risk of falling, several biomechanical methods have been developed (for a review, see [12]), with the nonlinear dynamic analysis gaining increasing interest in recent years.
Biomechanical laboratory-based studies have identified characteristics associated with ageing gait and increased fall risk which provide the field with the tools to understand changes in gait characteristics. For example, lower leg strength, gait symmetry proprioception and increasing variability in step width, step length, stride length, step time, stance time, stride velocity and single support are associated with fall risk [12,13,14].
While variability measures feature in traditional linear tools, it is assumed that variability between strides associated with fall risk is random and independent of past and future strides [15]. In contrast, the nonlinear dynamic analysis showed that variations in the time series of specific gait parameters are not random but demonstrate a deterministic behaviour. This behaviour may be partially sensitive to physiological ageing [15,16,17]. Nonlinear dynamic analysis methods provide an opportunity to study the inner structure, regularity, complexity and stability of variables describing gait and have presented strong evidence of being associated with the risk of falling [9,12,17,18,19]. However, there is a range of nonlinear dynamic measures that can be used and a range of ways of calculating each of these measures [12,18].
A question remains as to which nonlinear dynamics techniques are most sensitive and robust in indicating fall risk. While previous systematic reviews in the area have focused on one or a few nonlinear techniques, such as Lyapunov Exponent (LyE) and Floquet Multipliers (FMs) (Bruijn, Meijer [12] and Hamacher, Singh [17]), FMs Riva, Bisi [19] LyE (Mehdizadeh [18]) and entropy (Yentes and Raffalt [20]), there has been no comprehensive review of all nonlinear methods used in studying instability in the gait of older adults.
Therefore, the aim of this review was to summarise research on instability in healthy older adults with and with our history of falling in terms of the (1) nonlinear dynamic measures used, the variety of their calculations and values and (2) methodological issues including age range, walking modality, kinematic variables and clinical risk of falling assessment used. The current study was intended to help future researchers consider the most powerful nonlinear dynamics measures for identifying fall risk and associated experimental designs and calculation methods. Secondly, to capture the current range of values reported for different nonlinear dynamic measures associated with gait and risk of falling in healthy elderly.
2. Methods
2.1. Search Strategy
An electronic search was performed by one reviewer (AA) in February 2022 to identify papers that quantified nonlinear dynamic characteristics of walking in healthy older adults. The databases searched were Medline Ovid and Web of Science. Reference lists of articles included were checked to make sure that all related papers were considered. The following search terms were used, and both original research and short communications were included:
- gait.ti,ab.;
- walk*. ti, ab.;
- exp Gait Analysis/ or Gait/;
- 1 or 2 or 3;
- (dynam* adj2 stabil*). ti, ab.;
- Lyapunov.ti, ab.;
- (nonlinear adj2 dynamic*).ti, ab.;
- 5 or 6 or 7;
- old*.ti,ab.;
- elder*.ti, ab.;
- 9 or 10;
- 4 and 8 and 11.
2.2. Inclusion and Exclusion Criteria
Two reviewers (AA and GW) assessed the titles and abstracts of the articles. The inclusion criteria were studies of (1) nonlinear dynamic measures of gait or during continuous human walking; (2) English language papers (3) falling or ageing in healthy individuals. The exclusion criteria were studies of (1) humanoid robots; (2) specific diseases or pathology; (3) movements other than walking; (4) conference papers; (5) modelling or simulation studies; (6) animal studies; (7) review or perspective papers. All the papers were quality-assessed using the PRISMA guideline [21]. Figure 1 presents the research flow diagram.
2.3. Data Extraction
A customised spreadsheet was used to extract data from the papers associated with the following themes: the population of healthy younger adults and healthy older adults (YO comparison) and older fallers or non-fallers (F-NF); walking modality on the treadmill (TM) or overground (OG); data collection modality divided into four categories: Inertial sensors or accelerometers, goniometers, force plate, and motion capture using passive marker-based and video systems; methods of performing fall risk assessment; nonlinear dynamic analysis employed and methods of calculation used.
2.4. Data Visualisation
Reported LyE values were classified based on younger, older, walking conditions (TM walking or OG walking), LyE estimation algorithms (Rosenstein, Wolf, Kantz and Ihlen [22,23,24,25]), data type (velocity, acceleration and joint angle) and direction (anterior-posterior (AP), vertical (VT) and medio-lateral (ML)) to facilitate comparison across studies. In order to visualise the comparison of reported LyE values across studies and their estimated central tendency, boxplots were used. The mean and standard deviation of values for studies were illustrated as point plots and error bars. The points were displayed by a colour to differentiate between different LyE estimation methods and walking conditions. When data were presented only in graphical form in a study, values were extracted by digitising the graphs using PlotDigitizer software (version 4.3., https://apps.automeris.io/wpd/, last accessed date: 22 March 2022). Where multiple gait speeds were reported in a study, the data relating to the speed closest to the preferred walking speed was selected.
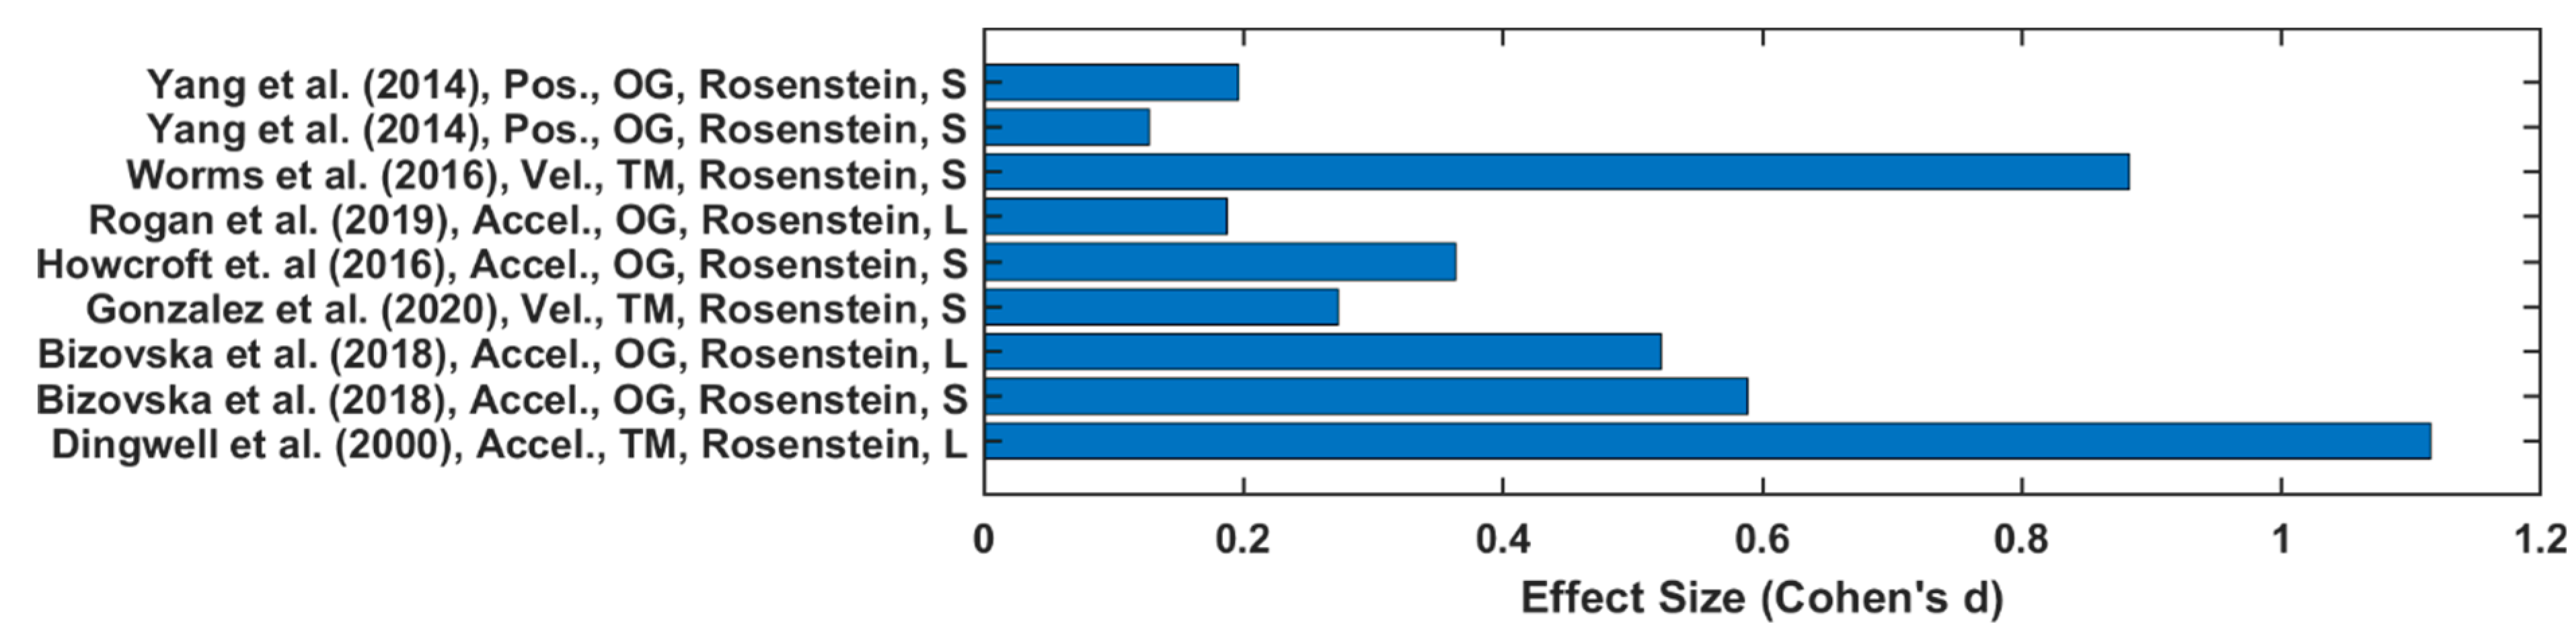
2.5. Effect Sizes
Cohen’s d was used to quantify the standardised effect sizes in nonlinear dynamic measures between younger adults and older adults (YO) and fall-prone older adults and non-faller older adults (F-NF) groups. Cohen’s d was evaluated using Equations the following equations [26]:
where M1 is the mean of the one group of study (i.e., younger); M2 is the mean of the other group of study (i.e., older); SD1 is the standard deviation of the younger group; SD2 is the standard deviation of the older group. Cohen categorised effect sizes, d, into categories, with d < 0.2 as small, 0.2 < d < 0.8 as medium and values greater than 0.8 as large [26].
3. Results
The search yielded a total of 1040 articles (Figure 1). After screening, 46 articles were considered eligible for inclusion in this review. Eighteen studies considered research questions focused on the faller–non-faller (F-NF) comparison [27,28,29,30,31,32,33,34,35,36,37,38,39]. Fifteen studies investigated the young–old (YO) comparison [3,6,7,9,38,40,41,42,43,44,45,46,47,48,49]. Six studies conducted F-NF and YO comparisons [33,50,51,52,53,54]. Nine papers studied older adults only [30,31,55,56,57,58,59,60,61]. Three studies compared LyE values for the same population in different conditions (OG or TM walking) [6,29,59] or different LyE estimation methods [29].
3.1. Study Design Characteristics
3.1.1. Population
Thirty papers reported the gender of participant groups. Terrier and Reynard [43] and Reynard and Terrier [54] had an equal number of both male and female participants, while Bizovska, Svoboda [9] and Kyvelidou, Kurz [47] included only female participants (Table 1). Generally, in most of the studies, female participants were more prevalent than male [3,7,9,31,34,35,36,38,39,42,45,51,52,53,56,59,61]. The average age range for older participants were 70.6 ± 6 (65–76.2) years old (Figure 2) and 25 ± 5 (20–30) years old for younger participants [3,6,7,27,28,29,31,33,40,41,42,43,48,52,53,54,55,56,57,58,62].
3.1.2. Sample Size
3.1.3. Fall Risk Assessment Tools
The eligibility criteria used to define both healthy and fall-prone older people varied substantially across studies. Fall risk was assessed in a variety of ways, including the history of falling and clinical fall risk assessments/questionnaires (Table 2). Faller definitions in studies were classified into six categories: at least one fall history in 3 months prior to the measurement [28], at least one fall within 6 months [32,33,34], more than two fall incidents within six months prior to the study but were uninjured at the time of the experiment [50], at least one fall history within the last 12 months [7,32,33,40] and at least two falls during the previous year [31,38,42]. Additionally, there were two studies with no falls in the past 12 months [42,55]. Nine studies did not provide a coherent definition of fallers [6,7,41,42,43,56,57,63,64].
Fall risk questionnaires included: anamnestic questionnaire focusing on participants’ physical condition [28], fall history questionnaire [3,28,29,30,31,33,38,40,42,50], self-reported ability to walk one mile at any pace with minimum rest, the Survey of Activities and Fear of Falling in the Elderly (SAFE) [3,63], the Movement Specific Reinvestment Scale (MSRS) [38], the Falls Efficacy Scale International (FES-I) [38], depression (CES-D) [3], the Longitudinal Aging Study Amsterdam Physical Activity Questionnaire (LAPAQ) [30] and mini mental state examination score (MMSE) [37,38,56,57,58,65].
Objective clinical balance assessments were mostly used within inclusion and exclusion criteria and included the Tinetti Balance Assessment Tool (TBAT) [28,32], single leg stance test, Timed Up and Go, 10 m Walk Test, Figure 8 Walk, Four Square Step [63], physical activity (Freiburger Fragebogen zur körperlichen Aktivität), proprioception (joint position sense), peripheral sensation (mechanical and vibration detection threshold), balance performance (static balance on force plate) and muscular fitness (instrumented sit-to-stand test), test of cognition performance (Stroop test), health status (SF12) and pain status (painDETECT, SES) [3] (Table 2).
3.1.4. Treadmill (TM) versus Overground (OG) for Estimating Non-Linear Dynamics
In 24 studies, participants walked on a TM [3,7,17,30,31,33,38,40,41,42,43,44,45,46,47,48,50,51,52,53,54,55,58,60,61,66], while 13 studies examined OG walking [6,9,29,32,34,35,36,37,39,49,56,57,59,63]. OG and TM walking were compared in three studies, where LyE values were higher for OG compared to TM walking using both Rosenstein’s and Wolf’s methods (Figure 3) [6,29,59].
3.2. Data Collection Modality and Kinematic Variables Analysed
Data collection modalities were divided into four categories: Inertial sensors or accelerometers; goniometers; force plates; and motion capture using passive marker-based systems (Vicon, Qualisys) and video. In 25 out of 44 studies, inertial sensors or accelerometers were used. In these studies, the sensor was placed on: the lower back, at L5 level [3,38,50,61]; on the lower back, at L5 level and on both shanks, approximately 15 cm above the malleolus [28,32]; on the dominant forefoot and upper thoracic spine [3]; near the right anterior superior iliac spine (ASIS) [33]; to the back, just below the shoulder [29,32,33,57]; with an elastic belt around the waist and set along the lumbar spine [31,37,56,58,59]; at sacrum with an elastic band [58]; over the posterior surface of the lumbar spine at approximately the level of L5 and on the lateral surface of the distal shank, superior to the ankle joint [51], forefeet and trunk [45], the posterior head with a band, posterior pelvis with a belt, and lateral shank, just above the ankle, with a band [34]; right ankle [52]; and at the fourth spinal process of the lumbar spine [37].
From these inertial sensor studies, variation in the derived variables used to make the nonlinear dynamic calculations existed. Nine different categories of data were analysed from inertial sensors across these studies:
Trunk acceleration in ML [58];
AP accelerometer signal close to the hip [33];
AP ankle acceleration [52];
VT and ML trunk acceleration [37].
Goniometers were used in a single study [27] and placed to measure sagittal plane movements of knee, ankle and hip joints.
Fifteen studies used motion capture with passive marker based systems [38,39,40,41,42,44,46,49,50,53,60,61,63] or video [7,47]. Studies analysed different variables included: T10 3D velocity [63]; 3D position and velocity of the centre of mass including the centre of pressure (by using pressure plate) [50]; 3D linear and angular velocities of trunk, pelvis, thigh, shank and foot segments [41]; VT acceleration, AP and ML trunk velocities [42]; VT displacement of hip, knee, ankle and relative knee angles [7]; 3D angular position of hip and ankle [44]; 3D linear and angular velocity and acceleration of trunk [60]; ML angular velocity of the thigh, shank and foot [47]; 3D C7 vertebrae marker velocity time series [53]; AP ankle, knee and hip angle [49]; ML trunk velocity and 3D trunk kinematic [61]; Centre of mass velocity signal [38]; ML, VT and AP trunk positions and 3D rotational movement of the trunk [39].
3.3. Nonlinear Dynamic Analysis
Studies that performed an assessment of fallers versus non-fallers reported seven methods of nonlinear dynamic analysis which are Maximum Lyapunov (LyE, short term Lyapunov and long term LyE), Floquet multipliers (FMs), recurrence quantification analysis (RQA), correlation dimension (CD) [7], multiscale entropy (MSE) [3,6,32,34], sample entropy (SEn) [42] and Shannon entropy (ShE) [32]. Among all the studies, LyE has been mostly used [1,2,4,7,9,17,26,28,37,38,40,42,43,45,46,47,48,49,51,52,55,56,57,60,61,62,64,65,66,67].
Twenty-one studies used Rosenstein’s method [3,6,9,27,28,31,33,34,37,38,39,40,41,42,43,46,49,50,52,53,54,55,60,61,63]. One study used Kant’s method [48]. Two studies used Rosenstein’s and Kantz’s methods together [40,44]. One study used Rosenstein, Kant and Ihlen methods [29]. In three studies Wolf’s method was used [4,38,58]. In one study, Rosenstein’s and Wolf’s methods were used [57]. Rispens, Van Dieën [57] showed different values of LyE estimation using Rosenstein’s method and Wolf’s method (Figure 3). In some studies, short term LyE was estimated [3,7,36,40,57,65] or both short and long terms were estimated [6,30,33,41,43,55,56,62]. Finally, max LyE or finite time LyE were estimated [7,27,33,37,42,43,47,48,52,56,57,58,61].
3.4. Nonlinear Dynamic Variable Values
All studies reported lower local dynamic stability in older adults than younger adults, where greater sensitivity to local perturbations could be found in larger LyE values [3,6,7,9,12,27,28,29,31,33,34,37,38,39,40,41,42,43,47,48,52,53,54,55,56,57,59,60,61,63]; thus, they concluded that dynamic stability is lower in older people than younger adults. There are no references for acceptable ranges of LyE due to the different methods of calculation used. In all the studies, the lowest value of LyE meant more dynamic stability. In most studies reported, LyE values were positive. However, in Ihlen, Sletvold [40], negative and positive values were reported.
Twenty-one out of forty-five studies reported LyE value of trunk acceleration or velocity [3,9,27,28,29,30,31,33,37,38,41,42,43,47,53,54,55,56,57,59,60,61,63]. In papers reporting a YO comparison, the estimation of LyE values calculated from acceleration data produced higher effect size values on average (0.61 ± 0.39) than velocity (0.46 ± 0.4), as depicted in Figure 4. Additionally, the OG walking effect size (0.59 ± 0.4) is higher than TM walking (0.56 ± 0.39). However, in F-NF studies, LyE calculated from velocity data has been shown to produce a higher effect size value (0.58 ± 0.43) than from acceleration data (0.55 ± 0.35), as shown in Figure 5. TM walking effect size (0.76 ± 0.43) is higher than OG walking (0.37 ± 0.19).
Generally, AP and ML directions were used for LyE estimation in these studies (Figure 6, Figure 7, Figure 8 and Figure 9) [27,28,29,30,42,43,56,57,61,63]. In one study, only AP direction was used [33]. In some studies, all three directions were used [9,28,29,42,43,56,57,59,63].
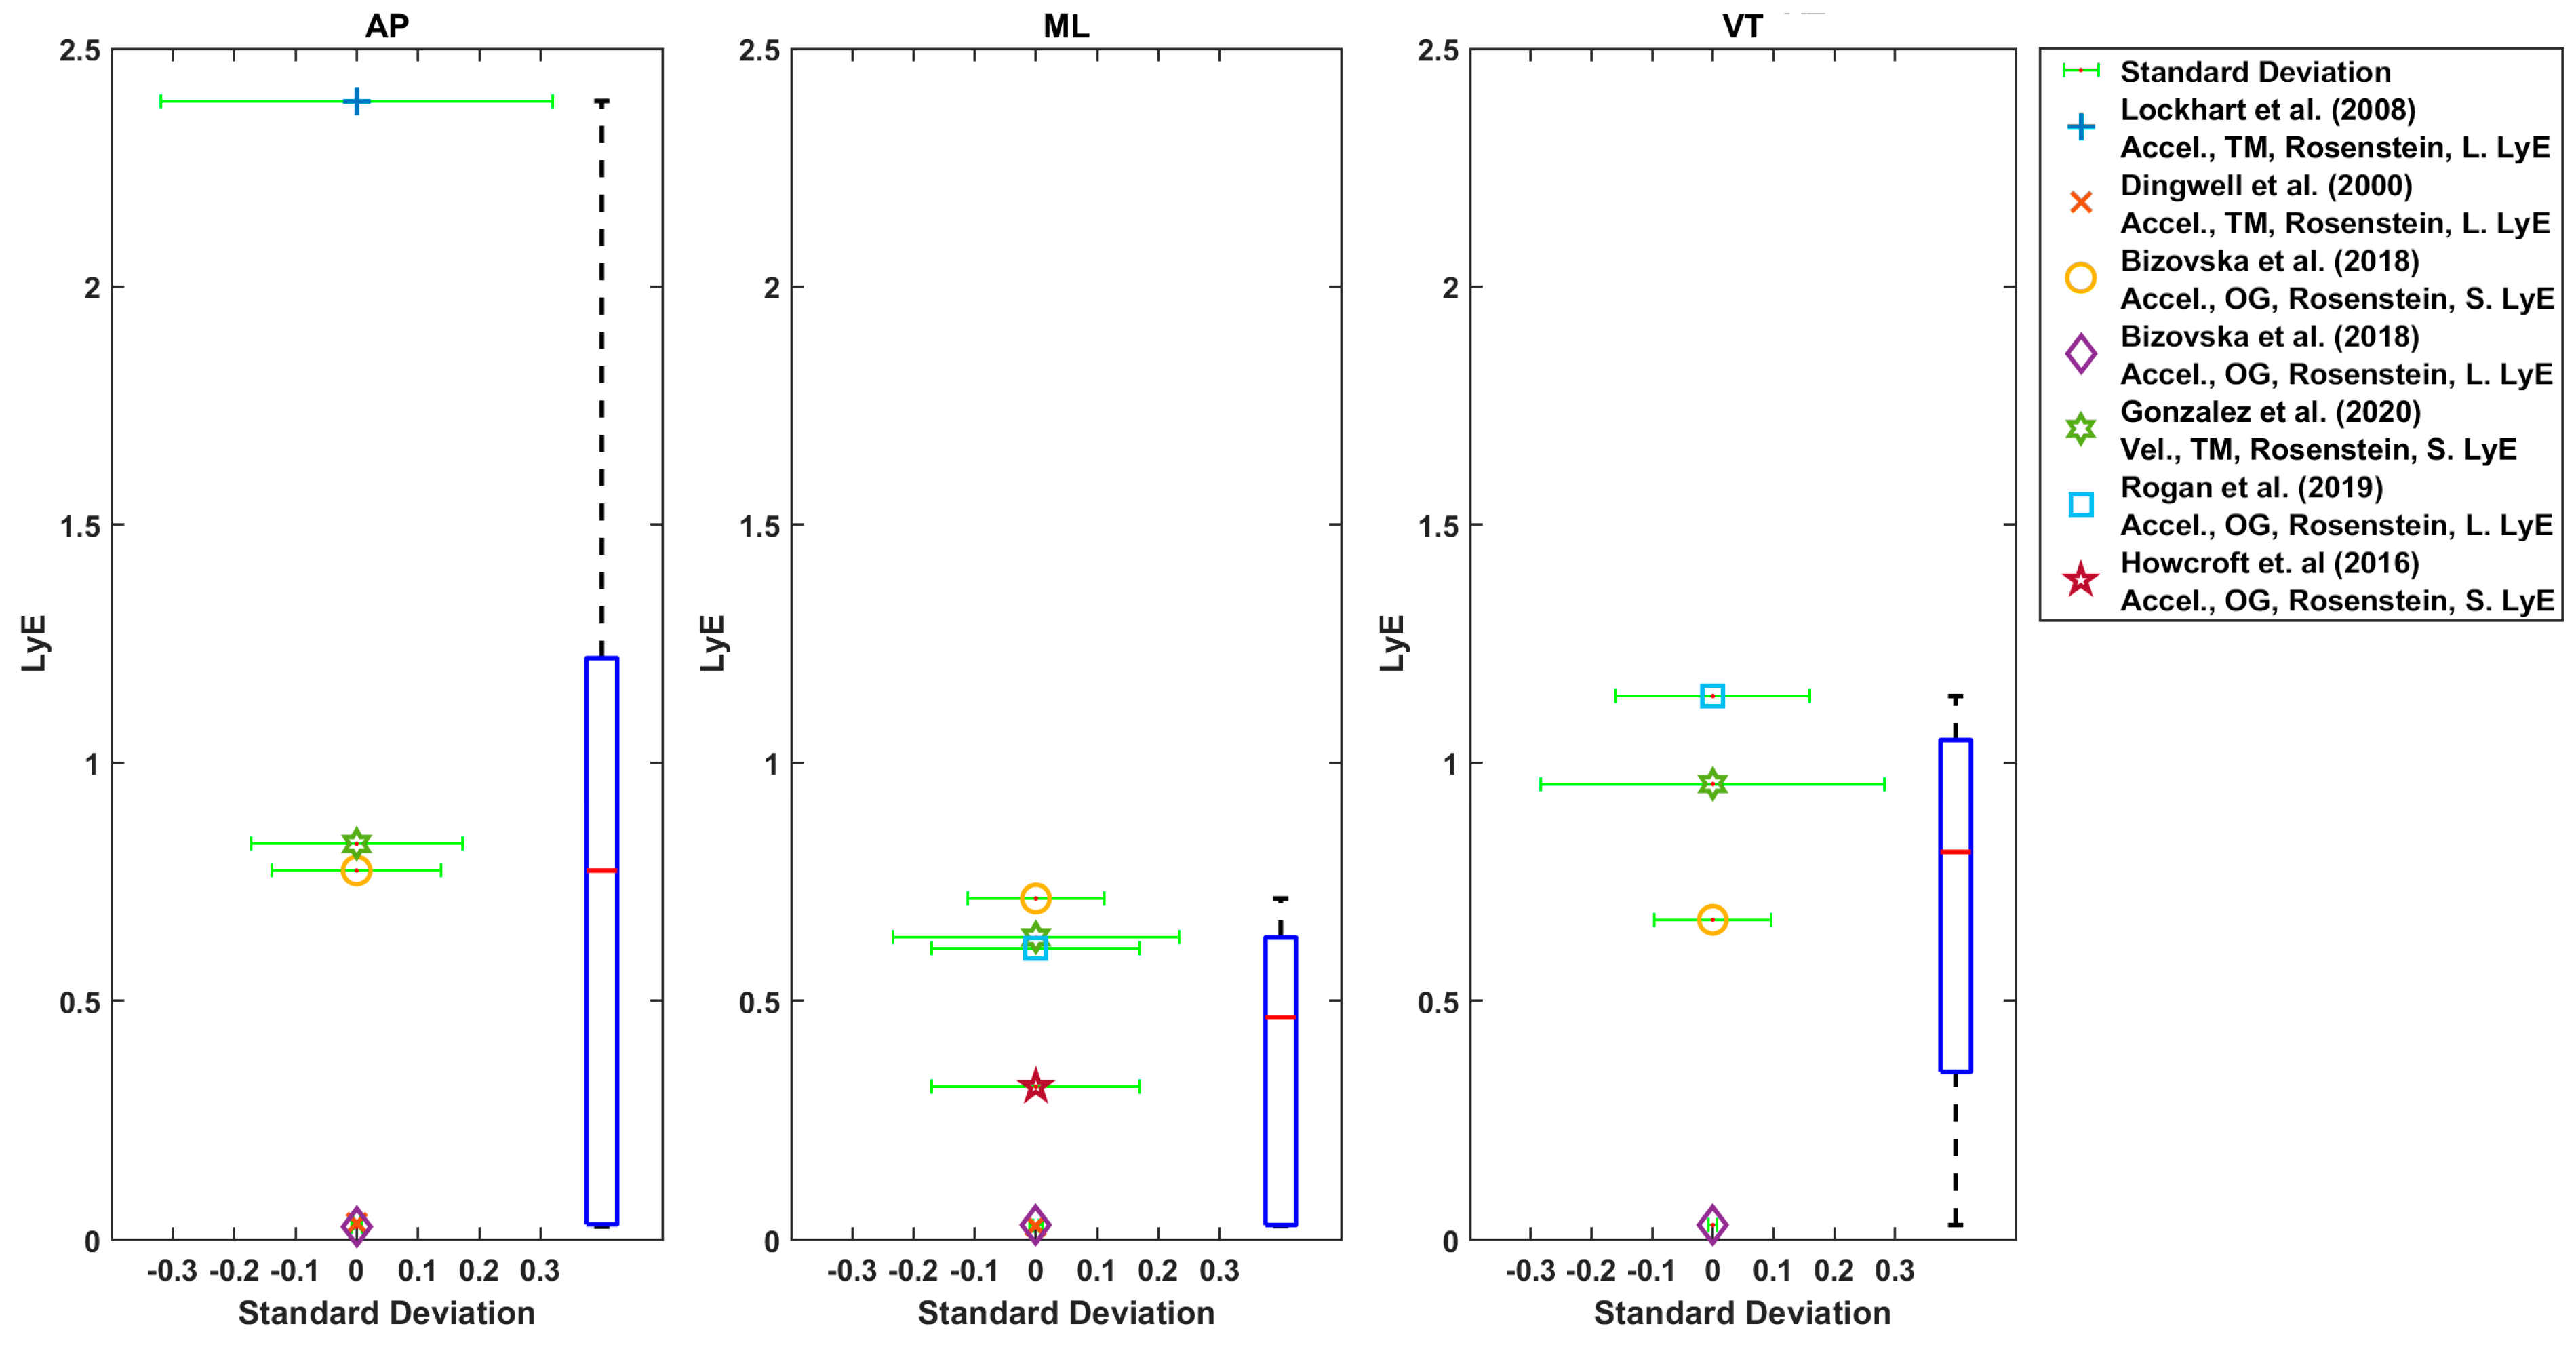
The boxplot of LyE values for healthy older adults estimated using Rosenstein’s or Wolf’s method is shown in Figure 6. Some studies used acceleration, and some used velocity of the trunk. The median values for LyE were 0.67 (18 values), 0.64 (20 values) and 0.69 (17 values) for AP, ML and VT directions, respectively (Figure 7).
Accordingly, the median of the LyE for fall-prone older adults using Rosenstein’s method was 0.77 (5 values), 0.61 (6 values) and 0.81 (4 values) for AP, ML and VT directions, respectively.
Considering the LyE for younger adults using Rosenstein’s or Kantz’s method, the median value was 0.6 (7 values), 0.41 (6 values) and 0.31 (6 values) for AP, ML and VT directions, respectively (Figure 8). Furthermore, using Rosenstein’s method, the median of estimated LyE from 3D velocity was 0.1 (2 values), 0.5 (5 values) and 0.32 (values) for younger adults, older healthy adults and fall-prone older adults, respectively (Figure 9).
As shown in Figure 6, Figure 7, Figure 8 and Figure 9, the reported values from across all reviewed studies do not clearly distinguish between the LyE values of F-NF and YO, despite each study showing LyE higher in fallers compared to non-fallers and older versus younger adults.
Nonlinear dynamic measures that have been used less often in studying falls in older populations are FMs, CD, RQA, MSE, ShE and SEn. Kang and Dingwell [41,60] and Granata and Lockhart [50] reported higher values of FMs for older adults compared to younger adults, which indicated more dynamic stability in younger adults rather than older adults. In Kang and Dingwell [41], FMs were larger (lower dynamic stability) in the superior segments compared to inferior segments and in older adults compared to younger adults. Bisi, Riva [6] reported that FMs did not have significant differences between older and younger populations. Two studies reported that FMs had negative predictive validity in their fall prediction model [12,39]. Granata and Lockhart [50] used FMs and reported that the maximus FM was a good indicator of fall-prone older adults; however, it could not capture the effect of speed on stability. In contrast, Kang and Dingwell [60] showed that FMs decreased at slower speeds and increased at faster speeds in both younger and older populations. In some studies, both LyE and FMs were used [13,41,43,62] and reported larger LyE and FMs in older adults.
In different studies, different combinations of nonlinear dynamic measures were used; however, IC, ShE and MSE were consistently lower in faller compared to non-faller groups [32,35]. Bizovska, Svoboda [32] used ShE, MSE and IC and reported only ShE could distinguish faller from non-faller older adults. Vieira, Rodrigues [42] used both LyE and SEn in studying healthy older adults. Riva, Toebes [30] used MSE and RQA and proposed MSE and RQA to be positively associated with the fall history. Bisi, Riva [6] used LyE, FMs, RQA and MSE and suggested that RQA better-distinguished gait dynamic stability in stable healthy adults. Buzzi, Stergiou [7] reported higher LyE and CD values in older populations. Bizovska, Svoboda [32] estimated MSE, IC and ShE and reported ShE seems to be sufficient in fall risk prediction. Bizovska, Svoboda [9] considered MSE and LyE and stated significant age-related differences in gait were found for LyE.
4. Discussion
The aim was to summarise the variety, characteristics and range of nonlinear dynamic measurements used to distinguish the gait kinematics of healthy older adults and older adults at risk of falling. There is a need to improve existing methods of estimating gait stability to improve the effectiveness of detecting fall risk and predicting falls. This review has helped to ascertain the variety and range of nonlinear dynamic measurements used to characterise gait for healthy older people and older people at risk of falling.
Among all nonlinear dynamic analyses used, LyE was the most common. All studies reported higher LyE and CD for older adults versus younger adults and fall-prone older adults versus non-faller older adults. Hence, these measures should be considered robust. However, values between studies cannot be compared since the methodology used, kinematic characteristics analysed and data analysis procedures differed greatly. Three papers considering FMs reported higher values for older adults compared to younger adults, which indicated more dynamic stability in younger adults [41,50,60]; however, no work with fallers and non-fallers has been published to date. In two studies, entropy and index of complexity reported lower values in older people with a history of falls [32,35].
In the literature, nonlinear dynamic measures have been calculated for a variety of kinematic variables such as marker position, joint angular displacement and velocity, the centre of mass and acceleration. In agreement with the motor control theory proposed by Bernsteĭn [69], the dynamics of movements are not only dependent on the task-related constraints (e.g., walking speed) but also on the biomechanical constraints of the investigated structure (e.g., kinematic variables) [70,71]. However, these kinematic variables (e.g., knee, hip, ankle angle, velocity, etc.) do not demonstrate the same behaviour toward changes in speed and conditions. There is still a lack of clarity as to which kinematic variables are more sensitive for distinguishing fallers from non-fallers. A concern when using nonlinear dynamic analysis for experimental data is the length of the time series analysed [25,48,72]. Different studies used various data lengths. Other concerns pertain to parameters such as time series filtration, normalisation, and input variables like embedding dimension (ED) and time delay (TD). Each of these parameters has a direct effect on LyE estimation [22,23], for example. Different studies used various data lengths, ED and TD. Some of them filtered and/ or normalised time series, and others did not, and this is the same for data normalisation. This, in turn, makes it challenging to compare values across studies.
4.1. Study Design Characteristics
4.1.1. Sample Size and Characteristics
Since women are at higher risk of falls compared to men [1], studies should consider examining sex differences in more detail. To date, no studies examined male versus female differences.
We did not specify a priori an age cut point as an inclusion criterion for papers; rather, we used the interpretation of age in the primary studies included in the review. The age range of younger adults (20–30) and particularly older adults (mean of studies: 65–76.2; age range across all studies: 50–90) varied significantly among the studies. Varied age ranges for those classified as ‘older’ may be related to the large range of nonlinear dynamic values reported in the literature. In addition, the number of participants selected in each group differed. The number of participants in each group should be equal to avoid any possible bias. There are standard methods available for the calculation of sample sizes to estimate expected differences between groups, and these should be adopted for all studies [73].
4.1.2. Fall Risk Assessment Tools
All studies were cross section in nature; therefore, the method of determining fallers from non-fallers is key to comparing the consistency of findings between different research groups. In this review, there was no consistently used fall risk assessment tool to identify the ‘fall groups’, and thus, there is an inconsistent classification of fall risk across studies, which, if nonlinear dynamic measures are associated with fall risk, makes it harder to compare estimates across studies. Consistent and valid fall risk assessment tools need to be studied in future works to standardise across studies, and we suggest using the ProFANE definition of falls and methods for ascertaining falls [73].
4.1.3. Treadmill versus Overground
Biomechanical parameters and nonlinear dynamic measures obtained from TM walking are known to differ from those gained from OG walking [8,9,27,57,74]. Therefore, it is not possible to compare values obtained from TM and OG walking studies.
Based on both practicality and the data required to perform nonlinear dynamic measures, TM walking facilitates controlled experimental conditions while being able to distinguish less stable gait patterns. For older people in the studies reviewed, dynamic stability was increased by small but statistically significant amounts when walking on the TM compared to OG due to artificially stabilised natural locomotor kinematics [8,9,27,57,74]. In most of the studies, TM walking is used because a large amount of continuous data is needed for the calculation of all nonlinear dynamic measures and especially for LyE [23,27,67]. TM studies still found increased LyE for older versus younger adults. Therefore, while reducing values, they can still distinguish the groups; however, the relative effect of TM walking should be considered when using motorised treadmills and, more importantly, in fall prevention intervention strategies.
4.2. Data Collection Modality and Kinematic Variables Analysed
Until recently, LyE and FMs have been calculated on data collected in a movement laboratory with motion capture systems, making them relatively cost and time expensive to evaluate [17]. With the availability of inertial sensors, it has been cheaper to conduct these kinds of studies. The effect size of LyE values estimated from acceleration or velocity during OG walking was higher in the YO and F-NF studies, which suggests that more significant differences between YO and F-NF could be captured while participants were walking on the ground compared to on a treadmill. While the evidence is compelling, it is still not clear if different kinematic variables such as acceleration, velocity or position reveal the same properties of the nonlinear characteristics of the gait, and this is an area for future research. Thus, TM and OG studies should continue in parallel.
Inertial sensors were most commonly used (compared to camera-based methods) to study falling in older adults because they have the ability to collect data outside the laboratory environment [75,76]. Different makes of inertial sensors such as Dynaport Hybrid [19,30,32], OPALS [6], Delsys Inc [28,32] and Xsens [3,45,52,59] were used across studies. In addition, a varying number of sensors were used. In some studies, only one inertial sensor (placed on the trunk) was used; in others, two or three inertial sensors were used (placed on the trunk and ankles). Using different sensors with various specifications (sensors’ range and sample rate differences) and different sensor placements on the body can be another reason for the variability in the reported NDA measures values [77]. An inertial sensor should be placed so that the maximum movements and signals can be captured [75,76]. Overall, the possibility to use inertial sensors to determine nonlinear characteristics of gait is a promising field. However, the methodology for data collection, processing and analysis should be standardised to facilitate better comparisons between studies and the generation of reference values for the field.
Inconsistency in data collection modality and process hinders the ability to compare nonlinear dynamic measures across studies and identify ‘normal’ values. In addition, it is still questionable what kinematic variables (position, velocity and acceleration), collection modalities and sensors’ positions result in the most sensitive and specific nonlinear dynamic measures of walking related to ageing and falling. Future work might explore this area in a systematic way and try to standardise the acceleration’s position in this kind of study.
4.3. Nonlinear Dynamic Analysis
Among all the aforementioned nonlinear dynamic measures, LyE using Rosenstein’s method has been most commonly used to investigate gait characteristics in older populations. However, Cignetti, Decker [44] reported that Rosenstein’s method provided less sensitivity than Wolf’s method to capture age-related differences from small gait data set. They concluded that Wolf’s method is more appropriate for the estimated LyE from small gait data sets [44]. Hence, there is still information missing on which method is more sensitive to differences between fallers and non-fallers.
There are not yet any population averages, nor are there reference values created under an agreed laboratory protocol that would allow a fixed and robust interpretation of the nonlinear dynamic measures due to different study designs and methods of calculation being used in the literature.
Although it is vital to reconstructing phase space with optimum TD and ED for LyE estimation [25], there are no mathematical rules for selecting the ‘correct’ values for TD and ED to reconstruct the phase space; rather, some recommendations have been suggested for their estimation [78]. For the majority of literature published in this area, authors make reference to the algorithms for estimating ED and TD and Theiler window but rarely report the actual values when reconstructing and subsequently quantifying characteristics of the attractor state. Mathematically, it is presented that decreasing the ED lead to self-intersections of the reconstructed trajectory [78]. Therefore, this can be an area of future work when or if attempting to standardise LyE calculation.
4.4. Nonlinear Dynamic Variable Values
While LyE has been most widely used, other nonlinear dynamic measures of gait have the potential to distinguish fallers from non-fallers. The relative sensitivity and specificity of these measures are yet to be fully determined and will be an avenue for future research.
Although all studies reported higher LyE for an older population, there was not a consistence range for their values. This is likely because of using different LyE estimation methods and/or different data acquisition, and/or even using different kinematic variables as reported above. In some studies, using velocity and, in others, using acceleration showed more sensitivity among groups. Reported LyE values in YO comparison studies, indicating that acceleration and OG walking modality in nonlinear dynamic measures for gait are more sensitive to the changes due to ageing. However, reported LyE values in F-NF studies suggest that using velocity while participants were walking on a treadmill could better distinguish fallers from non-fallers. There is a possibility that these inconsistencies in the estimation of LyE for gait in YO and the elderly came from the different methodological approaches adopted in the studies. Therefore, this led to high variability in reported LyE values for younger and older adults. Future work needs to standardise the LyE estimation method.
In contrast to LyE, there were just a few studies using other nonlinear dynamic measures. Among them, the inconsistency in the results across studies suggests that FMs were a less sensitive measure for studying changes in the gait of older adults. In addition, one study stated that CD captured a significant difference between younger and older adults’ gait [7]. However, the strength of evidence is lacking due to the limited number of studies and varied methods.
MSE was commonly used for the quantification of complexity, among other three entropy analyses applied across studies [3,6,32,34]. Some studies reported that MSE and measures of RQA have been associated with fall history [30] and that MSE and ShE can be used as fall risk predictors [32,35]. However, same as with the LyE values, there are not any normative entropy values with which to compare values among studies. Entropy algorithms are sensitive to their input parameters of tolerance window r, vector length m, time series length N and number of scales [20]. Inconsistency in these input parameters between studies has led to conflicting results between studies. Hence, further studies with consistent data processing methodologies need to be carried out in this area.
Variations in the methodology and data analysis procedures cannot support a standard nonlinear dynamic measures range for populations, which can be used in clinical settings to predict fall risk. Currently, we have evidence that preferred speed is better prediction than fixed speed in the data collection [27], but the relevance of other components of test protocols is not known. We cannot be sure what protocol should be used for generating reference values. For example, OG/ TM, accelerometer/ velocity/ position, nonlinear dynamic measures (LyE/ FMs/ RQA/ MSE) and their estimation’s methods. More research is needed to determine which protocols are most sensitive and specific for the prediction of falls.
4.5. Limitations
Our review had a number of limitations and constraints. Only one reviewer appraised the quality of papers, and because of the breadth of research methods being reported in the papers, quality of assessment of methods was challenging, and it was not possible to use standard techniques to assess quality, pool results and estimate heterogeneity. We used the items in the PRISMA reporting guideline to provide a framework for quality assessment but recognise that ideally we should have used more detailed quality assessment instruments. We included two databases only, but these are both considered to have broad coverage of the literature. Nevertheless, we believe the review scope and results reflect progress in the field well.
5. Conclusions
Although NDA for determining specific parameters of mobility can assess function and stability in the elderly, measures have hardly been taken up in clinical settings because of their unclear sensitivity and specificity, together with the time and effort required for their use. There is much variation in reported nonlinear dynamic values across studies that can be attributed to three main factors: (i) experiment design, (ii) fall risk assessment tools and (iii) variables analysed and nonlinear dynamic measures estimation method. Due to the robustness of findings, in future studies, we suggest that it is worth standardising data collection, variable definition and the estimation methods of nonlinear dynamic measures. This will lead the field towards better acknowledging the possibility of clinically relevant nonlinear dynamic values for identifying fall risk.
Author Contributions
A.A.: Conceptualisation, Methodology, Software, Investigation, Writing—Original Draft: Visualisation. G.K.R.W.: Conceptualisation, Supervision, Resources, Writing—Review and Editing, Visualisation. S.E.L.: Conceptualisation, Supervision, Resources, Writing—Review and Editing, Visualisation. J.Y.C.: Conceptualisation, Supervision, Resources, Writing—Review and Editing, Visualisation. All authors have read and agreed to the published version of the manuscript.
Funding
This research received no external funding.
Institutional Review Board Statement
Not applicable.
Informed Consent Statement
No author has any financial or personal relationships with other people or organisations that could inappropriately influence the manuscript.
Data Availability Statement
Not applicable.
Conflicts of Interest
The authors declare no conflict of interest.
Abbreviations
| LyE | Lyapunov Exponent |
| FMs | Fouquet Multipliers |
| MSE | Multiscale Entropy |
| RQA | Recurrence quantification analysis |
| TM | treadmill |
| OG | overground |
| AP | anterior-posterior |
| VT | vertical |
| ML | medio-lateral |
| YO | younger adults and older adults |
| F-NF | Fall-prone older adults and non-faller older adults |
| SAFE | the Survey of Activities and Fear of Falling in the Elderly |
| MSRS | Movement Specific Reinvestment Scale |
| FES-I | The Falls Efficacy Scale International |
| CES-D | depression |
| LAPAQ | The Longitudinal Aging Study Amsterdam Physical Activity Questionnaire |
| MMSE | Mini mental state examination score |
| TBAT | Tinetti Balance Assessment Tool |
| SD | Standard deviation |
| Sen | Sample Entropy |
| CD | Correlation Dimension |
| ShE | Shannon Entropy |
References
- World Health Organization. WHO Global Report on Falls Prevention in Older Age; World Health Organization: Geneva, Switzerland, 2008. [Google Scholar]
- Berg, R.L.; Cassells, J.S. The Second Fifty Years: Promoting Health and Preventing Disability; National Academy Press: Washington, DC, USA, 1990. [Google Scholar]
- Hamacher, D.; Liebl, D.; Hödl, C.; Heßler, V.; Kniewasser, C.K.; Thönnessen, T.; Zech, A. Gait stability and its influencing factors in older adults. Front. Physiol. 2019, 9, 1955. [Google Scholar] [CrossRef]
- Ambrose, A.F.; Paul, G.; Hausdorff, J.M. Risk factors for falls among older adults: A review of the literature. Maturitas 2013, 75, 51–61. [Google Scholar] [CrossRef]
- Tinetti, M.E.; Williams, T.F.; Mayewski, R. Fall risk index for elderly patients based on number of chronic disabilities. Am. J. Med. 1986, 80, 429–434. [Google Scholar] [CrossRef]
- Bisi, M.C.; Riva, F.; Stagni, R. Measures of gait stability: Performance on adults and toddlers at the beginning of independent walking. J. Neuroeng. Rehabil. 2014, 11, 131. [Google Scholar] [CrossRef] [Green Version]
- Buzzi, U.H.; Stergiou, N.; Kurz, M.J.; Hageman, P.A.; Heidel, J. Nonlinear dynamics indicates aging affects variability during gait. Clin. Biomech. 2003, 18, 435–443. [Google Scholar] [CrossRef]
- Terrier, P.; Dériaz, O. Kinematic variability, fractal dynamics and local dynamic stability of treadmill walking. J. Neuroeng. Rehabil. 2011, 8, 12. [Google Scholar] [CrossRef] [Green Version]
- Bizovska, L.; Svoboda, Z.; Kubonova, E.; Vuillerme, N.; Hirjakova, Z.; Janura, M. The differences between overground and treadmill walking in nonlinear, entropy-based and frequency variables derived from accelerometers in young and older women: Preliminary report. Acta Bioeng. Biomech. 2018, 20, 93–100. [Google Scholar]
- Brauer, S.G.; Burns, Y.R.; Galley, P. A prospective study of laboratory and clinical measures of postural stability to predict community-dwelling fallers. J. Gerontol. Ser. A Biol. Sci. Med. Sci. 2000, 55, M469–M476. [Google Scholar] [CrossRef] [Green Version]
- Buatois, S.; Gueguen, R.; Gauchard, G.C.; Benetos, A.; Perrin, P.P. Posturography and risk of recurrent falls in healthy non-institutionalized persons aged over 65. Gerontology 2006, 52, 345–352. [Google Scholar] [CrossRef]
- Bruijn, S.; Meijer, O.; Beek, P.; Van Dieën, J. Assessing the stability of human locomotion: A review of current measures. J. R. Soc. Interface 2013, 10, 20120999. [Google Scholar] [CrossRef]
- Johansson, J.; Nordström, A.; Nordström, P. Greater fall risk in elderly women than in men is associated with increased gait variability during multitasking. J. Am. Med. Dir. Assoc. 2016, 17, 535–540. [Google Scholar] [CrossRef] [PubMed]
- Wong, D.W.-C.; Lam, W.-K.; Lee, W.C.-C. Gait asymmetry and variability in older adults during long-distance walking: Implications for gait instability. Clin. Biomech. 2020, 72, 37–43. [Google Scholar] [CrossRef] [PubMed]
- Stergiou, N. Innovative Analyses of Human Movement; Human Kinetics Publishers: Champaign, IL, USA, 2004. [Google Scholar]
- Lipsitz, L.A.; Goldberger, A.L. Loss of ‘complexity’ and aging: Potential applications of fractals and chaos theory to senescence. JAMA 1992, 267, 1806–1809. [Google Scholar] [CrossRef] [PubMed]
- Hamacher, D.; Singh, N.; Van Dieen, J.; Heller, M.; Taylor, W. Kinematic measures for assessing gait stability in elderly individuals: A systematic review. J. R. Soc. Interface 2011, 8, 1682–1698. [Google Scholar] [CrossRef]
- Mehdizadeh, S. The largest Lyapunov exponent of gait in young and elderly individuals: A systematic review. Gait Posture 2018, 60, 241–250. [Google Scholar] [CrossRef]
- Riva, F.; Bisi, M.; Stagni, R. Orbital stability analysis in biomechanics: A systematic review of a nonlinear technique to detect instability of motor tasks. Gait Posture 2013, 37, 1–11. [Google Scholar] [CrossRef]
- Yentes, J.M.; Raffalt, P.C. Entropy Analysis in Gait Research: Methodological Considerations and Recommendations. Ann. Biomed. Eng. 2021, 49, 979–990. [Google Scholar] [CrossRef]
- Liberati, A.; Altman, D.G.; Tetzlaff, J.; Mulrow, C.; Gøtzsche, P.C.; Ioannidis, J.P.; Clarke, M.; Devereaux, P.J.; Kleijnen, J.; Moher, D. The PRISMA statement for reporting systematic reviews and meta-analyses of studies that evaluate health care interventions: Explanation and elaboration. J. Clin. Epidemiol. 2009, 62, e1–e34. [Google Scholar] [CrossRef] [Green Version]
- Wolf, A.; Swift, J.B.; Swinney, H.L.; Vastano, J.A. Determining Lyapunov exponents from a time series. Phys. D Nonlinear Phenom. 1985, 16, 285–317. [Google Scholar] [CrossRef] [Green Version]
- Rosenstein, M.T.; Collins, J.J.; de Luca, C.J. A practical method for calculating largest Lyapunov exponents from small data sets. Phys. D Nonlinear Phenom. 1993, 65, 117–134. [Google Scholar] [CrossRef]
- Ihlen, E.A.; Goihl, T.; Wik, P.B.; Sletvold, O.; Helbostad, J.; Vereijken, B. Phase-dependent changes in local dynamic stability of human gait. J. Biomech. 2012, 45, 2208–2214. [Google Scholar] [CrossRef] [PubMed]
- Kantz, H.; Schreiber, T. Nonlinear Time Series Analysis; Cambridge University Press: Cambridge, UK, 2004; Volume 7. [Google Scholar]
- Cohen, J. Statistical Power Analysis for the Behavioral Sciences, 2nd ed.; Erbaum Press: Hillsdale, NJ, USA, 1988. [Google Scholar]
- Dingwell, J.B.; Cusumano, J.P. Nonlinear time series analysis of normal and pathological human walking. Chaos Interdiscip. J. Nonlinear Sci. 2000, 10, 848–863. [Google Scholar] [CrossRef] [PubMed]
- Bizovska, L.; Svoboda, Z.; Janura, M.; Bisi, M.C.; Vuillerme, N. Local dynamic stability during gait for predicting falls in elderly people: A one-year prospective study. PLoS ONE 2018, 13, e0197091. [Google Scholar] [CrossRef] [PubMed] [Green Version]
- Ihlen, E.A.; Weiss, A.; Beck, Y.; Helbostad, J.L.; Hausdorff, J.M. A comparison study of local dynamic stability measures of daily life walking in older adult community-dwelling fallers and non-fallers. J. Biomech. 2016, 49, 1498–1503. [Google Scholar] [CrossRef] [PubMed]
- Riva, F.; Toebes, M.; Pijnappels, M.; Stagni, R.; Van Dieën, J. Estimating fall risk with inertial sensors using gait stability measures that do not require step detection. Gait Posture 2013, 38, 170–174. [Google Scholar] [CrossRef] [Green Version]
- Toebes, M.J.; Hoozemans, M.J.; Furrer, R.; Dekker, J.; van Dieën, J.H. Associations between measures of gait stability, leg strength and fear of falling. Gait Posture 2015, 41, 76–80. [Google Scholar] [CrossRef] [Green Version]
- Bizovska, L.; Svoboda, Z.; Vuillerme, N.; Janura, M. Multiscale and Shannon entropies during gait as fall risk predictors—A prospective study. Gait Posture 2017, 52, 5–10. [Google Scholar] [CrossRef]
- Lockhart, T.E.; Liu, J. Differentiating fall-prone and healthy adults using local dynamic stability. Ergonomics 2008, 51, 1860–1872. [Google Scholar] [CrossRef] [Green Version]
- Howcroft, J.; Kofman, J.; Lemaire, E.D.; McIlroy, W.E. Analysis of dual-task elderly gait in fallers and non-fallers using wearable sensors. J. Biomech. 2016, 49, 992–1001. [Google Scholar] [CrossRef]
- Ihlen, E.A.; Van Schooten, K.S.; Bruijn, S.M.; Van Dieen, J.H.; Vereijken, B.; Helbostad, J.L.; Pijnappels, M. Improved prediction of falls in community-dwelling older adults through phase-dependent entropy of daily-life walking. Front. Aging Neurosci. 2018, 10, 44. [Google Scholar] [CrossRef] [Green Version]
- Ihlen, E.A.; Weiss, A.; Helbostad, J.L.; Hausdorff, J.M. The discriminant value of phase-dependent local dynamic stability of daily life walking in older adult community-dwelling fallers and nonfallers. BioMed Res. Int. 2015, 2015, 402596. [Google Scholar] [CrossRef] [PubMed] [Green Version]
- Rogan, S.; Taeymans, J.; Bangerter, C.; Simon, S.; Terrier, P.; Hilfiker, R. Influence of single and dual tasks on gait stability and gait speed in the elderly. Z. Für Gerontol. Und Geriatr. 2019, 52, 23–27. [Google Scholar] [CrossRef] [PubMed]
- De Melker Worms, J.L.; Stins, J.F.; van Wegen, E.E.; Loram, I.D.; Beek, P.J. Influence of focus of attention, reinvestment and fall history on elderly gait stability. Physiol. Rep. 2017, 5, e13061. [Google Scholar] [CrossRef] [PubMed]
- Yang, F.; Pai, Y.-C. Can stability really predict an impending slip-related fall among older adults? J. Biomech. 2014, 47, 3876–3881. [Google Scholar] [CrossRef] [PubMed] [Green Version]
- Ihlen, E.A.; Sletvold, O.; Goihl, T.; Wik, P.B.; Vereijken, B.; Helbostad, J. Older adults have unstable gait kinematics during weight transfer. J. Biomech. 2012, 45, 1559–1565. [Google Scholar] [CrossRef]
- Kang, H.G.; Dingwell, J.B. Dynamic stability of superior vs. inferior segments during walking in young and older adults. Gait Posture 2009, 30, 260–263. [Google Scholar] [CrossRef] [Green Version]
- Vieira, M.F.; Rodrigues, F.B.; e Souza, G.S.d.S.; Magnani, R.M.; Lehnen, G.C.; Andrade, A.O. Linear and nonlinear gait features in older adults walking on inclined surfaces at different speeds. Ann. Biomed. Eng. 2017, 45, 1560–1571. [Google Scholar] [CrossRef]
- Terrier, P.; Reynard, F. Effect of age on the variability and stability of gait: A cross-sectional treadmill study in healthy individuals between 20 and 69 years of age. Gait Posture 2015, 41, 170–174. [Google Scholar] [CrossRef] [Green Version]
- Cignetti, F.; Decker, L.M.; Stergiou, N. Sensitivity of the Wolf’s and Rosenstein’s algorithms to evaluate local dynamic stability from small gait data sets. Ann. Biomed. Eng. 2012, 40, 1122–1130. [Google Scholar] [CrossRef]
- Hamacher, D.; Hamacher, D.; Singh, N.B.; Taylor, W.R.; Schega, L. Towards the assessment of local dynamic stability of level-grounded walking in an older population. Med. Eng. Phys. 2015, 37, 1152–1155. [Google Scholar] [CrossRef]
- Kang, H.G.; Dingwell, J.B. A direct comparison of local dynamic stability during unperturbed standing and walking. Exp. Brain Res. 2006, 172, 35. [Google Scholar] [CrossRef]
- Kyvelidou, A.; Kurz, M.J.; Ehlers, J.L.; Stergiou, N. Aging and partial body weight support affects gait variability. J. Neuroeng. Rehabil. 2008, 5, 22. [Google Scholar] [CrossRef] [Green Version]
- Ohtaki, Y.; Arif, M.; Suzuki, A.; Fujita, K.; Inooka, H.; Nagatomi, R.; Tsuji, I. Assessment of walking stability of elderly by means of nonlinear time-series analysis and simple accelerometry. JSME Int. J. Ser. C Mech. Syst. Mach. Elem. Manuf. 2005, 48, 607–612. [Google Scholar] [CrossRef] [Green Version]
- Segal, A.D.; Orendurff, M.S.; Czerniecki, J.M.; Shofer, J.B.; Klute, G.K. Local dynamic stability in turning and straight-line gait. J. Biomech. 2008, 41, 1486–1493. [Google Scholar] [CrossRef]
- Granata, K.P.; Lockhart, T.E. Dynamic stability differences in fall-prone and healthy adults. J. Electromyogr. Kinesiol. 2008, 18, 172–178. [Google Scholar] [CrossRef] [Green Version]
- Craig, J.J.; Bruetsch, A.P.; Huisinga, J.M. Coordination of trunk and foot acceleration during gait is affected by walking velocity and fall history in elderly adults. Aging Clin. Exp. Res. 2019, 31, 943–950. [Google Scholar] [CrossRef]
- Liu, J.; Zhang, X.; Lockhart, T.E. Fall risk assessments based on postural and dynamic stability using inertial measurement unit. Saf. Health Work. 2012, 3, 192–198. [Google Scholar] [CrossRef]
- Qiao, M.; Truong, K.N.; Franz, J.R. Does local dynamic stability during unperturbed walking predict the response to balance perturbations? An examination across age and falls history. Gait Posture 2018, 62, 80–85. [Google Scholar] [CrossRef]
- Reynard, F.; Terrier, P. Local dynamic stability of treadmill walking: Intrasession and week-to-week repeatability. J. Biomech. 2014, 47, 74–80. [Google Scholar] [CrossRef] [Green Version]
- Toebes, M.J.; Hoozemans, M.J.; Furrer, R.; Dekker, J.; van Dieën, J.H. Local dynamic stability and variability of gait are associated with fall history in elderly subjects. Gait Posture 2012, 36, 527–531. [Google Scholar] [CrossRef] [Green Version]
- Rispens, S.M.; van Schooten, K.S.; Pijnappels, M.; Daffertshofer, A.; Beek, P.J.; van Dieen, J.H. Identification of fall risk predictors in daily life measurements: Gait characteristics’ reliability and association with self-reported fall history. Neurorehabilit. Neural Repair 2015, 29, 54–61. [Google Scholar] [CrossRef] [PubMed]
- Rispens, S.M.; Van Dieën, J.H.; Van Schooten, K.S.; Lizama, L.E.C.; Daffertshofer, A.; Beek, P.J.; Pijnappels, M. Fall-related gait characteristics on the treadmill and in daily life. J. Neuroeng. Rehabil. 2016, 13, 12. [Google Scholar] [CrossRef] [PubMed] [Green Version]
- Lizama, L.E.C.; Pijnappels, M.; Rispens, S.M.; Reeves, N.P.; Verschueren, S.M.; van Dieën, J.H. Mediolateral balance and gait stability in older adults. Gait Posture 2015, 42, 79–84. [Google Scholar] [CrossRef] [PubMed] [Green Version]
- Hamacher, D.; Hamacher, D.; Rehfeld, K.; Schega, L. Motor-cognitive dual-task training improves local dynamic stability of normal walking in older individuals. Clin. Biomech. 2016, 32, 138–141. [Google Scholar] [CrossRef]
- Kang, H.G.; Dingwell, J.B. Effects of walking speed, strength and range of motion on gait stability in healthy older adults. J. Biomech. 2008, 41, 2899–2905. [Google Scholar] [CrossRef]
- Toebes, M.J.; Hoozemans, M.J.; Mathiassen, S.E.; Dekker, J.; van Dieën, J.H. Measurement strategy and statistical power in studies assessing gait stability and variability in older adults. Aging Clin. Exp. Res. 2016, 28, 257–265. [Google Scholar] [CrossRef] [Green Version]
- Aboutorabi, A.; Arazpour, M.; Bahramizadeh, M.; Hutchins, S.W.; Fadayevatan, R. The effect of aging on gait parameters in able-bodied older subjects: A literature review. Aging Clin. Exp. Res. 2016, 28, 393–405. [Google Scholar] [CrossRef]
- Gonzalez, M.; Gates, D.H.; Rosenblatt, N.J. The impact of obesity on gait stability in older adults. J. Biomech. 2020, 100, 109585. [Google Scholar] [CrossRef]
- Lizama, L.E.C.; Pijnappels, M.; Faber, G.H.; Reeves, P.N.; Verschueren, S.M.; van Dieen, J.H. Age effects on mediolateral balance control. PLoS ONE 2014, 9, e110757. [Google Scholar]
- Folstein, M.F.; Folstein, S.E.; McHugh, P.R. “Mini-mental state”: A practical method for grading the cognitive state of patients for the clinician. J. Psychiatr. Res. 1975, 12, 189–198. [Google Scholar] [CrossRef]
- Dingwell, J.B.; Cusumano, J.P.; Sternad, D.; Cavanagh, P. Slower speeds in patients with diabetic neuropathy lead to improved local dynamic stability of continuous overground walking. J. Biomech. 2000, 33, 1269–1277. [Google Scholar] [CrossRef]
- Hurmuzlu, Y.; Basdogan, C. On the measurement of dynamic stability of human locomotion. J. Biomech. Eng. 1994, 116, 30–36. [Google Scholar] [CrossRef] [PubMed]
- Richman, J.S.; Moorman, J.R. Physiological time-series analysis using approximate entropy and sample entropy. Am. J. Physiol. -Heart Circ. Physiol. 2000, 278, H2039–H2049. [Google Scholar] [CrossRef] [PubMed] [Green Version]
- Bernsteĭn, N. The Co-Ordination and Regulation of Movements; Pergamon Press: New York, NY, USA, 1967. [Google Scholar]
- England, S.A.; Granata, K.P. The influence of gait speed on local dynamic stability of walking. Gait Posture 2007, 25, 172–178. [Google Scholar] [CrossRef] [Green Version]
- Bruijn, S.M.; van Dieën, J.H.; Meijer, O.G.; Beek, P.J. Is slow walking more stable? J. Biomech. 2009, 42, 1506–1512. [Google Scholar] [CrossRef] [Green Version]
- Lamb, S.E.; Jørstad-Stein, E.C.; Hauer, K.; Becker, C.; Prevention of Falls Network Europe and Outcomes Consensus Group. Development of a common outcome data set for fall injury prevention trials: The Prevention of Falls Network Europe consensus. J. Am. Geriatr. Soc. 2005, 53, 1618–1622. [Google Scholar] [CrossRef]
- Senn, S. Sample size considerations for n-of-1 trials. Stat. Methods Med. Res. 2019, 28, 372–383. [Google Scholar] [CrossRef]
- Wearing, S.C.; Reed, L.F.; Urry, S.R. Agreement between temporal and spatial gait parameters from an instrumented walkway and treadmill system at matched walking speed. Gait Posture 2013, 38, 380–384. [Google Scholar] [CrossRef] [Green Version]
- Usmani, S.; Saboor, A.; Haris, M.; Khan, M.A.; Park, H. Latest Research Trends in Fall Detection and Prevention Using Machine Learning: A Systematic Review. Sensors 2021, 21, 5134. [Google Scholar] [CrossRef]
- Delahoz, Y.S.; Labrador, M.A. Survey on fall detection and fall prevention using wearable and external sensors. Sensors 2014, 14, 19806–19842. [Google Scholar] [CrossRef] [Green Version]
- Preatoni, E.; Bergamini, E.; Fantozzi, S.; Giraud, L.I.; Orejel Bustos, A.S.; Vannozzi, G.; Camomilla, V. The Use of Wearable Sensors for Preventing, Assessing, and Informing Recovery from Sport-Related Musculoskeletal Injuries: A Systematic Scoping Review. Sensors 2022, 22, 3225. [Google Scholar] [CrossRef] [PubMed]
- Huffaker, R.; Bittelli, M.; Rosa, R. Nonlinear Time Series Analysis with R; Oxford University Press: Oxford, UK, 2017. [Google Scholar]
Figure 1.
Included research flow diagram based on PRISMA guideline [21].
Figure 1.
Included research flow diagram based on PRISMA guideline [21].

Figure 2.
Mean and SD age (years) of older participants in the studies.

Figure 3.
Estimated Mean (x axis) and SD (y axis) LyE values by Rispens et al. (2016).

Figure 4.
Effect size of LyE between younger and older groups.

Figure 5.
Effect size of LyE between healthy and fall-prone older adults’ groups.

Figure 6.
Reported Trunk Short-Term LyE or Long-Term LyE for healthy older adults.

Figure 7.
Reported Trunk Short-Term LyE or Long-Term LyE for fall-prone adults.

Figure 8.
Reported Trunk Short-Term LyE or Long-Term LyE for younger adults.

Figure 9.
Reported Trunk Short-Term LyE or Long-Term LyE for healthy older, fall-prone and younger adults.
Figure 9.
Reported Trunk Short-Term LyE or Long-Term LyE for healthy older, fall-prone and younger adults.


Table 1.
Equal gender/ Sex ratio, sample size, participant’s gender (Female, Male or not mentioned (nm)), overground (OG) or on the Treadmill (TM) or Both (Both) cohorts in studies in corporation F-NF or YO comparisons.
Table 1.
Equal gender/ Sex ratio, sample size, participant’s gender (Female, Male or not mentioned (nm)), overground (OG) or on the Treadmill (TM) or Both (Both) cohorts in studies in corporation F-NF or YO comparisons.
| Author (Year) [Reference] | F-NF | YO | Equal Gender/Sex Ratio | Sample Size | Female/Male | TM/OG/Both |
|---|---|---|---|---|---|---|
| Bisi et al. (2014) [6] | no | yes | no | 30 | nm | TM |
| Dingwell et al. (2000) [27] | yes | no | no | 24 | 7/17 | Both |
| Bizovska et al. (2018) [28] | yes | no | no | 139 | nm | OG |
| Gonzalez et al. (2020) [63] | no | no | no | 34 | nm | TM |
| Granata et al. (2008) [50] | yes | yes | no | 12 | nm | TM |
| Hamacher et al. (2019) [3] | no | yes | no | 102 | 52/50 | OG |
| Ihlen et al. (2012) [40] | no | yes | no | 20 | 8/12 | TM |
| Ihlen et al. (2016) [29] | yes | no | no | 71 | nm | OG |
| Kang & Dingwell (2009) [41] | no | yes | no | 25 | 11/14 | TM |
| Lockhart et al. (2008) [33] | yes | yes | no | 13 | nm | TM |
| Riva et al. (2013) [19] | yes | no | no | 131 | nm | TM |
| Vieira et al. (2017) [42] | no | yes | no | 87 | 46/41 | TM |
| Toebes et al. (2015) [31] | no | no | no | 134 | 85/49 | TM |
| Buzzi et al. (2003) [7] | no | yes | no | 20 | 20/0 | TM |
| Terrier et al. (2015) [43] | no | yes | yes | 100 | 50/50 | TM |
| Toebes et al. (2012) [55] | no | no | no | 134 | 85/49 | TM |
| Rispens et al. (2015) [56] | no | no | no | 110 | 77/33 | OG |
| Rispens et al. (2016) [57] | no | no | no | 18 | 7/11 | Both |
| Lizama et al. (2015) [58] | no | no | no | 19 | 7/12 | TM |
| Bizovska et al. (2017) [32] | yes | no | no | 139 | nm | OG |
| Bizovska et al. (2018) [9] | no | yes | yes | 139 | nm | Both |
| Cignetti et al. (2011) [44] | no | yes | no | 14 | 5/9 | TM |
| Craig et al. (2019) [51] | yes | yes | no | 65 | 48/17 | TM |
| Hamacher et al. (2015) [45] | no | yes | no | 39 | 26/13 | OG |
| Hamacher et al. (2016) [59] | no | no | no | 32 | 21/11 | OG |
| Howcroft et al. (2016) [34] | yes | no | no | 100 | 56/44 | OG |
| Ihlen et al. (2015) [36] | yes | no | no | 71 | nm | OG |
| Ihlen et al. (2018) [35] | yes | no | no | 319 | 162/157 | OG |
| Kang & Dingwell (2006) [46] | no | yes | no | 20 | nm | TM |
| Kang & Dingwell (2008) [60] | no | no | no | 36 | 12/24 | TM |
| Kyvelidou et al. (2008) [47] | no | yes | yes | 20 | 20/0 | TM |
| Liu et al. (2012) [52] | yes | yes | no | 12 | 7/5 | TM |
| Ohtaki et al. (2005) [48] | no | yes | no | 59 | 26/33 | OG |
| Qiao et al. (2018) [53] | yes | yes | no | 33 | 19/14 | TM |
| Reynard et al. (2014) [54] | yes | yes | yes | 100 | 50/50 | TM |
| Rogan et al. (2019) [37] | yes | no | no | 26 | nm | OG |
| Segal et al. (2008) [49] | no | yes | no | 19 | 5/14 | TM |
| Toebes et al. (2016) [61] | no | no | no | 16 | 9/7 | TM |
| Worms et al. (2016) [38] | yes | no | no | 28 | 20/8 | TM |
| Yang et al. (2014) [39] | yes | no | no | 187 | 187/0 | TM |
Table 2.
Fall risk assessment tools used across studies.
| Questionnaire | Description | Clinical Assessment | Description |
|---|---|---|---|
| Anamnestic questionnaire [28] | Focusing on participants’ physical condition and fall history in the 3 months prior the measurement. | Tinetti Balance Assessment Tool (TBAT) [28,32] | Assesses the gait and balance in older adults and perception of balance and stability during activities of daily living and fear of falling. |
| Fall history questionnaire [3,28,29,30,31,33,38,40,42,50] | Self-reported medical questionnaires also indicated participants had recent histories of falling (at least one fall within 6 months, 3 months or one year). | Single leg stance test [63] | Assesses static postural and balance control |
| Survey of Activities and Fear of Falling in the Elderly (SAFE) [63] | Includes one scale and one subscale: the scale asks participants whether they perform a series of 11 activities of daily living and, if so, their level of fear of falling during the activity (Fear of Falling subscale). A separate subscale (Activity Restriction subscale) asks participants to rate the extent to which they currently engage in each activity relative to five years ago. | Timed Up and Go [63] | Determines fall risk and measures the progress of balance, sitting to standing and walking |
| The Movement Specific Reinvestment Scale (MSRS) [38] | It is a measure of the propensity for movement-related self-consciousness and for conscious processing of movement and was used to try to discriminate elder fallers from non-fallers. | 10 m Walk Test [63] | It is a performance measure used to assess walking speed in meters per second over a short distance. It can be employed to determine functional mobility, gait and vestibular function. |
| The Falls Efficacy Scale International (FES-I) [38] | A measure quantifying an individual’s concern about falling during various tasks, yielding a score between 16 (low concern about falling) and 64 (high concern about falling). | “Figure 8” Walk [63] | Measures the everyday walking ability of older adults with mobility disabilities. It tests a participant’s gait in both straight and curved paths. |
| The Longitudinal Aging Study Amsterdam Physical Activity Questionnaire (LAPAQ) [30] | A 31-point questionnaire that covers the frequency and duration of walking outside, bicycling, gardening, light household activities, heavy household activities, and a maximum of two sport activities during the previous two weeks. | Four Square Step [63] | Assesses dynamic stability and the ability of the subject to step over low objects forward, sideways, and backward. |
| Mini mental estate examination score (MMSE) [37,38,56,57,58] | A 30-point questionnaire that is used extensively in clinical and research settings to measure cognitive impairment. | Clinical balance assessment (static balance on force plate) [3] | Determine a patient’s ability (or inability) to safely balance during a series of predetermined tasks. It does not include the assessment of gait. |
Publisher’s Note: MDPI stays neutral with regard to jurisdictional claims in published maps and institutional affiliations. |
© 2022 by the authors. Licensee MDPI, Basel, Switzerland. This article is an open access article distributed under the terms and conditions of the Creative Commons Attribution (CC BY) license (https://creativecommons.org/licenses/by/4.0/).
Share and Cite
MDPI and ACS Style
Amirpourabasi, A.; Lamb, S.E.; Chow, J.Y.; Williams, G.K.R. Nonlinear Dynamic Measures of Walking in Healthy Older Adults: A Systematic Scoping Review. Sensors 2022, 22, 4408. https://0-doi-org.brum.beds.ac.uk/10.3390/s22124408
AMA Style
Amirpourabasi A, Lamb SE, Chow JY, Williams GKR. Nonlinear Dynamic Measures of Walking in Healthy Older Adults: A Systematic Scoping Review. Sensors. 2022; 22(12):4408. https://0-doi-org.brum.beds.ac.uk/10.3390/s22124408
Chicago/Turabian StyleAmirpourabasi, Arezoo, Sallie E. Lamb, Jia Yi Chow, and Geneviève K. R. Williams. 2022. "Nonlinear Dynamic Measures of Walking in Healthy Older Adults: A Systematic Scoping Review" Sensors 22, no. 12: 4408. https://0-doi-org.brum.beds.ac.uk/10.3390/s22124408
Note that from the first issue of 2016, this journal uses article numbers instead of page numbers. See further details here.