
Predictive System Implementation to Improve the Accuracy of Urine Self-Diagnosis with Smartphones: Application of a Confusion Matrix-Based Learning Model through RGB Semiquantitative Analysis


Abstract
:1. Introduction
2. Materials and Methods
3. Results
4. Discussion
5. Conclusions
Author Contributions
Funding
Institutional Review Board Statement
Informed Consent Statement
Data Availability Statement
Conflicts of Interest
References
- Prah, J.K.; Amoah, S.; Ocansey, D.W.; Arthur, R.; Walker, E.; Obiri-Yeboah, D. Evaluation of urinalysis parameters and antimicrobial susceptibility of uropathogens among out-patients at University of Cape Coast Hospital. Ghana Med. J. 2019, 53, 44–51. [Google Scholar] [CrossRef] [PubMed]
- Yang, C.J.; Chen, D.P.; Wen, Y.H.; Lai, N.C.; Ning, H.S. Evaluation the diagnostic accuracy of albuminuria detection in semi-quantitative urinalysis. Clin. Chim. Acta 2020, 510, 177–180. [Google Scholar] [CrossRef] [PubMed]
- Allison, B.C.; Tam, T.V. Revisiting approaches to and considerations for urinalysis and urine culture reflexive testing. Crit. Rev. Clin. Lab. Sci. 2022, 59, 112–124. [Google Scholar] [CrossRef]
- Stern, M.; Maldonado, U.; Usyk, M.; Granja, I.; Schoenfeld, D.; Kelvin, P.; Agalliu, I.; Asplin, J.; Burk, R.; Sylvia, O. Fecal transplant modifies urine chemistry risk factors for urinary stone disease. Physiol. Rep. 2019, 7, e14012. [Google Scholar] [CrossRef] [Green Version]
- Chaudhari, P.P.; Monuteaux, M.C.; Bachur, R.G. Microscopic Bacteriuria Detected by Automated Urinalysis for the Diagnosis of Urinary Tract Infection. J. Pediatr. 2018, 202, 238–244. [Google Scholar] [CrossRef]
- Sonali, D.A.; Christopher, R.P.; Mohamad, G.F. Deconstructing the urinalysis: A novel approach to diagnostic and antimicrobial stewardship. Antimicrob. Steward. Healthc. Epidemiol. 2021, 1, 1–5. [Google Scholar] [CrossRef]
- Kavuru, V.; Vu, T.; Karageorge, L.; Choudhury, D.; Senger, R.; Robertson, J. Dipstick analysis of urine chemistry: Benefits and limitations of dry chemistry-based assays. Postgrad. Med. 2019, 132, 225–233. [Google Scholar] [CrossRef]
- Chu, C.M.; Lowder, J.L. Diagnosis and treatment of urinary tract infections across age groups. Am. J. Obstet. Gynecol. 2018, 219, 40–51. [Google Scholar] [CrossRef]
- Lei, R.; Huo, R.; Mohan, C. Current and emerging trends in point-of-care urinalysis tests. Expert Rev. Mol. Diagn. 2019, 20, 69–84. [Google Scholar] [CrossRef]
- Young, P.E.; Diaz, G.J.; Kalariya, R.N.; Mann, P.A.; Benbrook, M.N.; Avandsalehi, K.R.; Pertersen, J.R. Comparison of the time required for manual (visually read) and semiautomated POCT urinalysis and pregnancy testing with associated electronic medical record (EMR) transcription errors. Clin. Chim. Acta 2020, 504, 60–63. [Google Scholar] [CrossRef]
- Rahmat, R.F.; Royananda, M.A.; Muchtar, R.; Taqiuddin, S.; Adnan, R.; Anugrahwaty, R.; Budiarto, R. Automated color classification of urine dipstick image in urine examination. J. Phys. Conf. Ser. 2018, 978, 1–8. [Google Scholar] [CrossRef]
- Silva, V.; Sacomboio, E.; Raimann, J.; Evans, R.; Sebastião, C.; Tchivango, A.; Kotanko, P.; Levin, N.; Filho, R. Diagnostic performance of salivary urea nitrogen dipstick to detect and monitor acute kidney disease in patients with malaria. Malar. J. 2018, 17, 1–8. [Google Scholar] [CrossRef]
- Luque, A.; Carrasco, A.; Martín, A.; de las Heras, A. The impact of class imbalance in classification performance metrics based on the binary confusion matrix. Pattern Recognit. 2019, 91, 216–231. [Google Scholar] [CrossRef]
- Nagle, M.; Gonçalves, R.; Brazolin, S.; Palma, A.S.S.; Pereira, R.G.F. Reliability of tomographic image to represent variation in stem wood properties assessed using confusion matrix metrics. Wood Sci. Technol. 2022, 56, 921–945. [Google Scholar] [CrossRef]
- Jiwen, X.; Yong, Z.; Ziliang, C.; Wanjun, W.; Caifeng, W. A 3D printed centrifugal microfluidic platform for automated colorimetric urinalysis. Microsyst. Technol. 2019, 26, 291–299. [Google Scholar] [CrossRef]
- Fu, Q.; Zhang, X.C.; Li, J.; Zhaohui, Q. Ambient light sensor based colorimetric dipstick reader for rapid monitoring organophosphate pesticides on a smart phone. Anal. Chim. Acta 2019, 1092, 126–131. [Google Scholar] [CrossRef]
- Daniel, M.; Daniel, K.S.; Judith, C.; Peter, C.; Adam, S.; Nina, H. The complete calibration of the color–redshift relation (C3R2) survey: Analysis and data release 2. Am. Astron. Soc. 2019, 877, 81. [Google Scholar] [CrossRef] [Green Version]
- Konnaiyan, K.; Cheemalapati, S.; Gubanov, M.; Pyayt, A. mHealth Dipstick Analyzer for Monitoring of Pregnancy Complications. IEEE Sens. J. 2017, 17, 7311–7316. [Google Scholar] [CrossRef]
- Woodburn, E.; Long, K.; Brian, T. Cunningham. Analysis of paper-based colorimetric assays with a smartphone spectrometer. IEEE Sens. J. 2018, 19, 508–514. [Google Scholar] [CrossRef]
- Adams, J.D.; Capitan-Jimenez, C.; Burchfield, J.M.; Jansen, L.T.; Kavouras, S.A. Smartphone-Based Analysis of Urine Reagent Strips Is Inaccurate for Assessing Underhydration. Telemed. e-Health 2019, 26, 683–686. [Google Scholar] [CrossRef]
- Kanako, I.; Masaharu, A.; Izumi, M.; Chikako, I.; Emi, A.; Miharu, U.; Kaoru, O.; Teruto, H. Comparison of dipstick and quantitative tests for proteinuria and hematuria in middle-aged, male Japanese employees: A single-center study. Health Sci. Rep. 2021, 4, e267. [Google Scholar] [CrossRef]
- Oyaert, M.; Himpe, J.; Speeckaert, M.; Stove, V.; Delanghe, J. Quantitative urine test strip reading for leukocyte esterase and hemoglobin peroxidase. Clin. Chem. Lab. Med. 2018, 56, 1126–1132. [Google Scholar] [CrossRef]
- Khan, L.B.; Read, H.M.; Titchie, S.R.; Proft, T. Artificial Urine for Teaching Urinalysis Concepts and Diagnosis of Urinary Tract Infection in the Medical Microbiology Laboratory. J. Microbiol. Biol. Educ. 2017, 18, 40. [Google Scholar] [CrossRef] [Green Version]
- Arnold, C.P.; Febus Reidj, G.C.; Leonardo, D.V.; Jesus Paolo, T.M.; Arnold, M.C.; Jerome, B.T.; Rachelle Geleen, S.T. Measurement of Specific Gravity, Urobilinogen, Blood, Protein and pH Level of Urine Samples Using Raspberry Pi based Portable Urine Test Strip Analyzer. In Proceedings of the 2020 10th International Conference on Biomedical Engineering and Technology (ICBET 2020), Tokyo, Japan, 15–18 September 2020; pp. 58–63. [Google Scholar] [CrossRef]
- Salmon, B.P.; Kleynhans, W.; Schwegmann, C.P.; Olivier, J.C. Proper comparison among methods using a confusion matrix. In Proceedings of the 2015 IEEE International Geoscience and Remote Sensing Symposium (IGARSS), Milan, Italy, 26–31 July 2015; pp. 3057–3060. [Google Scholar] [CrossRef]
- Jeyaraj, P.R.; Samuel Nadar, E.-R. Computer-assisted medical image classification for early diagnosis of oral cancer employing deep learning algorithm. J. Cancer Res. Clin. Oncol. 2019, 145, 829–837. [Google Scholar] [CrossRef]
- Hong, C.S. Confusion plot for the confusion matrix. J. Korean Phys. Soc. 2021, 32, 427–437. [Google Scholar] [CrossRef]
- Singh, O.; Teo, A. Real-time human respiration carbon dioxide measurement device for cardiorespiratory assessment. J. Breath Res. 2018, 15, 026003. [Google Scholar] [CrossRef] [Green Version]
- Ong, P.M.B.; Punzalan, E.R. Comparative Analysis of RGB and HSV Color Models in Extracting Color Features of Green Dye Solutions; Presented at the DLSU Research Congress; De La Salle University: Manila, Philippines, 2014; pp. 1–7. [Google Scholar]
- Daniel, R.M.; Brian, D.G. Using GraphPad prism’s heat maps for efficient, fine-grained analyses of single-case data. Behav. Anal. Pract. 2022, 15, 505–514. [Google Scholar] [CrossRef]
- Burke, A.E.; Thaler, K.M.; Geva, M.; Adiri, Y. Feasibility and acceptability of home use of a smartphone-based urine testing application among women in prenatal care. Am. J. Obstet. Gynecol. 2019, 221, 527–528. [Google Scholar] [CrossRef]
- Akraa, S.; Anh Pham, T.T.; Shen, H.; Tang, Y.; Tang, B.Z.; Li, J.; Walker, S. A smartphone-based point-of-care quantitative urinalysis device for chronic kidney disease patients. J. Netw. Comput. Appl. 2018, 115, 59–69. [Google Scholar] [CrossRef]
- Vaggers, S.; Puri, P.; Wagenlehner, F.; Somani, B.K. A Content Analysis of Mobile Phone Applications for the Diagnosis, Treatment, and Prevention of Urinary Tract Infections, and Their Compliance with European Association of Urology Guidelines on Urological Infections. Eur. Urol. Focus. 2020, 7, 198–204. [Google Scholar] [CrossRef]
- Johnson, S.; Stanford, J.; Warren, G.; Bench-Capon, S. Increased Likelihood of Pregnancy Using an App-Connected Ovulation Test System: A Randomized Controlled Trial. J. Women’s Health 2020, 29, 84–90. [Google Scholar] [CrossRef] [PubMed] [Green Version]
- Ji, Y.H.; Kwak, Y.S.; Park, S.M.; Kim, Y.L. Compressive recovery of smartphone RGB spectral sensitivity functions. Opt. Express 2021, 29, 11947–11961. [Google Scholar] [CrossRef] [PubMed]
- Yang, R.; Cheng, W.; Chen, X.; Qian, Q.; Zhang, Q.; Pan, Y.; Duan, P.; Miao, P. Color Space Transformation-Based Smartphone Algorithm for Colorimetric Urinalysis. ACS Omega 2018, 3, 12141–12146. [Google Scholar] [CrossRef] [PubMed]
- Chung, W.-Y.; Ramezani, R.F.; Silverio, A.A.; Tsai, V.F. Development of a Portable Multi-Sensor Urine Test and Data Collection Platform for Risk Assessment of Kidney Stone Formation. Electronics 2020, 9, 2180. [Google Scholar] [CrossRef]
- Fechner, P.; Lockl, J.; Ruhland, N.; Zwede, T.; Zürl, T. A Model for Predicting the Amount of Urine in the Bladder Based on App-generated Tracking Data. In Proceedings of the IEEE International Conference on Bioinformatics and Biomedicine (BIBM), Seoul, Korea, 16–19 December 2020; pp. 2952–2954. [Google Scholar] [CrossRef]
- Guilin, H. Missing data filling method based on linear interpolation and lightGBM. In Proceedings of the 2020 3rd International Symposium on Power Electronics and Control Engineering (ISPECE 2020), Chongqing, China, 27–29 November 2021; pp. 1–6. [Google Scholar] [CrossRef]
- Fan, Y.; Li, J.; Guo, Y.; Xie, L.; Zhang, G. Digital image colorimetry on smartphone for chemical analysis: A review. Measurement 2021, 171, 108829. [Google Scholar] [CrossRef]


| No. | Urine Analytes | R/G/B (Optimized) | Formula | Slope | R-Squared | Linearity | Reference Range |
|---|---|---|---|---|---|---|---|
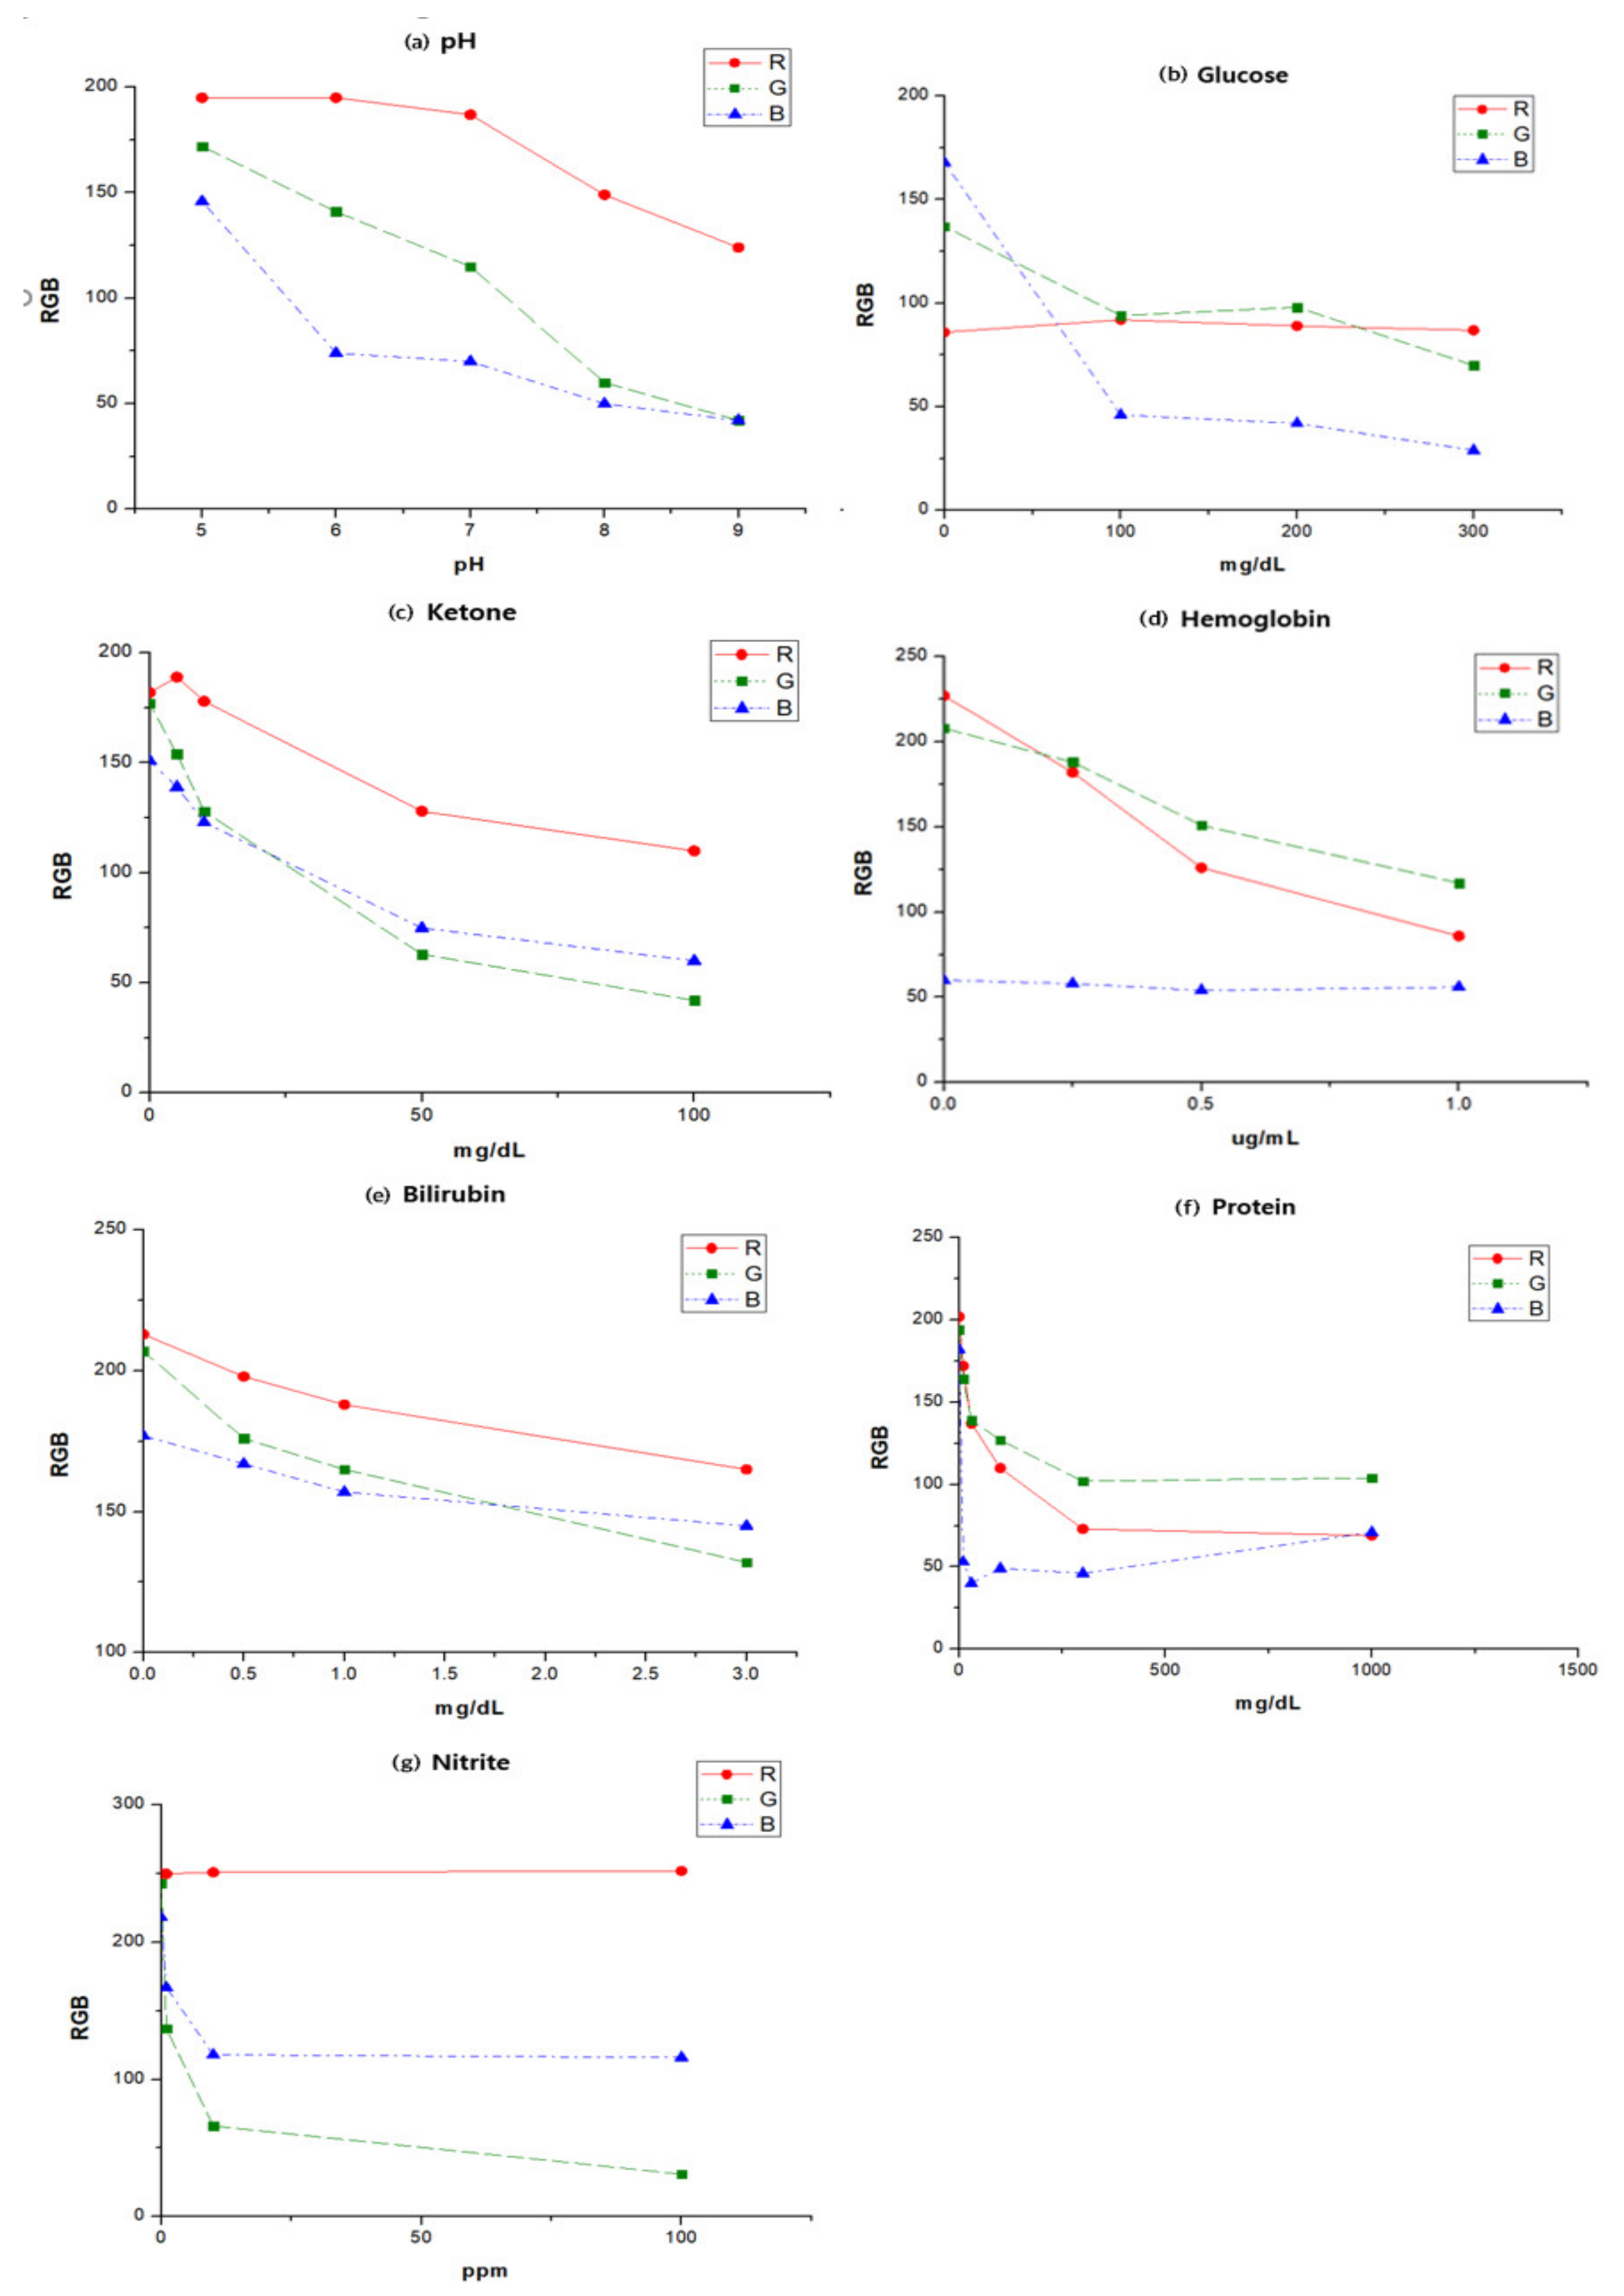
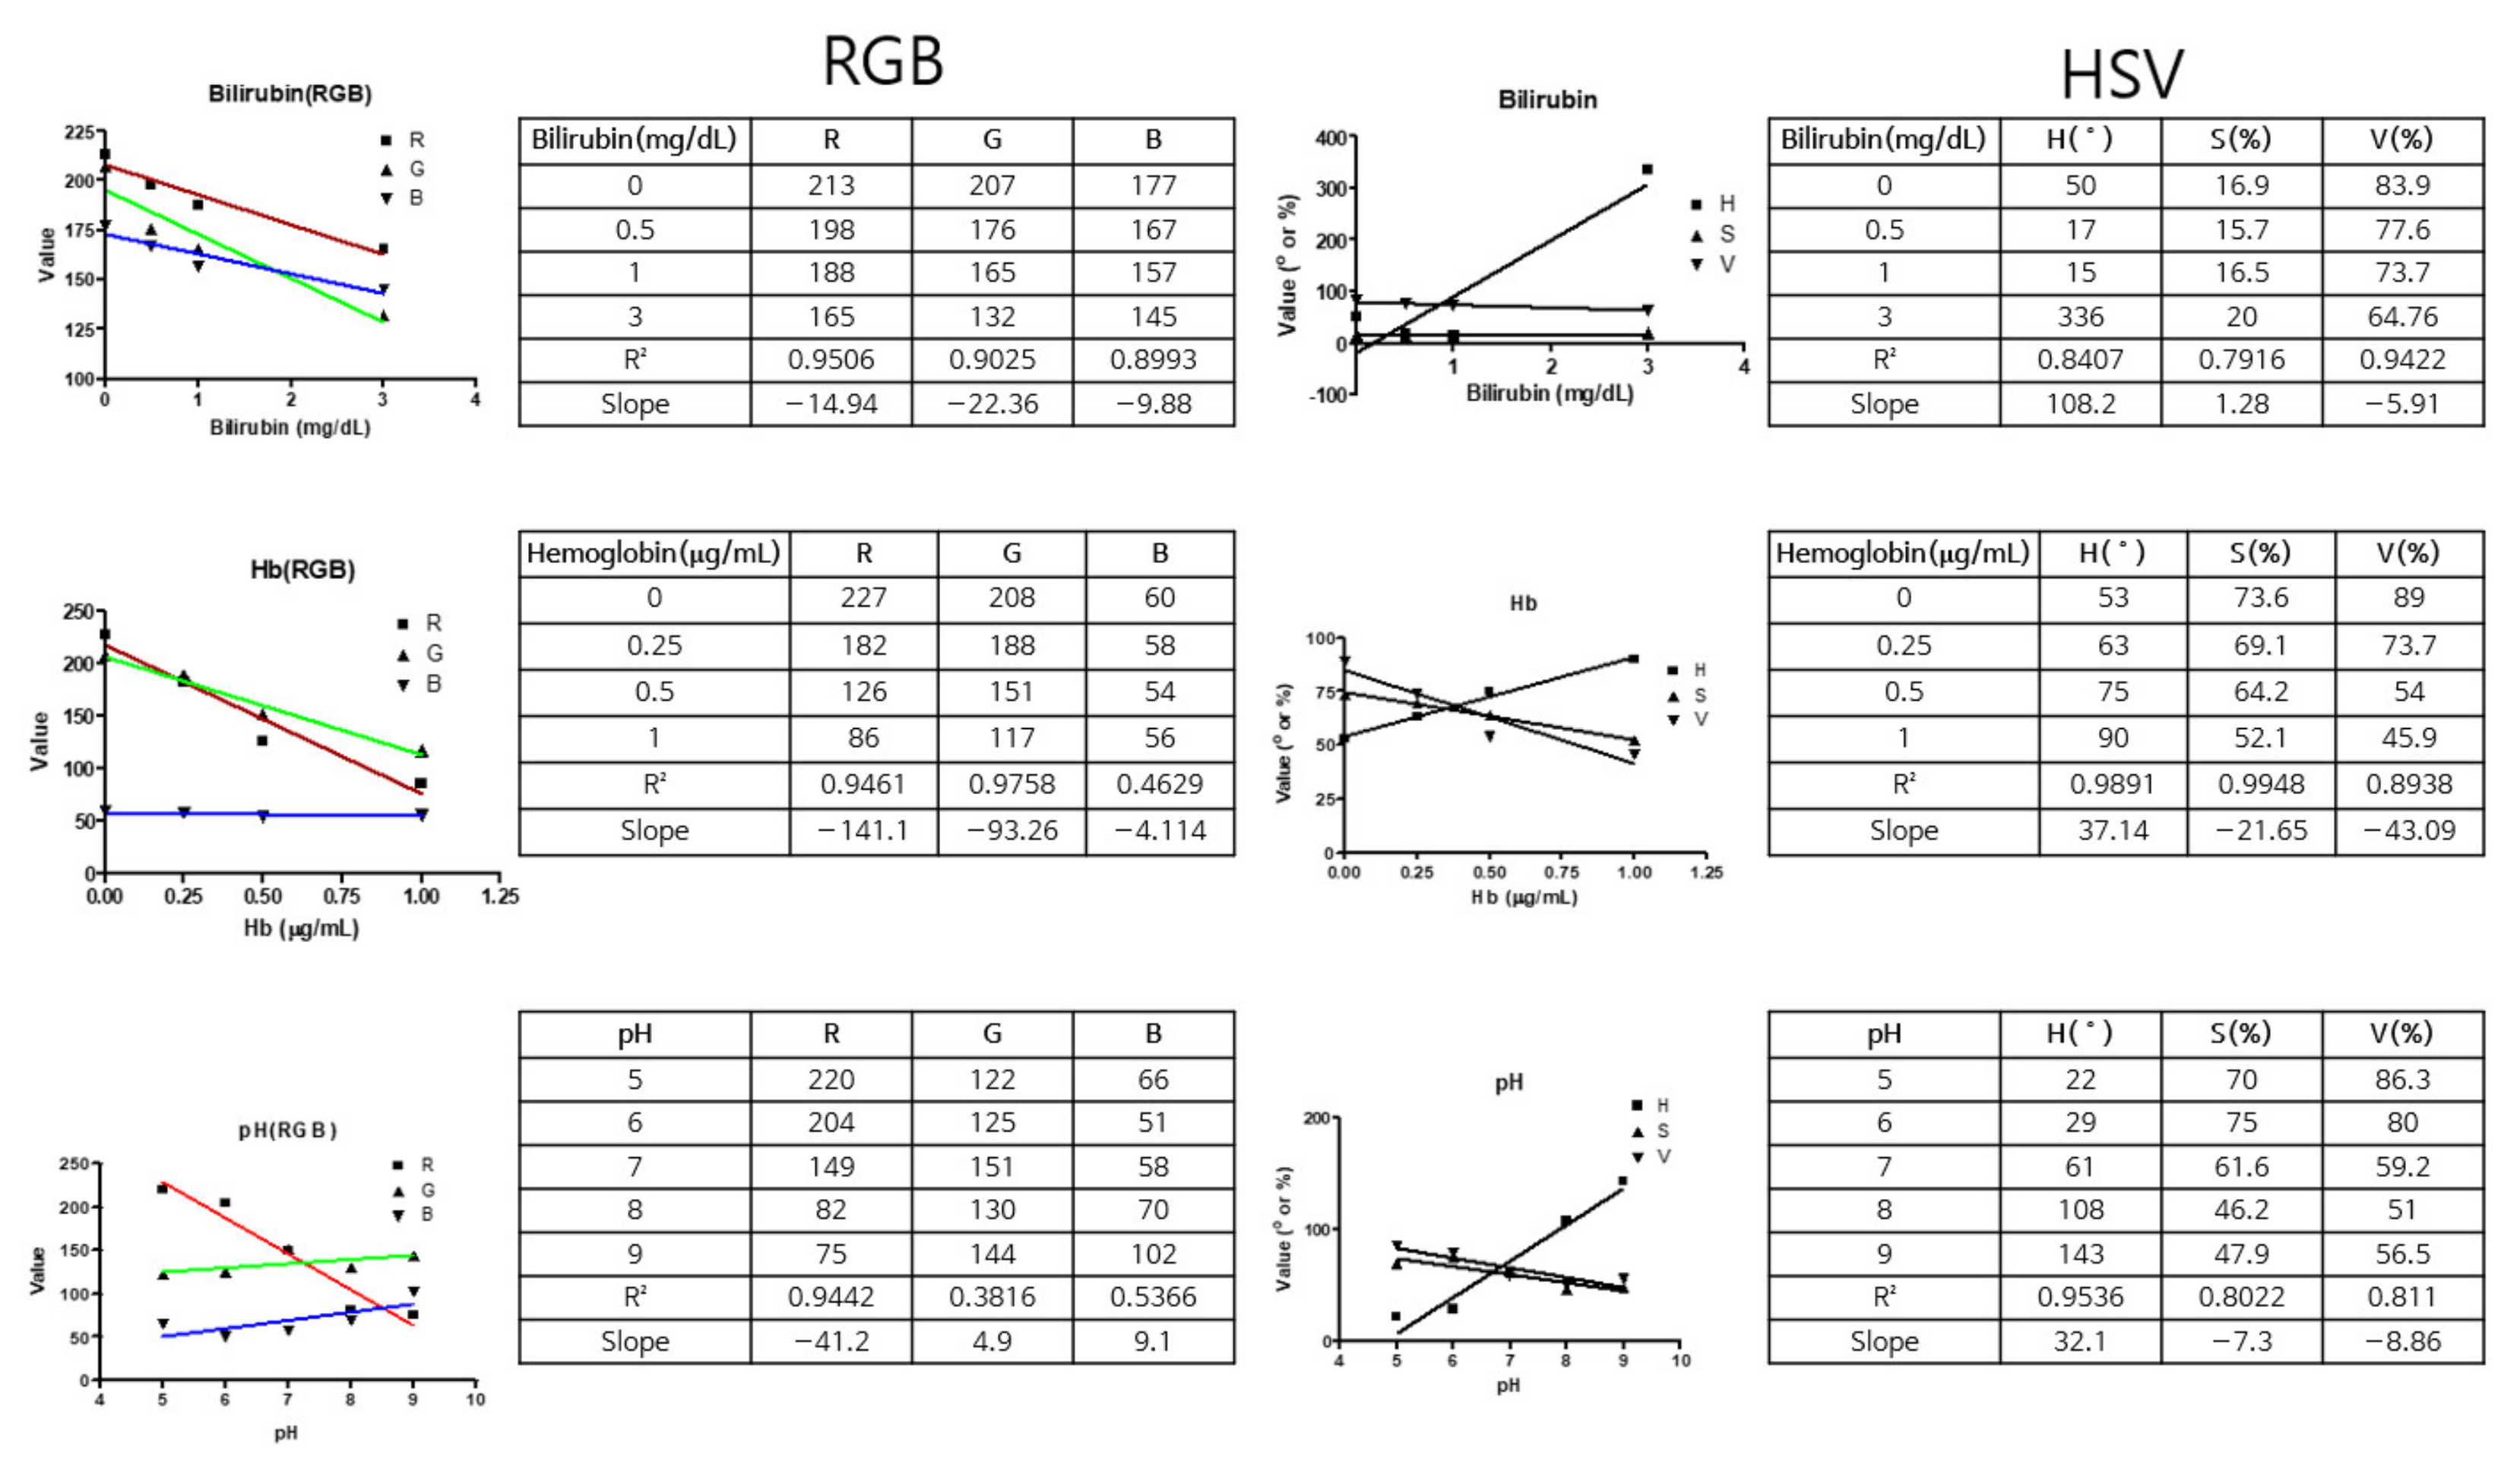
| 1 | pH | R | Y = −40.9 × X + 432.7 | −40.9 | 0.9442 | pH 5–9 | 4.8–7.4 |
| 2 | Glucose | B | Y = −0.3983 × X + 122.8 | −0.3983 | 0.9104 | 50–300 mg/dL | <20 mg/dL |
| 3 | Ketones | G | Y = −69.92 × log X + 189.1 | −69.92 | 0.9872 | 5–100 mg/dL(log) | <5 mg/dL |
| 4 | Hemoglobin | R | Y = −141.1 × X + 217 | −141.1 | 0.9461 | 0.25–1.0 ug/mL | - |
| 5 | Bilirubin | G | Y = −22.36 × X + 195.2 | −22.36 | 0.9025 | 0.5–3.0 mg/dL | <0.2 mg/dL |
| 6 | Protein (albumin) | R | Y = −48.88 × log X + 208.3 | −48.88 | 0.9682 | 10–1000 mg/dL(log) | <2 mg/dL |
| 7 | Nitrites | G | Y = −53 × log X + 131 | −53 | 0.963 | 1–100 mg/dL(log) | - |
| New | URiscan Pro | Smartphone | Accuracy | |||||||||
|---|---|---|---|---|---|---|---|---|---|---|---|---|
| New 1 | New 2 | New 3 | New 4 | Test 1 | Test 2 | Test 3 | Test 4 | Train 1 | Train 2 | Train 3 | Train 4 | 98.56% |
| New 1 | New 2 | New 3 | New 4 | Test 1 | Test 2 | Test 3 | Test 4 | Train 1 | Train 2 | Train 3 | Train 4 | 97.67% |
| New 1 | New 2 | New 3 | New 4 | Test 1 | Test 2 | Test 3 | Test 4 | Train 1 | Train 2 | Train 3 | Train 4 | 99.85% |
| New 1 | New 2 | New 3 | New 4 | Test 1 | Test 2 | Test 3 | Test 4 | Train 1 | Train 2 | Train 3 | Train 4 | 98.88% |
| Average | 98.74% | |||||||||||
Publisher’s Note: MDPI stays neutral with regard to jurisdictional claims in published maps and institutional affiliations. |
© 2022 by the authors. Licensee MDPI, Basel, Switzerland. This article is an open access article distributed under the terms and conditions of the Creative Commons Attribution (CC BY) license (https://creativecommons.org/licenses/by/4.0/).
Share and Cite
Kim, S.-C.; Cho, Y.-S. Predictive System Implementation to Improve the Accuracy of Urine Self-Diagnosis with Smartphones: Application of a Confusion Matrix-Based Learning Model through RGB Semiquantitative Analysis. Sensors 2022, 22, 5445. https://0-doi-org.brum.beds.ac.uk/10.3390/s22145445
Kim S-C, Cho Y-S. Predictive System Implementation to Improve the Accuracy of Urine Self-Diagnosis with Smartphones: Application of a Confusion Matrix-Based Learning Model through RGB Semiquantitative Analysis. Sensors. 2022; 22(14):5445. https://0-doi-org.brum.beds.ac.uk/10.3390/s22145445
Chicago/Turabian StyleKim, Seon-Chil, and Young-Sik Cho. 2022. "Predictive System Implementation to Improve the Accuracy of Urine Self-Diagnosis with Smartphones: Application of a Confusion Matrix-Based Learning Model through RGB Semiquantitative Analysis" Sensors 22, no. 14: 5445. https://0-doi-org.brum.beds.ac.uk/10.3390/s22145445