Article

The Effects of a Visual Stimuli Training Program on Reaction Time, Cognitive Function, and Fitness in Young Soccer Players

by
Georgia Theofilou
1,
Ioannis Ladakis
2,
Charikleia Mavroidi
1,
Vasileios Kilintzis
2,
Theodoros Mirachtsis
3,
Ioanna Chouvarda
2 and
Evangelia Kouidi
1,*
1
Laboratory of Sports Medicine, Department of Physical Education and Sports Sciences, Aristotle University of Thessaloniki (AUTh), P.C. 57001 Thessaloniki, Greece
2
Laboratory of Computing, Medical Informatics and Biomedical—Imaging Technologies, School of Medicine, Aristotle University of Thessaloniki, P.C. 54124 Thessaloniki, Greece
3
Ophthalmology Department, 424 Military Hospital, P.C. 56429 Thessaloniki, Greece
*
Author to whom correspondence should be addressed.
Submission received: 29 June 2022 / Revised: 9 August 2022 / Accepted: 1 September 2022 / Published: 3 September 2022

Abstract

:
The purpose of the present study was to examine whether a visual stimuli program during soccer training can affect reaction time (RT), cognitive function, and physical fitness in adolescent soccer players. Thirty-eight male soccer players aged 10–15 were randomly assigned to either the intervention (Group A) or the control group (Group B). At baseline and at the end of the 6-month study FITLIGHT Trainer, the Cognitive Function Scanner Mobile Test Suite, a Virtual Reality (VR) game, and the ALPHA—Fitness and the Eurofit test batteries were used to measure participants’ abilities. After the baseline assessment, Group A followed their regular soccer training combined with a visual stimuli program, while Group B continued their regular soccer training program alone for 6 months. At the end of the 6-month study, Group A showed statistically significant improvements in simple RT by 11.8% (p = 0.002), repeated sprints by 13.4% (p ≤ 0.001), and Pen-to-Point Cognitive Function by 71.62% (p < 0.001) and 72.51% for dominant and non-dominant hands, respectively. However, a between-groups analysis showed that there was no statistically significant difference between the two groups in most of the measurements studied. In conclusion, a visual stimuli training program does not seem to add any value to the traditional soccer training program for adolescents. Nevertheless, this study helps to underline the potential of newly emerging technology as a tool for the assessment of RT.

1. Introduction

Sports vision is an emerging field of ophthalmology aiming to enhance both visual function and athletic performance. In the existing literature, various studies have been conducted that indicate the importance of vision in sports performance [1,2,3,4]. In their study, Spera et al. presented interesting results regarding the impact of vision on postural stability, conducting an experiment between sighted and visually impaired athletes [5].
Several studies have shown that vision plays a significant role in sports practice and, therefore, visual education should be a significant part of athletes’ exercise training [6,7]. Soccer players were found to have better peripheral vision, depth perception, and visual tracking of a moving object compared to non-athletes [8]. The two main metrics/variables of sports vision are visual reaction time and peripheral vision [1,9]. Visual reaction time is directly associated with movement control and regulation processes that are affected by the central nervous system (CNS) and muscular effects. Motor reaction time is quite different as it is defined as the time between the signal and the completion of an action, including both sensory and motor characteristics [1,10]. It is clear vision plays a critical role for athletes as they have to carefully attend to and process the information from various visual stimuli related to the very concept of the specific sport. Optimal central–peripheral simultaneity is vital in this way [1,11,12].
It has been noticed that reaction time (RT) plays an important role in many fields, such as academics, sports, and daily life tasks [13,14,15]. It is related to the sensorimotor cycle, the detection of the initial stimulus, the transfer via the afferent nerves, the generation of the response by CNS, and the final response [13,16,17]. There is a differentiation between simple RT (SRT) and complex RT (CRT). The SRT is the interval between stimulus appearance and the given response [13,18], while the CRT is the recognition and selection of a response to various stimuli [13,19].
Several factors can influence the RT, such as exhaustion, physical fitness, experience, motivation, gender, age, or dominance of the extremity with which one responds. There are also other factors that are related to the stimulus, such as its intensity or duration [13,18,20,21]. Other important internal factors are the cognitive process and attention, which are involved in the RT [13,22,23,24]. They affect the activation and selection processes, distribution, and maintenance of psychological activity [13,25] and show anatomical and functional complexity [14,26]. One of its types especially, selective attention, includes the ability to attend to specific stimuli and ignore others [13,26,27].
Because of the rapid technological evolution and the emergence of new Virtual Reality (VR) solutions, there is an increased research interest in the role of VR in the evaluation of the physical performance and rehabilitation in patients with Parkinson’s, imbalance, stroke, etc. [28,29,30]. VR can be an important tool in the quick assessment of physical performance.
For the evaluation of RT in sports, a few studies have used the FITLIGHT TrainerTM (FITLIGHT Sports Corp., Canada). Specifically, Zwierko et al. showed that non-athletes had longer RTs compared to handball players [31], while Fischer et al. [32] reported the use of training and analysis of the RT in the United States Air Force [32]. Moreover, Zurek et al. investigated the simple and complex RTs of football players after knee surgery and a rehabilitation program [33].
The evaluation of the effectiveness of a visual training program in sports was investigated by Abernethy et al. [34]. Among the implemented stimuli were symbols, shapes, patterns, and colors. The stimuli were displayed in painted graphics or objects, and the participants were asked to respond with simple ocular adjustments combined with simple motor actions. Another study deployed Nike Vapor Strobe glasses for the assessment of sports training. The results indicated that the use of special training glasses enhanced central visual field motion sensitivity and transient attention abilities. However, there was no difference in their peripheral motion sensitivity and multiple-object tracking [35]. Although the aforementioned literature shows a strong relationship between RT and variables such as selective attention and physical condition, there is no study using VR technology for RT assessment and visual function analysis in young athletes.
Moreover, it has been observed that physical fitness has an impact on RT [13,36,37] by helping the development of cognitive function and different aspects of attention [13,38,39,40]. Moreover, some studies have shown that fit individuals are associated with quicker RTs [13,41,42]. Furthermore, it has been shown that cognitive processes and attention are involved in RT [13,22,23,24]. Therefore, the combination of physical exercise and the development of cognitive functioning could be an appropriate formula to improve RT not only in athletes but in the general population.
Thus, the aim of the study was to examine whether a visual stimuli program during soccer training can affect RT, cognitive function, and physical fitness in adolescent soccer players. Specifically, the research hypotheses of this study are:
  • There is a significant relationship between RT and physical performance, as well as cognitive function, in adolescent soccer players.
  • A visual stimuli training program can improve the RT, cognitive function, and physical performance of adolescent soccer players.

2. Materials and Methods

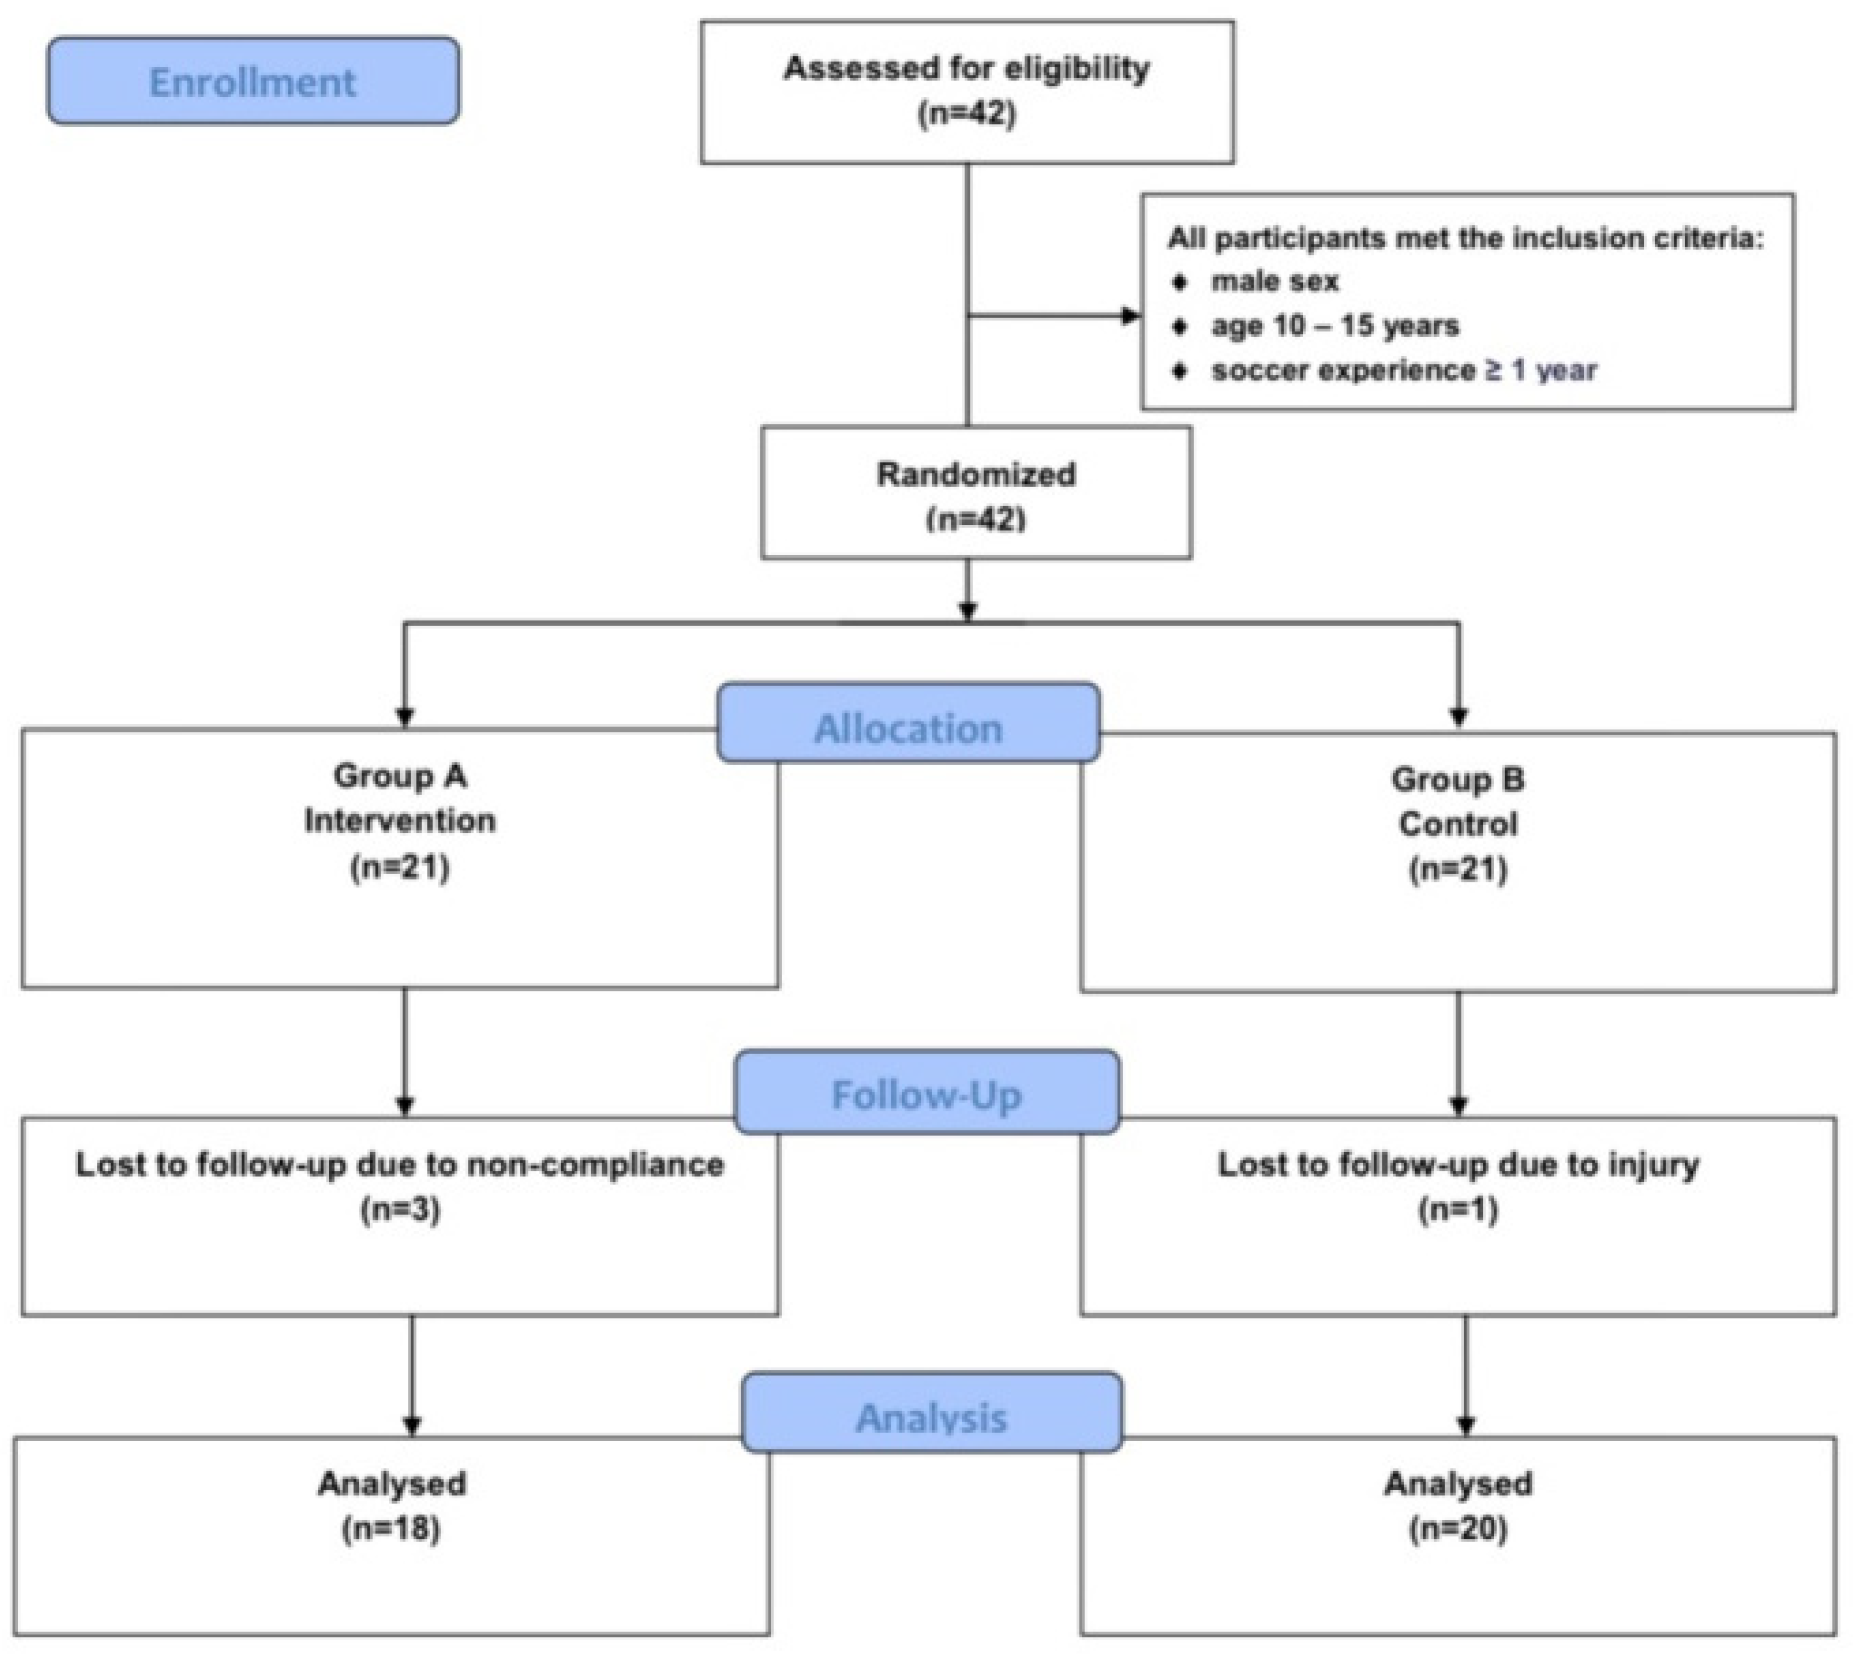
2.1. Study Population

This study is a randomized control trial that initially involved 42 male soccer players aged 10–15 without any ocular pathology. At the end of the 6-month duration of the study, 38 soccer players completed the study, 18 in the intervention group (Group A) and 20 in the control group (Group B). Their soccer experience was between 1 and 7 years.

2.2. Study Protocol

To carry out the research, a large, high-performance soccer academy in Northern Greece was contacted. The young soccer players and their parents were informed about the aim and methodology of the study. All baseline tests were performed within a day, in the morning hours, between 9:00 and 12:00 am. After a 5 min warm-up, the testing battery started with the repeated sprint test (5 min in total) and continued with the assessment of RT using FITLIGHT Trainer (10 min) and visual field VR test (up to 3 min). Thereafter, participants performed sit-and-reach (3 repetitions of 2 s, 1 s rest), a figure drawing test and pen-to-point test (both in seconds according to participant’s performance), hand grip test (3 repetitions of 2 s, 1 s rest), and manual dynamometry test (3 repetitions of 5 s, 10 s rest.), There was a 10 min rest between the different tests. The tests were clearly explained and shown. Practice trials were not provided. The tests were performed in different places of the sports facilities, and each participant was called separately.
After baseline assessment, volunteers were randomly divided into two groups using the program http://www.randomizer.org/ (accessed on 2 September 2021). Athletes of group A followed a 6-month soccer training program with visual stimuli 5 times per week, lasting 15 min each time, which preceded their regular soccer training program. Soccer players of Group B followed the standard soccer training program but without any visual stimuli. The soccer training protocols of the developmental age guide of the Hellenic Football Federation suggest an individual training program according to position (goalkeeper, defender, midfielder, and forwarder) for athletes aged 10–12 years old and a subgroup training program for athletes aged 13 to 15 years old. In this case, the athletes were divided into two subgroups playing against each other. The most common combination was one subgroup consisting of the goalkeeper, the defenders, and half of the midfielders and the other subgroup consisting of the other half of the midfielders and forwarders. The athletes had to attend at least the 85% of the exercise training sessions to be included in the analysis. After the 6-month period, the measurements were repeated in both groups. All assessors were blinded to the athlete’s group allocation.
In addition, informed and written consent was obtained from parents or legal guardians of the soccer players. The required approval was obtained from the Ethics Committee of the Faculty of Physical Education and Sport Sciences of the Aristotle University of Thessaloniki (approval number 68/2021).

2.3. Measurements

2.3.1. Reaction Time Assessment

The FITLIGHT Trainer (FITLIGHT Sports Corp., Aurora, ON, Canada) was used to measure the RT. This is a wireless system consisting of three sensors, which were placed in front of each athlete in a semicircular arrangement with a radius of 35 cm and a distance of 20 cm between them. Each unit was switched on and off when the trainee passed the lower extremity over it. Two measurements were performed on each athlete, and the simple RT (SRT) and complex RT (CRT) were calculated. In the first measurement, the athlete used the dominant lower extremity, and in the second, the athlete used the dominant lower extremity when the illuminated unit gave a green stimulus and the non-dominant one when given a red stimulus.

2.3.2. Physical Fitness Assessment

To assess physical fitness, athletes were asked to perform selected tests from the European Physical Fitness Test Battery (EUROFIT) [43] and the Assessing Levels of Physical Activity (ALPHA) Health-Related Fitness Test Battery for Children and Adolescents [44]. Specifically, the following tests were carried out:
(a)
Manual dynamometry
KForce Link (Kinvent Biomecanique, Montpellier, France; Sf = 75 Hz) pull dynamometer was used to assess the isometric mid-thigh pull forces. The dynamometer was linked to a chain with a bar end. Each athlete was asked to pull the bar as strongly as possible. The test was repeated three times. The dynamometer was wirelessly linked to the mobile app, where the results were stored. The value of interest for our measurements was RFD (rate of force development), which depicts the ability of a muscle to apply force very quickly and is directly related to performance.
(b)
Hand grip
A digital hand grip dynamometer (Jamar Smart Hand Dynamometer, PATTERSON MEDICAL, Saint Paul, MN, USA) was used. Firstly, the athlete held the instrument using the dominant hand. The task was to grip it as strongly as possible without supporting the hand on the body. The test lasted 2 s and was repeated 3 times. Then, the procedure was repeated for the non-dominant hand. The best of the three efforts for each hand was written down.
(c)
Sit-and-reach test
To assess flexibility, each athlete was asked to sit on the floor with legs stretched out straight ahead. The athlete was placing the soles against a wooden box with the knees pressed flat to the floor. Placing the hand on top of each other, the athlete was to bend forward along a measuring scale as far as possible. After some trials, the athlete bent forward and was instructed to keep that position for 1–2 seconds. During this period, the distance reached was recorded.
(d)
Repeated Sprint test
To assess speed, agility, and coordination, 2 parallel lines at a 5 m distance were drawn, and each line was 1.2 m in length. We put cones at both ends of the 2 lines, and we asked each athlete to run as fast as possible to the other line and come back, with both feet behind the lines when reaching them, and repeat this 5 times.

2.4. Cognitive Tests

The assessment of the cognitive function was performed using a cognitive function test application (Cognitive Function Scanner Mobile Test Suite, Denmark), the figure drawing test, and the pen-to-point test to evaluate isuomotor functioning.
(a)
Figure Drawing Test
Each athlete was instructed to take the pen (pencil) in the left/right hand (dominant hand). The task was to draw on top of the curved line as accurately as possible. The athlete began up from the top mark and drew all the way round. The direction was chosen by the athlete and was to have remained the same until the end of the measurement. Time was measured, but accuracy was the most important factor. There were not to be lifts of the pen. The hand of the initial measurement was the dominant hand. We repeated the procedure for the non-dominant hand.
(b)
The Pen-to-Point Test
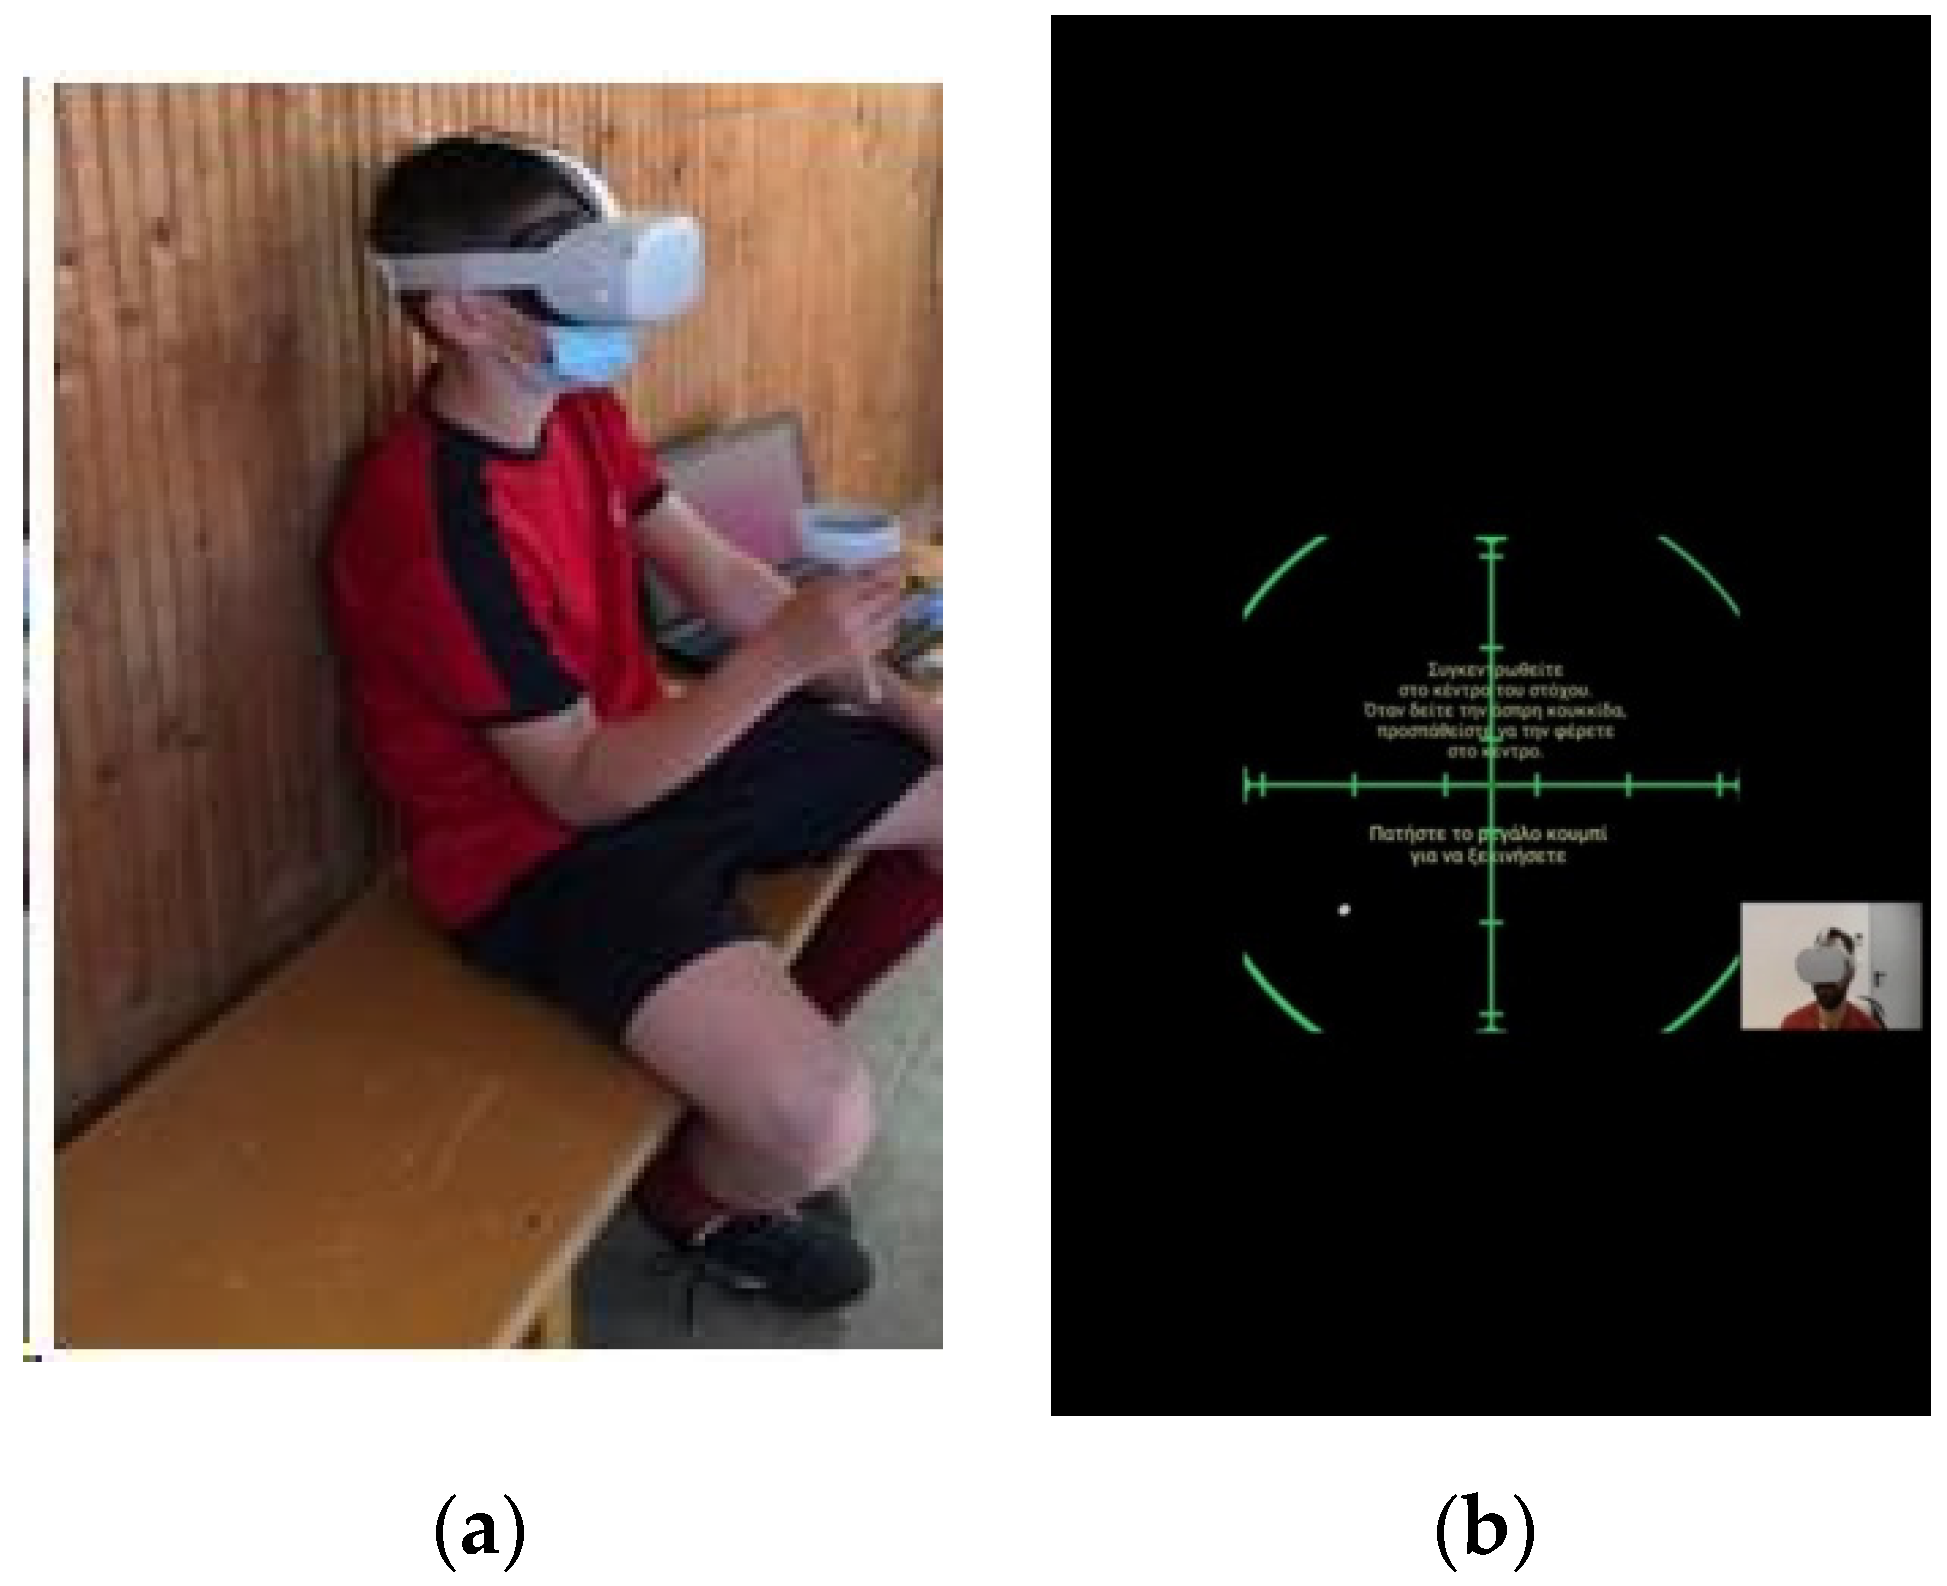
In this test, the athlete began with the dominant hand again. The task was to point to the center of each cross in this line (point out the line of crosses) with the tip of the digital pen (pencil). The test was repeated using the non-dominant hand.

2.5. Visual Field

The assessment of the visual field was completed using an application and wearable VR equipment (Oculus GO—Oculus Quest 2) designed and programmed by the Laboratory of Computing, Medical Informatics and Biomedical—Imaging Technologies of Aristotle University of Thessaloniki, School of Medicine. The intention of the application is to miniaturize the VF test to be provided as an efficient tool for standard clinical practice. Each athlete watched a green cross and had to focus on its center, and an illuminating white ball appeared from different angles from the periphery (Figure 1). The athlete had to press the button of a remote control as fast as possible after the moment the ball appeared. The application internally calculates the different angles of appearance of the ball (angle φ in rad), the RT (s), extracts descriptive statistics regarding the calculated features and provides the final isopter of the examinee (unilateral and bilateral).

2.6. Visual Stimuli Soccer Training Program

After baseline assessment, athletes of Group A followed their regular soccer training combined with the visual stimuli program 5 times per week for 6 months. Each training session started with the visual stimuli training program, which lasted 15 min, and then continued with the regular soccer training program. The visual stimuli program included technical exercises (transfer, reception, driving, shooting), as well as exercises for strengthening, reflexes, and neuromuscular coordination using light sensors (Blazepod Flash Reflex Training System, Miami, FL, USA), a soccer ball, and training cones.
A random combination of 8 different exercises was followed for 15 min in each training session only for Group A. The exercises were the following:
Exc. 1 (shooting): The athlete was in front of the goalpost, and when the illuminated sensor gave a green light, he had to shoot.
Exc. 2 (skipping): The athlete had to skip when the illuminated sensor gave a green light, and he had to stop when the sensor gave a red light.
Exc. 3 (shooting): The athlete had to shoot to the goalpost using the dominant leg when the illuminated sensor gave a green light and use the non-dominant leg when the illuminated sensor gave a red light.
Exc. 4 (ball driving): The athlete had to drive the ball when the illuminated sensor gave a green light and had to stop when the illuminated sensor gave a red light.
Exc. 5 (transfer—reception): The athlete had to exchange shots with the coach, screaming the color of the illuminated sensor at the time.
Exc. 6 (reflexes): Two athletes stood in front of each other with three illuminated sensors between them. The task was who would first touch the illuminated sensor.
Exc. 7 (abs/strengthening): The athlete had to perform a plank by supporting the body either on the palms or on the elbows and had to pass the hands alternately over the illuminated sensors.
Exc. 8 (strengthening): The athlete had to jump/side jump when the illuminated sensor gave a green light and stay still when the illuminated sensor gave a red light.
Athletes aged 10–12 followed the exercises according to their position: goalkeeper—exercises 1, 2, 3, 7, 8; defenders—exercises 4, 5, 7, 8; midfielders—exercises 4, 5, 6, 7; forwards—all exercises, but mainly 1, 3, 4, 7, 8. Athletes aged 13–15 years old performed exercises 1, 4, 5, 6.

2.7. Statistical Analysis of Data

Data are presented as mean ± SD. Data were analyzed using IBM SPSS Statistics v.27.0.1.0. The Shapiro–Wilk Test for normality was used. The normality test determined the method for statistical analysis. Paired t-test and Wilcoxon Ranks test were used to examine the mean differences between the two measurements within groups, while Mann–Whitney test and independent t-test were used to examine the mean differences (post-measurement—pre-measurement) between the two groups as well as to investigate between-groups differences in pre-test measurements. For some variables, ANCOVA analysis was performed to overcome the fact of initial differences. Moreover, Pearson and Spearman correlation analysis was used to study the association between age, experience, RTs, and RFD values. Finally, linear and multiple regression analyses were performed to add information for the relation between the captured measurements. Two-tailed p-values < 0.05 were considered statistically significant.

3. Results

During the 6-month study, four athletes (three from group A and one from B) dropped out of the study due to either injury or non-compliance (Figure 2). Generally, all athletes were very punctual and dedicated to the training program, and any absence was compensated with the valuable help of the coaches to fulfill the appropriate training hours. The mean age of the 38 athletes participating in the study was 12.24 ± 1.76 years old, and their mean soccer experience was 3.32 ± 2.32 years. All 38 athletes fulfilled at least 85% of all exercise training sessions and were analyzed. The clinical and anthropometric characteristics of the athletes at baseline and after 6 months are presented in Table 1. There was no statistically significant difference between the two groups’ clinical and anthropometric data. Although there was a statistically significant difference in the years they played soccer, there was no statistically significant difference in the physical fitness tests at baseline between the two groups, which indicates the homogeneity of the two groups.
Pre-test measurements were inspected to investigate the initial differences between the two groups. The only variables that showed significant differences were VF (U = 67, p < 0.001), pen-to-point dominant hand (U = 50, p = 0.003), and pen-to-point non-dominant hand (U = 35, p < 0.001). For these measurements, the differences between the two measurements and their statistical significance were examined using ANCOVA analysis. For the required ANCOVA analyses, the covariate was the pre-test measurement in each case, and the dependent variable was the post-test measurement.
After 6 months, Group A showed statistically significant improvement in SRT by 11.76% (p = 0.002, Table 2), repeated sprint by 13.36% (p < 0.001, Table 3), and pen-to-point cognitive function test by 71.62% (p < 0.001) for the dominant hand and 72.51% (p < 0.001) for the non-dominant hand (Table 4). Although VF RT decreased by 8.96%, this was not statistically significant (p = 0.384). At the end of the study, Group B showed lower percentages of improvement. The repeated sprint increased by 0.66% (p < 0.001) and the pen-to-point cognitive test increased by 64.08% (p < 0.001) for the dominant hand and by 58.28% (p = 0.002) for the non-dominant hand (Table 5). The Mann–Whitney and independent t-test showed statistically significant differences between the two groups for most of the physical fitness measurements, except for the hand grip test (Table 3). In addition, ANCOVA analysis showed significant between-groups differences for VF.
The RT results assessed using the VR technology are shown in Table 6. Both monocular and binocular isopters were normal for all participants. There was no statistically significant difference either in the within-group change or between the two groups.

3.1. Correlations

Pearson and Spearman correlation analysis (Table 7) was performed and showed significant correlations between age and soccer experience, between age, RT and RFD, and between soccer experience, VF test, and CRT in all athletes. Correlation analysis suggested that reaction time (SRT, CRT) was negatively associated with age; the older (and more experienced) athletes presented lower (quicker) reaction times for both measurements. Age—reaction time correlation seemed reasonable based on the gradual cognitive development of adolescents. In addition, experience was found to have positive effect on VF reaction time and CRT. The latter results also showed a significant relationship between the performance of complex tasks and the experience gained via years of soccer training and playing. Finally, soccer experience affects reaction time, as indicated by the correlation coefficients and the existing literature. Thus, athletes with more years of soccer experience tend to have lower reaction time.

3.2. Regression Analysis

Linear and multiple regression analysis were performed on the results of the second measurements taken at the end of the 6-month study to investigate the predictive nature of the measurements regarding FITLIGHT SRT.

3.2.1. Linear Regression

The results of linear regression analysis with SRT as the dependent variable in group A are presented in Table 8. The extracted linear regression models indicated significant relations of SRT variable with VR-VR (p < 0.001), CRT (p < 0.001), RFD (p = 0.006), repeated sprint (p = 0.014), hand grip left hand (p = 0.046), hand grip right hand (p = 0.032), and STR (p = 0.012).
The results showed that the aforementioned variables presented significant prediction capability of STR value. Based on these results, improvements in VR-RT and CRT have a proportional impact on SRT, as well as improvements on the physical fitness tests.

3.2.2. Multiple Regression

Multiple regression analysis (Table 9) was also performed for the second measurement taken at the end of the 6-month study in group A. The model that presented statistically significant results was the one that included all the variables as predictors (F(12, 5) = 13.199, p < 0.005, R2 = 0.9). From the coefficients, we observed that mainly VR-RT (t = 3.393, p = 0.019) added to the prediction of SRT. Thus, changes in VR-RT can contribute to changes in SRT.

4. Discussion

The objective of our study was to observe the effect of a visual stimuli training program on RT, physical condition, and cognitive function in adolescent soccer players. The results of the present study indicate that a 6-month visual training program did not add any further value to the traditional soccer training program in adolescents in regards to RT, physical fitness, and cognitive function.
Specifically, our results failed to prove the visual training program’s potential to enhance variables relevant to RT, physical fitness, and cognitive function in adolescent soccer players. Even though within-groups statistical tests (Wilcoxon Rank/Paired t tests) provided a positive outcome in favor of the visual training program showing statistically significant improvements in SRT, CRT, and cognitive function tests in the athletes who followed the program in comparison to the controls, between-groups statistical tests (Mann–Whitney/Independent t tests, ANCOVA) did not show statistically significant differences in the progress of the two groups. Thus, we cannot assume that the training program is actually effective, but its potential should be further investigated.
In total, our results indicated that RT plays an important role in improving athletic performance and that it can be trained by a visual stimuli program. Likewise, studies have shown that sports, which offer a variety of actions, can influence its development positively [13,45,46]. This is relevant in individual sports, such as swimming, sprint running, and badminton [13,47,48]; as well as in team sports, such as soccer or basketball [13,49,50,51], for quicker response and decision making. We have noticed a significant correlation between age and soccer experience and RT in all athletes. Interestingly, both factors were significantly correlated with CRT, which indicates the identification and selection of a response to various stimuli. This result is in agreement with previous studies that identified these associations [13,16,21,26]. CRT was found to be significantly related to attentional capacity and physical fitness in children and adolescents, suggesting the necessity of psychomotor development programs at that age [13]. Likewise, the athletes in our study had similar baseline performance levels and followed the same soccer training program except for the addition of the visual stimuli program in group A.
Our results showed that CRT values were higher than SRT for both groups due to the complexity of the task. According to the literature, sports vision training using stimuli is based on the idea that improving visual skills through oculomotor exercises results in sports performance improvement [1,35,48]. Indeed, visual stimuli training is a direct training approach of the oculomotor pathway. Physical condition, cognitive function, and attention have an impact on RT. Thus, the combination of physical exercise and the development of cognitive functioning can improve RT in people. The results of the present study support this claim.
Lastly, RT in VR measurements did not show any statistically significant improvement. This can be partly explained by considering that RT depends on age, cognitive process, and attention [21,22,23,24], which are very important factors in VR performance. The results of the present study showed statistically significant improvements in VR-RT only in our adolescents of Group A, possibly due to the stabilization of neural system development in this age group. We can assume that the RT in VR technology is similar to CRT due to its complexity. Linear regression analysis proved the similar predictive capability of VR-RT and CRT regarding SRT, a result that agrees with our assumption.
Another very important factor is neuroplasticity, which is the ability of the human brain to change continuously, and this involves dynamic, structural, and behavioral changes within the nervous system. Once someone achieves or reaches optimal patterns of function, the stabilization of the neural system is developed. Stabilization decreases the system’s capacity to adapt but does not eliminate it [52]. It has been found that exercise training affects the nervous system as it improves blood flow and increases the secretion of neurotrophins [53], which are proteins that regulate neural survival, development, function, synaptic function, and synaptic plasticity [54]. These effects improve the synaptic connectivity and promotes neurogenesis, which are believed to play an important role in enhancing neural plasticity and cognitive function. Neuroplasticity is also important for the improvement of physical fitness [53]. Thus, the improvement of physical and function in our athletes can be attributed to neuroplasticity and exercise-induced neural changes [53]. Keeping in mind all of these physiological processes, we can assume that neuroplasticity is the main factor that leads to the improvement in RT, cognitive function, and physical fitness.
This study has three main limitations. Firstly, the small size of the sample was mainly due to the 6-month duration of the program. Secondly, only males participated in the study, and finally, we only studied soccer players, mainly due to the popularity of this sport in youth. In any case, this research carries out an interesting analysis in which it has linked variables such as RT, cognitive function, and physical condition using visual stimuli training.

5. Conclusions

The results of the present study indicate that better development of attention and concentration (cognitive function), as well as physical fitness, could improve RT, leading to an improvement in athletic performance, especially during the developmental ages. The within-group improvements were not supported by between-groups significant differences in the progress of the two groups of adolescent athletes. Thus, the potential of a visual stimuli training program should be further investigated. The present study also showed the importance of the quick assessment of RT in the field, which can be achieved using VR technology. Thus, VR technology can be a helpful tool in the hands of coaches and health professionals in the future.

Author Contributions

Methodology, G.T., I.L., C.M., V.K. and E.K.; Formal analysis, G.T., I.L. and V.K.; Data curation, G.T., I.L. and E.K.; Writing—original draft preparation, G.T., I.L., I.C. and E.K.; Writing—review and editing, all authors; Supervision, T.M., I.C. and E.K. All authors have read and agreed to the published version of the manuscript.

Funding

This research received no external funding.

Institutional Review Board Statement

The study was conducted in accordance with the Declaration of Helsinki, and approved by the Ethics Committee of the Faculty of Physical Education and Sport Sciences of the Aristotle University of Thessaloniki (approval number 68/2021, 11 May 2021).

Informed Consent Statement

Studies involving human participants are reviewed and approved by the Ethics Committee of the Faculty of Physical Education and Sport Sciences of The Aristotle University of Thessaloniki (approval number 68/2021). Written informed consent to participate in this study was provided by the participants’ parents or legal guardians.

Data Availability Statement

The data of this study are uploaded on Clinicaltrials.gov and are available on request to the corresponding author.

Acknowledgments

Special thanks to the Cognitive Function Scanner Development Team for kindly granting the license of use of the application (Cognitive Function Scanner Mobile Test Suite) and the Laboratory of Computing, Medical Informatics and Biomedical—Imaging Technologies of Aristotle University of Thessaloniki, School of Medicine, for the permission to use the VR application and helping us with our measurements and statistical analysis of the data, as well as the Laboratory of Biomechanics, Department of Physical Education and Sports Sciences, Aristotle University of Thessaloniki (AUTh), for the KForce Link (Kinvent Biomecanique, Montpellier, France; Sf = 75 Hz) pull dynamometer.

Conflicts of Interest

This research was conducted in the absence of any commercial or financial relationships.

References

  1. Nascimento, H.; Martinez-Perez, C.; Alvarez-Peregrina, C.; Sánchez-Tena, M.A. Citations Network Analysis of Vision and Sport. Int. J. Environ. Res. Public Health 2020, 17, 7574. [Google Scholar] [CrossRef]
  2. Abernethy, B. Enhancing sports performance through clinical and experimental optometry. Clin. Exp. Optom. 1986, 69, 189–196. [Google Scholar] [CrossRef]
  3. Abernethy, B.; Wollstein, J. Improving anticipation in racquet sports. Sports Coach. 1989, 12, 15–18. [Google Scholar]
  4. Blundell, N.L. The contribution of vision to the learning and performance of sports skills: Part The role of selected visual parameters. Aust. J. Sci. Med. Sport 1985, 17, 3–11. [Google Scholar]
  5. Spera, R.; Belviso, I.; Sirico, F.; Palermi, S.; Massa, B.; Mazzeo, F.; Montesano, P. Jump and balance test in judo athletes with or without visual impairments. J. Hum. Sport Exerc. 2019, 14, S937–S947. [Google Scholar]
  6. Manso, J.M.G.; Campos, J.; Lizaur, P.; Pablo, C. El Talento Deportivo, 1st ed.; Gymnos: Madrid, Spain, 2003. [Google Scholar]
  7. Burris, K.; Vittetoe, K.; Ramger, B.; Suresh, S.; Tokdar, S.T.; Reiter, J.P.; Appelbaum, L.G. Sensorimotor abilities predict on-field performance in professional baseball. Sci. Rep. 2018, 8, 116. [Google Scholar] [CrossRef]
  8. Ciućmański, B.; Wątroba, J. Training selected visual perception abilities and the efficiency footballers. In Gry Zespołowe W Wychowaniu Fizycznym I Sporcie, 1st ed.; Żak, S.R., Spieszny, M., Klocek, T., Eds.; Studia i Monografie nr 33 AWF: Cracow, Poland, 2005; pp. 298–303. (In Polish) [Google Scholar]
  9. Planer, P.M. Sports Vision Manual, 1st ed.; International Academy of Sports Vision: Harrisburg, PA, USA, 1994. [Google Scholar]
  10. Raczek, J. Motor Coordination abilities: Their theoretical and empirical principles, and their meaning in sport. Sport Wyczyn. 1991, 5–6, 8–19. [Google Scholar]
  11. Espar, X. Balonmano, 1st ed.; Martínez Roca: Barcelona, Spain, 2001. [Google Scholar]
  12. Quevedo, L.; Solé, J. Visión periférica: Propuesta de entrenamiento. Apunt. Edu. Fís. Deportes 2007, 88, 75–80. [Google Scholar]
  13. Reigal, E.R.; Barrero, S.; Martin, I.; Morales-Sánchez, V.; Juárez-Ruiz de Mier, R.; Hernández-Mendo, A. Relationships Between Reaction Time, Selective Attention, Physical Activity, and Physical Fitness in Children. Front Psychol. 2019, 10, 2278. [Google Scholar] [CrossRef]
  14. Metin, B.; Wiersema, R.; Verguts, T.; Gasthuys, R.; Van Der Meere, J.J.; Roeyers, H.; Sonuga-Barke, E. Event rate and reaction time performance in ADHD: Testing predictions from the state regulation deficit hypothesis using an ex-Gaussian model. Child. Neuropsychol. 2016, 22, 99–109. [Google Scholar] [CrossRef]
  15. Sant’Ana, J.; Franchini, E.; da Silva, V.; Diefenthaeler, F. Effect of fatigue on reaction time, response time, performance time, and kick impact in taekwondo roundhouse kick. Sport Biomech. 2016, 16, 201–209. [Google Scholar] [CrossRef] [PubMed]
  16. Adleman, N.E.; Chen, G.; Reynolds, R.C.; Frackman, A.; Razdan, V.; Weissman, D.H.; Pine, D.S.; Leibenluft, E. Age-related differences in the neural correlates of trial-to-trial variations of reaction time. Dev. Cogn. Neurosci. 2016, 19, 248–257. [Google Scholar] [CrossRef] [PubMed]
  17. Greenhouse, I.; King, M.; Noah, S.; Maddock, R.J.; Ivry, R.B. Individual differences in resting corticospinal excitability are correlated with reaction time and GABA content in motor cortex. J. Neurosci. 2017, 37, 2686–2696. [Google Scholar] [CrossRef] [PubMed]
  18. Jayaswal, A.A. Comparison between auditory and visual simple reaction times and its relationship with gender in 1st year MBBS students of jawaharlal nehru medical college, Bhagalpur, Bihar. Int. J. Med. Res. Rev. 2016, 4, 1228–1232. [Google Scholar] [CrossRef]
  19. Boisgontier, M.P.; Wittenberg, G.F.; Fujiyama, H.; Levin, O.; Swinnen, S.P. Complexity of central processing in simple and choice multilimb reaction-time tasks. PLoS ONE 2014, 9, e90457. [Google Scholar] [CrossRef]
  20. Woods, D.L.; Wyma, J.M.; Yund, E.W.; Herron, T.J.; Reed, B. Factors influencing the latency of simple reaction time. Front. Hum. Neurosci. 2015, 9, 131. [Google Scholar] [CrossRef]
  21. Deary, I.J.; Der, G. Reaction time, age, and cognitive ability: Longitudinal findings from age 16 to 63 years in representative population samples. Aging Neuropsychol. Cogn. 2005, 12, 187–215. [Google Scholar] [CrossRef]
  22. Leckie, R.L.; Oberlin, L.E.; Voss, M.W.; Prakash, R.S.; Szabo-Reed, A.; Chaddock-Heyman, L.; Phillips, S.M.; Gothe, N.; Mailey, E.; Vieira-Potter, V.; et al. BDNF mediates improvements in executive function following a 1-year exercise intervention. Front. Hum. Neurosci. 2014, 8, 985. [Google Scholar] [CrossRef]
  23. Prinzmetal, W.; McCool, C.; Park, S. Attention: Reaction time and accuracy reveal different mechanisms. J. Exp. Psychol. Gen. 2005, 134, 73–92. [Google Scholar] [CrossRef]
  24. Jehu, D.A.; Desponts, A.; Paquet, N.; Lajoie, Y. Prioritizing attention on a reaction time task improves postural control and reaction time. Int. J. Neurosci. 2015, 125, 100–106. [Google Scholar] [CrossRef]
  25. Chun, M.M.; Golomb, J.D.; Turk-Browne, N.B. A taxonomy of external and internal attention. Annu. Rev. Psychol. 2011, 62, 73–101. [Google Scholar] [CrossRef] [PubMed]
  26. Giuliano, R.J.; Karns, C.M.; Neville, H.J.; Hillyard, S.A. Early auditory evoked potential is modulated by selective attention and related to individual differences in visual working memory capacity. J. Cogn. Neurosci. 2014, 26, 2682–2690. [Google Scholar] [CrossRef] [PubMed]
  27. Gomez-Ramirez, M.; Hysaj, K.; Niebur, E. Neural mechanisms of selective attention in the somatosensory system. J. Neurophysiol. 2016, 116, 1218–1231. [Google Scholar] [CrossRef] [PubMed]
  28. Griswold, D.; Rockwell, K.; Killa, C.; Maurer, M.; Landgraff, N.; Learman, K. Establishing the reliability and concurrent validity of physical performance tests using virtual reality equipment for community-dwelling healthy elders. Disabil. Rehabil. 2014, 12, 37. [Google Scholar] [CrossRef] [PubMed]
  29. Pazzaglia, C.; Imbimbo, I.; Tranchita, E.; Minganti, C.; Ricciardi, D.; Lo Monaco, R.; Parisi, A.; Padua, L. Comparison of virtual reality rehabilitation and conventional rehabilitation in Parkinson’s disease: A randomised controlled trial. Physiotherapy 2020, 106, 36–42. [Google Scholar] [CrossRef]
  30. Luiz Aramaki, A.; Ferreira Sampaio, R.; Silva Reis, A.C.; Cavalcanti, A.; Caetano Martins Silva, F.; Dutra, E. Virtual reality in the rehabilitation of patients with stroke: An integrative review. Arq. Neuro-Psiquiatr. 2019, 77, 268–278. [Google Scholar]
  31. Zwierko, T.; Florkiewicz, B.; Slawomir, F.; Kszak-Krzyzanowska, A. The ability to maintain atention during visuomotor task performance in handball players and non athletes. Cent. Eur. J. Sport Sci. Med. 2014, 7, 99–106. [Google Scholar]
  32. Fischer, M.V.; Stone, J.; Hawkes, T.D.; Eveland, E.; Strang, A.J. Integrative physical and cognitive training development to better meet airmen mission requirements. Procedia Manuf. 2015, 3, 1580–1586. [Google Scholar] [CrossRef]
  33. Zurek, M.; Cosmi, S.; Cicchela, A.; Roi, G.S. Simple and complex reaction time at visual stimulation, before and after a rehabilitation after knee surgery in football players. In Proceedings of the XXIV International Conference on Sports Rehabilitation and Traumatology, London, UK, 11–12 April 2015. [Google Scholar]
  34. Abernethy, B.; Wood, J.M. Do generalized visual training programmes for sport really work? An experimental investigation. J. Sports Sci. 2001, 19, 203–222. [Google Scholar] [CrossRef]
  35. Appelbaum, L.G.; Schroeder, J.E.; Cain, M.S.; Mitroff, S.R. Improved Visual Cognition through Stroboscopic Training. Front. Psychol. 2011, 2, 276. [Google Scholar] [CrossRef]
  36. Gentier, I.; Augustijn, M.; Deforche, B.; Tanghe, A.; De Bourdeaudhuij, I.; Lenoir, M.; D’Hondt, E. A comparative study of performance in simple and choice reaction time tasks between obese and healthy-weight children. Res. Dev. Disabil. 2013, 34, 2635–2641. [Google Scholar] [CrossRef] [PubMed]
  37. Syväoja, H.J.; Tammelin, T.H.; Ahonen, T.; Kankaanpää, A.; Kantomaa, M.T. The associations of objectively measured physical activity and sedentary time with cognitive functions in school-aged children. PLoS ONE 2014, 9, e103559. [Google Scholar] [CrossRef] [PubMed]
  38. Hillman, C.H.; Pontifex, M.B.; Raine, L.B.; Castelli, D.M.; Hall, E.E.; Kramer, A.F. The effect of acute treadmill walking on cognitive control and academic achievement in preadolescent children. Neuroscience 2009, 159, 1044–1054. [Google Scholar] [CrossRef]
  39. Kao, S.C.; Westfall, D.R.; Soneson, J.; Gurd, B.; Hillman, C.H. Comparison of the acute effects of high-intensity interval training and continuous aerobic walking on inhibitory control. Psychophysiology 2017, 54, 1335–1345. [Google Scholar] [CrossRef] [PubMed]
  40. Reloba-Martínez, S.; Reigal, R.E.; Hernández-Mendo, A.; Martínez-López, E.J.; Martín-Tamayo, I.; Chirosa-Ríos, L.J. Effects of vigorous extracurricular physical exercise on the attention of schoolchildren. Rev. Psicol. Deporte. 2017, 26, 29–36. [Google Scholar]
  41. Luque-Casado, A.; Perakakis, P.; Hillman, C.H.; Kao, S.-C.; Llorens, F.; Guerra, P.; Sanabria, D. Differences in sustained attention capacity as a function of aerobic fitness. Med. Sci. Sports Exerc. 2016, 48, 887–895. [Google Scholar] [CrossRef]
  42. Westfall, D.R.; Gejl, A.K.; Tarp, J.; Wedderkopp, N.; Kramer, A.; Hillman, C.; Bugge, A. Associations between aerobic fitness and cognitive control in adolescents. Front Psychol. 2018, 9, 1298. [Google Scholar] [CrossRef]
  43. Council of Europe, Committee for Development of Sport. Eurofit: European Tests of Physical Fitness; Edigraf Editoriale Grafica: Rome, Italy, 1988. [Google Scholar]
  44. Ruiz, J.R.; Castro-Piñero, J.; España-Romero, V.; Artero, E.G.; Ortega, F.B.; Cuenca, M.M.; Jimenez-Pavón, D.; Chillón, P.; Girela-Rejón, M.J.; Mora, J.; et al. Field-based fitness assessment in young people: The ALPHA health-related fitness test battery for children and adolescents. Br. J. Sports Med. 2011, 45, 518–524. [Google Scholar] [CrossRef]
  45. Lynall, R.C.; Blackburn, J.T.; Guskiewicz, K.M.; Marshall, S.W.; Plummer, P.; Mihalik, J.P. Reaction time and joint kinematics during functional movement in recently concussed individuals. Arch. Phys. Med. Rehabil. 2018, 99, 880–886. [Google Scholar] [CrossRef]
  46. Walton, C.C.; Keegan, R.J.; Martin, M.; Hallock, H. The potential role for cognitive training in sport: More research needed. Front. Psychol. 2018, 9, 1121. [Google Scholar] [CrossRef]
  47. Nuri, L.; Shadmehr, A.; Ghotbi, N.; Attarbashi Moghadam, B. Reaction time and anticipatory skill of athletes in open and closed skill-dominated sport. Eur. J. Sport Sci. 2013, 13, 431–436. [Google Scholar] [CrossRef] [PubMed]
  48. Tønnessen, E.; Haugen, T.; Shalfawi, S.A. Reaction time aspects of elite sprinters in athletic world championships. J. Strength Cond. Res. 2013, 27, 885–892. [Google Scholar] [CrossRef] [PubMed]
  49. van de Water, T.; Huijgen, B.; Faber, I.; Elferink-Gemser, M. Assessing cognitive performance in badminton players: A reproducibility and validity study. J. Hum. Kinet. 2017, 55, 149–159. [Google Scholar] [CrossRef]
  50. Ruschel, C.; Haupenthal, A.; Hubert, M.; Fontana, H.B.; Pereira, S.M.; Roesler, H. Simple reaction time in soccer players from differing categories and field positions. Motricidad 2011, 7, 73–82. [Google Scholar]
  51. Mudric, M.; Cuk, I.; Nedeljkovic, A.; Jovanovic, S.; Jaric, S. Evaluation of Video-based method for the measurement of reaction time in specific sport situation. Int. J. Perf. Anal. Sports 2015, 15, 1077–1089. [Google Scholar] [CrossRef]
  52. Stiles, J. Neural plasticity and cognitive development. Dev. Neuropsychol. 2000, 18, 237–272. [Google Scholar] [CrossRef] [PubMed]
  53. Hötting, K.; Röder, B. Beneficial effects of physical exercise on neuroplasticity and cognition. Neurosci. Biobehav. Rev. 2013, 37, 2243–2257. [Google Scholar] [CrossRef]
  54. Huang, E.J.; Reichardt, L.F. Neurotrophins: Roles in neuronal development and function. Annu. Rev. Neurosci. 2001, 24, 677–736. [Google Scholar] [CrossRef] [Green Version]
Figure 1. (a) VF assessment using VR equipment (Oculus GO—Oculus Quest 2). (b) The internal virtual environment of the application as seen by the athlete.
Sensors 22 06680 g001
Figure 2. The CONSORT diagram of the study design.
Sensors 22 06680 g002
Table 1. Clinical and anthropometric characteristics of the athletes.
Clinical CharacteristicsMean Value ± SDRange (Minimum—Maximum Value)Independent t-Test Report
Group AGroup BGroup AGroup B
Age (years) 12.72   ±   1.81 11.80   ±   1.6410–1510–15t = −1.648, p = 0.108
Height (m) 1.602   ±   0.112 1.52   ±   0.1361.41–1.791.3–1.8t = −2.065, p = 0.066
Weight (kg) 52.03   ±   16.24 47.75   ±   14.3131–9024–72t = −0.864, p = 0.393
BMI 19.91   ±   4.34 20.39   ±   4.1215.5–33.513.36–28.4t = −0.354, p = 0.726
Soccer Experience (years) 5.43   ±   1.74 1.59   ±   0.713–81–3t = −7.735, p < 0.001
BMI: Body Mass Index.
Table 2. Simple and complex reaction time measurements at baseline and the end of the 6-month study using FITLIGHT Trainer in both groups.
Reaction Time (s)—Fitlight Trainer Mean Value ± SDStatistical Tests ReportIndependent t-Test Report
Group AGroup BGroup AGroup BA vs. B
PrePostPrePostWilcoxon RanksWilcoxon Ranks
SRT0.85 ± 0.150.75 ± 0.180.84 ± 0.20.82 ± 0.14Z = −3.049,
p = 0.002
Z = −0.187
p = 0.852
t = 1.675
p = 0.103
CRT0.97 ± 0.130.92 ± 0.171.08 ± 0.191.02 ± 0.13Z = −2.330,
p = 0.020
Z = −1.288
p = 0.198
t = −0.065
p = 0.949
SRT: simple reaction time, CRT: complex reaction time, SD: standard deviation, Pre: pre-intervention, Post: post-intervention.
Table 3. Physical fitness measurements at baseline and the end of the 6-month study.
Physical Fitness MeasuresMean Value ± SDStatistical Tests Report (Paired t-Test/Wilcoxon Ranks)Mann–Whitney/
Independen t-Test Report
Group AGroup BGroup AGroup BA vs. B
PrePostPrePost
RFD (Kg/s)10.37± 6.0320.29 ± 13.8614.57 ± 8.7919.72 ± 17.23Z = −3.114
p = 0.002
Z = −0.952
p = 0.341
U = 115.5
p = 0.059
(R) Hand grip (Kg)16.02 ± 8.6227.69 ± 11.7112.33 ± 6.1123.30 ± 9.41Z = −4.107
p < 0.001
Z= −3.920
p < 0.001
t = −0.536
p = 0.595
(L) Hand grip (Kg)14.63 ± 8.9426.00 ± 10.6712.56 ± 6.4124.16 ± 10.01Z = −4.107
p < 0.001
t = −12.521
p < 0.001
t = 0.194
p = 0.847
Sit-and-reach flexibility (cm)4.06 ± 5.79−3.72 ± 5.630.47 ± 5.87−2.00 ± 6.63Z = −3.725
p < 0.001
Z = −2.279
p = 0.023
t = 3.978
p < 0.001
Repeated sprint (s)21.19 ± 1.1724.02 ± 2.6422.78 ± 1.5122.63 ± 1.44Z = −3.409
p < 0.001
Z = −3.923
p < 0.001
U = 36
p < 0.001
RFD: rate of force development, (R) hand grip: right hand hand grip, (L) hand grip: left hand hand grip, SD: standard deviation, Pre: pre-intervention, Post: post-intervention.
Table 4. Figure drawing test results at baseline and the end of the 6-month study.
Cognitive Test—Figure DrawingMean Value ± SDStatistical tests Report (Paired t-Test/Wilcoxon Ranks)Mann–Whitney/ Independent t-Test Report
Group AGroup BGroup AGroup BA vs. B
PrePostPrePost
Performance (s)—Dominant Hand30.86 ± 11.4638.92 ± 9.8332.58 ± 15.8344.68 ± 19.32Z = −2.638
p = 0.008
Z = −2.438
p = 0.015
t = 0.993
p = 0.328
Pen Lifts—Dominant Hand0.75 ± 1.070.56 ± 0.711.30 ± 1.860.79 ± 0.28t = 0.382
p = 0.708
t = 0.362
p = 0.722
U = −175
p = 0.880
Performance (s)—Non-Dominant Hand25.17 ± 9.0932.37 ± 9.9727.68 ± 13.0633.86 ± 14.71t = −3.106
p = 0.007
Z = −1.539
p = 0.124
t = 0.062
p = 0.951
Pen Lifts—Non-Dominant Hand0.63 ± 0.960.72 ± 0.900.60 ± 1.460.40 ± 0.75t = −0.382
p = 0.708
t = 0.308,
p = 0.762
U = 163
p = 0.578
SD: standard deviation, Pre: pre-intervention, Post: post-intervention.
Table 5. Pen-to-point test results at baseline and the end of the 6-month study.
Cognitive Test—Pen to Point (s)Mean Value ± SDStatistical Tests ReportANCOVA Analysis Report
Group AGroup BGroup AGroup BA vs. B
PrePostPrePostWilcoxon RanksWilcoxon Ranks
Dominant Hand89.47± 26.6925.39 ± 6.8065.89± 27.9423.67 ± 7.09Z = −3.351
p < 0.001
Z = −3.527
p < 0.001
F = 0.542
p = 0.467
Non-Dominant Hand98.50 ± 5.6027.08 ± 7.5661.58± 30.7325.69 ± 9.00Z = −3.516
p < 0.001
Z = −3.101
p = 0.002
F = 0.196
p = 0.661
SD: standard deviation, Pre: pre-intervention, Post: post-intervention.
Table 6. Reaction time measurements at baseline and the end of the 6-month study using VR equipment.
Visual Field—Reaction Time (s)Mean Value ± SDStatistical Tests ReportANCOVA Analysis Report
Group AGroup BGroup AGroup BA vs. B
PrePostPrePostPaired t-TestWilcoxon Ranks
VF0.67 ± 0.320.61 ± 0.311.06 ± 0.390.88 ± 0.32t = 0.893
p = 0.384
Z = 1.717
p = 0.086
F = 4.124,
p = 0.05
VF: visual field test, SD: standard deviation, Pre: pre-intervention, Post: post-intervention.
Table 7. Correlation table.
CorrelationsPearson/Spearman Coefficient and p-Value
PrePost
AgeSRTrho = −0.489, p = 0.002rho = −0.579, p < 0.001
AgeCRTr = −0.360, p = 0.026r = −0.558, p < 0.001
AgeRFDrho = 0.489, p = 0.002rho = 0.571, p < 0.001
AgeVFNot statistically significantrho = −0.406, p = 0.011
Soccer ExperienceVFrho = −0.416, p = 0.020rho = −0.456, p = 0.010
Soccer ExperienceCRTr = −0.425, p = 0.017r = −0.469, p = 0.008
AgeSoccer Experiencer = 0.445, p = 0.012
SRT: simple reaction time, CRT: complex reaction time, RFD: rate of force development, VF: visual field test, Pre: pre-intervention, Post: post-intervention. r refers to Pearson’s correlation coefficient and rho to Spearman’s correlation coefficient.
Table 8. Linear regression analysis—Group A.
VariablesGroup A
VR-RTF(1, 16) = 25.070, p < 0.001, R2 = 0.610
CRT (FITLIGHT)F(1, 16) = 79.789, p < 0.001, R2 = 0.833
DomFigureF(1,16) = 0.256, p = 0.620, R2 = 0.016
NonDomFigF(1,16) = 1.195, p = 0.291, R2 = 0.069
DomPenF(1,16) = 0.028, p = 0.869, R2 = 0.002
NonDomPenF(1,16) = 0.131, p = 0.722, R2 = 0.008
RFDF(1,16) = 9.808, p = 0.006, R2 = 0.380
Repeated SprintF(1,16) = 7.693, p = 0.014, R2 = 0.325
HandGripLF(1,16) = 4.659, p = 0.046, R2 = 0.226
HandGripRF(1,16) = 5.516, p = 0.032, R2 = 0.256
SRTF(1,16) = 8.096, p = 0.012, R2 = 0.336
VR-RT: virtual reality–reaction time (visual field test), CRT (FITLIGHT): complex reaction time using FITLIGHT, DomFigure: figure drawing test for dominant hand, NonDomFig: figure drawing test for non-dominant hand, DomPen: pen-to-point for dominant hand, NonDomPen: pen-to-point for non-dominant hand), RFD: rate of force development, HandGripL: hand grip for left hand, HandGripR: hand grip for right hand, SRT: sit-and-reach flexibility test.
Table 9. Multiple regression analysis—Group A: Coefficients of the variables participating in the development of the multiple regression model. VR-RT has the most significant predictive role in this model.
VariablesGroup A
VR-RTt = 3.393, p = 0.019
CRT (Fitlight)t = 1.776, p = 0.136
DomFiguret = 0.473, p = 0.656
NonDomFigt = −0.768, p = 0.477
DomPent = 0.796, p = 0.462
NonDomPent = −0.125, p = 0.905
RFDt = −0.018, p = 0.987
Repeated Sprintt = 1.088, p = 0.326
HandGripLt = 1.784, p = 0.134
HandGripRt = −1.017, p = 0.356
SRTt = −0.913, p = 0.403
Publisher’s Note: MDPI stays neutral with regard to jurisdictional claims in published maps and institutional affiliations.

