
Opto Field-Effect Transistors for Detecting Quercetin–Cu2+ Complex
by
 ,
,
Pradhana Jati Budhi Laksana
1,2,3,* ,
,
Li-Chu Tsai
4,*,
Chang-Cheng Lin
4,
Kuei-Shu Chang-Liao
1,
Mathew K. Moodley
5 and
Chii-Dong Chen
3 1
Department of Engineering and System Science, National Tsing Hua University, Hsinchu 30013, Taiwan
2
Nano Science and Technology Program, Taiwan International Graduate Program, Academia Sinica, Taipei 11529, Taiwan
3
Institute of Physics, Academia Sinica, Taipei 11529, Taiwan
4
Institute of Organic and Polymeric Materials, National Taipei University of Technology, Taipei 10608, Taiwan
5
Discipline of Physics, School of Chemistry and Physics, College of Agriculture, Engineering and Science, University of KwaZulu-Natal, Durban 4000, South Africa
*
Authors to whom correspondence should be addressed.
Sensors 2022, 22(19), 7219; https://0-doi-org.brum.beds.ac.uk/10.3390/s22197219
Submission received: 23 August 2022
/
Revised: 19 September 2022
/
Accepted: 19 September 2022
/
Published: 23 September 2022
(This article belongs to the Special Issue Advanced Field-Effect Sensors)
Abstract
:In this study, we explored the potential of applying biosensors based on silicon nanowire field-effect transistors (bio–NWFETs) as molecular absorption sensors. Using quercetin and Copper (Cu2+) ion as an example, we demonstrated the use of an opto–FET approach for the detection of molecular interactions. We found that photons with wavelengths of 450 nm were absorbed by the molecular complex, with the absorbance level depending on the Cu2+ concentration. Quantitative detection of the molecular absorption of metal complexes was performed for Cu2+ concentrations ranging between 0.1 μM and 100 μM, in which the photon response increased linearly with the copper concentration under optimized bias parameters. Our opto–FET approach showed an improved absorbance compared with that of a commercial ultraviolet-visible spectrophotometry.
1. Introduction
Many trace metal ions are essential to the human body and play an important role in human health. In small quantities, certain heavy metals such as copper (Cu2+), manganese (Mg2+), and zinc (Zn2+) with concentration of 25 μM, 7 μM, and 430–650 μM, respectively, have a substantial impact on our health. Above that tolerance concentration, heavy metals are harmful and can lead to various disease conditions [1]. Among these ions, the complex stability of quercetin and copper (Cu2+) ion is reported to be the highest [2], and metal chelation in quercetin–Cu2+ ion has been intensively studied in recent years [3,4,5,6,7]. These studies were performed using optical spectroscopy such as infrared spectroscopy [8,9], ultraviolet–visible (UV–Vis) spectrophotometry [10,11], and electrospray ionization mass spectroscopy [2]. Optical spectroscopy is based on the idea that the absorption of the quercetin–Cu2+ complex varies at different wavelengths, depending on its complex electronic structures. Therefore, spectroscopy is a powerful tool for observing molecular complexes and structures, and thus, for observing the chemical bonding in the excited state of quercetin–Cu2+ ion complexes. As reported in the literature, using UV–Vis spectrophotometry, quercetin showed band I absorption (~300–380 nm) and band II absorption (240–280 nm). An absorption peak at 370 nm observed upon the reaction with copper ion at a ratio of 1:1 shifted to approximately 450 nm upon increasing the copper ion concentration [9,12]. In this study, we propose the use of a silicon nanowire field effect transistor (bio–NWFET) platform to study the shift and to detect various concentrations of copper based on quercetin–metal ion interactions. Bio–NWFET consists of dual gates. Both gates can modulate the carrier concentration of source-drain channels. The front gate is used as a sensing area that is sensitive to physical stimuli, and the back gate has the advantage of adjusting and obtaining complex gate controllability for keeping the typical transistor behavior. It enables the improvement of sensing performance of the devices [13,14,15].
Bio–NWFET has been reported as a powerful platform for the detection of interactions between bio-molecules [16,17]; however, the use of bio–NWFET in an FET’s optoelectronic function to form a dual-function sensing device is lesser known [18]. The function has the unique advantages of mass-production semiconductor device technology, miniaturization, low power consumption, and ease of integration [19]. In our previous study [18], we integrated the charge sensing and optical transduction functions of bio-NWFETs for the detection of antibody–antigen interactions using ELISA technology. In this study, we employed quercetin and Cu2+ ion as molecules for detecting the molecular absorption of metal complexes. Silicon offers an absorption range from ultraviolet to visible wavelengths, owing to its high bandgap energy of 1.1 eV. We investigated the effect of internal factors such as drain voltage (VDS) and back-gate voltage (VBG) and external factors such as intensity and wavelength on the charge carrier to obtain the optimum linearity for the detection of copper based on ion and quercetin interactions. Based on these parameters, we demonstrate the measurement of quercetin and Cu2+ interaction. Further, the absorption results in different buffer solutions of 0.01X, 0.1X, and 1X were compared with those obtained using UV–Vis spectrophotometry.
2. Materials and Methods
2.1. Reagents and Chemicals
The following reagents were used: quercetin (C14H10O7) 99% purity from Acros Organic, copper(II) chloride (CuCl2) 99% purity from Sigma-Aldrich (St. Louis, MI, USA), and Dulbecco’s phosphate buffered saline (10X PBS, 137 mM NaCl, 2.7 mM KCl, 10 mM Na2HPO4, 2 mM KH2PO4, pH 7.4) from Invitrogen.
2.2. Detection Procedure
The concentration of quercetin stock solution was 1 mM, prepared in a methanol solution, and diluted to 100 μM using a PBS solution. A 100 μM quercetin solution was added to 0.1, 0.5, 1, 10, 20, 40, 80, and 100 μM copper chloride (CuCl2) and reacted in 1X PBS solution for a period of time. Spectra were obtained on a commercial optical density (OD) spectrometer (JASCO V670). In our opto–FET, measurements were conducted in the system over several on/off cycles for each concentration of CuCl2. PBS solutions were injected in between different tested samples to wash the fluidic channel and make sure there is no leftover sample during measurement.
2.3. Measurement Setup
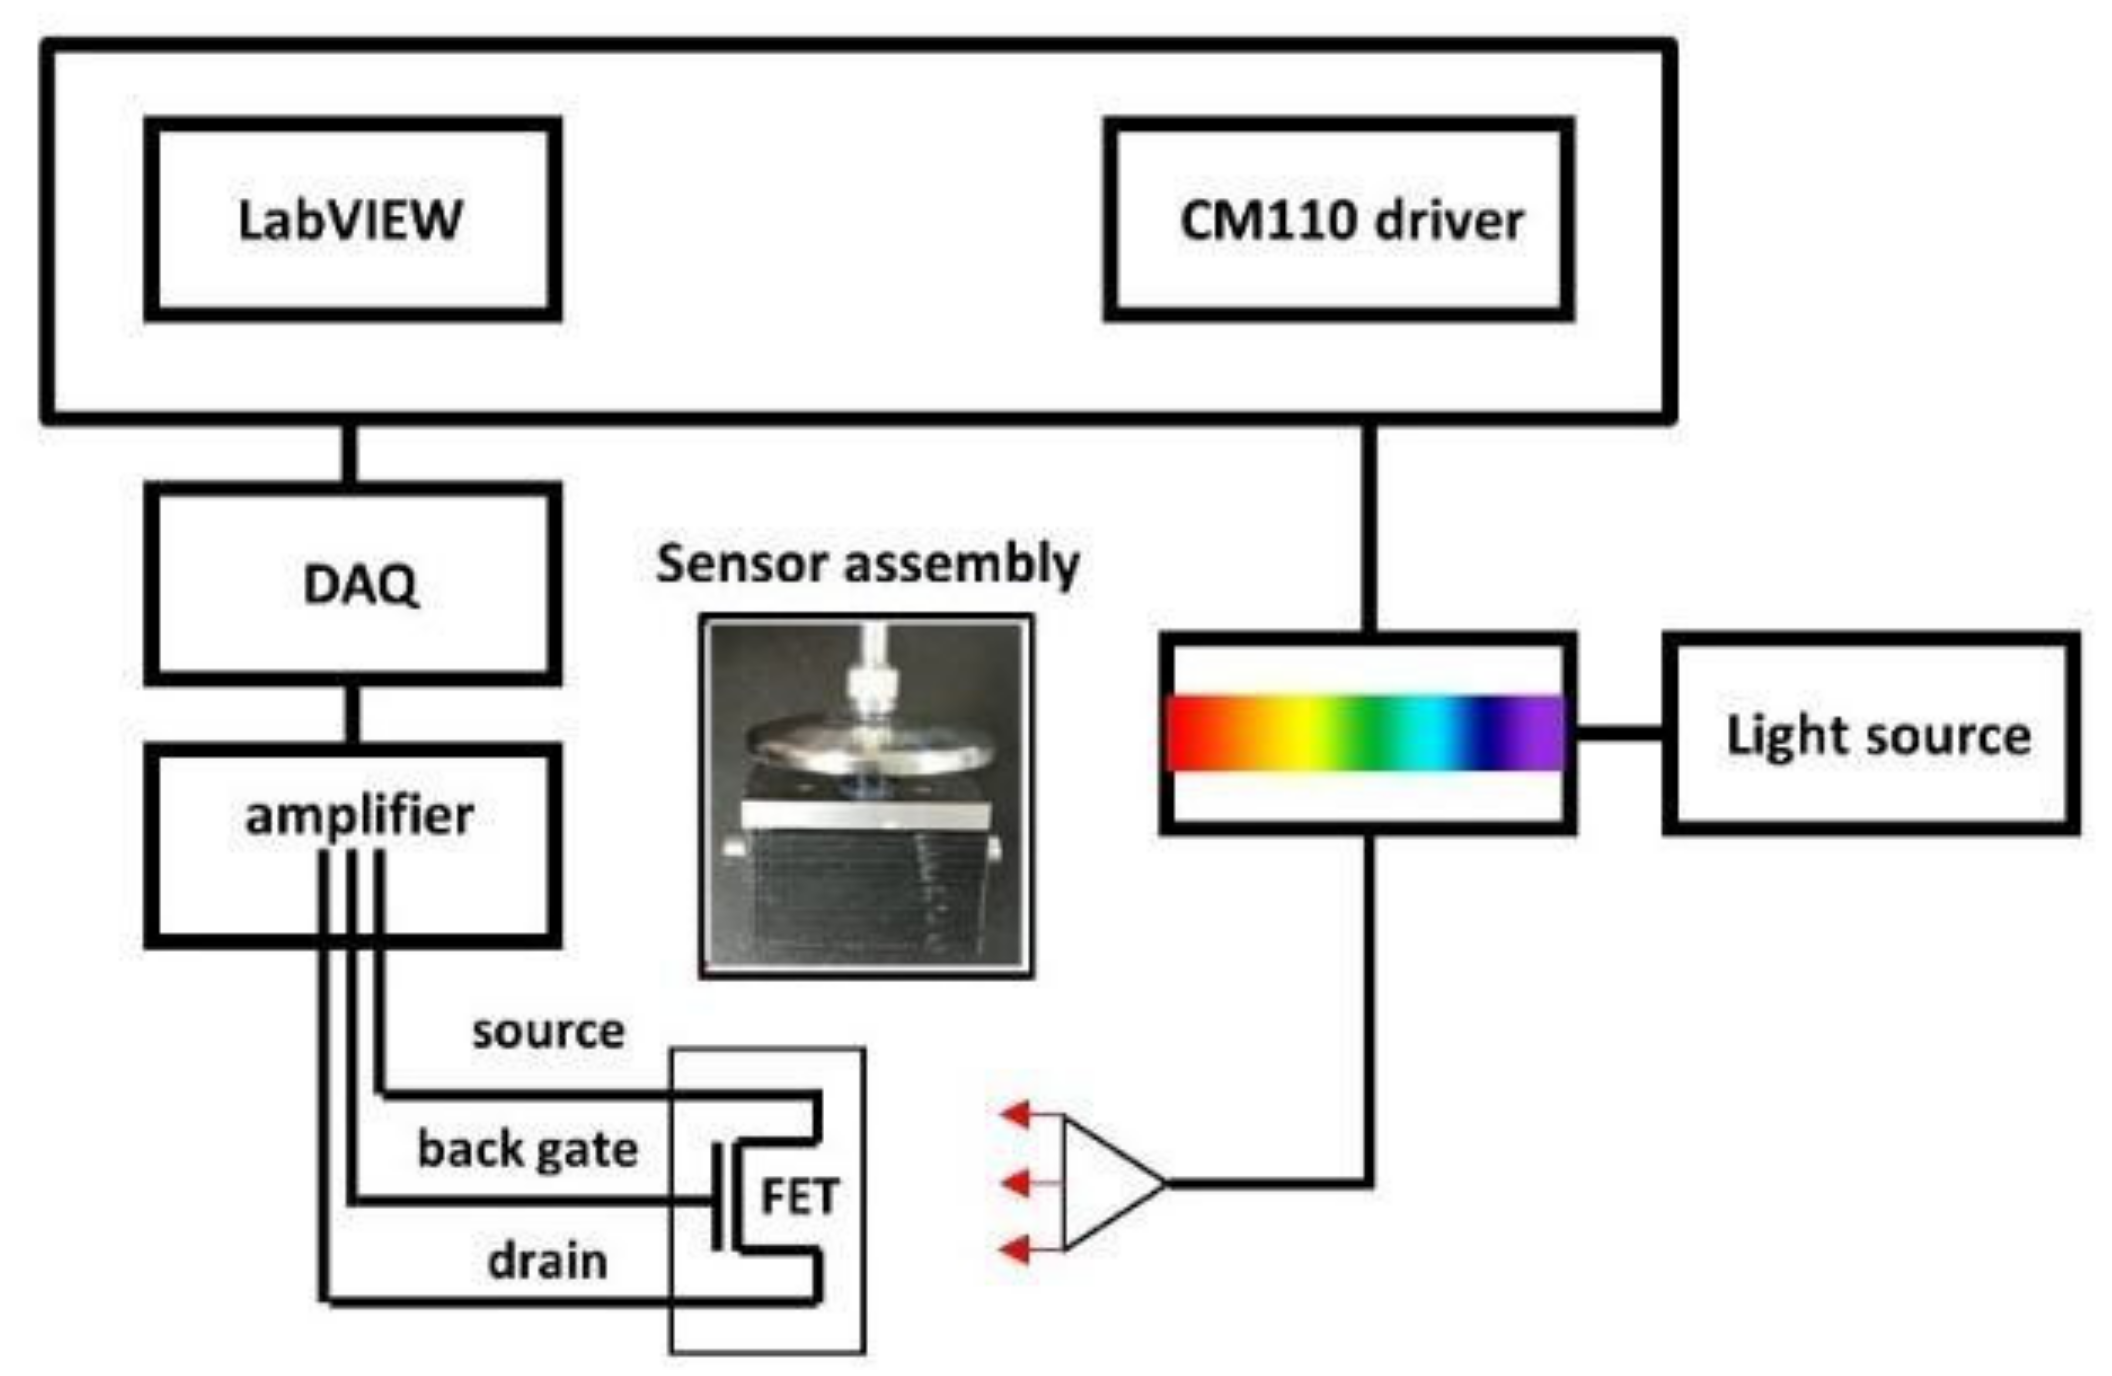
Electrical measurements of the NW-FET device were obtained using a homemade data acquisition system connected to a computer running software written using LabVIEW (National Instruments, Austin, TX, USA), as shown in Figure 1. The sensor assembly accommodated an NW-FET chip with fluidic channels and an optical fiber adapter, and was connected to the acquisition platform using an HDMI cable. The specimen solution was injected into the device sensing area through a fluidic channel with a sample of approximately 14.1 μL; the solution inlet and outlet were located at the two sides of the sensor assembly. The length, width, and thickness of the fluidic channel were 7.34 mm, 1.2 mm, and 1.6 mm, respectively. The light source consisted of a xenon fiber optic light source (ASB–XE–175EX, Spectral Products) and a monochromator (CM110, Spectral Products) with controlled power intensity and wavelength. Light was introduced onto the NW–FET sensing area from the top of the sensor assembly on a dark, black box at a distance of 10 mm. In this acquisition system, the user controls the measurement parameters such as the source–drain voltage (VDS), back–gate voltage (VBG), light intensity, wavelength, and time at room temperature. The light intensity of the source was calibrated using a commercial silicon photodiode, PH–100Si, from Gentech EO, Inc. (Quebec City, QC, Canada).
3. Results and Discussion
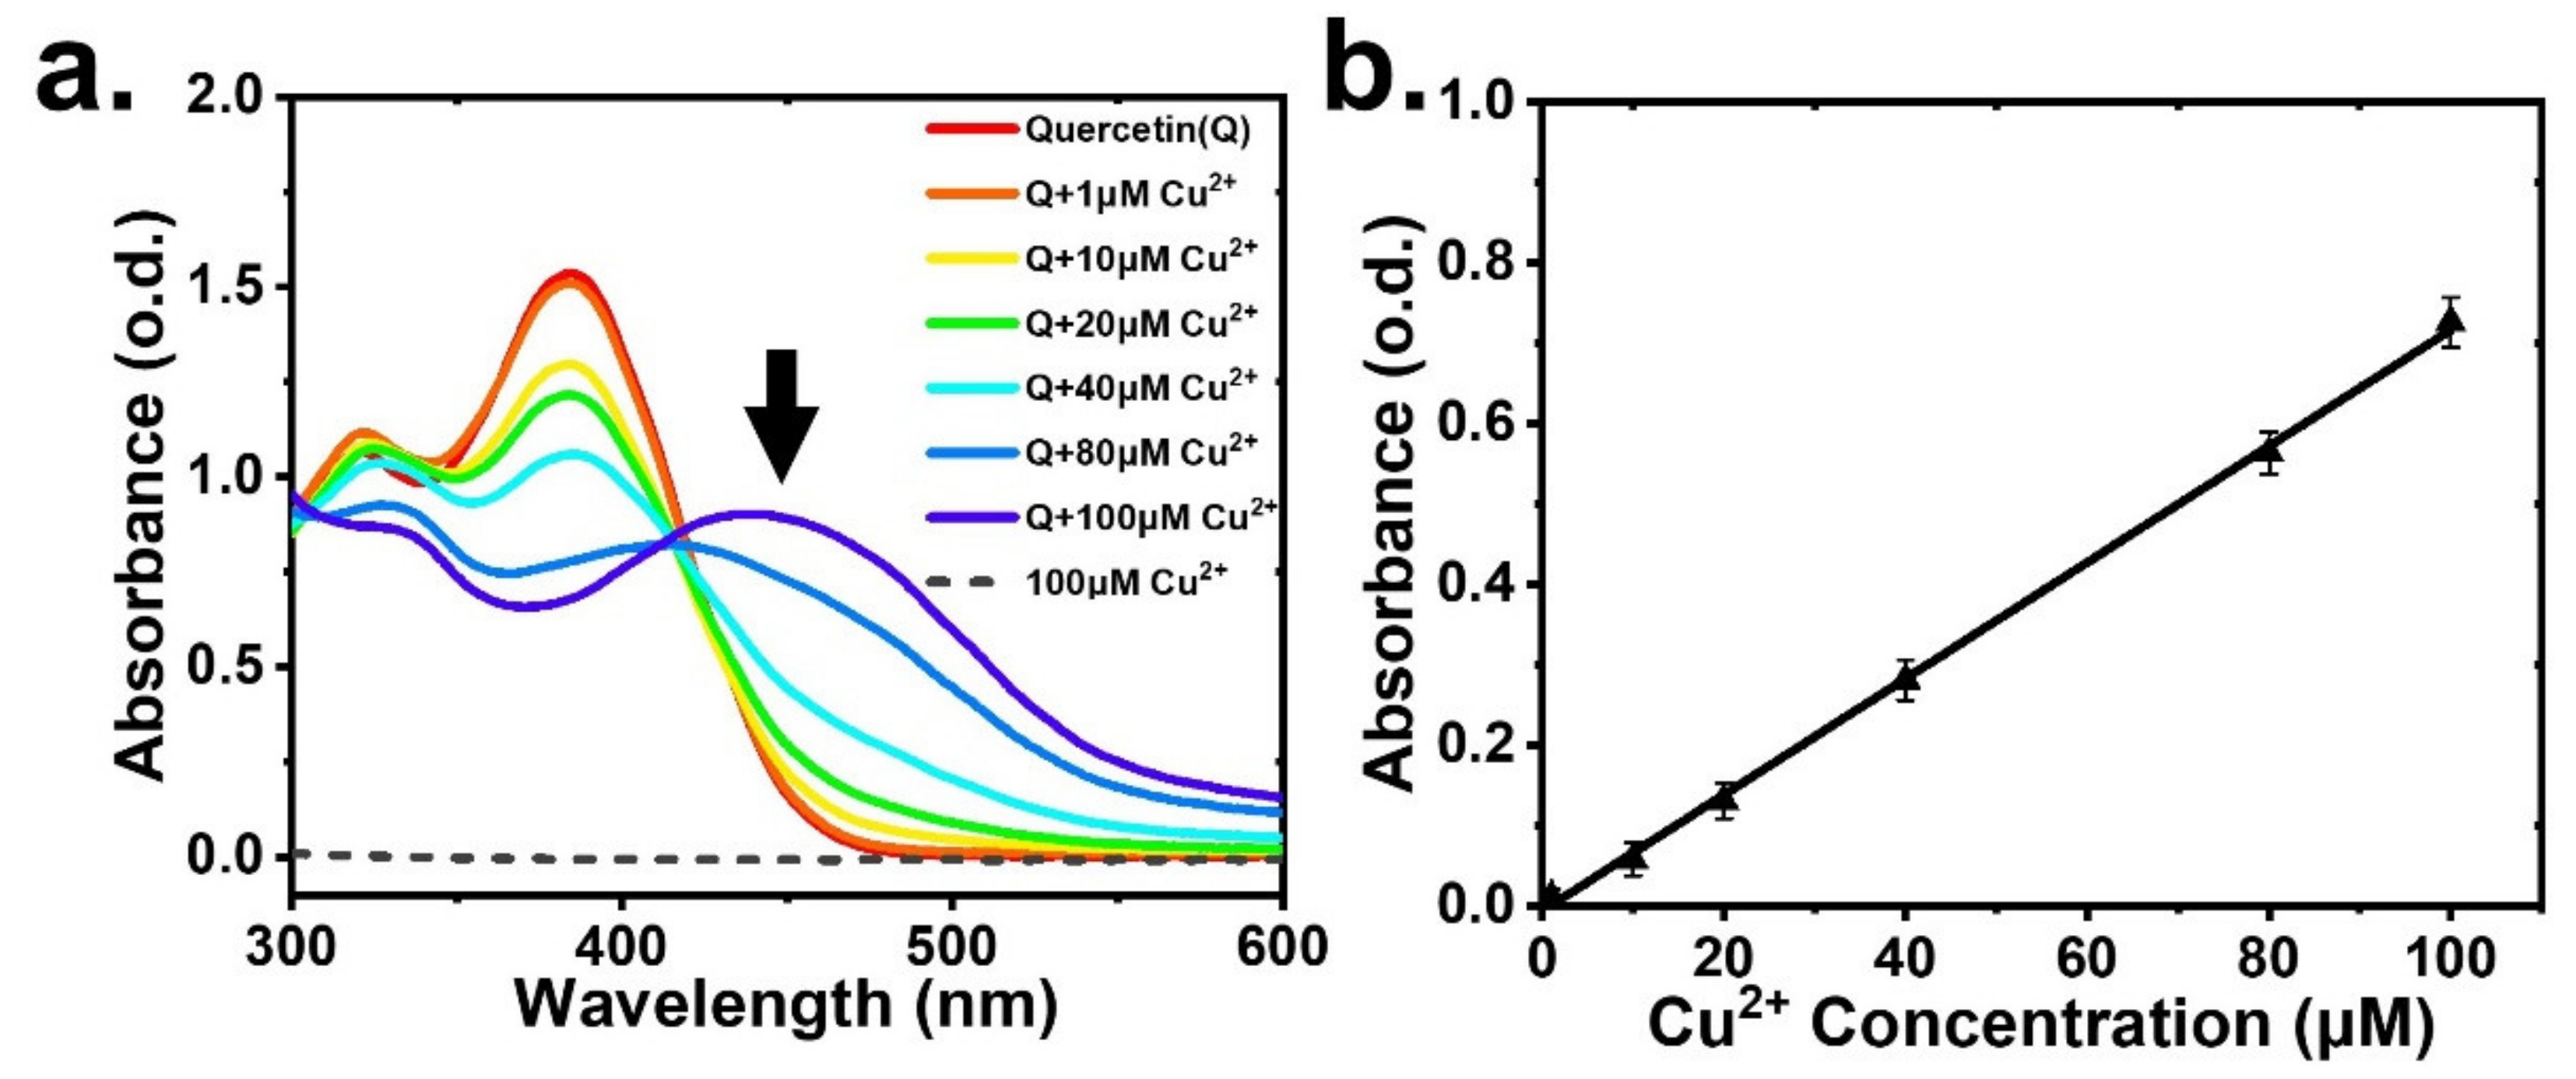
To examine the complex of quercetin and Cu2+ ion in a buffer solution of 1X PBS, we used a commercial optical density (OD) spectrometer (JASCO V670) at a range of 300–600 nm, as shown in Figure 2a. The results showed no observable absorption peak for 100 μM of Cu2+, whereas the absorption peak for quercetin appeared at 385 nm. In the combined quercetin and Cu2+ solution, with increasing Cu2+ concentration from 1 μM to 100 μM, the absorbance peak at 385 nm decreased and even vanished; however, the absorbance at 450 nm increased and formed a peak at a Cu2+ concentration of 100 μM. As shown in Figure 2b, the absorbance linearly increased with the Cu2+ concentration at a wavelength of 450 nm, and the solution color of the quercetin–Cu2+ complex in 1X PBS buffer changed from transparent (colorless) to yellowish, as shown in Figure S2 in the Supplementary Materials.
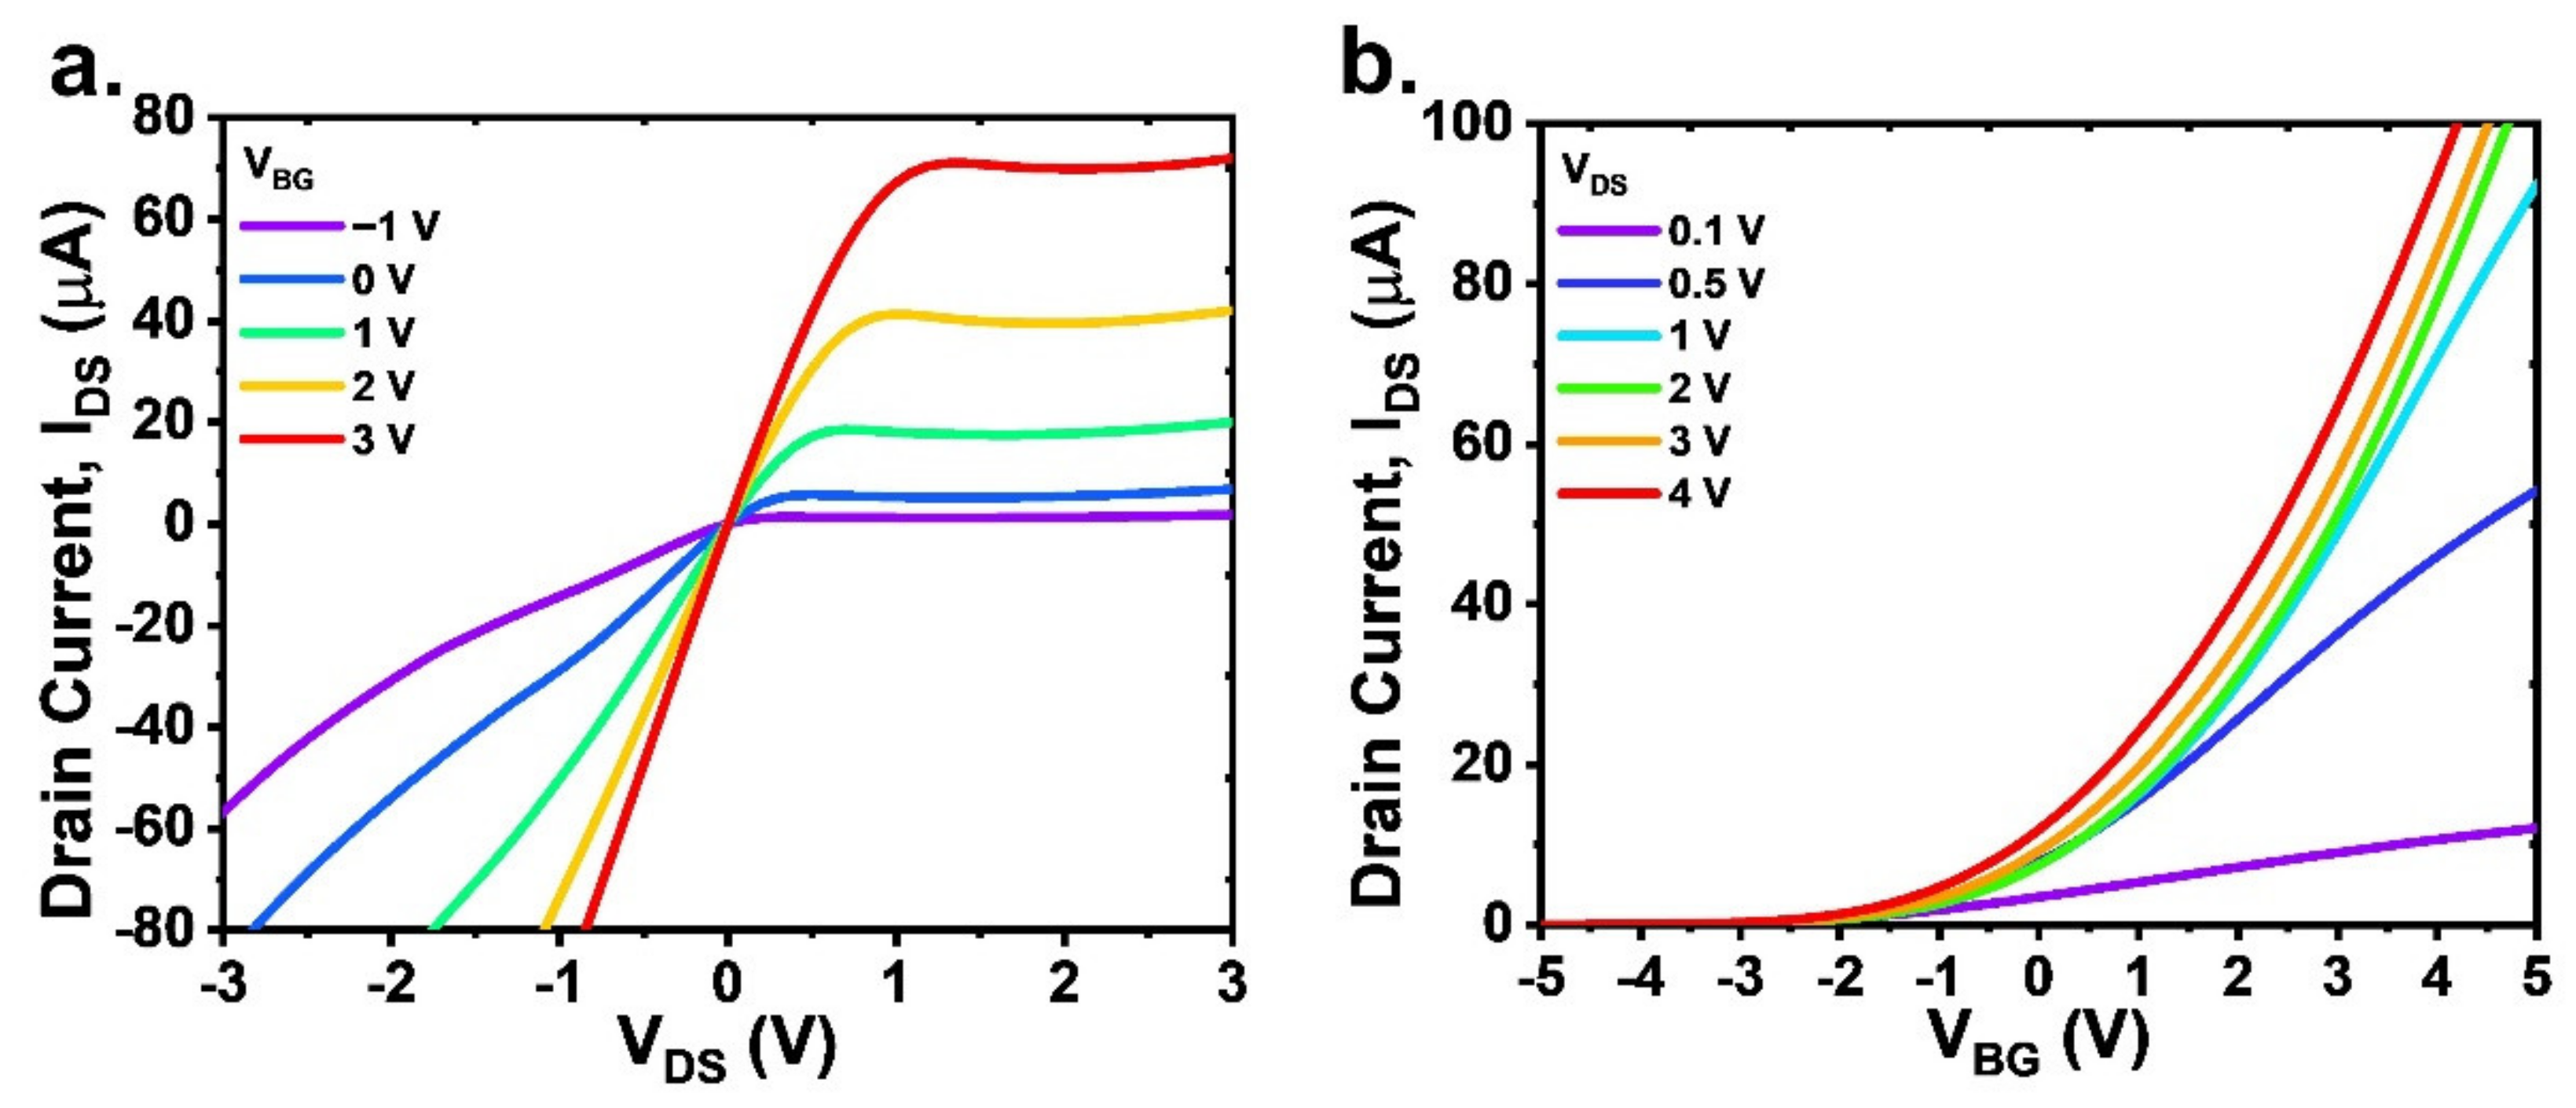
The scanning electron microscopy (SEM) images with a channel length, width, and height of 2 μm, 200 nm, and 100 nm, respectively, are shown in the Supplementary Materials Figure S1. A back-gated NW-FET was fabricated using top–down techniques without a top metal gate (discussed in the Supplementary Materials on device fabrication). The NW-FET was designed to operate in accumulation mode, meaning that the device was set up with a small drain current (IDS) at zero gate voltage. This is an advantage for photodetectors because a high illumination intensity is not required. The device characterization was initially performed in the dark to extract the electrical properties of the NW-FET, which shows n-type characteristics, as presented in its transfer characteristics (IDS–VDS) and output characteristics (IDS–VBG) in Figure 3a,b.
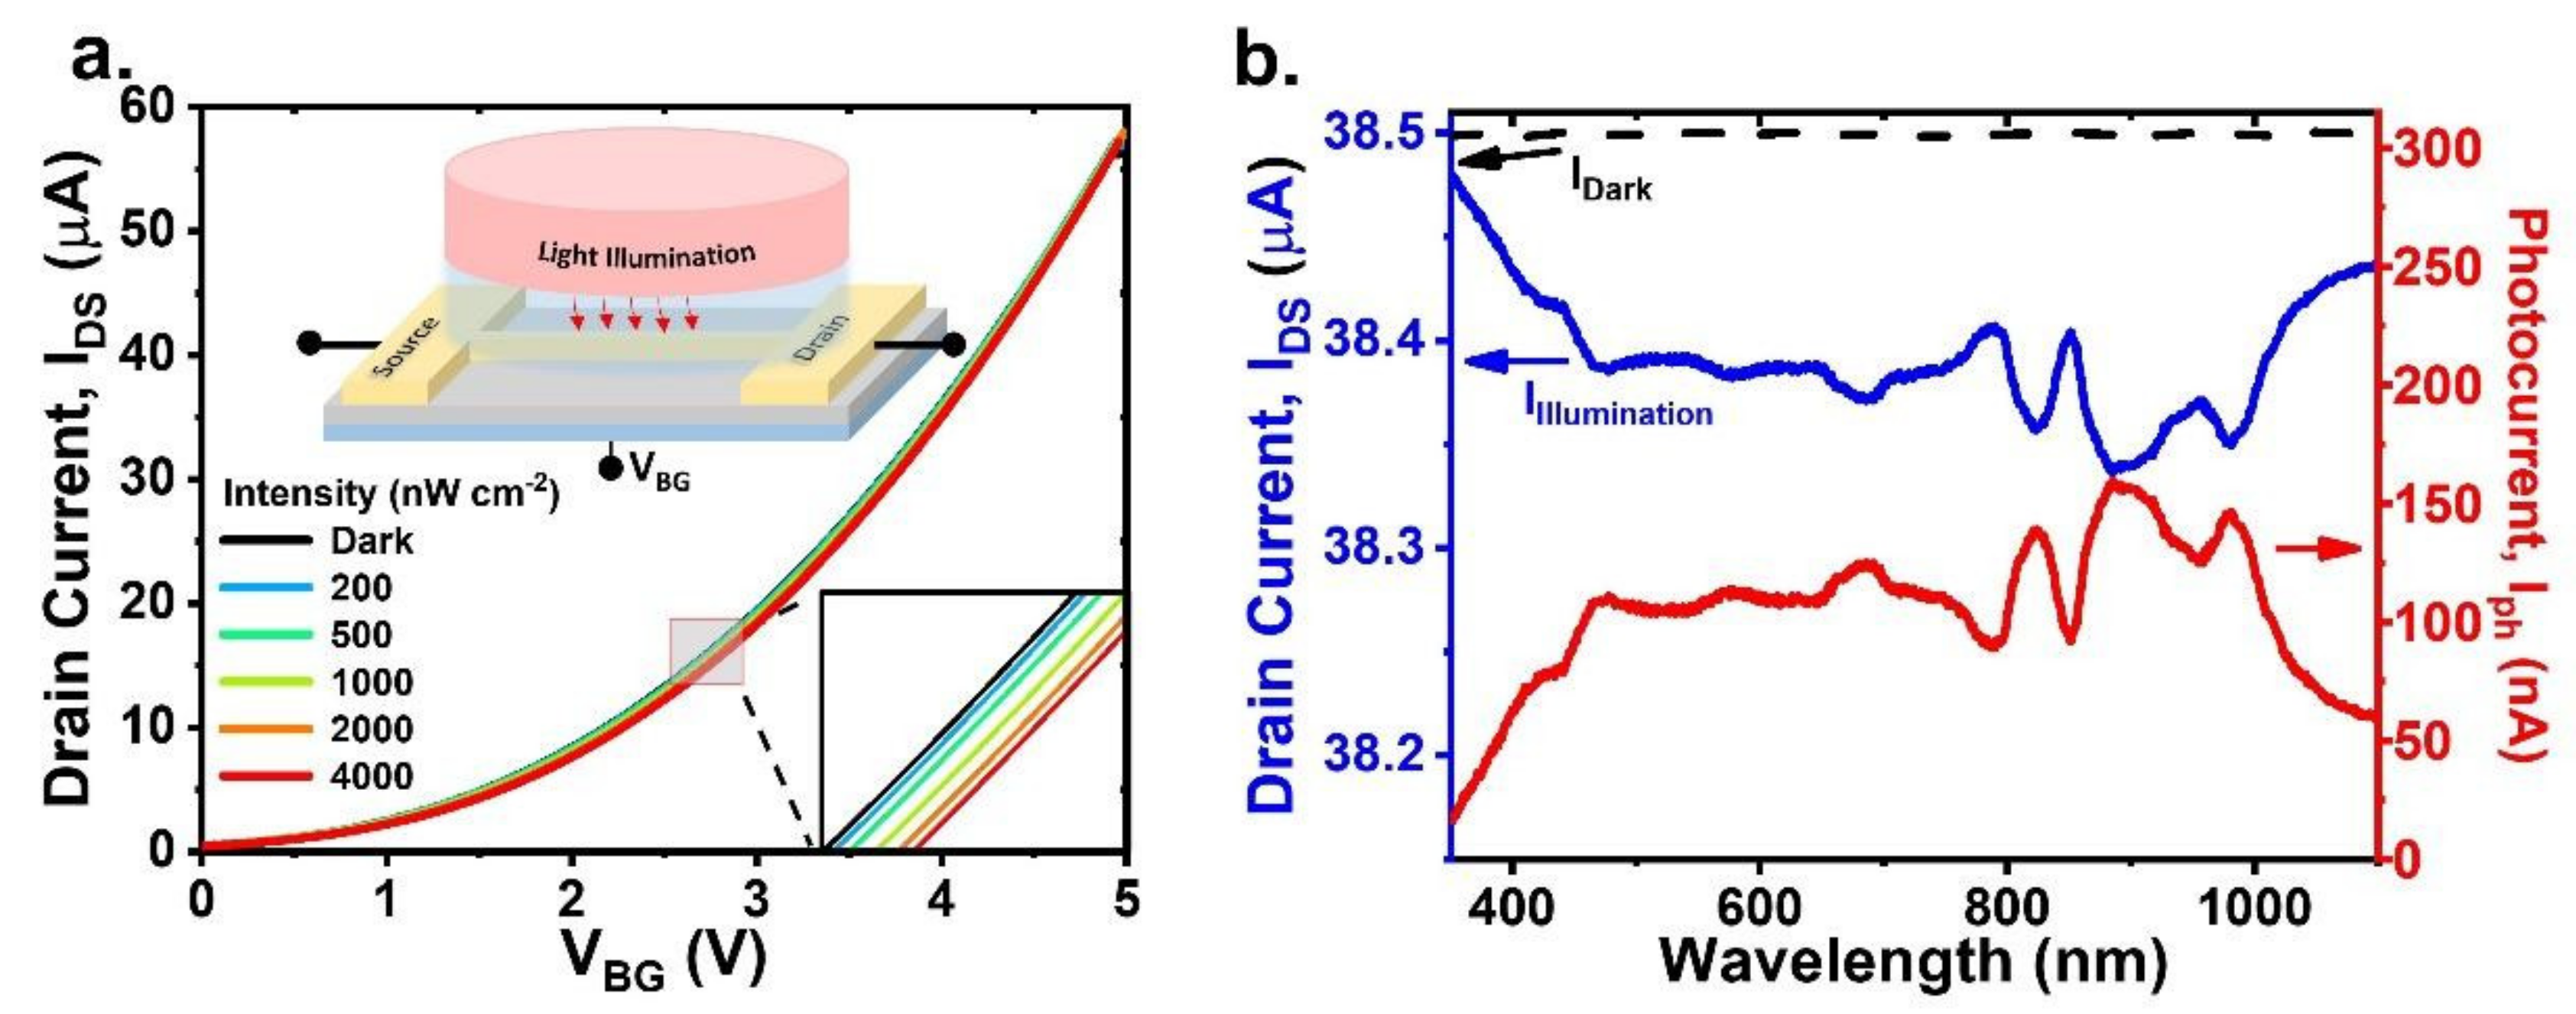
Figure 4a shows a schematic illustration of the opto-FET setup, in which the photon response involves several mechanisms such as photon absorption, carrier photogeneration, and carrier transport. In addition, Figure 4a shows the transfer characteristics of the device, indicating that at a wavelength of 450 nm, the IDS decreases with increasing light intensity at all values of VBG. The blow-up view shown on the bottom right of Figure 4a demonstrates the changes in intensity. In Figure 4b, we show the response of the IDS for illumination at varying wavelengths, implying that the opto-FET responds to a broad range of wavelengths. The dark current Idark is indicated in the plot to show that the IDS under illumination, Iillumination, is lower than Idark in the wavelength range of interest. Many factors affect the polarity of the photocurrent, such as the photon wavelength, intensity, type of channel doping and concentration, and feasible device design [20,21]. However, the magnitude of the photocurrent, rather than the polarity, is relevant for the application of photodetectors. Therefore, the photocurrent is defined as the absolute change in the IDS upon illumination, that is, Iph = |Iillumination − Idark|, as shown in the same figure.
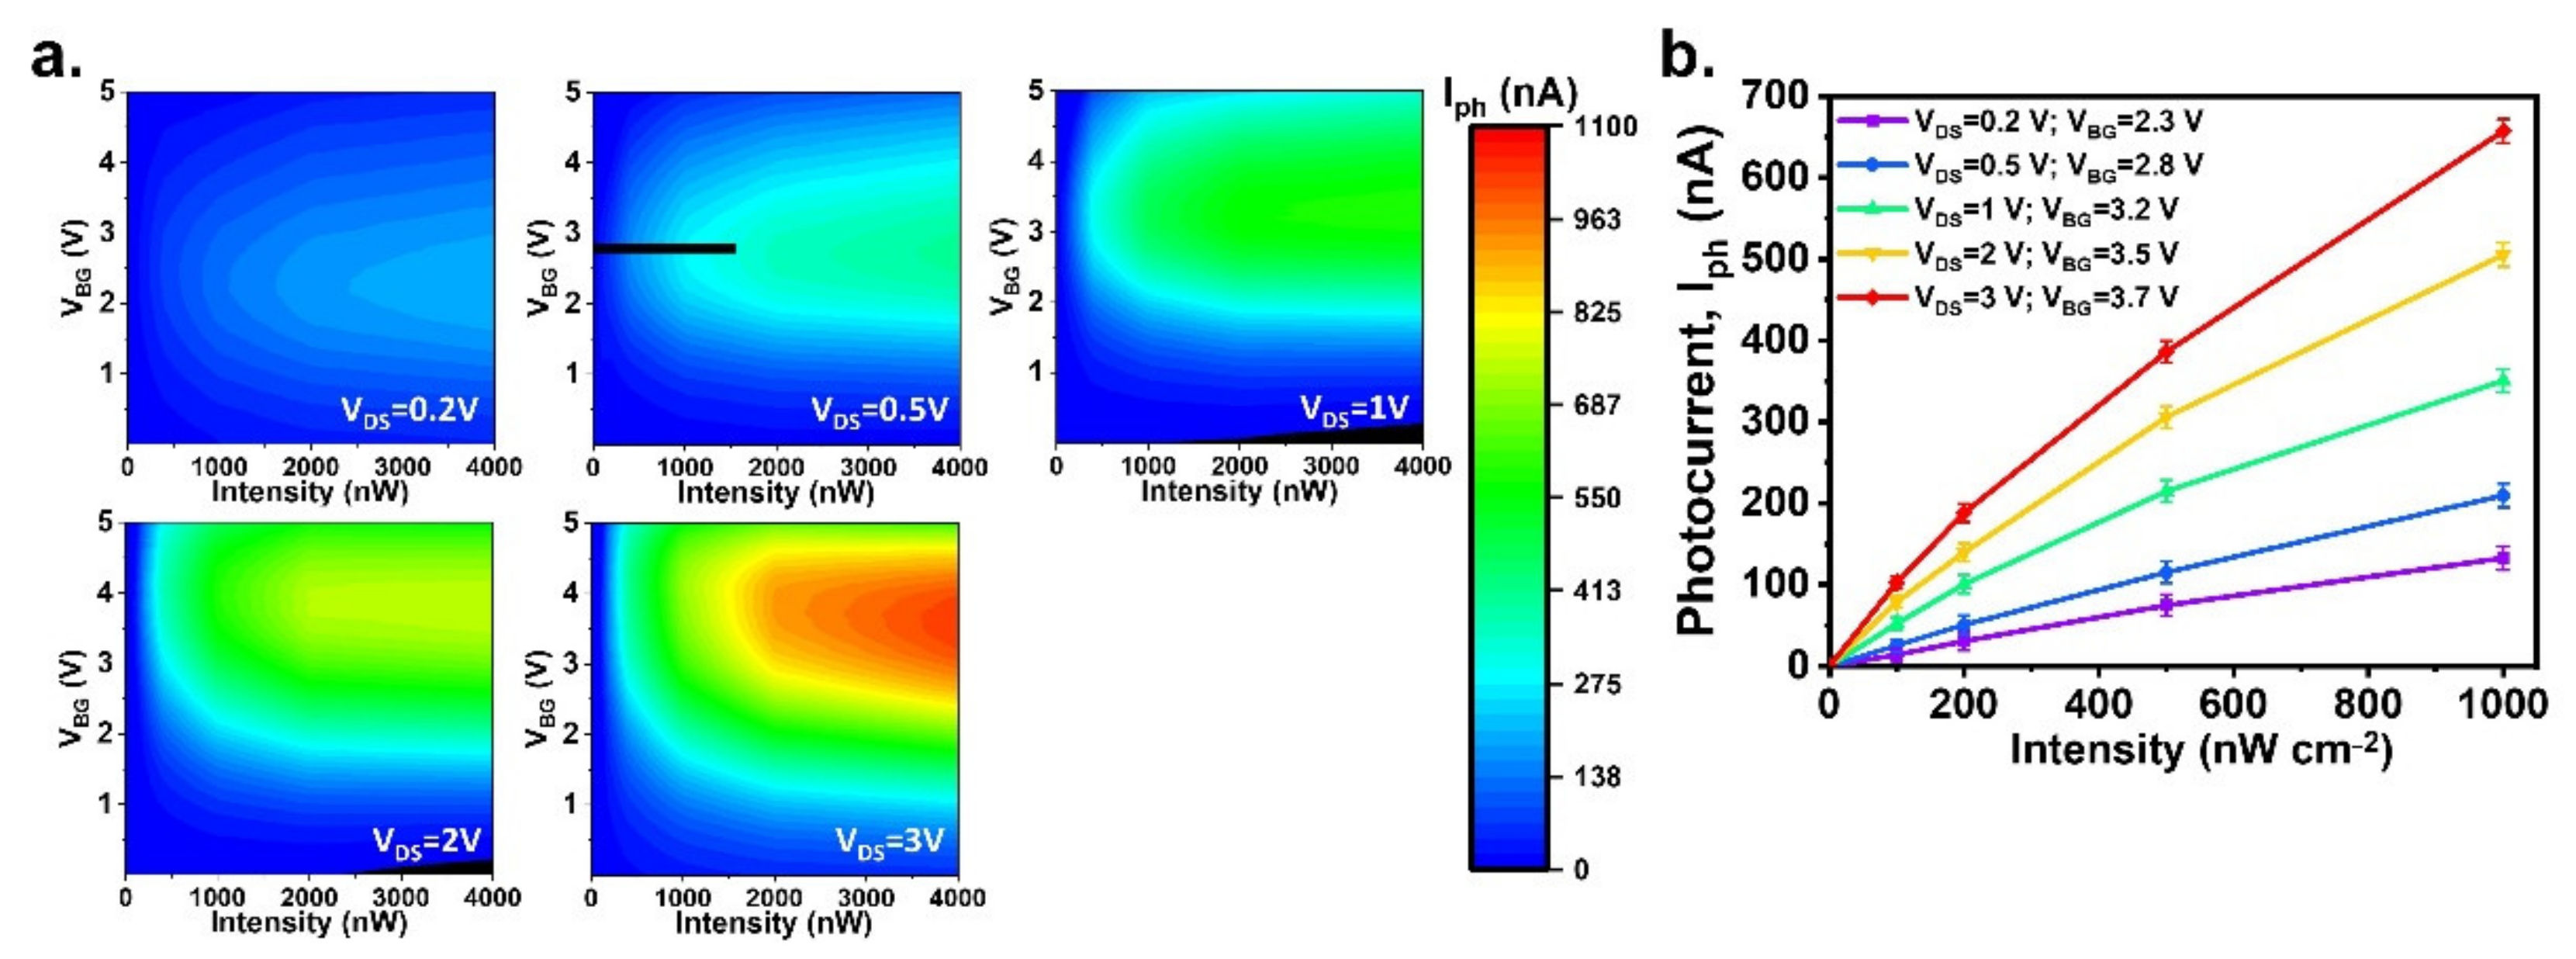
Because the quercetin–Cu2+ complex generates a linear and strong absorption at wavelengths of 430–450 nm, a wavelength of 450 nm was chosen for use in this study. To use the opto-FET system as a photodetector for biosensing applications, a suitable bias condition should be determined, wherein the detection has good sensitivity and shows a linear dependence on light intensity. This linear dependence would enable the calibration of the molecule concentration. To this end, we measured the device by varying VDS and VBG at a wavelength of 450 nm under various light intensities, and the results are shown in Figure 5a. The figure demonstrates that increasing the VDS value increased the photocurrent of the device. However, for different VDS values, the maximum photocurrent appeared at different VBG values in the range of 2–4 V. We limited the light intensity to 1000 nWcm−2, as intense light could harm the molecules. Figure 5b shows the intensity dependence of the photocurrent for the five VDS values used in Figure 5a; in addition, the VBG values corresponded to the maximum photocurrent at 1000 nWcm−2 for each VDS trace. The plot demonstrates that the optimal bias condition for this opto–FET was VDS = 0.5 V and VBG = 2.8 V.
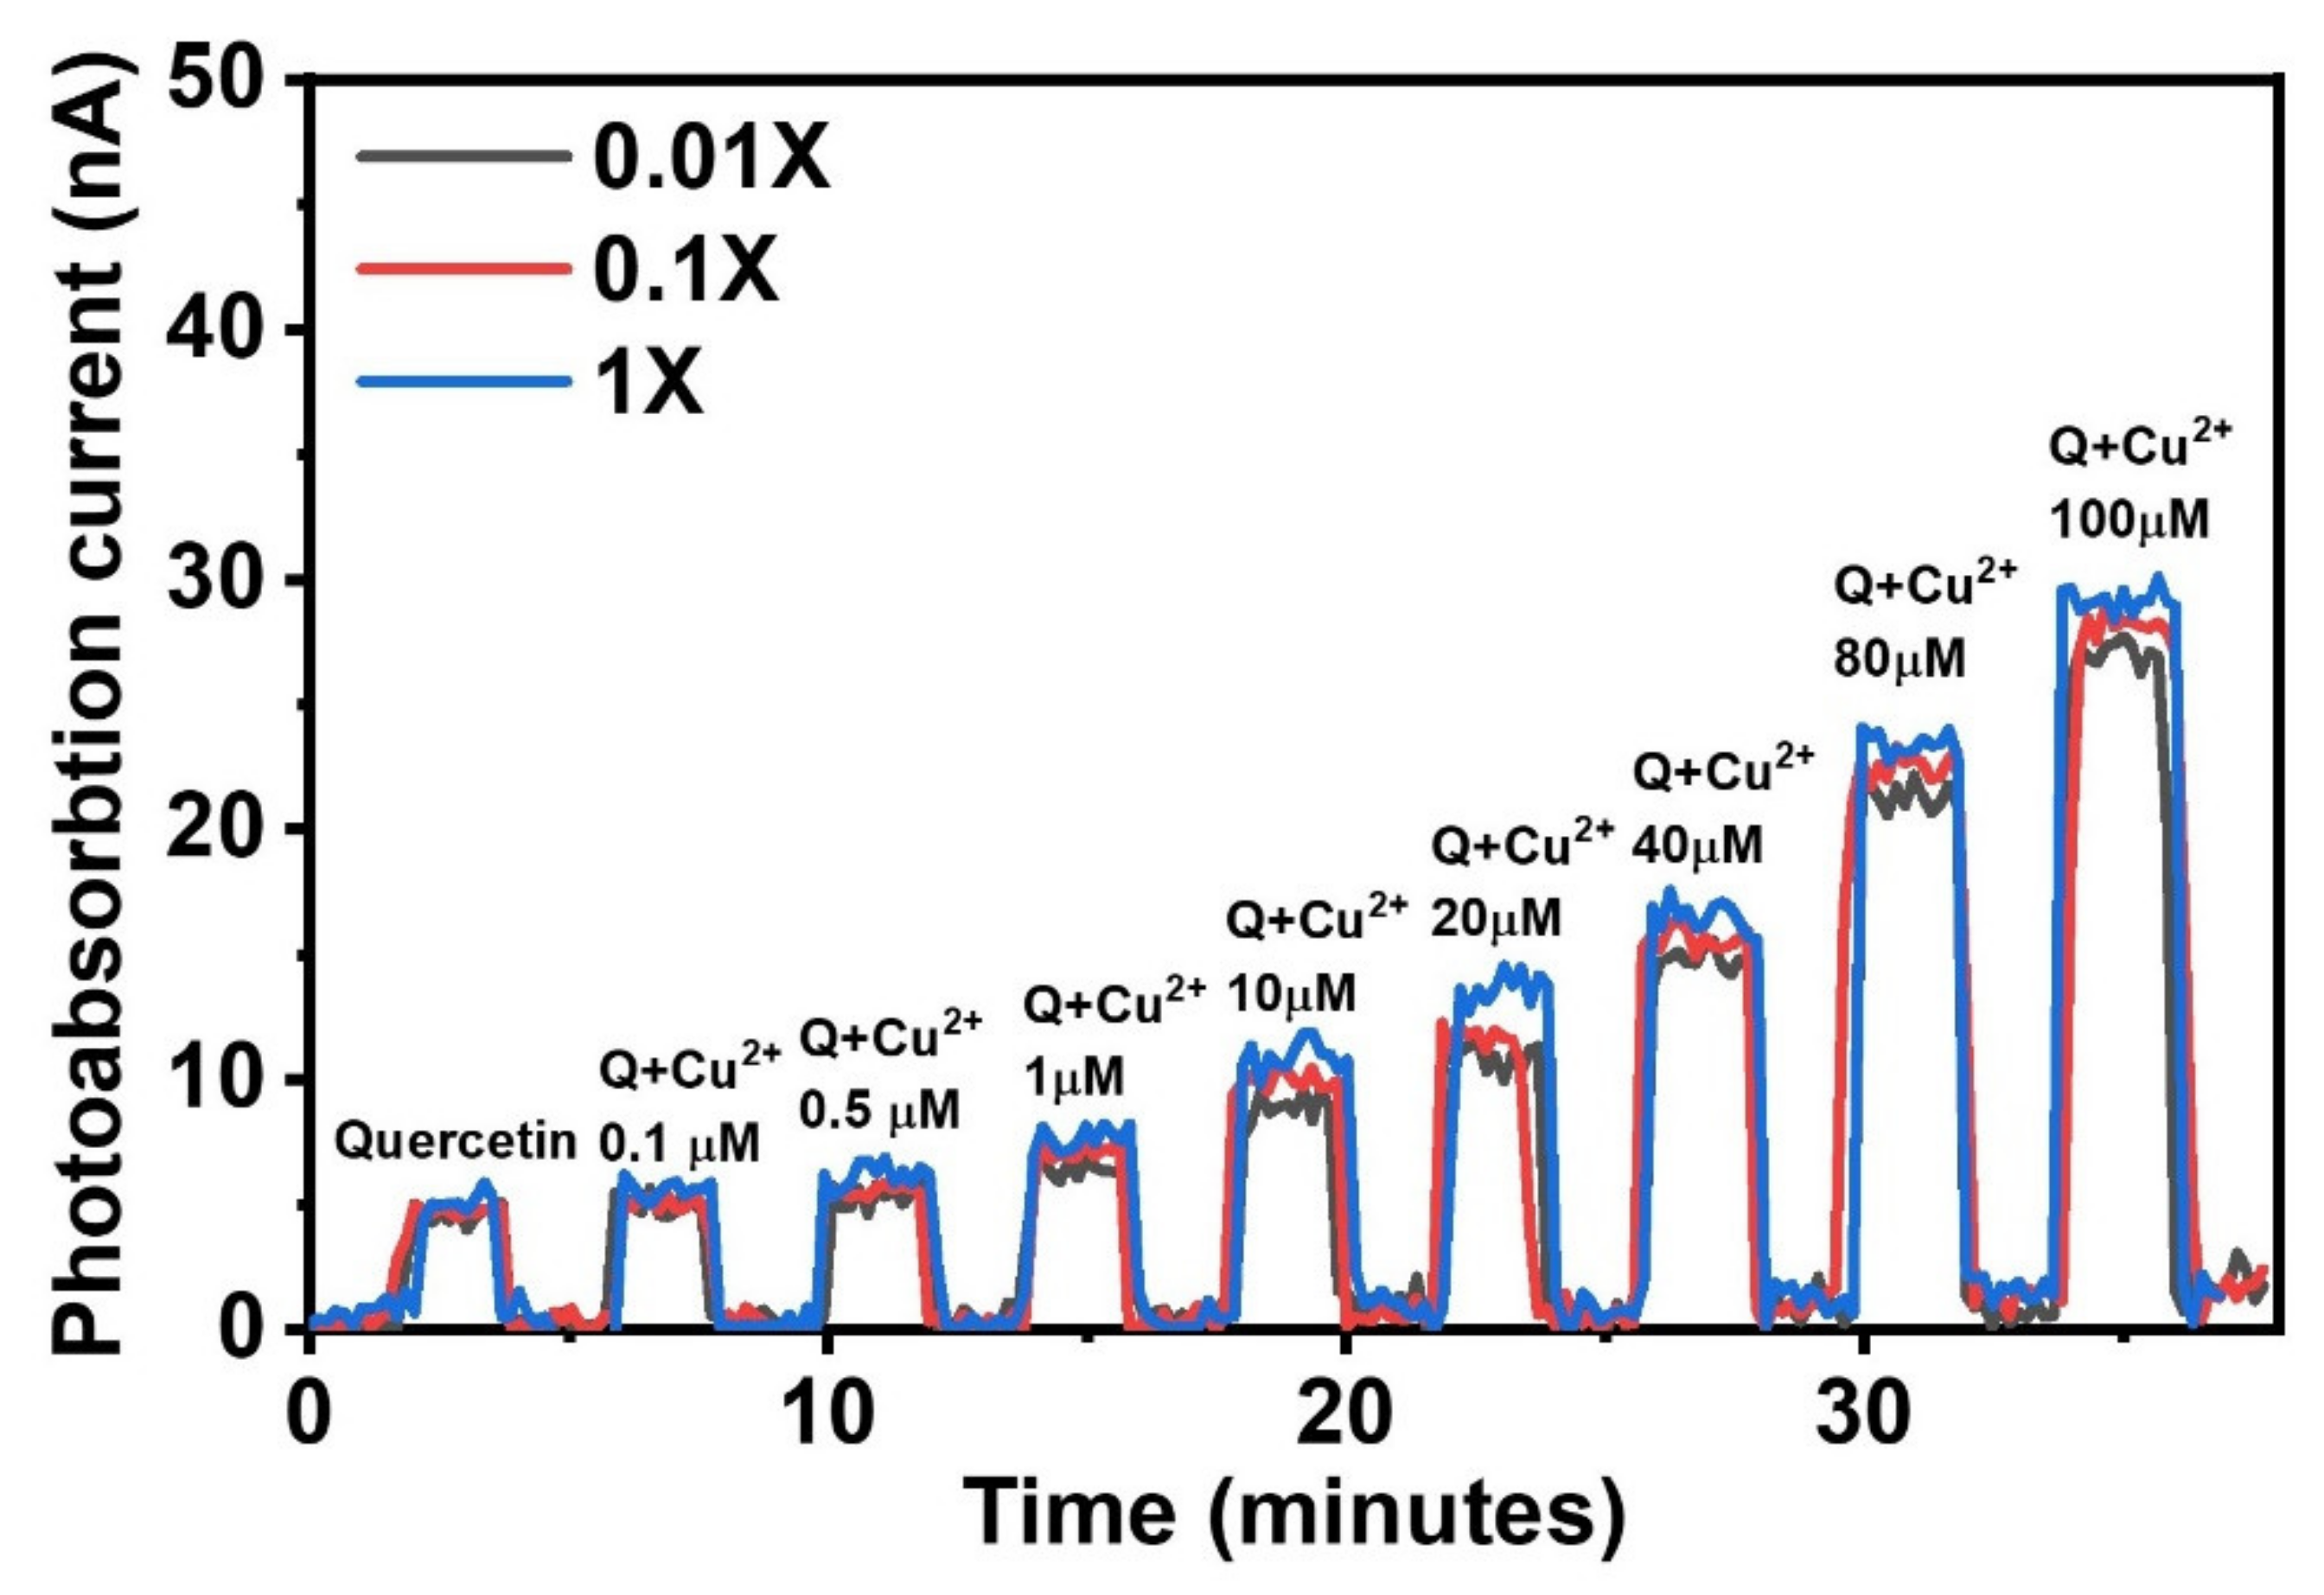
To illustrate the application of the opto–FET approach for the detection of the quercetin–Cu2+ complex, we set the light intensity to a low value of 500 nWcm−2. The solutions were initially mixed in a tube before being injected into the opto-FET fluidic channel. The measurements were performed over several on/off cycles controlled by a light shutter. For quantitative evaluation, various Cu2+ concentrations were tested at different PBS concentrations, as shown in Figure 6. Quercetin was used as the control sample, as it could absorb 450 nm photons. As expected, the photoabsorption current increased with increasing Cu2+ concentration.
The relation between the absorbance of the solution and the absorption molecule concentration is described by the Beer–Lambert law [22]:
where and denote the initial light intensity and the light intensity after passing through the solution, respectively, ϵ is the molar absorptivity with the unit of L mol−1·cm−1, is the photon path length with the unit of cm, and is the concentration of absorbing molecule with units of mol·cm−1. The equation indicates that the number of molecules in the radiation path increases with the length of the path, increasing the absorbance as a result. For a given path length, absorbance is directly proportional to the analyte concentration. This relationship enabled quantitative measurement of the concentration of absorbing molecules. Using Equation (1), we calculated the absorbance of the molecule. As shown in Figure 5b, the transmittance photocurrent () was approximately 100 nA for a light intensity of 500 nWcm−2. The photoabsorption current () was obtained after passing through the solution, as shown in Figure 6. Together, we obtained the absorbance of the quercetin–Cu2+ complex, as shown in Figure 7. The different buffer solutions affected the wavelength during the quercetin–Cu2+ ion activity. Further, the absorption at a wavelength of 450 nm decreased as the buffer concentration decreased due to changes in pH value when the buffer solution was diluted. As reported in the literature [5], pH affects absorption because protons are released when the buffer forms a complex with metal ions.
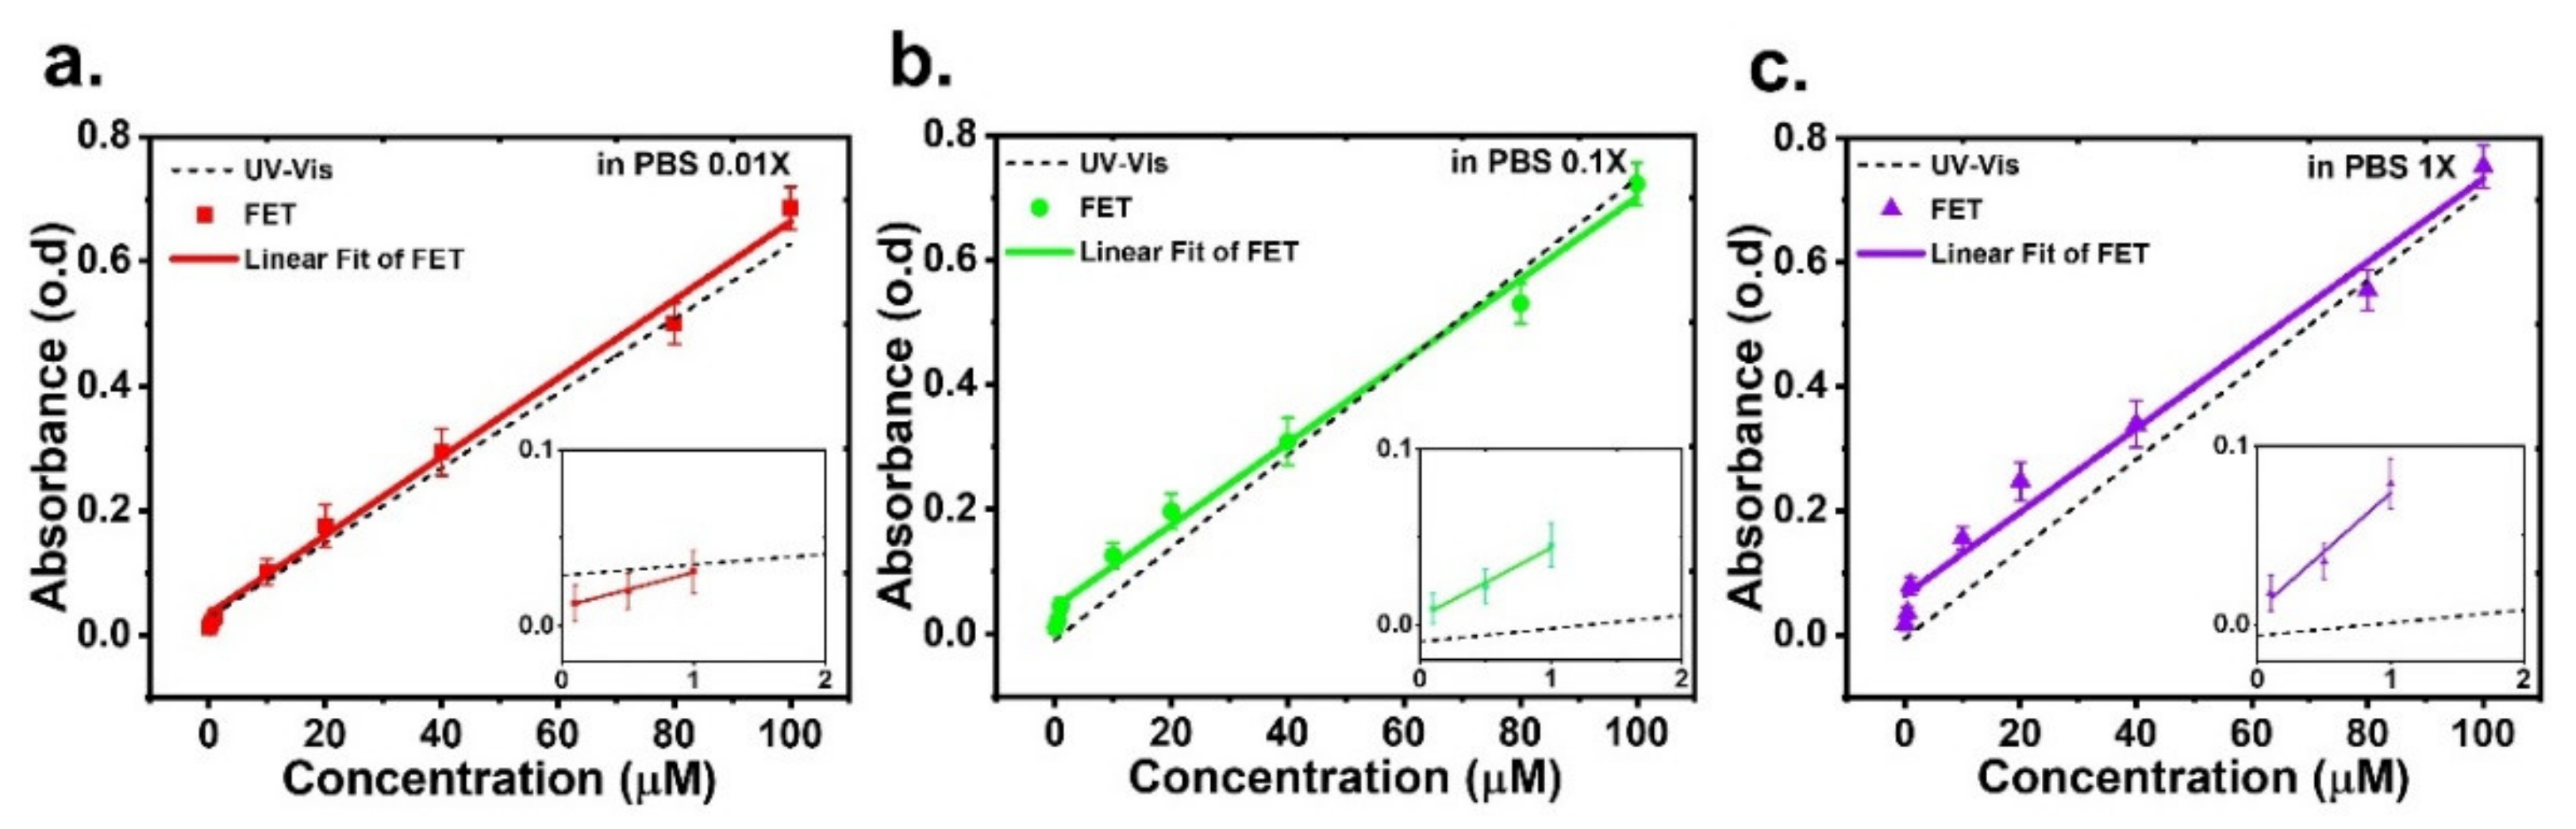
As described in the measurement setup, the fluidic channel in our system was 1.6 mm thick, which was the path length of the sample. Compared with a commercial UV–Vis spectrometer, which has a path length of approximately 10 mm, the sample measured in our system was approximately 6.25 times smaller than that in a UV–Vis spectrum. The magnitude of absorbance in our system was multiplied by 6.25 times for a comparison between our opto–FET sensor and a commercial UV–Vis. We plotted the absorbance as a function of Cu2+ concentration, as shown in Figure 7, along with the absorbance results obtained using a commercial UV–Vis spectrometer in different buffer solutions. With the fluidic channel design, the amount of solution used in the opto–FET system was significantly less compared with that used in the UV–Vis system. Our fluidic system can typically handle high fluid volumes of approximately 14.1 μL; yet it can provide improved sensitivity and accuracy within a few minutes. Therefore, with its advantages, the opto-FET system can be incorporated into existing bio–NWFET sensors, making it a dual-function detection platform for biomolecules.
4. Discussion
An optical biosensing system based on a bio-NWFET has been presented. The entire system was assembled in a compact prototype that demonstrated good photoresponse over a broad wavelength range. The molecular absorption of the quercetin–Cu2+ complex was adopted as the basis for biomedical application in our system. Detection of the molecular absorption of metal complexes was performed for Cu2+ concentrations ranging from 0.1 μM to 100 μM, and the system exhibited a linearity and sensitivity detection of 0.1 μM Cu2+. The measured absorbance was compared with that obtained from a commercial UV–Vis spectrometer. The opto–FET system offers significant potential for the biotechnology and healthcare industries as an optical biosensing device with high detection capability, high reproducibility, and low sample volume requirements.
Supplementary Materials
The following supporting information can be downloaded at: https://0-www-mdpi-com.brum.beds.ac.uk/article/10.3390/s22197219/s1, Figure S1: SEM image of the top view of the NW-FET channel area with a scale bar of 4 μm.; Figure S2: The visual change in molecular absorption of quercetin and Cu2+. The free quercetin (left) followed by mixing of quercetin and various Cu2+concentrations of 1, 10, 20, 40, 60, 80, and 100 μM.
Author Contributions
Conceptualization, P.J.B.L. and C.-D.C.; methodology, P.J.B.L.; software, P.J.B.L.; validation, C.-C.L. and L.-C.T.; formal analysis, C.-D.C. and L.-C.T.; investigation, P.J.B.L. and C.-C.L.; data curation, P.J.B.L.; writing—original draft preparation, P.J.B.L.; writing—review and editing, C.-D.C. and L.-C.T.; visualization, P.J.B.L.; supervision, L.-C.T., K.-S.C.-L., M.K.M. and C.-D.C. All authors have read and agreed to the published version of the manuscript.
Funding
This research received no external funding.
Institutional Review Board Statement
Not applicable.
Informed Consent Statement
Not applicable.
Data Availability Statement
Not applicable.
Acknowledgments
We thank Chia-Jung Chu of Molsentech (www.molsentech.com, accessed on 17 August 2022) for their assistance during the course of this study. Technical support from Nano Core, the Core Facilities for Nanoscience and Nanotechnology at Academia Sinica is acknowledged.
Conflicts of Interest
The authors declare no conflict of interest.
References
- World Health Organization; International Atomic Energy Association; Food and Agriculture Organization (FAO). Trace Elements in Human Nutrition and Health; World Health Organization: Geneva, Switzerland, 1996. [Google Scholar]
- Liu, Y.; Guo, M. Studies on transition metal-quercetin complexes using electrospray ionization tandem mass spectrometry. Molecules 2015, 20, 8583–8594. [Google Scholar] [CrossRef] [PubMed]
- Jiang, W.; Yang, S.; Lu, W.; Gao, B.; Xu, L.; Sun, X.; Jiang, D.; Xu, H.-J.; Ma, M.; Cao, F. A novel fluorescence “turn off-on” nano-sensor for detecting Cu2+ and cysteine in living cells. J. Photochem. Photobiol. A Chem. 2018, 362, 14–20. [Google Scholar] [CrossRef]
- da Silva, W.M.B.; de Oliveira Pinheiro, S.; Alves, D.R.; de Menezes, J.; Magalhaes, F.E.A.; Silva, F.C.O.; Silva, J.; Marinho, E.S.; de Morais, S.M. Synthesis of quercetin-metal complexes, in vitro and in silico anticholinesterase and antioxidant evaluation, and in vivo toxicological and anxiolitic activities. Neurotox. Res. 2020, 37, 893–903. [Google Scholar] [CrossRef] [PubMed]
- Zhang, L.; Liu, Y.; Wang, Y.; Xu, M.; Hu, X. UV-Vis spectroscopy combined with chemometric study on the interactions of three dietary flavonoids with copper ions. Food Chem. 2018, 263, 208–215. [Google Scholar] [CrossRef]
- Pekal, A.; Biesaga, M.; Pyrzynska, K. Interaction of quercetin with copper ions: Complexation, oxidation and reactivity towards radicals. Biometals 2011, 24, 41–49. [Google Scholar] [CrossRef]
- Tapiero, H.; Townsend, D.M.; Tew, K.D. Trace elements in human physiology and pathology. Copper. Biomed. Pharmacother. 2003, 57, 386–398. [Google Scholar] [CrossRef]
- Ravichandran, R.; Rajendran, M.; Devapiriam, D. Antioxidant study of quercetin and their metal complex and determination of stability constant by spectrophotometry method. Food Chem. 2014, 146, 472–478. [Google Scholar] [CrossRef]
- de Castilho, T.S.; Matias, T.B.; Nicolini, K.P.; Nicolini, J. Study of interaction between metal ions and quercetin. Food Sci. Hum. Wellness 2018, 7, 215–219. [Google Scholar] [CrossRef]
- Kalinowska, M.; Lewandowska, H.; Pruszyński, M.; Świderski, G.; Gołębiewska, E.; Gryko, K.; Braun, J.; Borkowska, M.; Konieczna, M.; Lewandowski, W. Co(II) complex of quercetin–spectral, anti-/pro-oxidant and cytotoxic activity in hacat cell lines. Appl. Sci. 2021, 11, 9244. [Google Scholar] [CrossRef]
- Malesev, D.; Kuntic, V. Investigation of metal-flavonoid chelates and the determination of flavonoids via metal-flavonoid complexing reactions. J. Serb. Chem. Soc. 2007, 72, 921–939. [Google Scholar] [CrossRef]
- Lewis, T.; Wallace, W.; Peterson, F.D.; Rafferty, S.; Martic, S. Reactivities of quercetin and metallo-quercetin with superoxide anion radical and molecular oxygen. Electrochem. Sci. Adv. 2021, 2, e2100054. [Google Scholar] [CrossRef]
- Dai, P.; Gao, A.; Lu, N.; Li, T.; Wang, Y. A back-gate controlled silicon nanowire sensor with sensitivity improvement for DNA and ph detection. Jpn. J. Appl. Phys. 2013, 52, 121301. [Google Scholar] [CrossRef]
- Wu, T.; Alharbi, A.; You, K.D.; Kisslinger, K.; Stach, E.A.; Shahrjerdi, D. Experimental study of the detection limit in dual-gate biosensors using ultrathin silicon transistors. ACS Nano 2017, 11, 7142–7147. [Google Scholar] [CrossRef] [PubMed]
- Alharbi, A.G.; Shafi, N. Liquid gate and back gate capacitive coupling effects in ph sensing performance of finfets. Silicon 2022. [Google Scholar] [CrossRef]
- Seo, G.; Lee, G.; Kim, M.J.; Baek, S.H.; Choi, M.; Ku, K.B.; Lee, C.S.; Jun, S.; Park, D.; Kim, H.G.; et al. Rapid detection of COVID-19 causative virus (SARS-CoV-2) in human nasopharyngeal swab specimens using field-effect transistor-based biosensor. ACS Nano 2020, 14, 5135–5142. [Google Scholar] [CrossRef]
- Zhang, H.; Kikuchi, N.; Ohshima, N.; Kajisa, T.; Sakata, T.; Izumi, T.; Sone, H. Design and fabrication of silicon nanowire-based biosensors with integration of critical factors: Toward ultrasensitive specific detection of biomolecules. ACS Appl. Mater. Interfaces 2020, 12, 51808–51819. [Google Scholar] [CrossRef]
- Laksana, P.J.B.; Tsai, L.-C.; Wei, T.-Y.; Lan, P.-C.; Chang-Liao, K.-S.; Moodley, M.K.; Chen, C.-D. A dual function electro-optical silicon field-effect transistor molecular sensor. J. Mater. Chem. C 2021, 9, 14286–14293. [Google Scholar] [CrossRef]
- Zhang, A.; Lieber, C.M. Nano-bioelectronics. Chem. Rev. 2016, 116, 215–257. [Google Scholar] [CrossRef]
- Hu, X.; Li, S.; Jiang, Z.; Yang, X. Photoelectrical properties investigated on individual si nanowires and their size dependence. Nanoscale Res. Lett. 2021, 16, 18. [Google Scholar] [CrossRef]
- Baek, E.; Rim, T.; Schutt, J.; Baek, C.K.; Kim, K.; Baraban, L.; Cuniberti, G. Negative photoconductance in heavily doped Si nanowire field-effect transistors. Nano Lett. 2017, 17, 6727–6734. [Google Scholar] [CrossRef]
- Swinehart, D.F. The beer-lambert law. J. Chem. Educ. 1962, 39, 333. [Google Scholar] [CrossRef]
Figure 1.
The block diagram and photographs of the measurement system.

Figure 2.
(a) UV–Vis absorption spectra of quercetin and various concentrations of Cu2+ in 1X PBS showing two peaks at 380 nm and 450 nm, and (b) the absorbance as a function of Cu2+ concentration at 450 nm.
Figure 2.
(a) UV–Vis absorption spectra of quercetin and various concentrations of Cu2+ in 1X PBS showing two peaks at 380 nm and 450 nm, and (b) the absorbance as a function of Cu2+ concentration at 450 nm.

Figure 3.
Electrical characteristics of NW-FET (a) transfer characteristics (IDS–VDS) at various VBG from −1 V to 3 V and (b) output characteristics (IDS–VBG) at various VDS from 0.1 V to 4 V.
Figure 3.
Electrical characteristics of NW-FET (a) transfer characteristics (IDS–VDS) at various VBG from −1 V to 3 V and (b) output characteristics (IDS–VBG) at various VDS from 0.1 V to 4 V.

Figure 4.
(a). IDS–VBG of an opto-FET device with VDS = 0.5 V, λ = 450 nm in the dark (black) and under light illumination of 200 (blue), 500 (green), 1000 (light green), 2000 (orange) and 4000 (red) in unit of nW cm−2. and (b) the photo-response of the device captured under illumination of the wavelength ranging between 300 nm and 1100 nm. The dark current (dashed black), illumination current (blue) and photocurrent (red). The spectrum is taken with VDS = 0.5 V, VBG = 4 V and intensity is 500 nW cm−2. Inset in (a), the schematic diagram of the opto-FET under light illumination.

Figure 5.
(a) The photocurrent at a wavelength of 450 nm plotted as functions of VBG and light intensities, for VDS at 0.2 V, 0.5 V, 1 V, 2 V, and 3 V. The color scale bar is shown on the right. (b) The photocurrent as a function of light intensity. It shows a linear dependence at VDS 0.5 V and VBG = 2.8 V.

Figure 6.
Absorption measurement of quercetin–Cu2+ ion mixture for various Cu2+ concentrations ranging from 0.1 μM to 100 μM in three different concentrations of PBS solution. A 100 μM quercetin was used as a control sample.
Figure 6.
Absorption measurement of quercetin–Cu2+ ion mixture for various Cu2+ concentrations ranging from 0.1 μM to 100 μM in three different concentrations of PBS solution. A 100 μM quercetin was used as a control sample.

Figure 7.
A comparison between the absorbance obtained with our opto-FET system (solid lines) and with a commercial UV–Vis spectrometer (dot-dashed lines) in PBS concentration of (a) 0.01X (b) 0.1X, and (c) 1X. The evaluation was performed at a wavelength of 450 nm and light intensity at 500 nWcm−2, VDS = 0.5 V, and VBG = 2.8 V.

Publisher’s Note: MDPI stays neutral with regard to jurisdictional claims in published maps and institutional affiliations. |
© 2022 by the authors. Licensee MDPI, Basel, Switzerland. This article is an open access article distributed under the terms and conditions of the Creative Commons Attribution (CC BY) license (https://creativecommons.org/licenses/by/4.0/).
Share and Cite
MDPI and ACS Style
Laksana, P.J.B.; Tsai, L.-C.; Lin, C.-C.; Chang-Liao, K.-S.; Moodley, M.K.; Chen, C.-D. Opto Field-Effect Transistors for Detecting Quercetin–Cu2+ Complex. Sensors 2022, 22, 7219. https://0-doi-org.brum.beds.ac.uk/10.3390/s22197219
AMA Style
Laksana PJB, Tsai L-C, Lin C-C, Chang-Liao K-S, Moodley MK, Chen C-D. Opto Field-Effect Transistors for Detecting Quercetin–Cu2+ Complex. Sensors. 2022; 22(19):7219. https://0-doi-org.brum.beds.ac.uk/10.3390/s22197219
Chicago/Turabian StyleLaksana, Pradhana Jati Budhi, Li-Chu Tsai, Chang-Cheng Lin, Kuei-Shu Chang-Liao, Mathew K. Moodley, and Chii-Dong Chen. 2022. "Opto Field-Effect Transistors for Detecting Quercetin–Cu2+ Complex" Sensors 22, no. 19: 7219. https://0-doi-org.brum.beds.ac.uk/10.3390/s22197219
Note that from the first issue of 2016, this journal uses article numbers instead of page numbers. See further details here.