
Analysis of the Results of the Borowiec SLR Station (7811) for the Period 1993–2019 as an Example of the Quality Assessment of Satellite Laser Ranging Stations

 ,
,  , ,
, ,
Abstract
:1. Introduction
2. Materials and Methods-Hardware of Borowiec SLR Station in 1993–2019
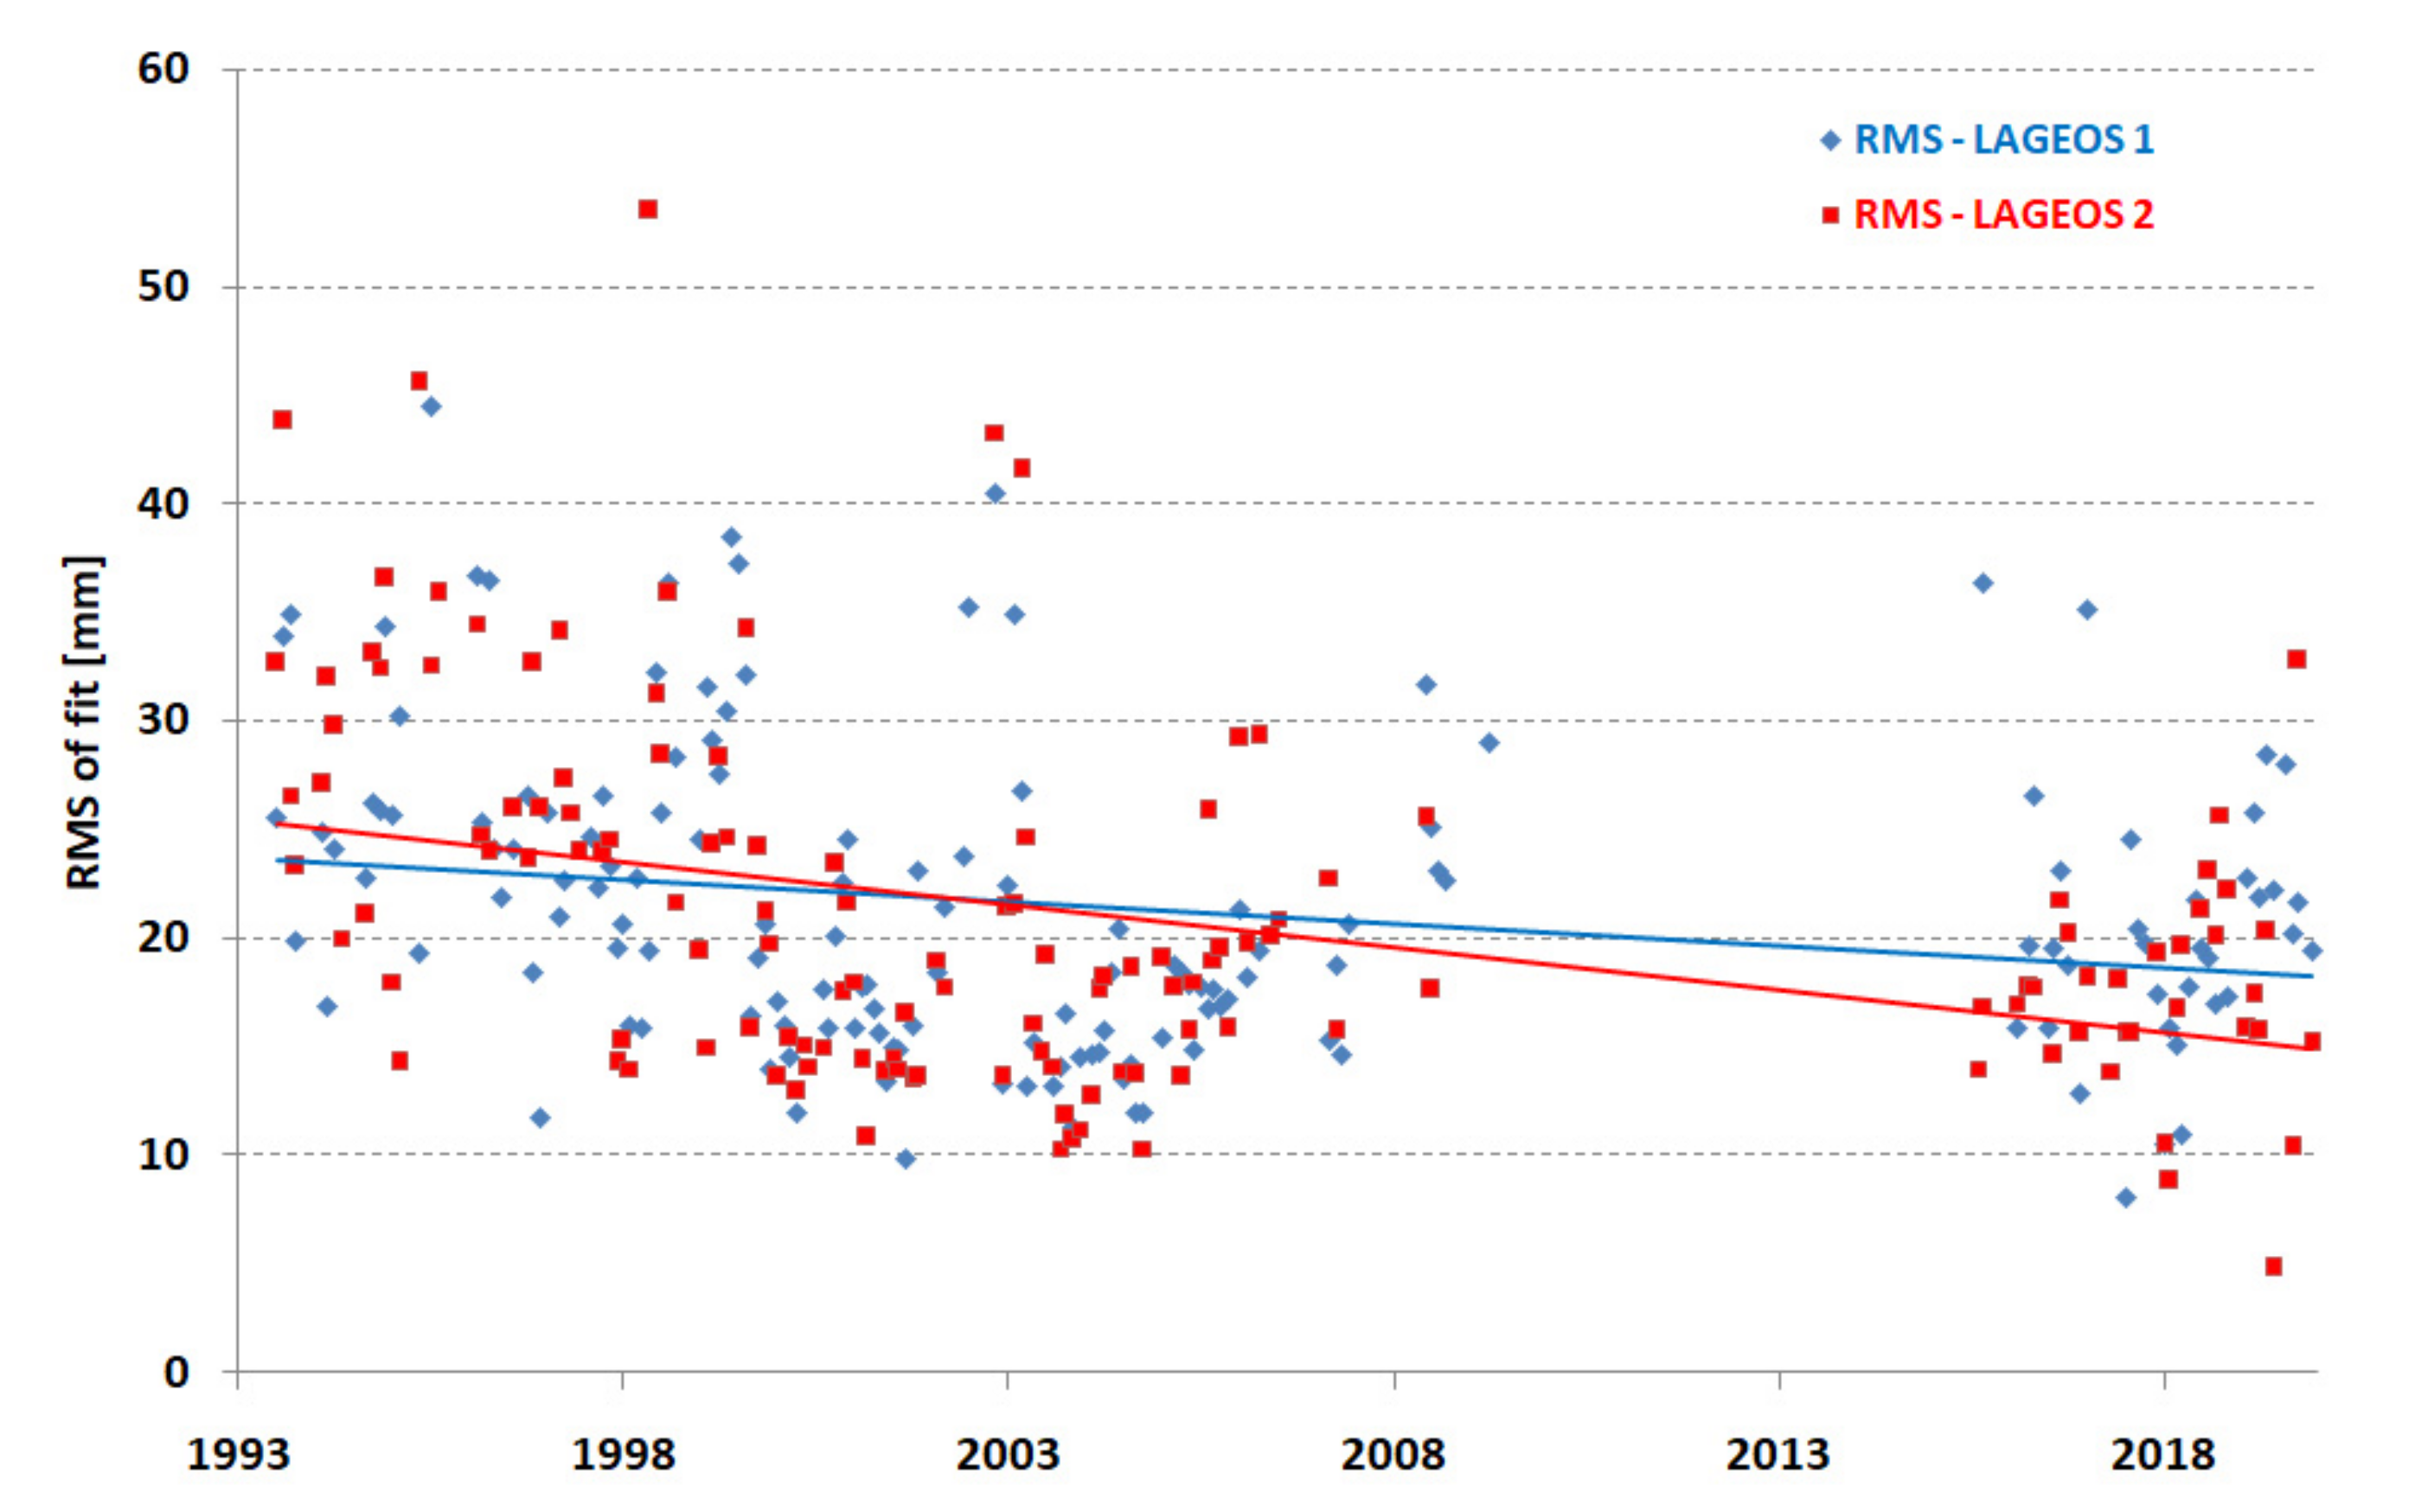
3. Data and Methods-Orbits Determination of LAGEOS Satellites
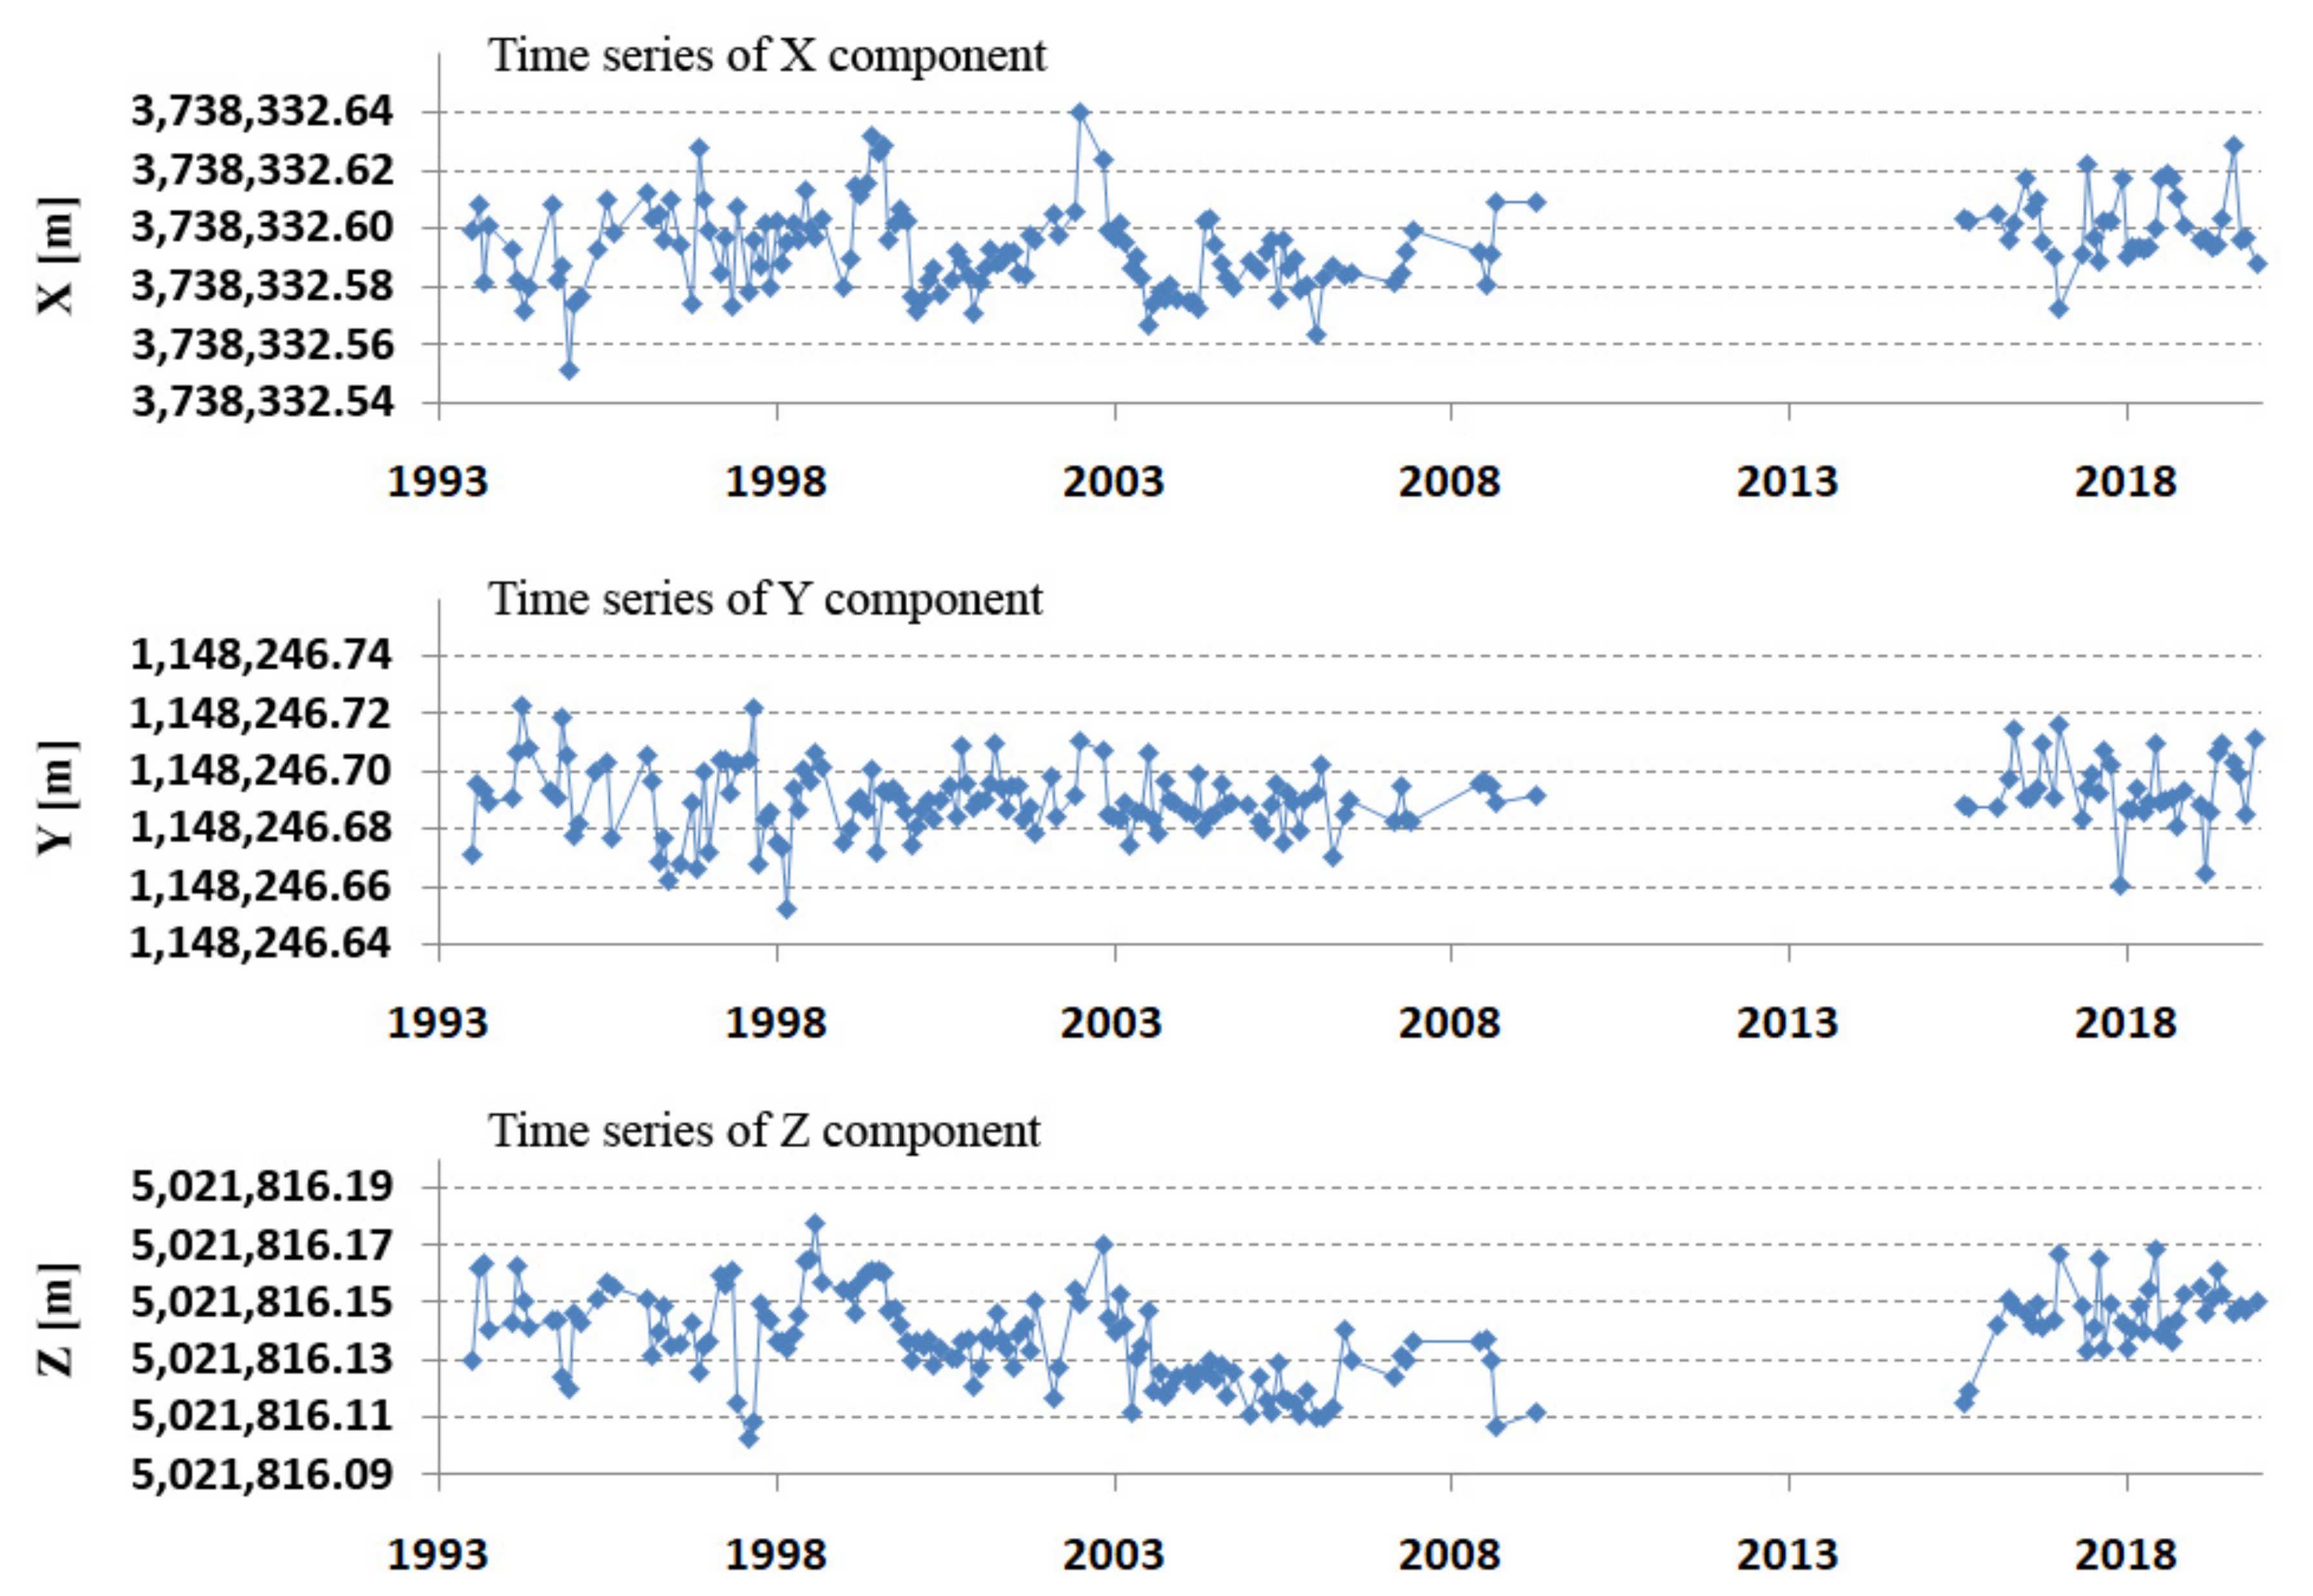
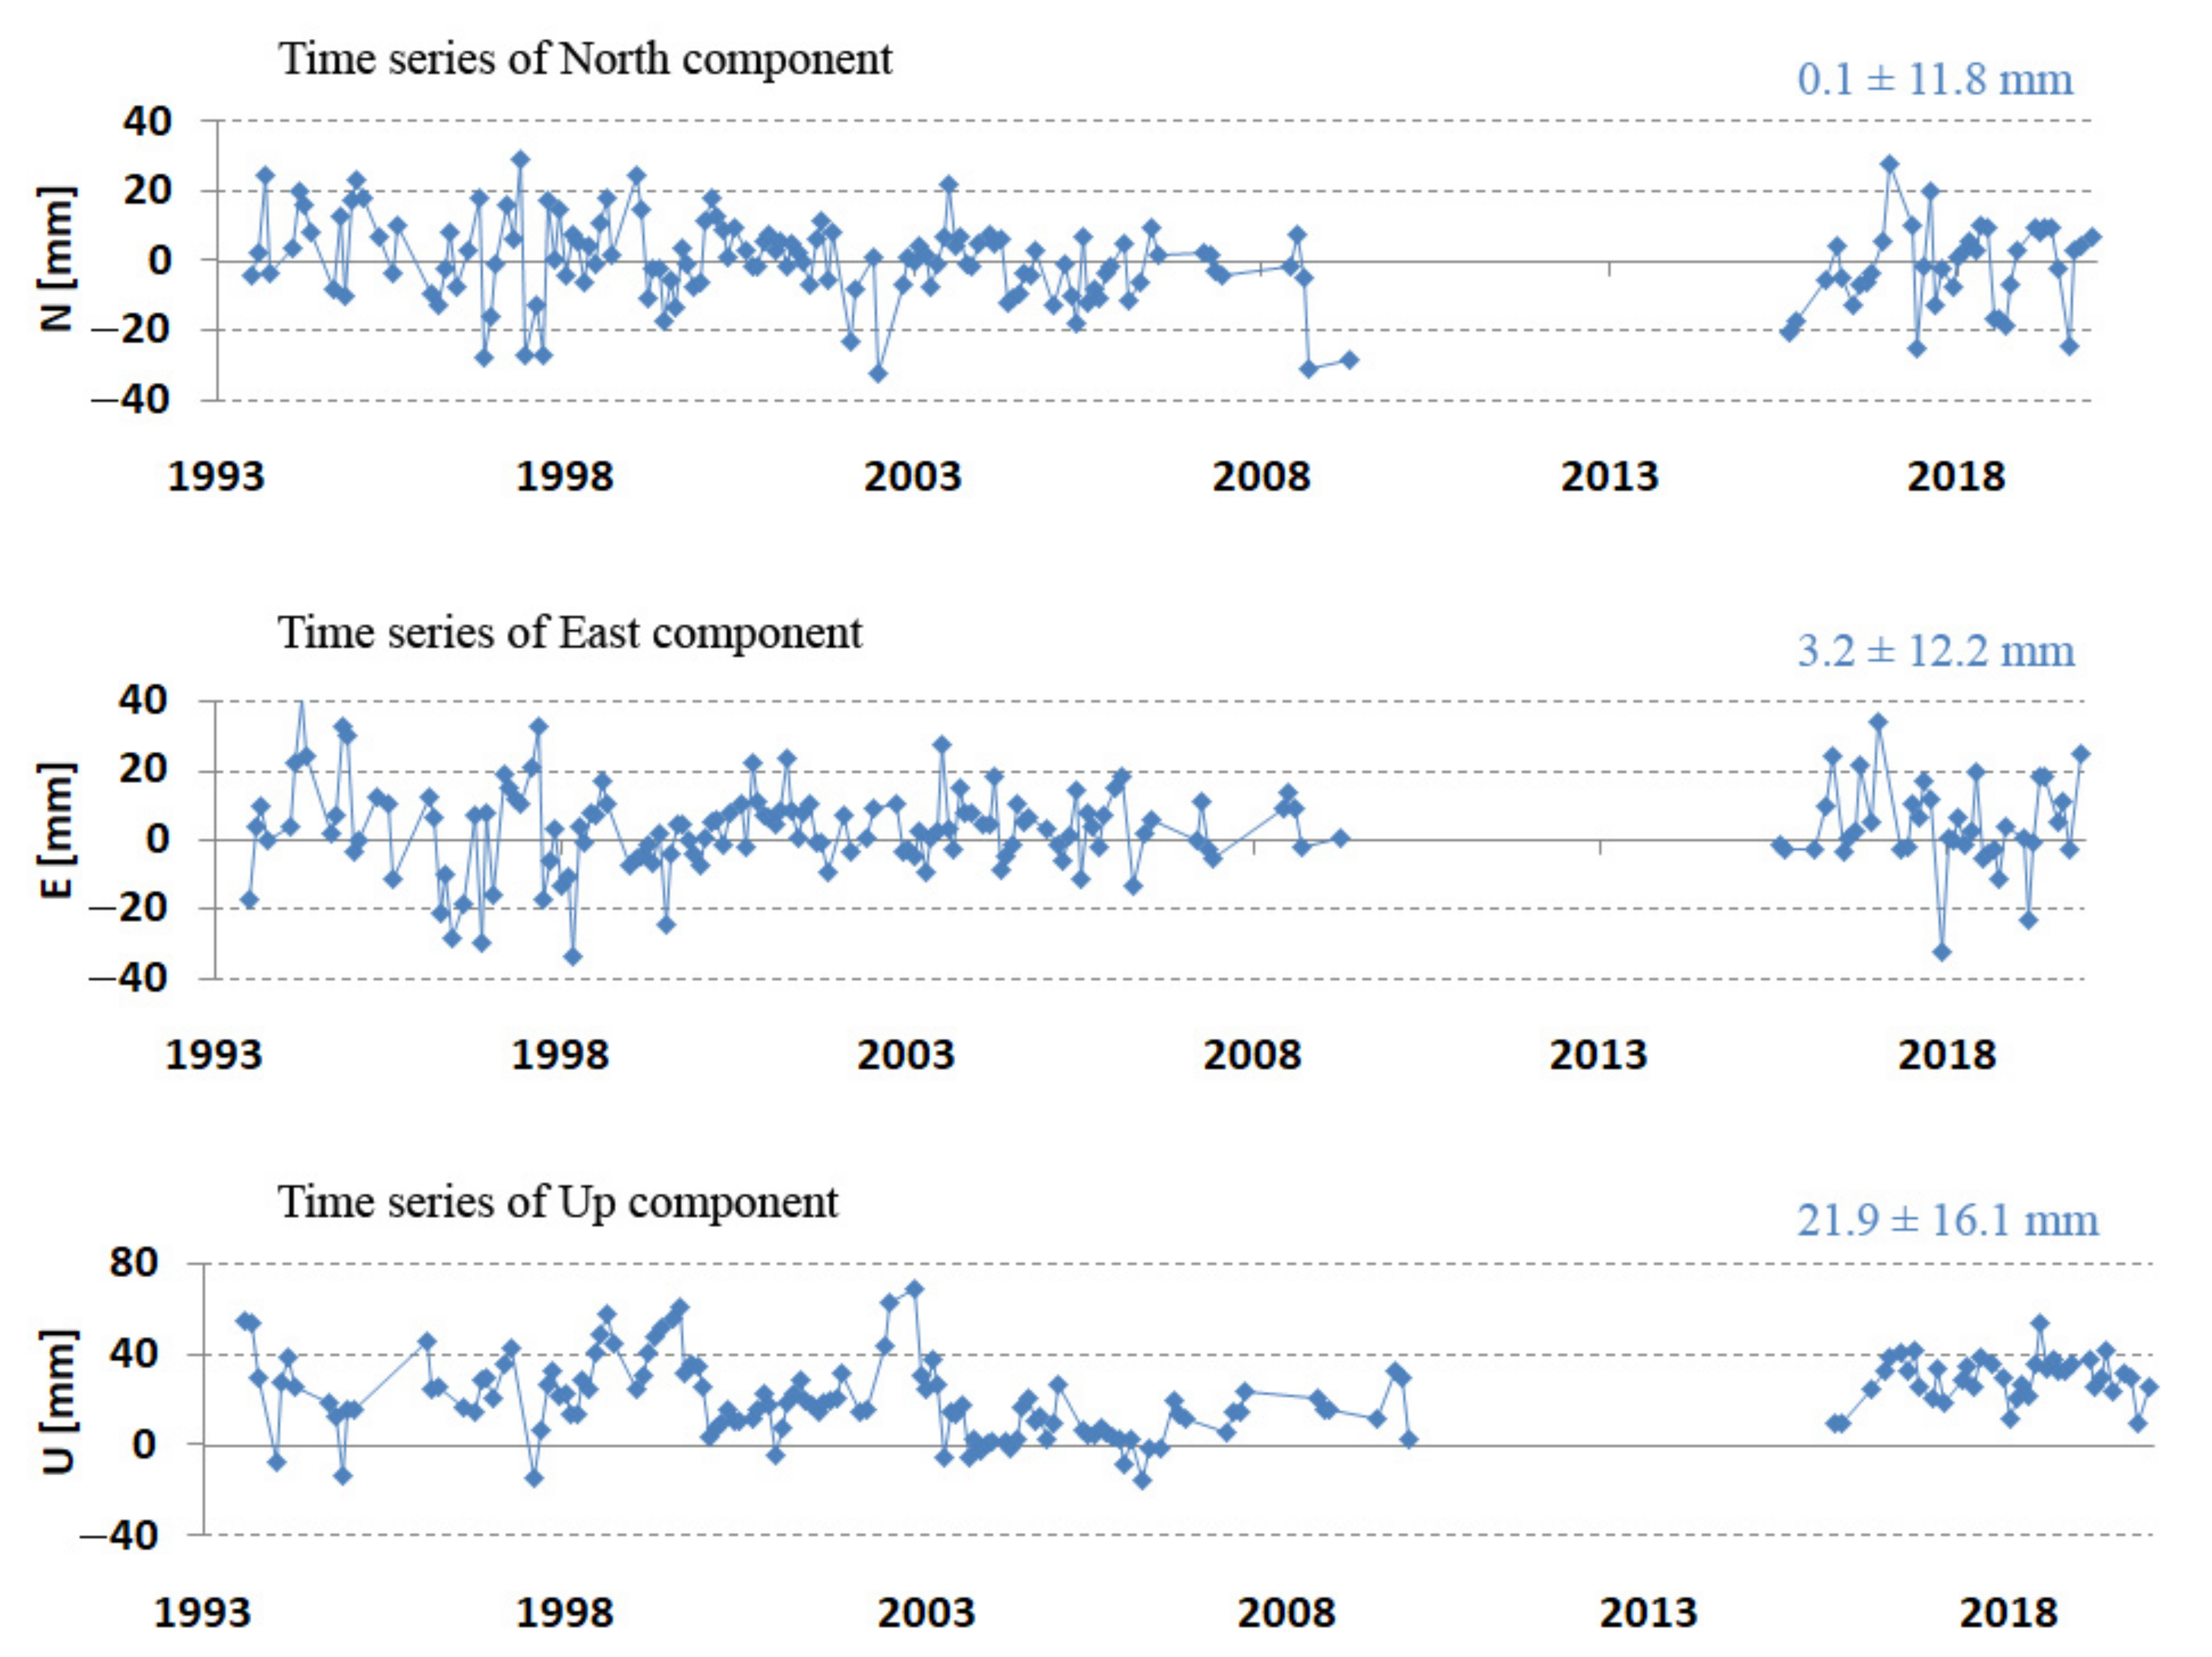
4. Results-Position of Borowiec SLR Station
5. Results: Velocity of Borowiec SLR Station
6. Discussion and Conclusions
Author Contributions
Funding
Institutional Review Board Statement
Informed Consent Statement
Data Availability Statement
Acknowledgments
Conflicts of Interest
References
- SLR Monthly Global Performance Report Card. Available online: https://ilrs.gsfc.nasa.gov/network/system_performance/global_report_cards/quarterly/2021/Q2/2021_Q2_report_card.html (accessed on 11 August 2021).
- ILRS ASC Product and Information Server. Available online: http://geodesy.jcet.umbc.edu/ILRS_AWG_MONITORING/ (accessed on 26 August 2021).
- Geoscience Hitotsubashi: Multi-Satellite Bias Analysis Report. Available online: https://geo.science.hit-u.ac.jp/slr/bias/ (accessed on 26 August 2021).
- DGFI-TUM ILRS Analysis Centre. Available online: http://ilrs.dgfi.tum.de/quality/weekly_biases/stations/ (accessed on 26 August 2021).
- Zimmerwald: ILRS Combined Range Bias Report. Available online: http://ftp.aiub.unibe.ch/slr/summary_report.txt (accessed on 26 August 2021).
- Alothman, A.O.; Schillak, S. Recent results for the Arabian plate motion using satellite laser ranging observations of Riyadh SLR station to LAGEOS-1 and LAGEOS-2 satellites. Arab. J. Sci. Eng. 2014, 39, 217–226. [Google Scholar] [CrossRef]
- Schillak, S. Satellite Laser Ranging in Poland 1976–1996. Artif. Satell. Planet. Geod. 1996, 31, 163–177. [Google Scholar]
- Lejba, P.; Suchodolski, T.; Schillak, S.; Bartoszak, J.; Michałek, P.; Zapaśnik, S. New face of the Borowiec satellite laser ranging station. In Proceedings of the NASA of 20th International Workshop on Laser Ranging, Potsdam, Germany, 9–14 October 2016. [Google Scholar]
- Pearlman, M.R.; Noll, C.E.; Pavlis, E.C.; Lemoine, F.G.; Combrink, L.; Degnan, J.D.; Kirchner, G.; Schreiber, U. The ILRS: Approaching 20 years and planning for the future. J. Geod. 2019, 93, 2161–2180. [Google Scholar] [CrossRef]
- Pavlis, D.E.; Luo, S.; Dahiroc, P.; McCarthy, J.J.; Lutchke, S.B. GEODYN II System Description; Hughes STX Contractor Report; Hughes STX: Greenbelt, MD, USA, 1998. [Google Scholar]
- Altamimi, Z.; Rebischung, P.; Metivier, L.; Collilieux, X. ITRF2014: A new release of the International Terrestrial Reference Frame modeling nonlinear station motions. J. Geophys. Res. Solid Earth 2016, 121, 6109–6131. [Google Scholar] [CrossRef] [Green Version]
- Strugarek, D.; Sośnica, K.; Arnold, D.; Jäggi, A.; Zajdel, R.; Bury, G. Determination of SLR station coordinates based on LEO, LARES, LAGEOS, and Galileo satellites. Earth Planets Space 2021, 73, 1–21. [Google Scholar] [CrossRef]
- Schillak, S. Analysis of the process of the determination of station coordinates by the satellite laser ranging based on results of the Borowiec SLR station in 1993.5–2000.5 Part 1: Performance of the satellite laser ranging. Artif. Satell. Planet. Geod. 2004, 39, 217–263. [Google Scholar]
- Lejba, P.; Suchodolski, T.; Michałek, P.; Bartoszak, J.; Schillak, S.; Zapaśnik, S. First laser measurements to space debris in Poland. Adv. Space Res. 2018, 61, 2609–2616. [Google Scholar] [CrossRef]
- Degnan, J. Milimeter Accuracy Satellite Laser Ranging: A Review. Contrib. Space Geod. Technol. Geodyn. 1993, 25, 133–162. [Google Scholar]
- Arnold, D. Cross Section of ILRS Satellites; ILRS Technical Workshop: Bad-Koetzting, Germany, 2003. Available online: https://ilrs.cddis.eosdis.nasa.gov/docs/CrossSectionReport.pdf (accessed on 30 June 2020).
- Schillak, S. Analysis of the process of the determination of station coordinates by the satellite laser ranging based on results of the Borowiec SLR station in 1993.5–2000.5 Part 2: Determination of the station coordinates. Artif. Satell. Planet. Geod. 2004, 39, 265–287. [Google Scholar]
- Torrence, M.H.; Klosko, S.M.; Christodoulidis, D.C. The construction and testing of normal point at Goddard Space Flight Center. In Proceedings of the 5th International Workshop on Laser Ranging Instrumentation; Herstmonceux, UK, 10–14 September 1984, Volume 2, pp. 506–516. Available online: https://ilrs.gsfc.nasa.gov/about/reports/workshop/lw05.html (accessed on 25 November 2019).
- Pavlis, N.K.; Holmes, S.A.; Kenyon, S.C.; Factor, J.K. An Earth Gravitational Model to Degree 2160:EGM2008. In Proceedings of the 2008 General Assembly of the European Geoscience Union, Vienna, Austria, 13–18 April 2008. [Google Scholar]
- McCarthy, D.D.; Petit, G. (Eds.) IERS Conventions (2003); IERS Technical Note No. 32, International Earth Rotation and Reference Systems Service; Bundesamt für Kartographie und Geodäsie: Frankfurt am Main, Germany, 2004. [Google Scholar]
- Ray, R.D. A Global Ocean Tide Model from TOPEX/POSEIDON Altimetry: GOT99.2; NASA/TMm1999–200478; National Aeronautics and Space Administration, Goddard Space Flight Center: Prince George's County, MD, USA, 1999; pp. 1–66. [Google Scholar]
- Standish, E.M.; Newhall, X.X.; Williams, J.G.; Folkner, W.F. JPL Planetary and Lunar Ephemerides DE403/LE403. JPL IOM 1995, 31, 10–127. [Google Scholar]
- Petit, G.; Luzum, B. (Eds.) IERS Conventions (2010); IERS Technical Note No. 36, International Earth Rotation and Reference Systems Service; Bundesamt für Kartographie und Geodäsie: Frankfurt am Main, Germany, 2010. [Google Scholar]
- ILRS. SLRF2014 Station Coordinates. 2017. Available online: https://cddis.nasa.gov/archive/slr/products/resource/SLRF2014_POS+VEL_2030.0_200428.snx (accessed on 25 September 2021).
- Mendes, V.B.; Prates, G.; Pavlis, E.C.; Pavlis, D.E.; Langley, R.B. Improved mapping functions for atmospheric refraction in SLR. Geophys. Res. Lett. 2002, 29, 53-1–53-4. [Google Scholar] [CrossRef] [Green Version]
- Mendes, V.B.; Pavlis, E.C. High-accuracy zenith delay prediction at optical wavelengths. Geophys. Res. Lett. 2004, 31, L14602. [Google Scholar] [CrossRef] [Green Version]
- Borkowski, K.M. Accurate algorithms to transform geocentric to geographic coordinates. Bull. Geod. 1989, 63, 50–56. [Google Scholar] [CrossRef]
- Lejba, P.; Schillak, S. Determination of station positions and velocities from laser ranging observations to Ajisai, Starlette and Stella satellites. Adv. Space Res. 2011, 47, 654–662. [Google Scholar] [CrossRef]


| YYYYDDD | SECTION | DESCRIPTION |
|---|---|---|
| 1993202 | TIME | Rb-frequency standard for PS-500 Timer |
| 1994271 | TIME | PS-500-2 Timer replaced PS-500 Timer |
| 1995052 | SOFTWARE | New controller computer PC-486, new real-time software, new tracking system |
| 1995213 | TIME | Rb-2 frequency standard replaced Rb-standard |
| 1997034 | ELECTRONICS | PMT HAMAMATSU H5023 replaced PMT RCA-8852 |
| 1997065 | TELESCOPE | CCD camera installed |
| 1997077 | TIME | Cesium frequency standard replaced Rb-2 standard |
| 1997110 | ELECTRONICS | Amplifier HAMAMATSU C5594 installed |
| 1997155 | ELECTRONICS | PMT RCA-8852 replaced HAMAMATSU H5023 |
| 1997310 | ELECTRONICS | PMT HAMAMATSU H5023 replaced RCA-8852 |
| 1998035 | CALIBRATION | New ground target—distance 241.086 m |
| 1998139 | ELECTRONICS | Time Interval Counter STANFORD SR620 replaced PS-500-2 |
| 1998182 | METEO | VAISALA meteo sensors installed; pressure PTB200A, temp. and humidity HMP45D |
| 1998182 | ELECTRONICS | Installation of the Time Interval Counter PS-500-2 |
| 2001342 | TIME | New time and frequency source—cesium frequency standard HP5071A ver. 001 |
| 2001342 | TELESCOPE | New CCD camera installed |
| 2002127 | ELECTRONICS | Time Interval Counter PS500-2 replaced by STANFORD SR620 |
| 2002319 | ELECTRONICS | Time Interval Counter STANFORD SR620 replaced by STANFORD SR620B |
| 2002323 | ELECTRONICS | New start fast photodiode and discriminator TENNELEC 454 in start channel |
| 2003088 | ELECTRONICS | Discriminator B6 replaced by discriminator TENNELEC TC454 in stop channel |
| 2007361 | TELESCOPE | New cover of the main and secondary mirrors, prisms replaced by dielectric mirrors in Coude path, transmitting telescope (10 cm) installed with the system of the output beam divergence adjustment, air conditioning system for electronics and computers, new controller computers, new input/output software |
| 2013352 | LASER | Installation of an optical table for laser |
| 2014021 | LASER | Installation of a new laser EKSPLA PL-2250 |
| 2014203 | TELESCOPE | A new optics was replaced in the receiving telescope including primary and secondary mirrors of the telescope |
| 2014217 | TELESCOPE | Milling of stands for dielectric mirrors of Coude path. Installation all mirrors (5 pieces) in Coude path |
| 2014265 | RECEIVER | Installation of a high-speed start Si photodiode FDS025 working in a range from 400 to 1100 nm |
| 2014282 | SOFTWARE | Delay changing in calibration program (from 50 to 10) |
| 2015019 | TELESCOPE | Two lenses mounting (on the telescope tube and movable lens inside the tube) |
| 2015042 | COMPUTER | New MASTER computer: Award Medallion BIOS v6.0, ASUS CUV4X ACPI BIOS Revision 1006, Intel (R) Pentium (R) III 1000 MHz, 768 MB |
| 2015086 | ELECTRONICS | Gate generator input set to 1.0 V, moment of the laser shot set to D gate generator output |
| 2015126 | ELECTRONICS | Time-lock in gate generator switch from T0 to CD (negated) |
| 2016314 | COMPUTER | New MASTER computer: Compaq, RAM 32 GB, Pentium Celeron 333 MHz, 4.7 GB 33 MHz, ISA 10 MB, PC ISA DB25 |
| 2017081 | SYSTEM | New control unit responsible for steering of the laser beam during the observations |
| 2017117 | TELESCOPE | New mounting of the lens in the transmitter tube of the main telescope |
| 2017145 | RECEIVER | New start pulse for STANFORD counter from −0.4 V to −0.3 V |
| 2017149 | TELESCOPE | Observation filter change from 1 to 3 |
| 2017172 | TELESCOPE | Stepper motors exchanged in the control unit responsible for steering of the laser beam during the observations |
| 2017349 | METEO | New pressure, temperature and humidity sensor has been installed (BOSCH 280) |
| 2018037 | RECEIVER | New amplitude of the start pulse for EKSPLA laser. New value is −2.5 V (100% of power) |
| 2018046 | TELESCOPE | Correction of the filter nr 7 (calibration tests) |
| 2018068 | TELESCOPE | Exchange of the green filter (Thorlabs FL532-10 CWL = 532 nm, FWHM = 10 nm) |
| 2018078 | RECEIVER | New trigger level for discriminator from −150 mV to −100 mV |
| 2018149 | RECEIVER | New settings of discriminator for starting photodiode (1.75 V) |
| 2018187 | TELESCOPE | New filters nr 4 and 6 (calibration tests) |
| 2018200 | RECEIVER | Power supply exchange for detector H5023 from HV to ZWN-24. The input voltage set to 2200 V |
| 2019277 | RECEIVER | The change of the “start level” of the discriminator from −180 mV to −500 mV, start pulse is −3 V for 100% of pulse energy |
| Parameter | 1993 | 2019 |
|---|---|---|
| LASER | ||
| Nd:YAGCONTINUUM PY-62 25 mJ 100 ps 10 Hz 0.4 mrad 7% | Nd:YAGEKSPLA PL-2250 50 mJ 60 ps 10 Hz 0.4 mrad 0.5% |
| RECEIVING TELESCOPE | ||
| Cassegrain 65 cm 20 cm 5 arcmin Az-El Step by step 1.8 arcsec LEO, MEO | Cassegrain 65 cm 20 cm 5 arcmin Az-El Step by step 1.8 arcsec LEO, MEO |
| GUIDING TELESCOPE | ||
| Maksutov 20 cm 1 arcdeg visual | Maksutov 20 cm 1 arcdeg CCD camera |
| DETECTOR “START” | Avalanche photodiode | Si photodiode FDS025 |
| PMT RCA-8852 10% 106 700 ps | PMT HAMAMATSU H5023 10% 106 160 ps |
TIME INTERVAL COUNTER
| WUT PS-500-1 100 ps 20 ps | Stanford SR-620 25 ps 4 ps |
| TIME BASE | Cesium Frequency Standard Rhode and Schwarz | Active hydrogen maser CH1-75A |
| COMPUTER | MERA-400 | PC-Pentium |
CALIBRATION
| PLATE External 1295.42 m PRE&POST | PLATE External 241.086 m PRE&POST |
METEO
| 1 mbar 0.5° C 10% | BOSCH 280 0.1 mbar 0.2° C 3% |
| OPERATING STAFF | 2 persons | 1 person |
| Force Models |
|---|
| Earth gravity field: EGM2008 20 × 20 [19] |
| Earth tides: IERS conventions 2003 [20] |
| Earth tide model: EGM96 |
| Ocean tide model: GOT99.2 [21] |
| Third body gravity: moon, sun, and planets: DE403 [22] |
| Solar radiation pressure coefficient: CR = 1.13 |
| Tidal constants k2, k3, and phase k2: 0.3019, 0.093, 0.0 [23] |
| Earth albedo [10] |
| Dynamic polar motion [10] |
| Relativistic corrections [10] |
| Constants |
| Earth gravity parameter (GM): 3,986,004,415 × 1014 m3/s2 |
| Speed of light: 299,792.458 km/s |
| Semi-major axis of the Earth: 6378.13630 km |
| Inverse of the Earth’s flattening: 298.25642 |
| Reference frame |
| Inertial reference frame: J2000.0 Coordinates reference system: true of date at 0.0 h of the first day of the each month Station coordinates and station velocities: SLRF2014 for epoch 2010.0 [24] |
| Precession and nutation: IAU 2000 |
| Polar motion: C04 IERS |
| Tidal uplift: model Love model H2 = 0.6078, L2 = 0.0847 [23] |
| Pole tide [10] |
| Estimated parameters |
| Satellite state vector (6 parameters) |
| Station geocentric coordinates (3 parameters) |
| Acceleration parameters: along track, cross track, and radial at 5-day intervals |
| Measurement model |
| Observations: 120-s normal points from EUROLAS Data Center |
| Laser pulse wavelength: 532 nm for all stations with the exception of 432 nm and 864 nm for stations 7810 (to 2008) and 7405 and 864 nm for station 7827 |
| Centre of mass correction: 25.1 cm Cross-sectional area: 0.2827 m2 Mass of LAGEOS-1: 406.965 kg; mass of LAGEOS-2: 405.380 kg |
| Tropospheric refraction: model Mendes–Pavlis [25,26] |
| Editing criteria |
| All normal points > 5σ per arc Borowiec SLR station coordinates < 50 normal points per station per arc Borowiec SLR station coordinates > 2.5xsigma(3D) of position determination Borowiec SLR station coordinates > 3xRMS for each component north, east, and up |
| Numerical integration |
| Integration: Cowell’s method |
| Orbit integration step size: 120 s |
| Arc length: 1 month |
| Period | 1993–2019 | 1993–1997 | 1998–2002 | 2003–2009 | 2015–2019 |
|---|---|---|---|---|---|
| First data | July 1993 | July 1993 | January 1998 | January 2003 | August 2015 |
| Last data | December 2019 | December 1997 | December 2002 | April 2009 | December 2019 |
| Number of arcs | 168 | 36 | 49 | 45 | 38 |
| Number of NP all stations | 1,758,469 | 295,632 | 491,024 | 573,876 | 397,937 |
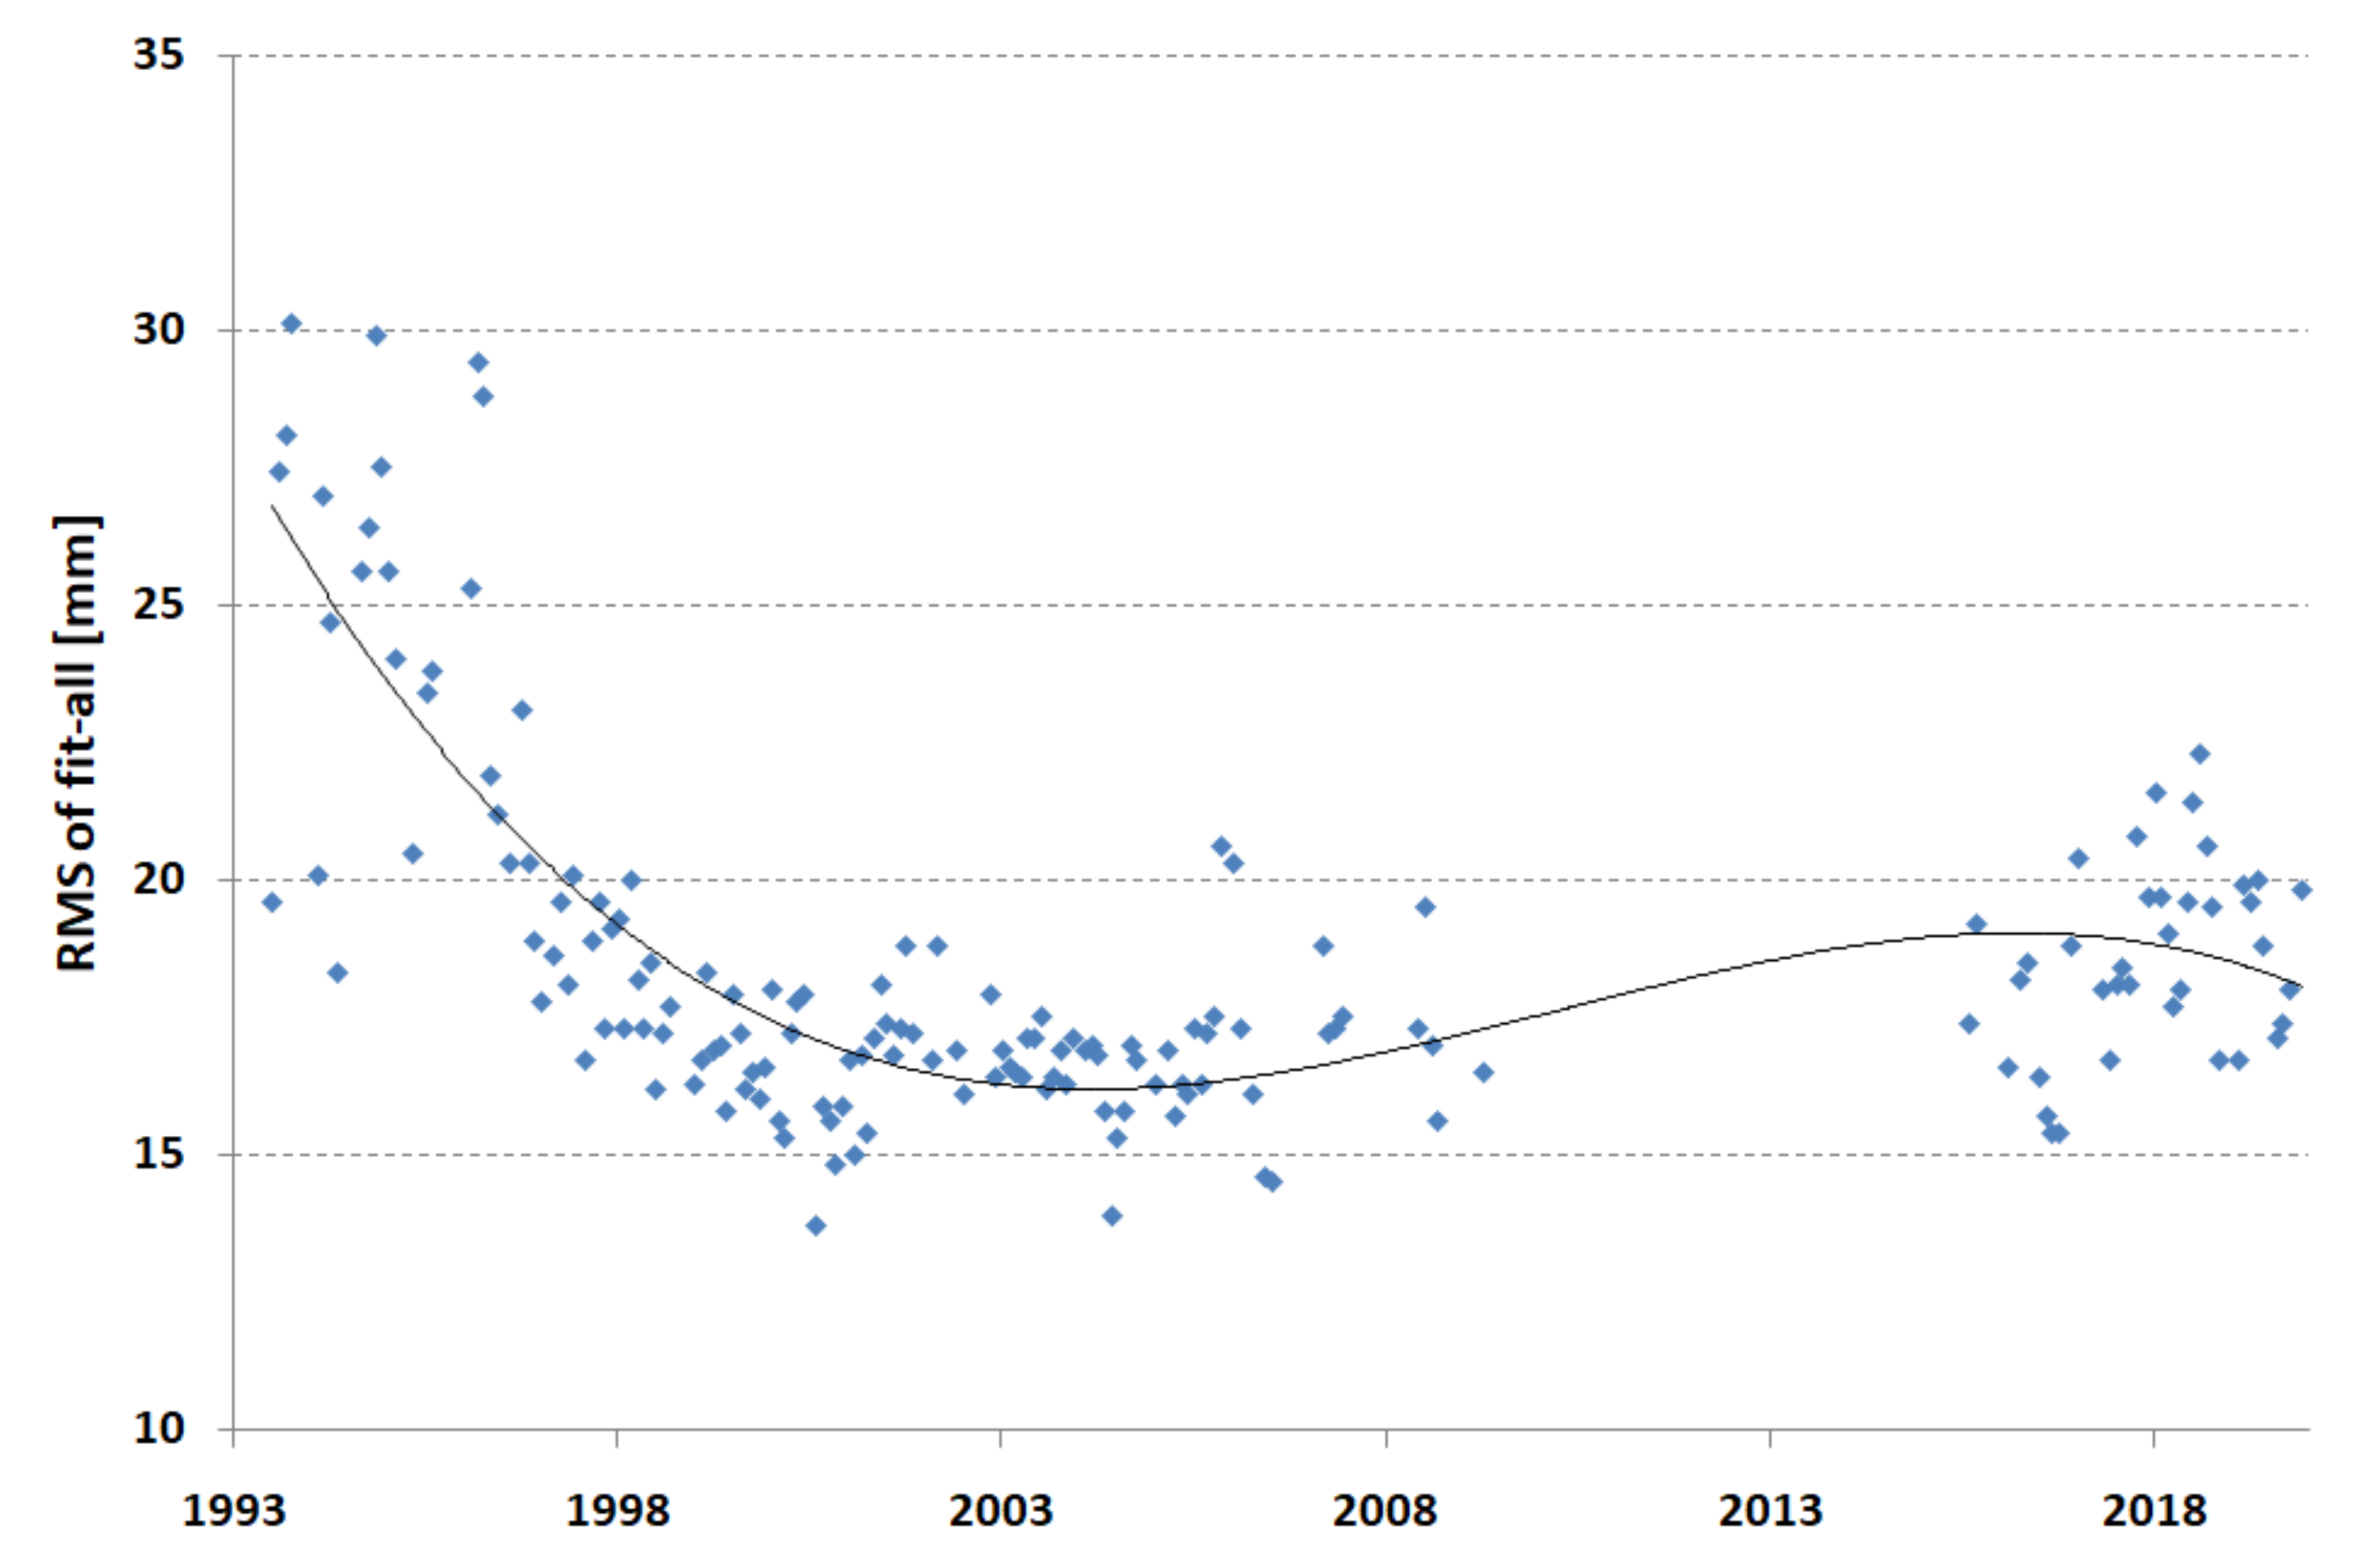
| RMS of fit (mm) all stations | 18.5 | 22.7 | 16.9 | 16.8 | 18.6 |
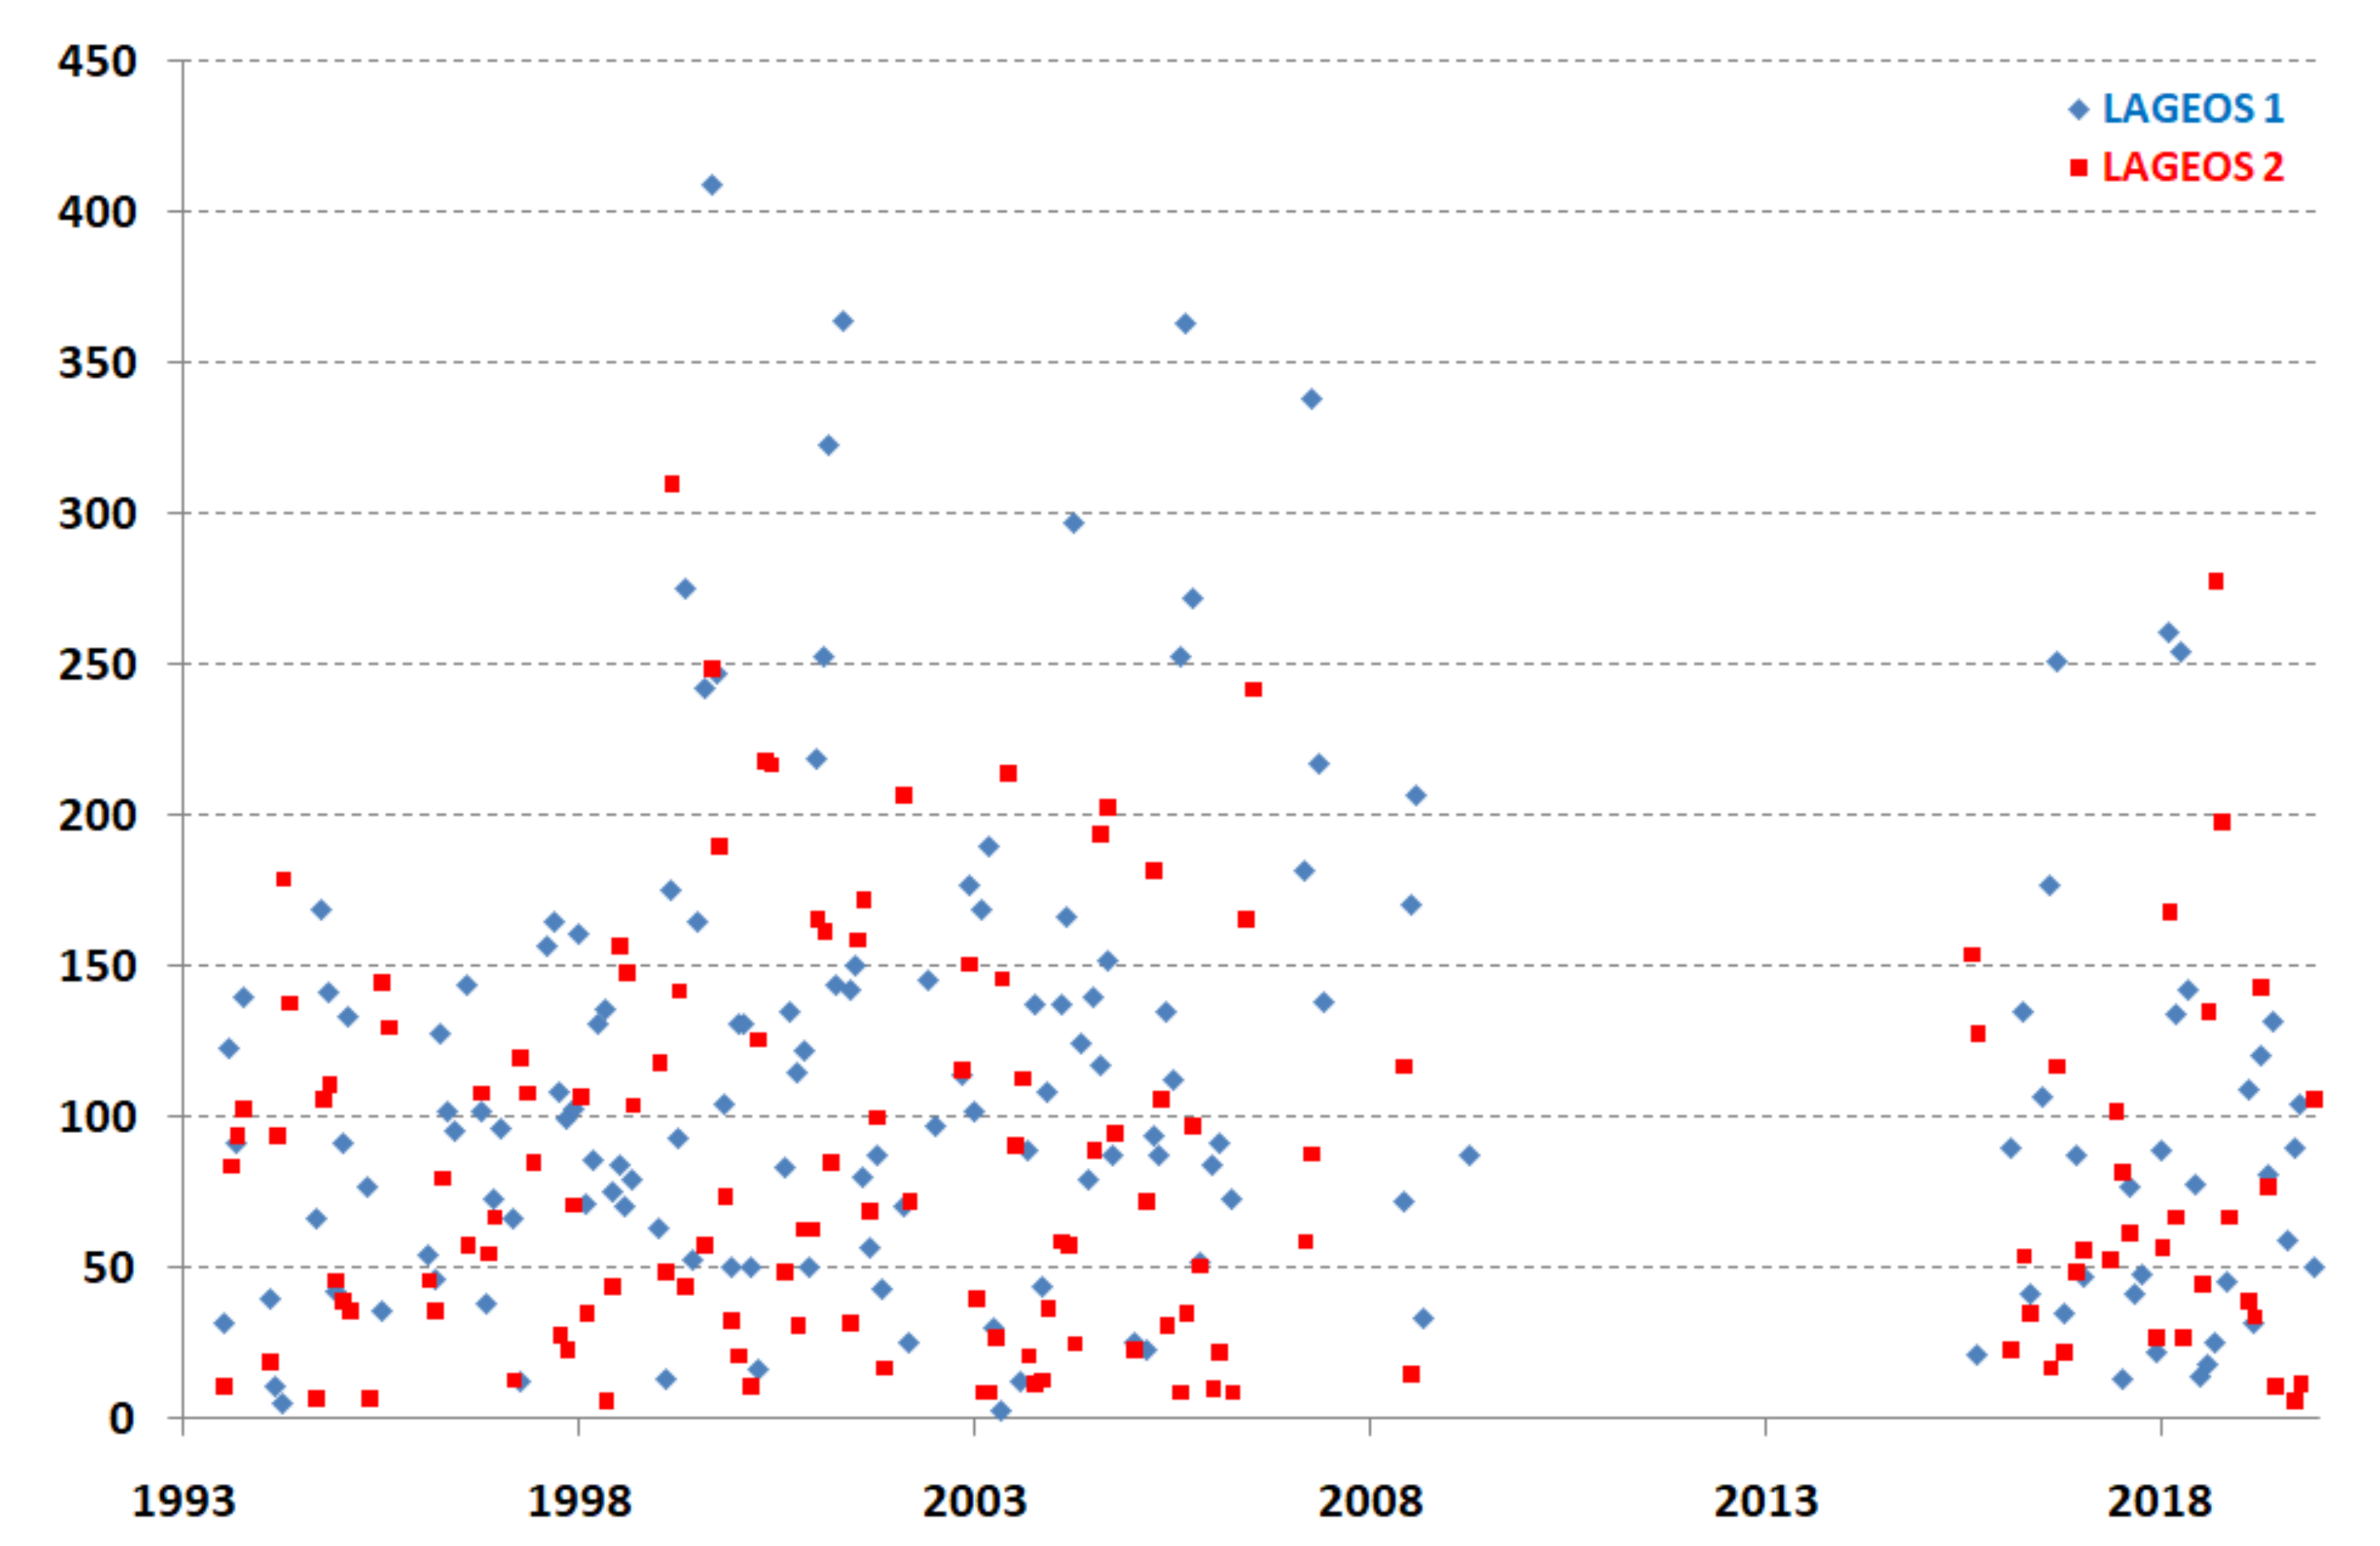
| Number of NP-L1 Borowiec | 17,210 | 2785 | 6105 | 5291 | 3029 |
| Number of NP-L2 Borowiec | 11,662 | 2247 | 4175 | 2789 | 2451 |
| RMS of fit-L1 (mm) Borowiec | 21.3 | 25.6 | 21.9 | 18.3 | 20.3 |
| RMS of fit-L2 (mm) Borowiec | 21.0 | 28.1 | 20.5 | 18.6 | 17.4 |
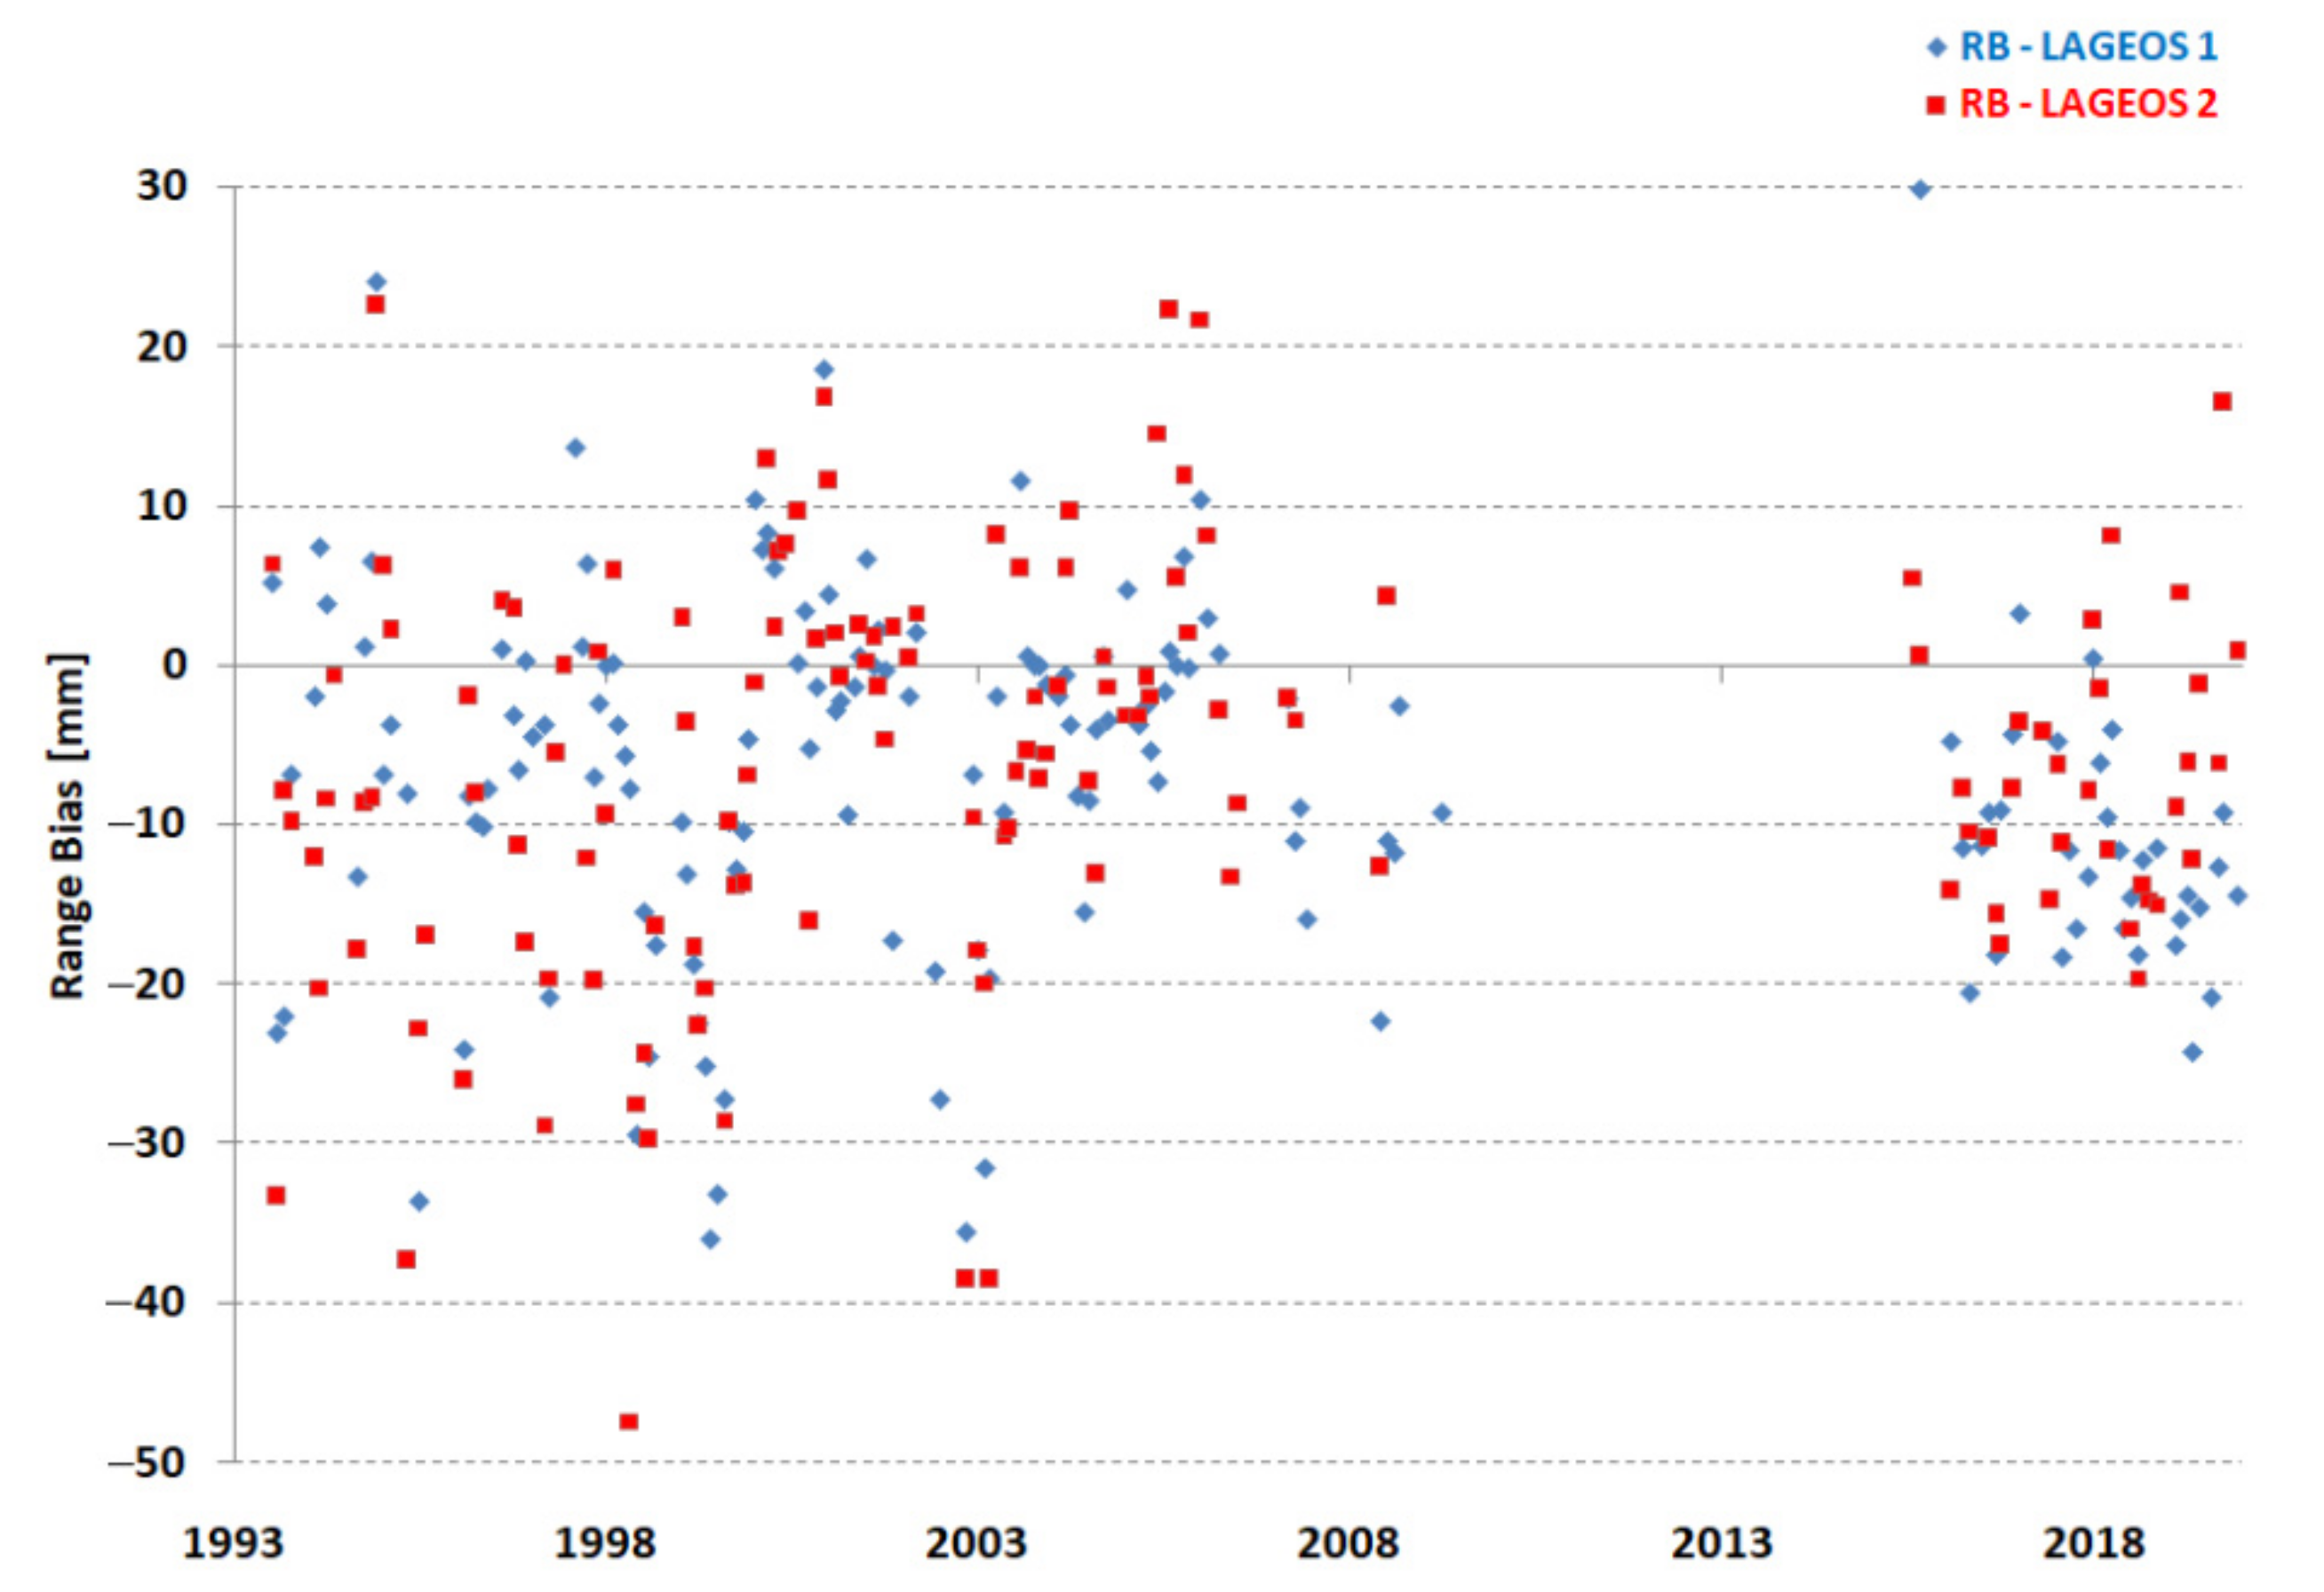
| Range bias-L1 (mm) Borowiec | −7.3 | −4.9 | −8.3 | −5.0 | −10.8 |
| Range bias-L2 (mm) Borowiec | −6.3 | −10.0 | −7.0 | −2.1 | −6.9 |
| Long-term bias stability-L1 (mm) Borowiec | 11.0 | 11.6 | 13.0 | 8.6 | 9.4 |
| Long-term bias stability-L2 (mm) Borowiec | 12.4 | 13.0 | 14.7 | 11.5 | 8.4 |
| Period | X [m] | Y [m] | Z [m] |
|---|---|---|---|
| 1993–1997 | 3,738,332.5925 ± 0.0058 | 1,148,246.6915 ± 0.0058 | 5,021,816.1418 ± 0.0050 |
| 1998–2002 | 3,738,332.5968 ± 0.0035 | 1,148,246.6897 ± 0.0037 | 5,021,816.1432 ± 0.0030 |
| 2003–2009 | 3,738,332.5863 ± 0.0040 | 1,148,246.6877 ± 0.0037 | 5,021,816.1246 ± 0.0032 |
| 2015–2019 | 3,738,332.6011 ± 0.0051 | 1,148,246.6935 ± 0.0048 | 5,021,816.1459 ± 0.0044 |
| 1993–2019 | 3,738,332.5940 ± 0.0045 | 1,148,246.6904 ± 0.0044 | 5,021,816.1385 ± 0.0038 |
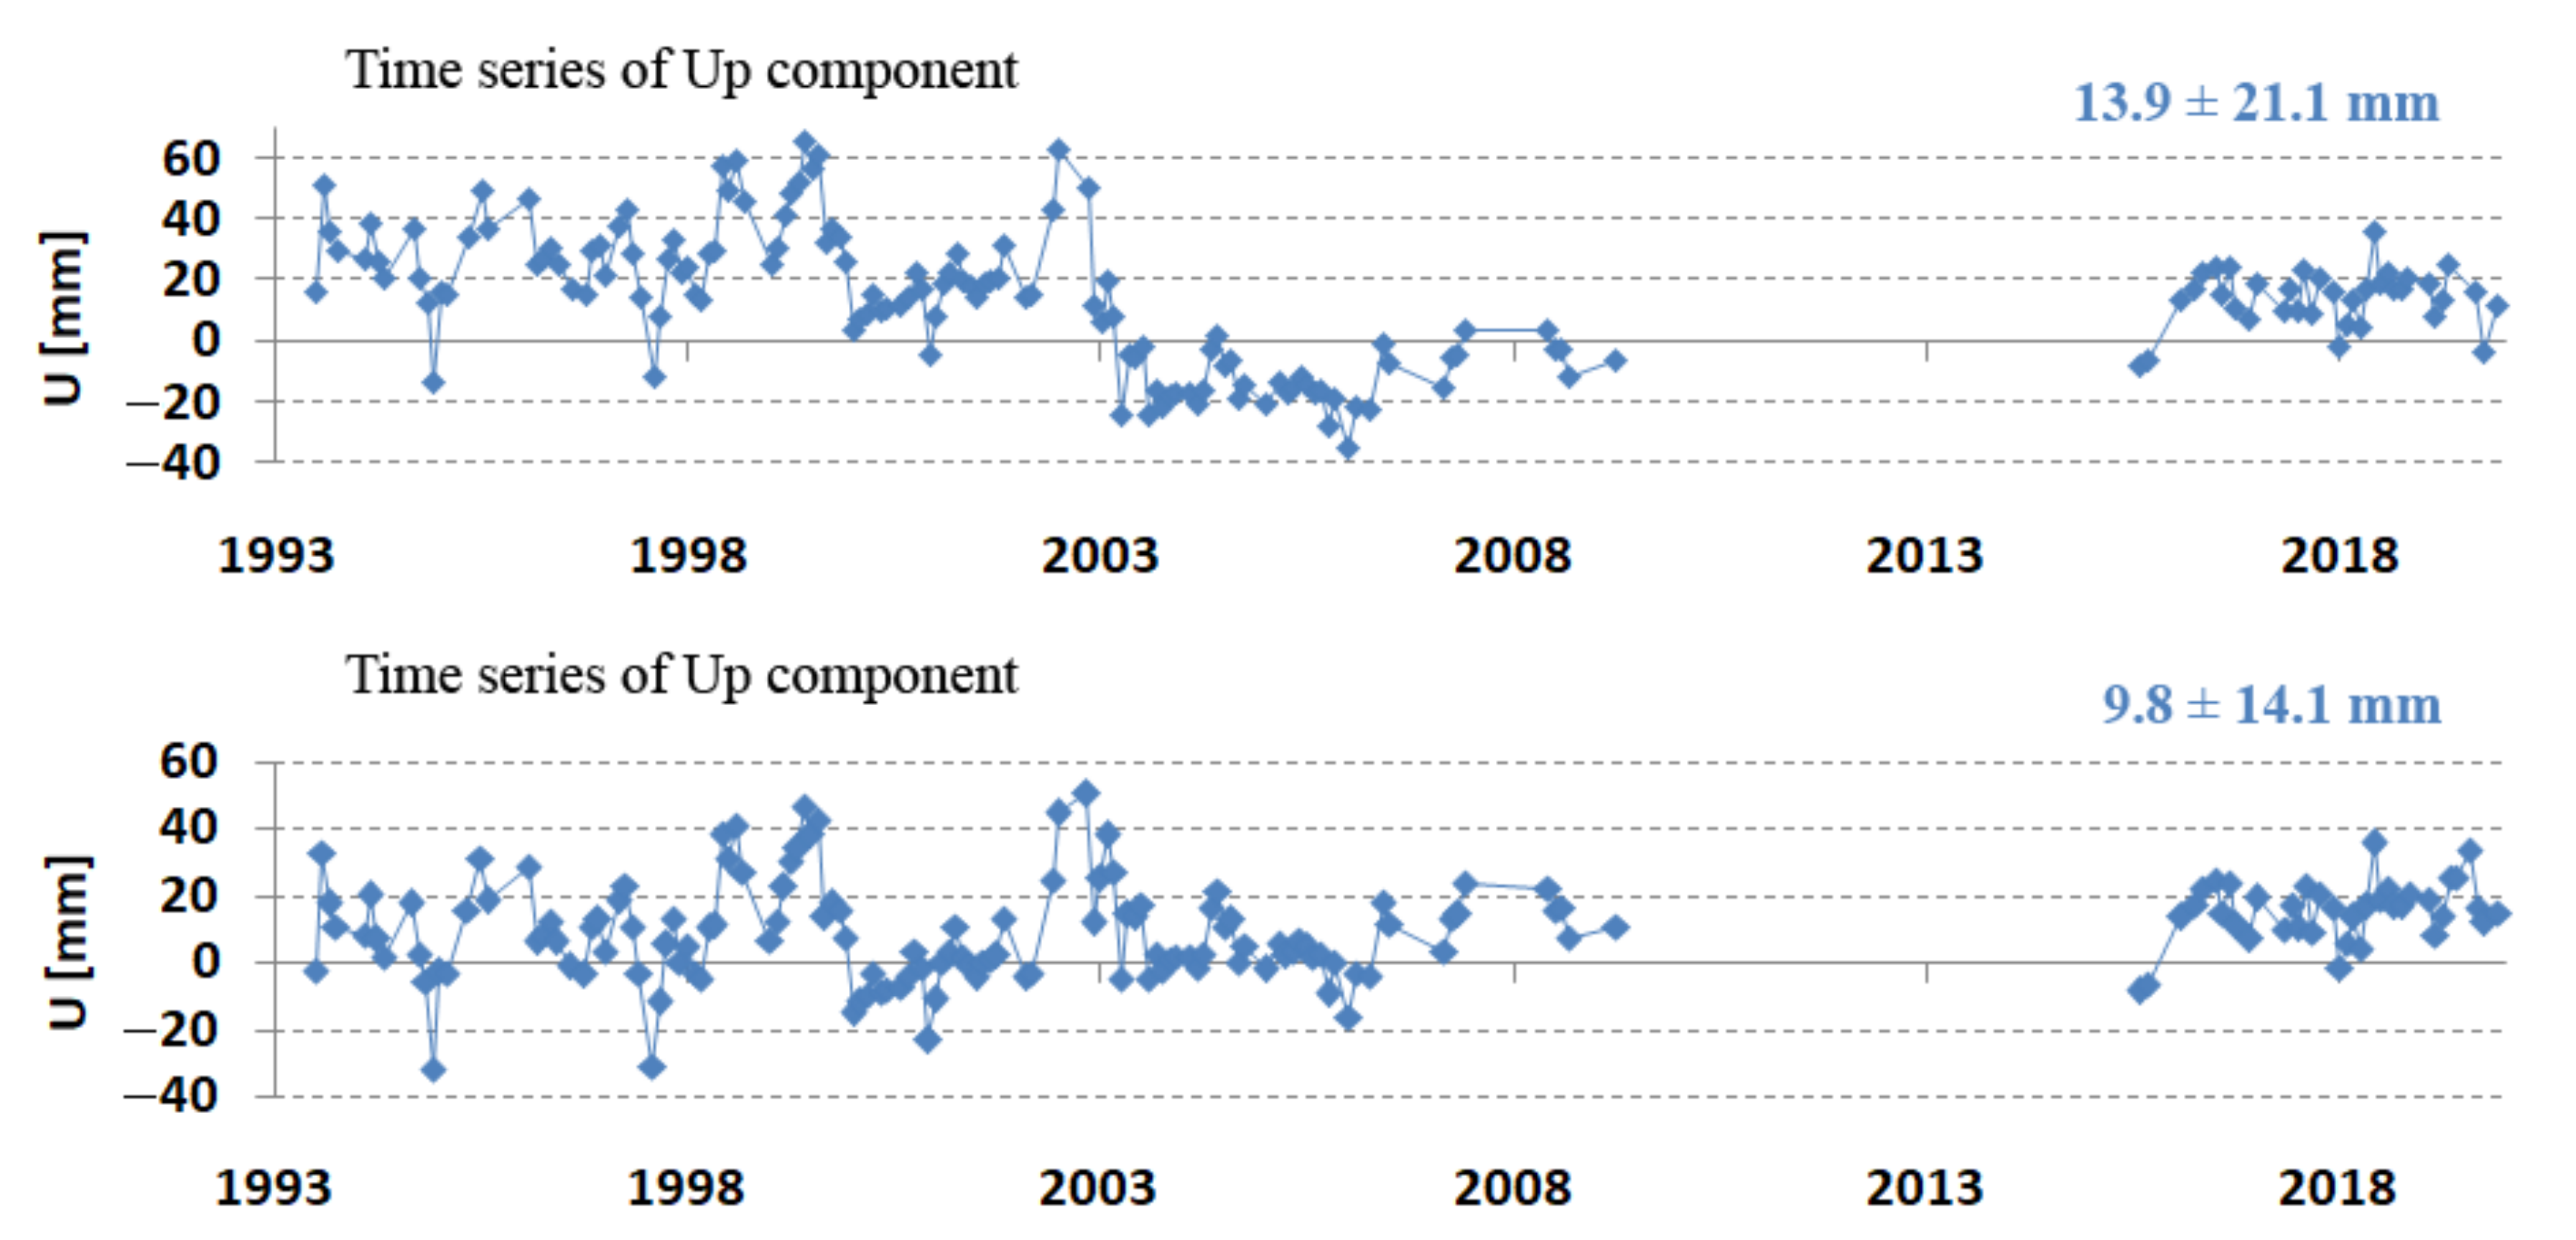
| Period | N [mm] | E [mm] | U [mm] | 3D st.dev. [mm] |
|---|---|---|---|---|
| 1993–1997 | 2.9 | 4.4 | 6.7 | ±5.7 |
| 1998–2002 | 1.0 | 1.5 | 10.0 | ±3.5 |
| 2003–2009 | −2.5 | 3.4 | 7.6 | ±3.7 |
| 2015–2019 | −1.5 | 3.9 | 15.3 | ±4.9 |
| 1993–2019 | −0.1 | 3.2 | 9.8 | ±4.3 |
| 1993–2019 | 1993–1997 | 1998–2002 | 2003–2009 | 2015–2019 | ITRF2014 | |
|---|---|---|---|---|---|---|
| Period (year) | 26.5 | 4.5 | 5.0 | 6.3 | 4.4 | |
| VX component (mm/year) | −18.1 ± 0.3 | −16.9 ± 1.7 | −19.0 ± 1.1 | −16.7 ± 1.3 | −18.4 ± 1.6 | −18.4 |
| VY component (mm/year) | 15.2 ± 0.2 | 13.4 ± 1.5 | 17.4 ± 0.8 | 15.8 ± 1.0 | 14.8 ± 1.4 | 15.1 |
| VZ component (mm/year) | 7.7 ± 0.2 | 4.6 ± 1.5 | 4.6 ± 0.9 | 6.4 ± 1.1 | 11.0 ± 1.4 | 7.6 |
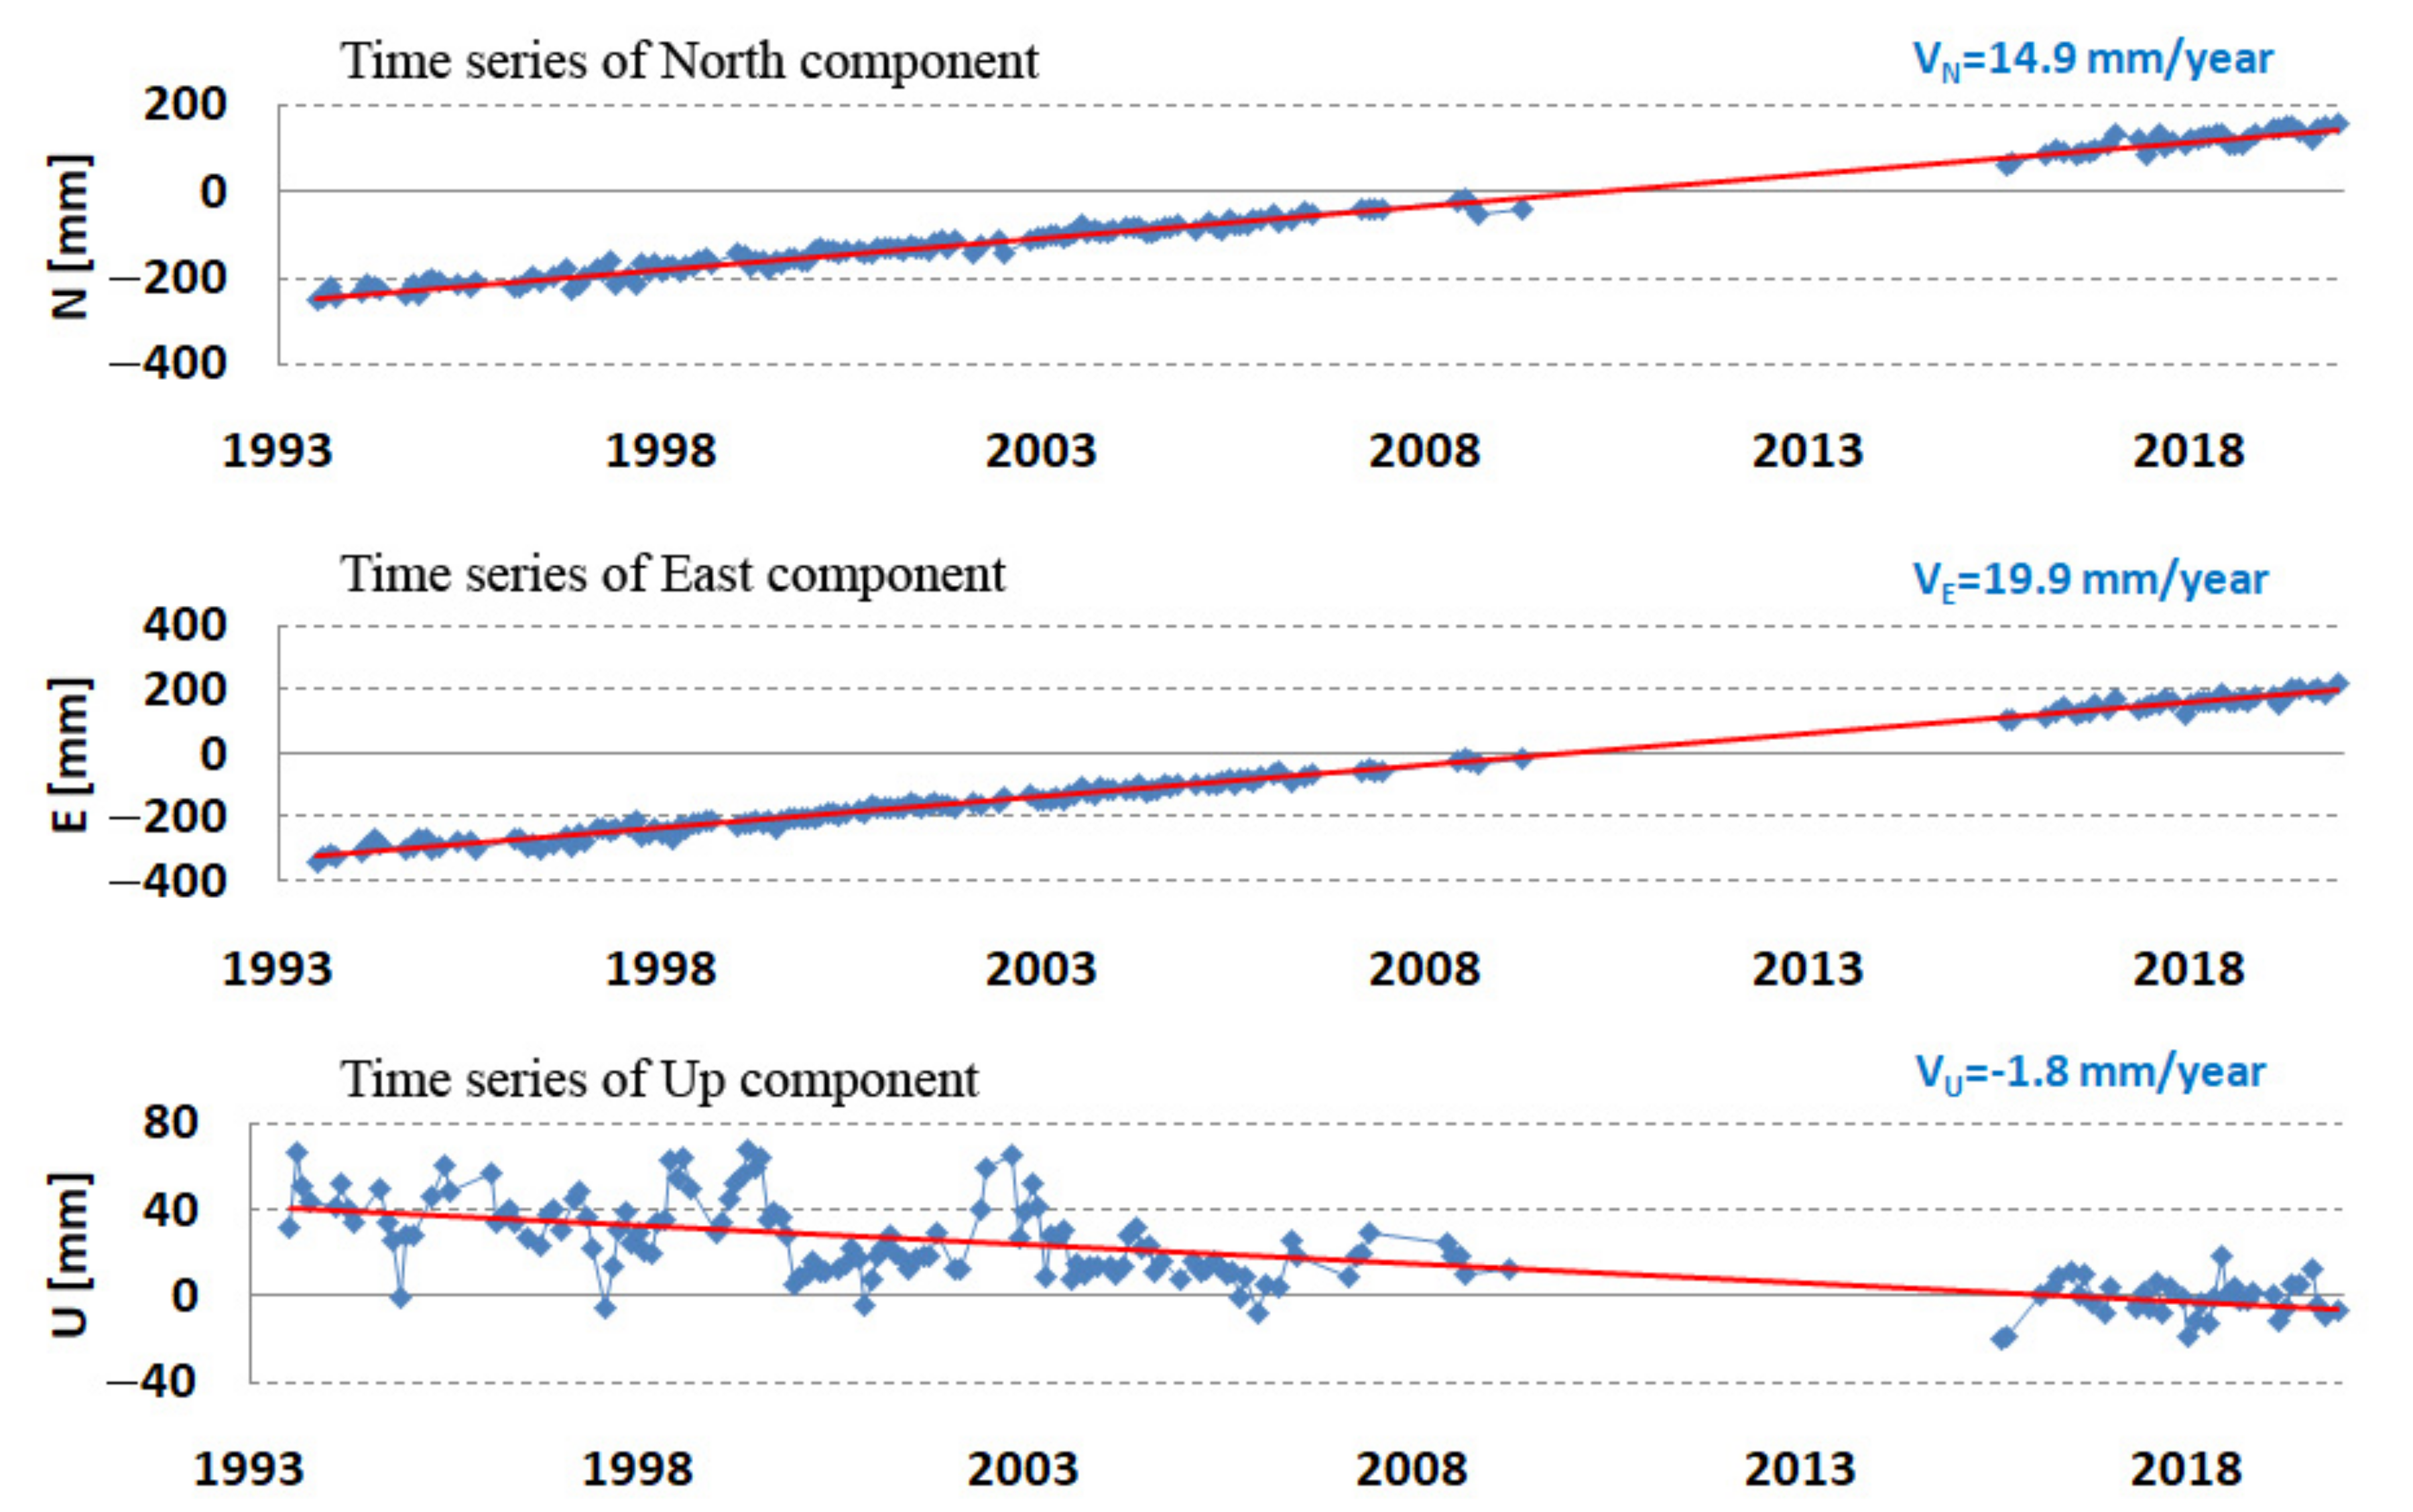
| VN component (mm/year) | 14.9 ± 0.2 | 12.5 ± 1.5 | 13.2 ± 0.9 | 12.9 ± 1.1 | 17.2 ± 1.4 | |
| VE component (mm/year) | 19.9 ± 0.2 | 17.7 ± 1.4 | 22.2 ± 0.8 | 20.0 ± 1.0 | 19.5 ± 1.3 | |
| VU component (mm/year) | −1.8 ± 0.3 | −3.9 ± 1.6 | −4.4 ± 1.0 | −1.8 ± 1.2 | 0.6 ± 1.5 | |
| 3D velocity (mm/year) | 24.9 ± 0.2 | 22.0 ± 2.7 | 26.2 ± 1.6 | 23.9 ± 2.0 | 26.0 ± 2.6 | 25.0 |
| Horizontal velocity (mm/year) | 24.9 ± 0.2 | 21.7 ± 1.9 | 25.8 ± 1.2 | 23.8 ± 1.4 | 26.0 ± 1.8 | |
| Azimuth (°) | 53.2 ± 0.9 | 54.8 ± 1.6 | 59.3 ± 1.0 | 57.2 ± 1.2 | 48.6 ± 1.5 |
Publisher’s Note: MDPI stays neutral with regard to jurisdictional claims in published maps and institutional affiliations. |
© 2022 by the authors. Licensee MDPI, Basel, Switzerland. This article is an open access article distributed under the terms and conditions of the Creative Commons Attribution (CC BY) license (https://creativecommons.org/licenses/by/4.0/).
Share and Cite
Schillak, S.; Lejba, P.; Michałek, P.; Suchodolski, T.; Smagło, A.; Zapaśnik, S. Analysis of the Results of the Borowiec SLR Station (7811) for the Period 1993–2019 as an Example of the Quality Assessment of Satellite Laser Ranging Stations. Sensors 2022, 22, 616. https://0-doi-org.brum.beds.ac.uk/10.3390/s22020616
Schillak S, Lejba P, Michałek P, Suchodolski T, Smagło A, Zapaśnik S. Analysis of the Results of the Borowiec SLR Station (7811) for the Period 1993–2019 as an Example of the Quality Assessment of Satellite Laser Ranging Stations. Sensors. 2022; 22(2):616. https://0-doi-org.brum.beds.ac.uk/10.3390/s22020616
Chicago/Turabian StyleSchillak, Stanisław, Paweł Lejba, Piotr Michałek, Tomasz Suchodolski, Adrian Smagło, and Stanisław Zapaśnik. 2022. "Analysis of the Results of the Borowiec SLR Station (7811) for the Period 1993–2019 as an Example of the Quality Assessment of Satellite Laser Ranging Stations" Sensors 22, no. 2: 616. https://0-doi-org.brum.beds.ac.uk/10.3390/s22020616