
Comprehensive Testing of Sulfate Erosion Damage of Concrete Structures and Analysis of Silane Coating Protection Effect

Abstract
:1. Introduction
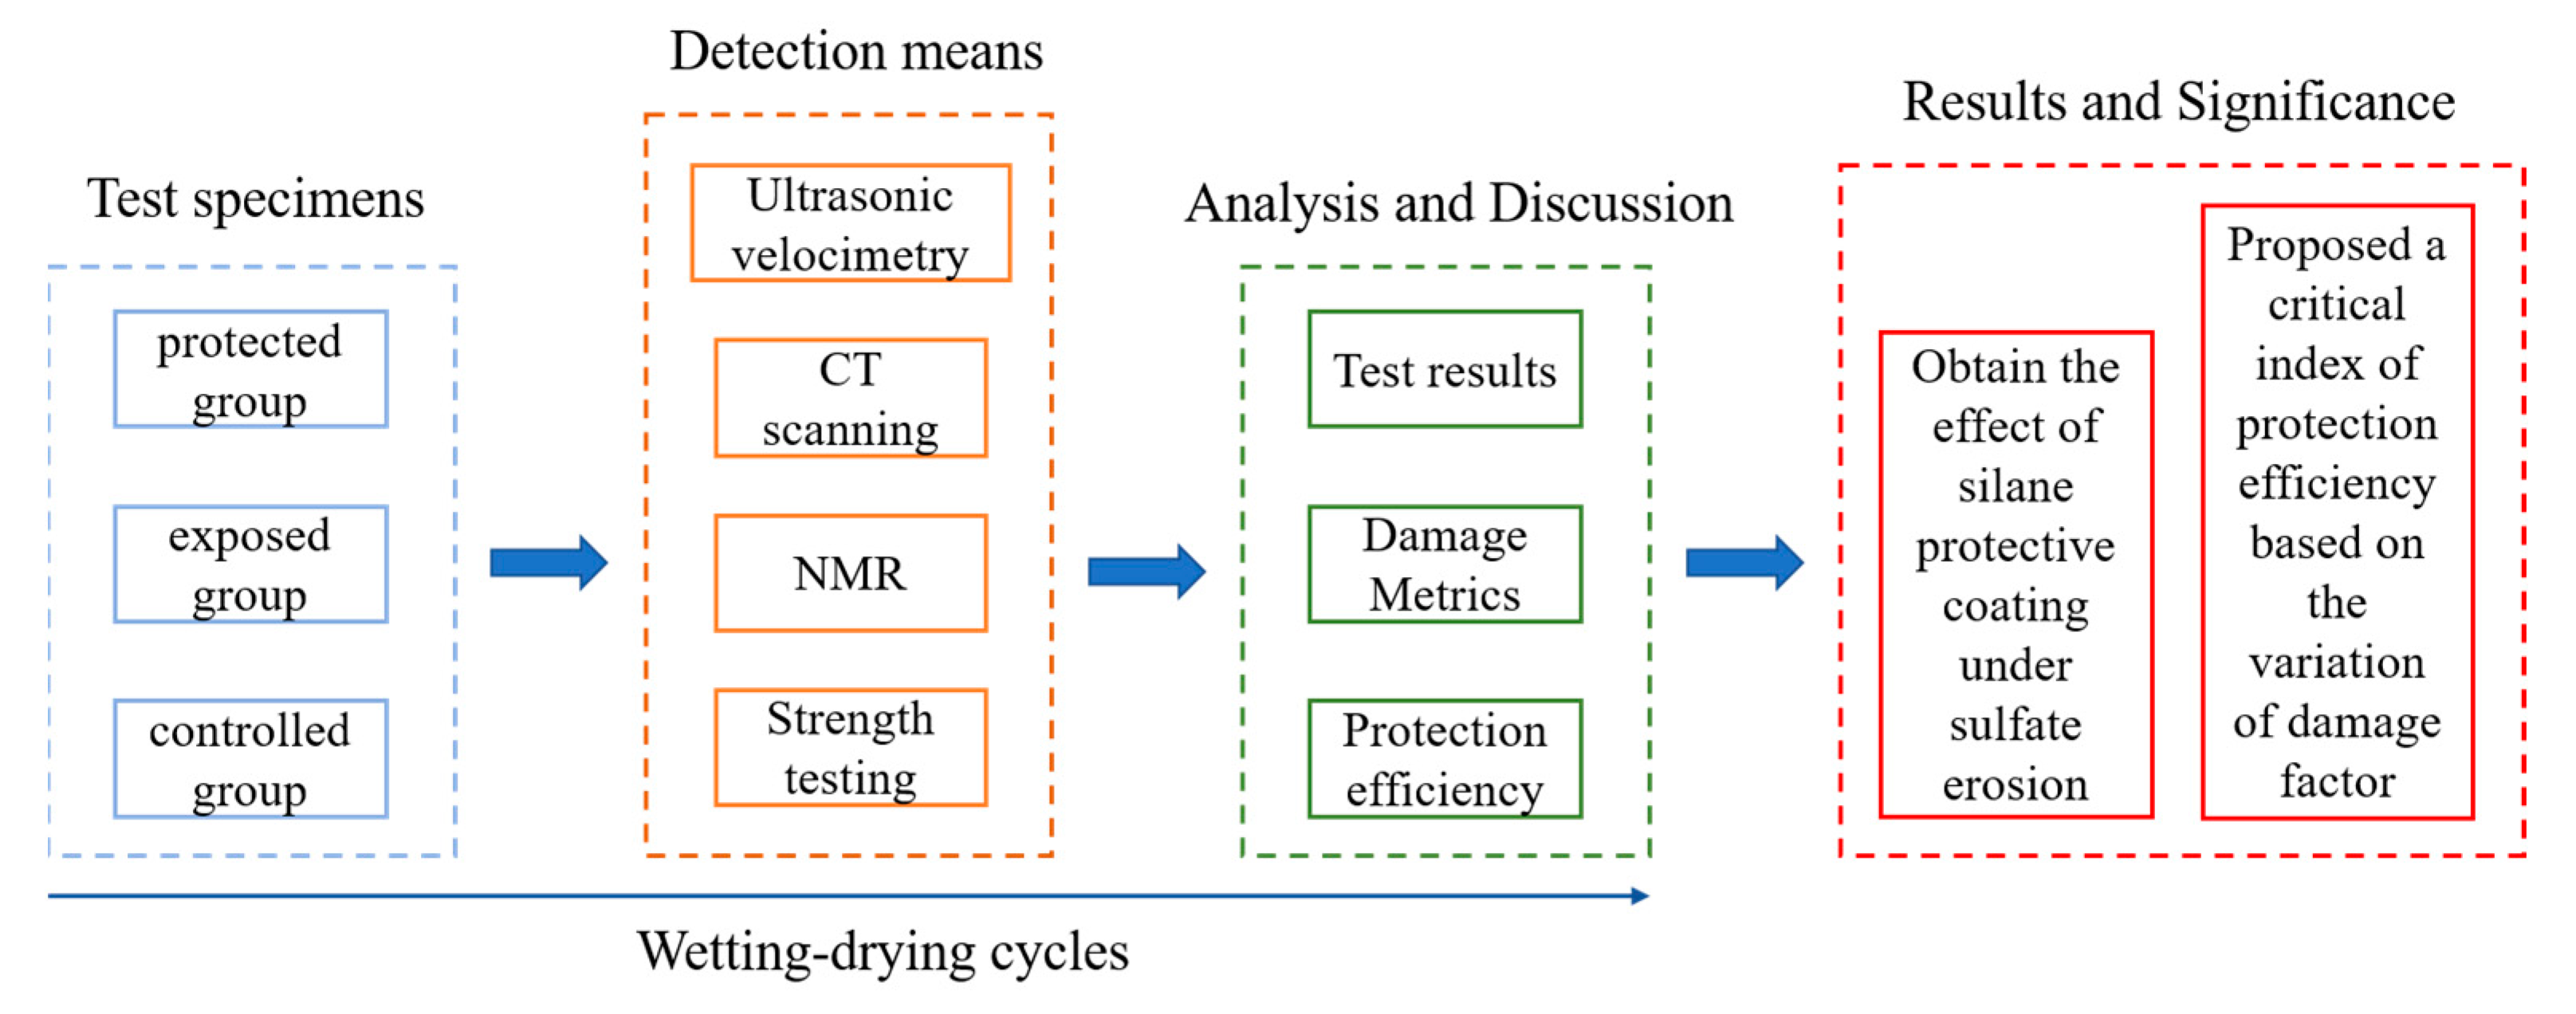
2. Materials and Methods
2.1. Specimen Preparation and Experimental Design
2.1.1. Specimen Preparation
2.1.2. Experimental Cycle Design
2.2. Specimen Testing
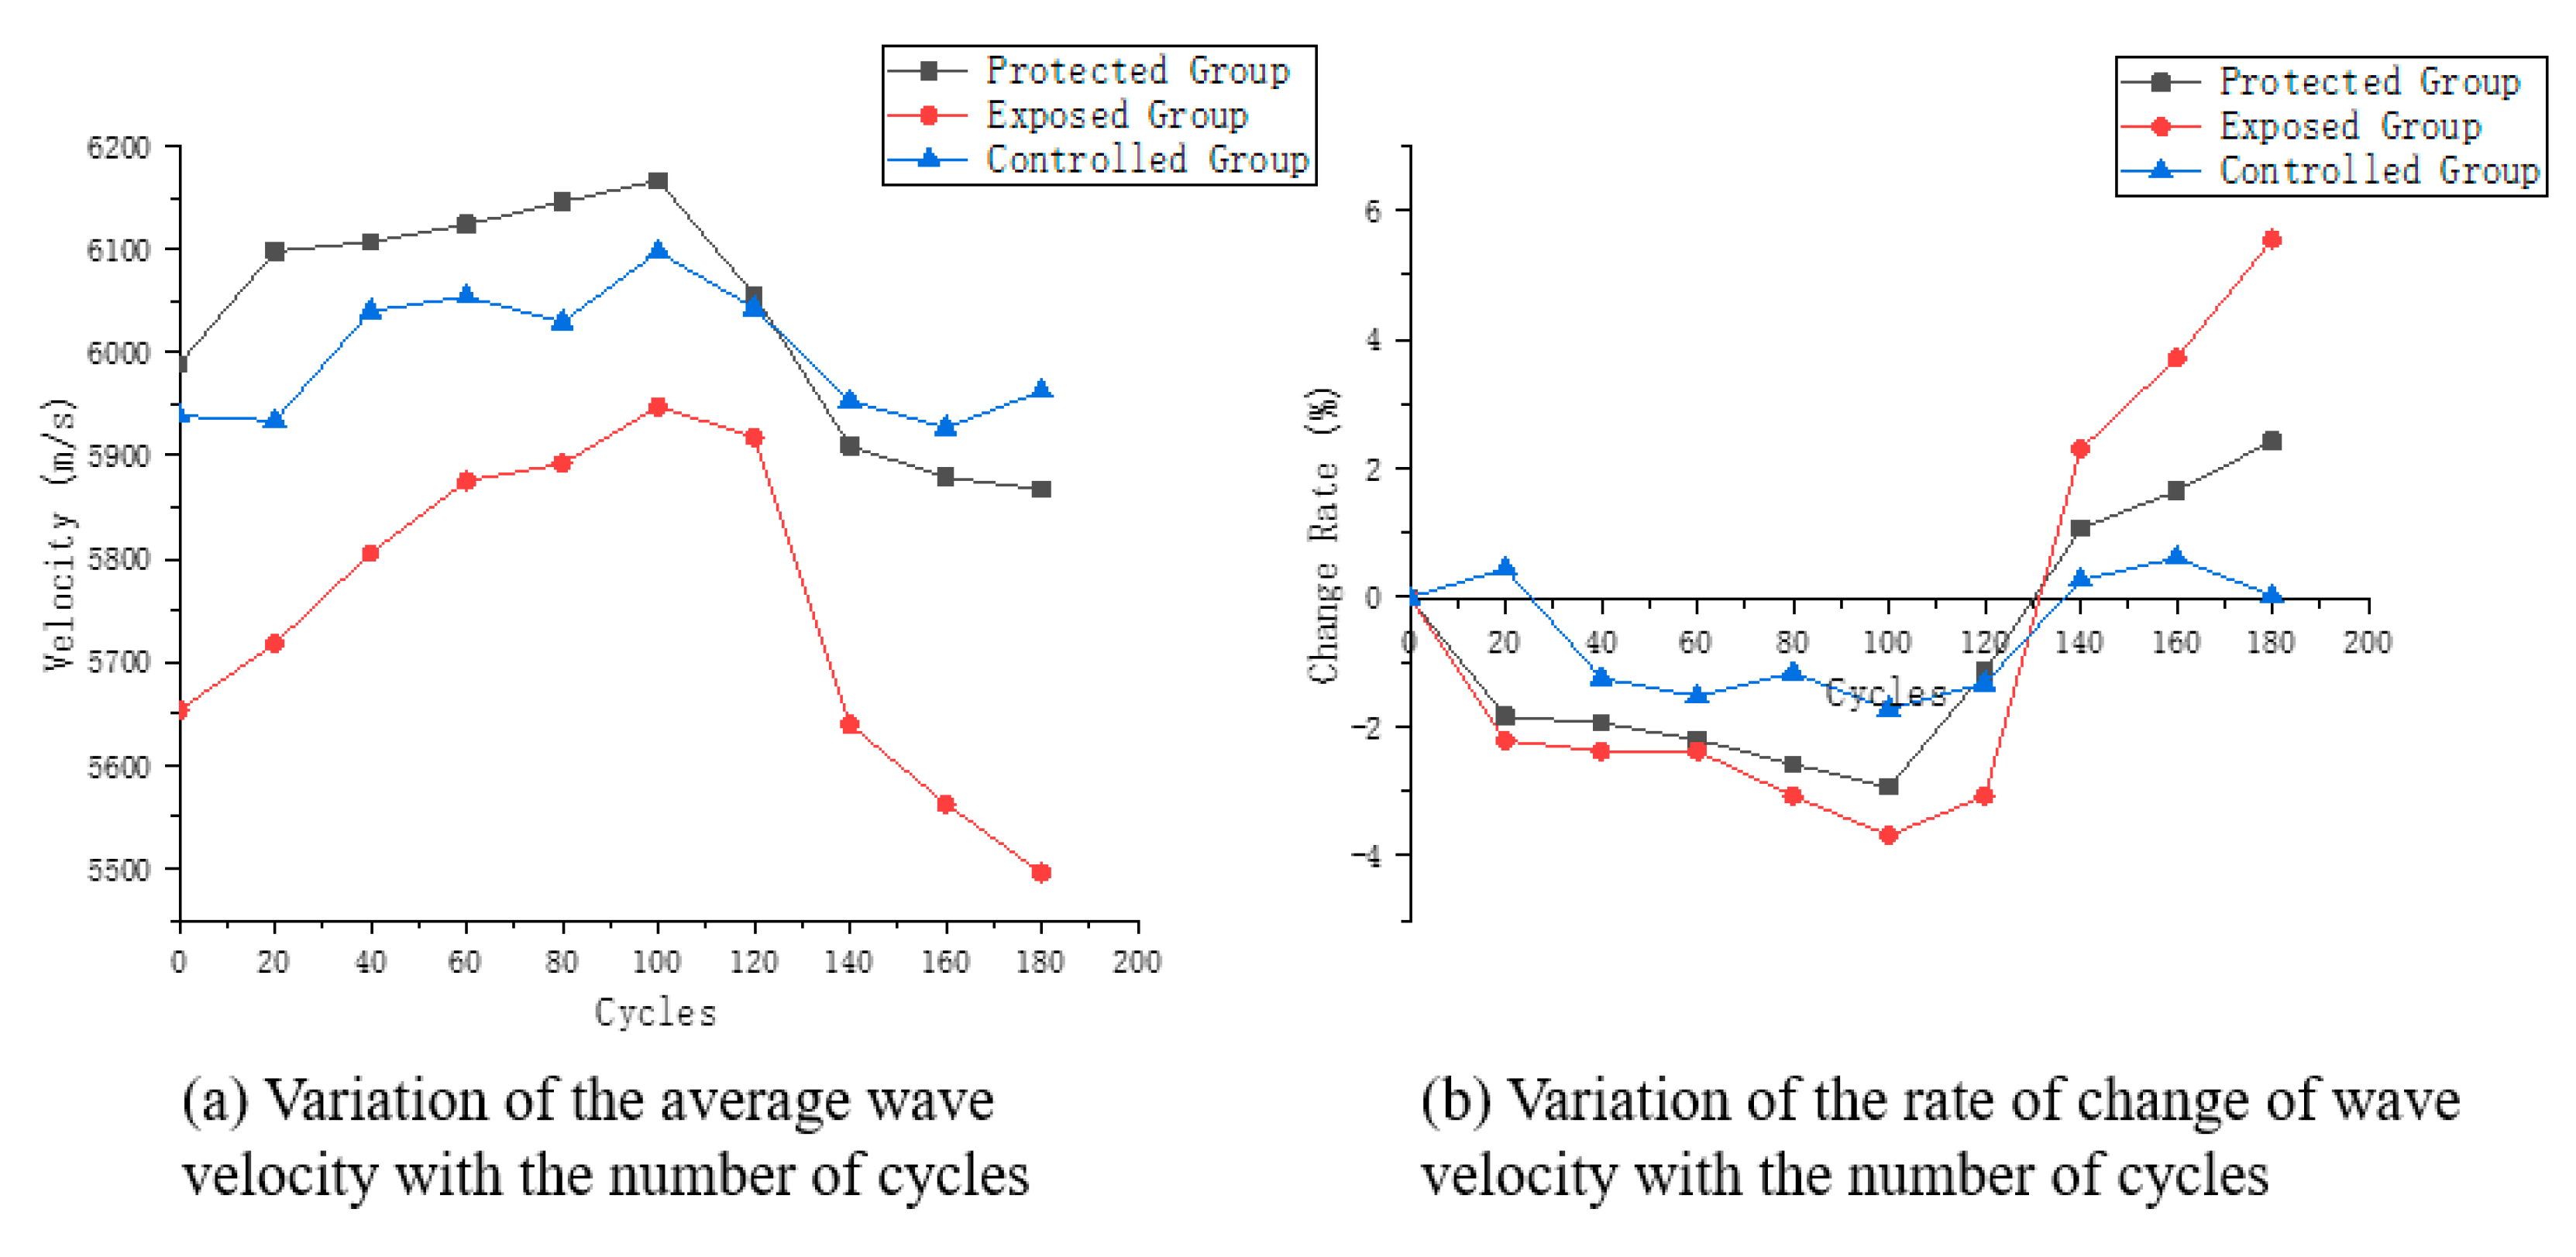
2.2.1. Ultrasonic Testing
2.2.2. CT Test
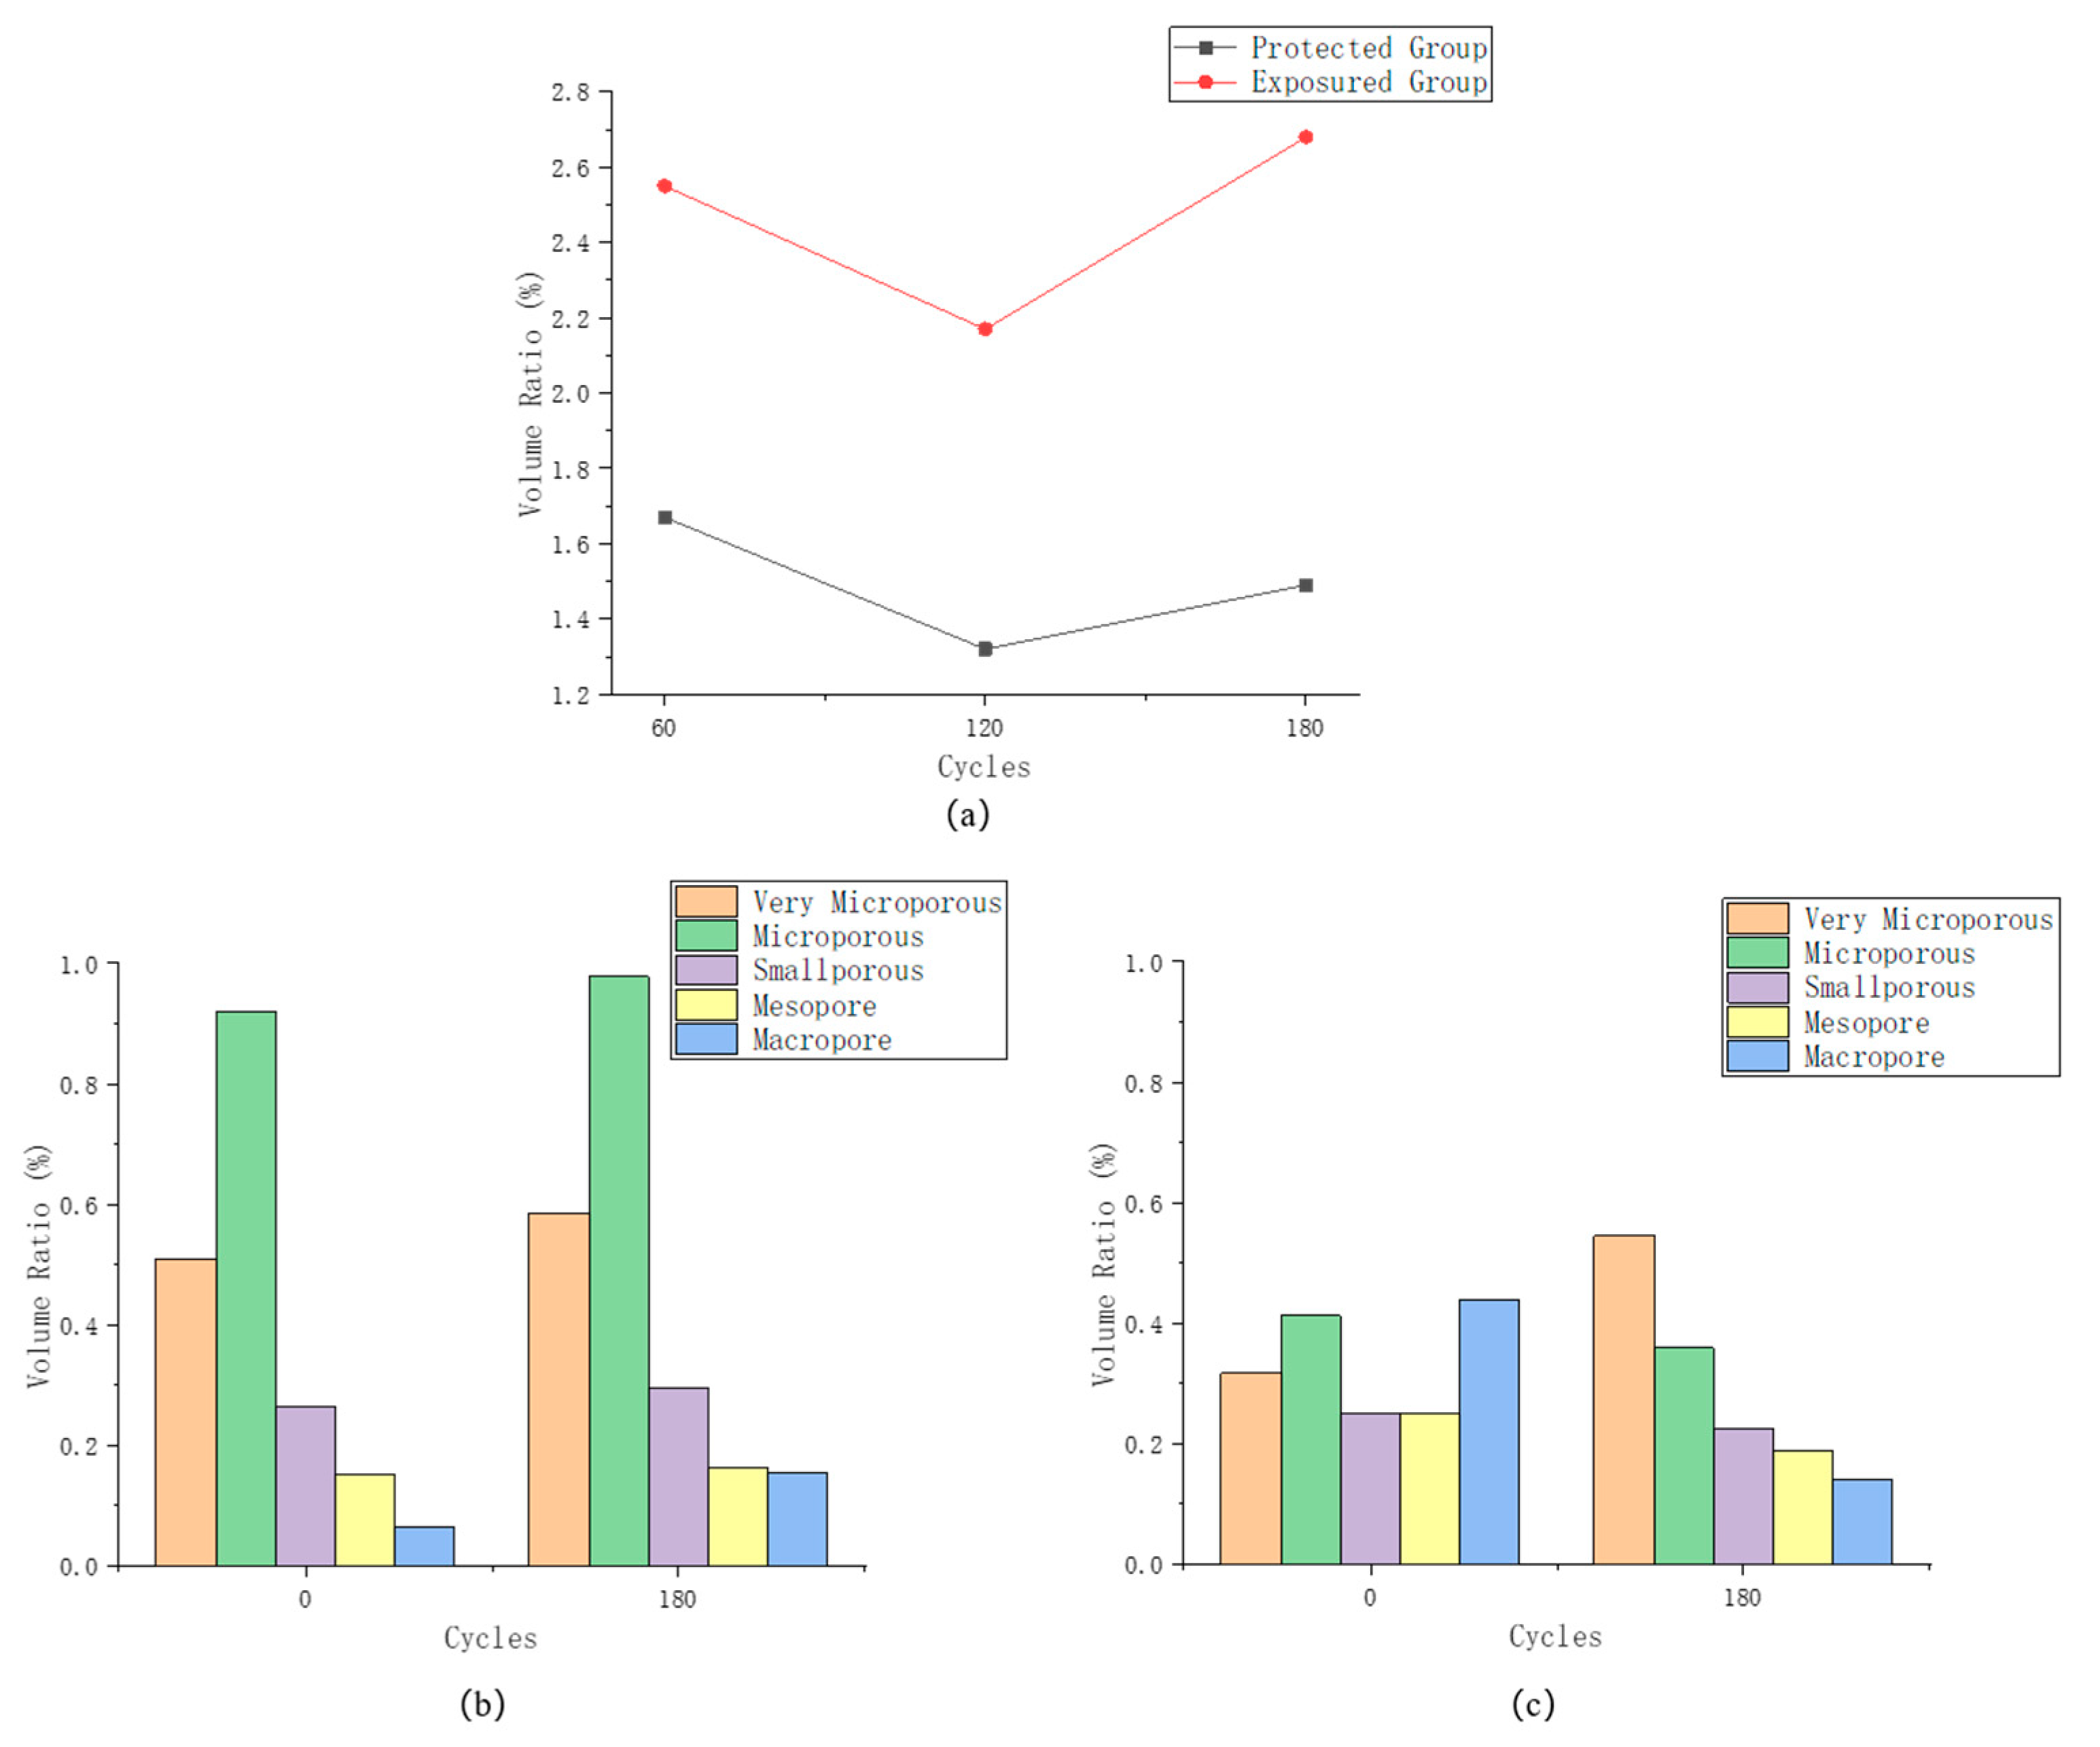
2.2.3. NMR Test
2.2.4. Strength Test
3. Results
3.1. Experimental Results
3.2. Damage Metric
3.2.1. Structural Damage Analysis
3.2.2. Strength Damage Analysis
3.2.3. Ultrasonic Wave Speed Damage Metric
3.3. Protection Efficiency Analysis
4. Discussion
5. Conclusions
Author Contributions
Funding
Institutional Review Board Statement
Informed Consent Statement
Data Availability Statement
Conflicts of Interest
References
- Zhao, G.W.; Li, J.P.; Shi, M.; Fan, H.H.; Cui, J.F.; Xie, F. Degradation mechanisms of cast-in-situ concrete subjected to internal-external combined sulfate erosion. Constr. Build. Mater. 2020, 248, 118683. [Google Scholar] [CrossRef]
- Liu, H.Z.; Zhang, Q.; Li, V.; Su, H.Z.; Gu, C.S. Durability study on engineered cementitious composites (ECC) under sulfate and chloride environment. Constr. Build. Mater. 2017, 133, 171–181. [Google Scholar] [CrossRef]
- Wang, C.; Li, Y.; Jing, H.B. Experimental study on the durability of the panel concrete. In Proceedings of the 2016 5th International Conference on Civil, Architectural and Hydraulic Engineering (ICCAHE 2016), Zhuhai, China, 30–31 July 2016; Volume 95, pp. 906–912. [Google Scholar]
- Cheng, H.; Liu, T.; Zou, D.; Zhou, A. Compressive strength assessment of sulfate-attacked concrete by using sulfate ions distributions. Constr. Build. Mater. 2021, 293, 123550. [Google Scholar] [CrossRef]
- Liu, D.; Gong, C.; Tang, Y.; Jian, Y.; Cao, K.; Chen, H. Evaluation of Corrosion Damage in Sulfate-Erosioned Concrete by CT, Ultrasonic Pulse Velocity Testing and AHP Methods. Sensors 2022, 22, 3037. [Google Scholar] [CrossRef]
- Ma, K.L.; Long, G.C.; Xie, Y.J. Railway tunnel concrete lining damaged by formation of gypsum, thaumasite and sulfate crystallization products in southwest of China. J. Cent. South Univ. 2012, 19, 2340–2347. [Google Scholar] [CrossRef]
- Lei, M.F.; Peng, L.M.; Shi, C.H.; Wang, S.Y. Experimental study on the damage mechanism of tunnel structure suffering from sulfate erosion. Tunn. Undergr. Space Technol. 2013, 36, 5–13. [Google Scholar] [CrossRef]
- Ma, B.G.; Gao, X.J.; Byars, E.A.; Zhou, Q.Z. Thaumasite formation in a tunnel of bapanxia dam in Western China. Cem. Concr. Res. 2006, 36, 716–722. [Google Scholar] [CrossRef]
- Zhu, X.F.; Li, J.; Zhang, Y.; Song, H.Z.; Zheng, H. The Sulphate Effect on Lijiaxia Concrete Dam (China) Gallery. J. Chem. 2017, 2017, 8698759. [Google Scholar] [CrossRef] [Green Version]
- Qian, Z.W.; Yang, W.H. Corrosion Mechanism of the Main Shaft Wall in the Liuyuanzi Coal Mine and Appropriate Countermeasures. Mine Water Environ. 2018, 37, 696–702. [Google Scholar] [CrossRef]
- Xu, G.G.; Gu, S.C.; Wang, X.D.; Wang, H.; Zhu, S.B. Grouting to Prevent Sulfate Corrosion on Coal Mine Shaft. KSCE J. Civ. Eng. 2021, 25, 4133–4143. [Google Scholar] [CrossRef]
- Liu, D.W.; Chen, H.F.; Tang, Y.; Gong, C.; Jian, Y.H.; Cao, K.P. Analysis and Prediction of Sulfate Erosion Damage of Concrete in Service Tunnel Based on ARIMA Model. Materials 2021, 14, 5904. [Google Scholar] [CrossRef] [PubMed]
- Xu, C.B.; Gao, X.J.; Li, X.F.; Zhang, K.S. Estimation of the Occurrence Time of Thaumasite Sulfate Erosion on Tunnel Lining Concrete. Adv. Civ. Eng. 2020, 2020, 6656304. [Google Scholar]
- Yu, C.; Sun, W.; Scrivener, K. Mechanism of expansion of mortars immersed in sodium sulfate solutions. Cem. Concr. Res. 2013, 43, 105–111. [Google Scholar] [CrossRef]
- Santhanam, M.; Cohen, M.D.; Olek, J. Sulfate erosion research—Whither now? Cem. Concr. Res. 2001, 31, 845–851. [Google Scholar] [CrossRef]
- Neville, A. The confused world of sulfate erosion on concrete. Cem. Concr. Res. 2004, 34, 1275–1296. [Google Scholar] [CrossRef]
- Kunther, W.; Lothenbach, B.; Scrivener, K.L. On the relevance of volume increase for the length changes of mortar bars in sulfate solutions. Cem. Concr. Res. 2013, 46, 23–29. [Google Scholar] [CrossRef]
- Nie, Q.; Zhou, C.; Shu, X.; He, Q.; Huang, B. Chemical, Mechanical, and Durability Properties of Concrete with Local Mineral Admixtures under Sulfate Environment in Northwest China. Materials 2014, 7, 3772–3785. [Google Scholar] [CrossRef]
- Elahi, M.M.A.; Shearer, C.R.; Naser Rashid Reza, A.; Saha, A.K.; Khan, M.N.N.; Hossain, M.M.; Sarker, P.K. Improving the sulfate erosion resistance of concrete by using supplementary cementitious materials (SCMs): A review. Constr. Build. Mater. 2021, 281, 122628. [Google Scholar] [CrossRef]
- Berke, N.S.; Bucher, B.E.; Ade, K.M.; DeNicola, P.K. Organofunctional Silane Inhibitor Surface Treatment of Concrete for Corrosion. Transp. Res. Rec. 2016, 2550, 115–122. [Google Scholar] [CrossRef]
- Gao, J.; Geng, Y.; Li, S.; Chen, X.; Shi, D.; Zhou, P.; Zhou, Z.; Wu, Z. Effect of silane emulsion on waterproofing and Anti-icing performance of foamed concrete. Constr. Build. Mater. 2021, 301, 124082. [Google Scholar] [CrossRef]
- Shi, D.; Geng, Y.; Li, S.; Gao, J.; Hou, D.; Jin, Z.; Liu, A. Efficacy and mechanism of graphene oxide modified silane emulsions on waterproof performance of foamed concrete. Case Stud. Constr. Mater. 2022, 16, 908. [Google Scholar] [CrossRef]
- Klovas, A.; Dauksys, M.; Ciuprovaite, G. Frost resistance of concrete surfaces coated with waterproofing materials. In AIP Conference Proceedings; American Institute of Physics: Melville, Australia, 2015. [Google Scholar]
- Li, S.; Zhang, W.; Liu, J.; Hou, D.; Geng, Y.; Chen, X.; Gao, Y.; Jin, Z.; Yin, B. Protective Mechanism of Silane on Concrete upon Marine Exposure. Coatings 2019, 9, 558. [Google Scholar] [CrossRef] [Green Version]
- Zeng, Y.; Zhang, D.; Dai, J.; Fang, M.; Jin, W. Determining the service life extension of silane treated concrete structures: A probabilistic approach. Constr. Build. Mater. 2020, 249, 118802. [Google Scholar] [CrossRef]
- Gao, X.J.; Deng, H.W.; Yang, Y.Z. Application of silane to improve durability of concretes with different age and moisture content. Optoelectron. Adv. Mat. 2012, 6, 750–754. [Google Scholar]
- Gao, X.J.; Deng, H.W.; Yang, Y.Z. Influence of Silane Treatment on the Freeze-thaw Resistance of Concrete. Adv. Mater. Res. 2011, 250–253, 565–568. [Google Scholar] [CrossRef]
- Ryan, P.C.; O’Connor, A.J. Probabilistic Modeling of Reinforced Concrete Bridge Repair Deterioration in Marine Environments. In Proceedings of the 6th International Conference on Bridge Maintenance, Safety and Management (IABMAS), Stresa, Italy, 12 July 2012; pp. 3776–3783. [Google Scholar]
- Kim, B.; Kim, J. Characterization of ultrasonic properties of concrete. Mech. Res. Commun. 2009, 36, 207–214. [Google Scholar] [CrossRef]
- Saint-Pierre, F.; Philibert, A.; Giroux, B.; Rivard, P. Concrete Quality Designation based on Ultrasonic Pulse Velocity. Constr. Build. Mater. 2016, 125, 1022–1027. [Google Scholar] [CrossRef]
- Benaicha, M.; Jalbaud, O.; Roguiez, X.; Hafidi Alaoui, A.; Burtschell, Y. Prediction of Self-Compacting Concrete homogeneity by ultrasonic velocity. Alex. Eng. J. 2015, 54, 1181–1191. [Google Scholar] [CrossRef]
- Haach, V.G.; Juliani, L.M.; Roz, M.R.D. Ultrasonic evaluation of mechanical properties of concretes produced with high early strength cement. Constr. Build. Mater. 2015, 96, 1–10. [Google Scholar] [CrossRef]
- Wang, M.; Yang, X.; Wang, W. Establishing a 3D aggregates database from X-ray CT scans of bulk concrete. Constr. Build. Mater. 2022, 315, 125740. [Google Scholar] [CrossRef]
- Liu, T.; Qin, S.; Zou, D.; Song, W.; Teng, J. Mesoscopic modeling method of concrete based on statistical analysis of CT images. Constr. Build. Mater. 2018, 192, 429–441. [Google Scholar] [CrossRef]
- Tian, W.; Han, N. Pore characteristics (>0.1 mm) of non-air entrained concrete destroyed by freeze-thaw cycles based on CT scanning and 3D printing. Cold Reg. Sci. Technol. 2018, 151, 314–322. [Google Scholar] [CrossRef]
- Zhang, L.; Dang, F.; Ding, W.; Zhu, L. Quantitative study of meso-damage process on concrete by CT technology and improved differential box counting method. Measurement 2020, 160, 107832. [Google Scholar] [CrossRef]
- Wang, L.; Zhao, Y.; Chen, F.; Han, Y. The 3D CT reconstruction algorithm to directly reconstruct multi-characteristic based on EMD. Measurement 2011, 44, 2043–2048. [Google Scholar] [CrossRef]
- Chen, S.; Ren, J.; Song, Y.; Li, Q.; Sun, J.; Che, Y.; Chen, J. Salt Freeze-Thaw Damage Characteristics of Concrete based on Computed Tomography. Teh. Vjesn. 2019, 26, 1753–1763. [Google Scholar]
- Li, J.; Zhou, K.; Liu, W.; Deng, H. NMR research on deterioration characteristics of microscopic structure of sandstones in freeze–thaw cycles. Trans. Nonferrous Met. Soc. China 2016, 26, 2997–3003. [Google Scholar] [CrossRef]
- Zhang, J.; Bian, F.; Zhang, Y.; Fang, Z.; Fu, C.; Guo, J. Effect of pore structures on gas permeability and chloride diffusivity of concrete. Constr. Build. Mater. 2018, 163, 402–413. [Google Scholar] [CrossRef]
- Weinberg, K.; Khosravani, M.R. On the tensile resistance of UHPC at impact. Eur. Phys. J. Spec. Top. 2018, 227, 167–177. [Google Scholar] [CrossRef]
- Khosravani, M.R. Inverse characterization of UHPC material based on Hopkinson bar test. Appl. Eng. Sci. 2021, 6, 100043. [Google Scholar] [CrossRef]
- DeRousseau, M.A.; Kasprzyk, J.R.; Srubar, W.V. Computational design optimization of concrete mixtures: A review. Cem. Concr. Res. 2018, 109, 42–53. [Google Scholar] [CrossRef]
- Zhang, W.; Pi, Y.; Kong, W.; Zhang, Y.; Wu, P.; Zeng, W.; Yang, F. Influence of damage degree on the degradation of concrete under freezing-thawing cycles. Constr. Build. Mater. 2020, 260, 119903. [Google Scholar] [CrossRef]
- Li, Y.; Liu, X.F.; Li, J.Q. Bond Properties of FRP-concrete Interface with Nano-modified Epoxy Resin under Wet-dry Cycles. KSCE J. Civ. Eng. 2017, 21, 1379–1385. [Google Scholar] [CrossRef]
- Guo, J.; Wang, K.; Guo, T.; Yang, Z.; Zhang, P. Effect of Dry-Wet Ratio on Properties of Concrete Under Sulfate Attack. Materials 2019, 12, 2755. [Google Scholar] [CrossRef] [PubMed]


| Cement | Water | Sand | Gravel | Fly Ash | Expansion Agent | Water Reducer |
|---|---|---|---|---|---|---|
| 410 | 165 | 711 | 1066 | 61 | 32.8 | 4.1 |
| Specimens (Number) | Controlled Group (1) | Exposed Group (1) | Protected Group (1) |
|---|---|---|---|
| Environment | Clear water | 10% Na2SO4 | 10% Na2SO4, Silane coating |
| Specimens | Exposed Group | Protected Group | Controlled Group |
|---|---|---|---|
| Failure load (KN) | 104.58 | 118.79 | 140.42 |
| Diameter (mm) | 49.44 | 49.40 | 49.42 |
| Uniaxial compressive strength (MPa) | 54.48 | 61.98 | 73.21 |
| Specimens | ||||
|---|---|---|---|---|
| Exposed Group | 2.55 | 2.17 | 0.51 | 0.200 |
| Protected Group | 1.67 | 1.32 | 0.17 | 0.102 |
| Specimens | ||||
|---|---|---|---|---|
| Exposed Group | 0.070 | 0.035 | 0.090 | 0.227 |
| Protected Group | 0.023 | 0.060 | 0.169 | 0.150 |
| Damage Factor | |||
|---|---|---|---|
| E | 0.49 | 0.365 | 0.255 |
Publisher’s Note: MDPI stays neutral with regard to jurisdictional claims in published maps and institutional affiliations. |
© 2022 by the authors. Licensee MDPI, Basel, Switzerland. This article is an open access article distributed under the terms and conditions of the Creative Commons Attribution (CC BY) license (https://creativecommons.org/licenses/by/4.0/).
Share and Cite
Liu, D.; Jian, Y.; Tang, Y.; Cao, K.; Zhang, W.; Chen, H.; Gong, C. Comprehensive Testing of Sulfate Erosion Damage of Concrete Structures and Analysis of Silane Coating Protection Effect. Sensors 2022, 22, 7991. https://0-doi-org.brum.beds.ac.uk/10.3390/s22207991
Liu D, Jian Y, Tang Y, Cao K, Zhang W, Chen H, Gong C. Comprehensive Testing of Sulfate Erosion Damage of Concrete Structures and Analysis of Silane Coating Protection Effect. Sensors. 2022; 22(20):7991. https://0-doi-org.brum.beds.ac.uk/10.3390/s22207991
Chicago/Turabian StyleLiu, Dunwen, Yinghua Jian, Yu Tang, Kunpeng Cao, Wanmao Zhang, Haofei Chen, and Chun Gong. 2022. "Comprehensive Testing of Sulfate Erosion Damage of Concrete Structures and Analysis of Silane Coating Protection Effect" Sensors 22, no. 20: 7991. https://0-doi-org.brum.beds.ac.uk/10.3390/s22207991