
Evaluation of Two Portable Hyperspectral-Sensor-Based Instruments to Predict Key Soil Properties in Canadian Soils †

 , ,
, ,
Abstract
:1. Introduction
2. Materials and Methods
2.1. Soils
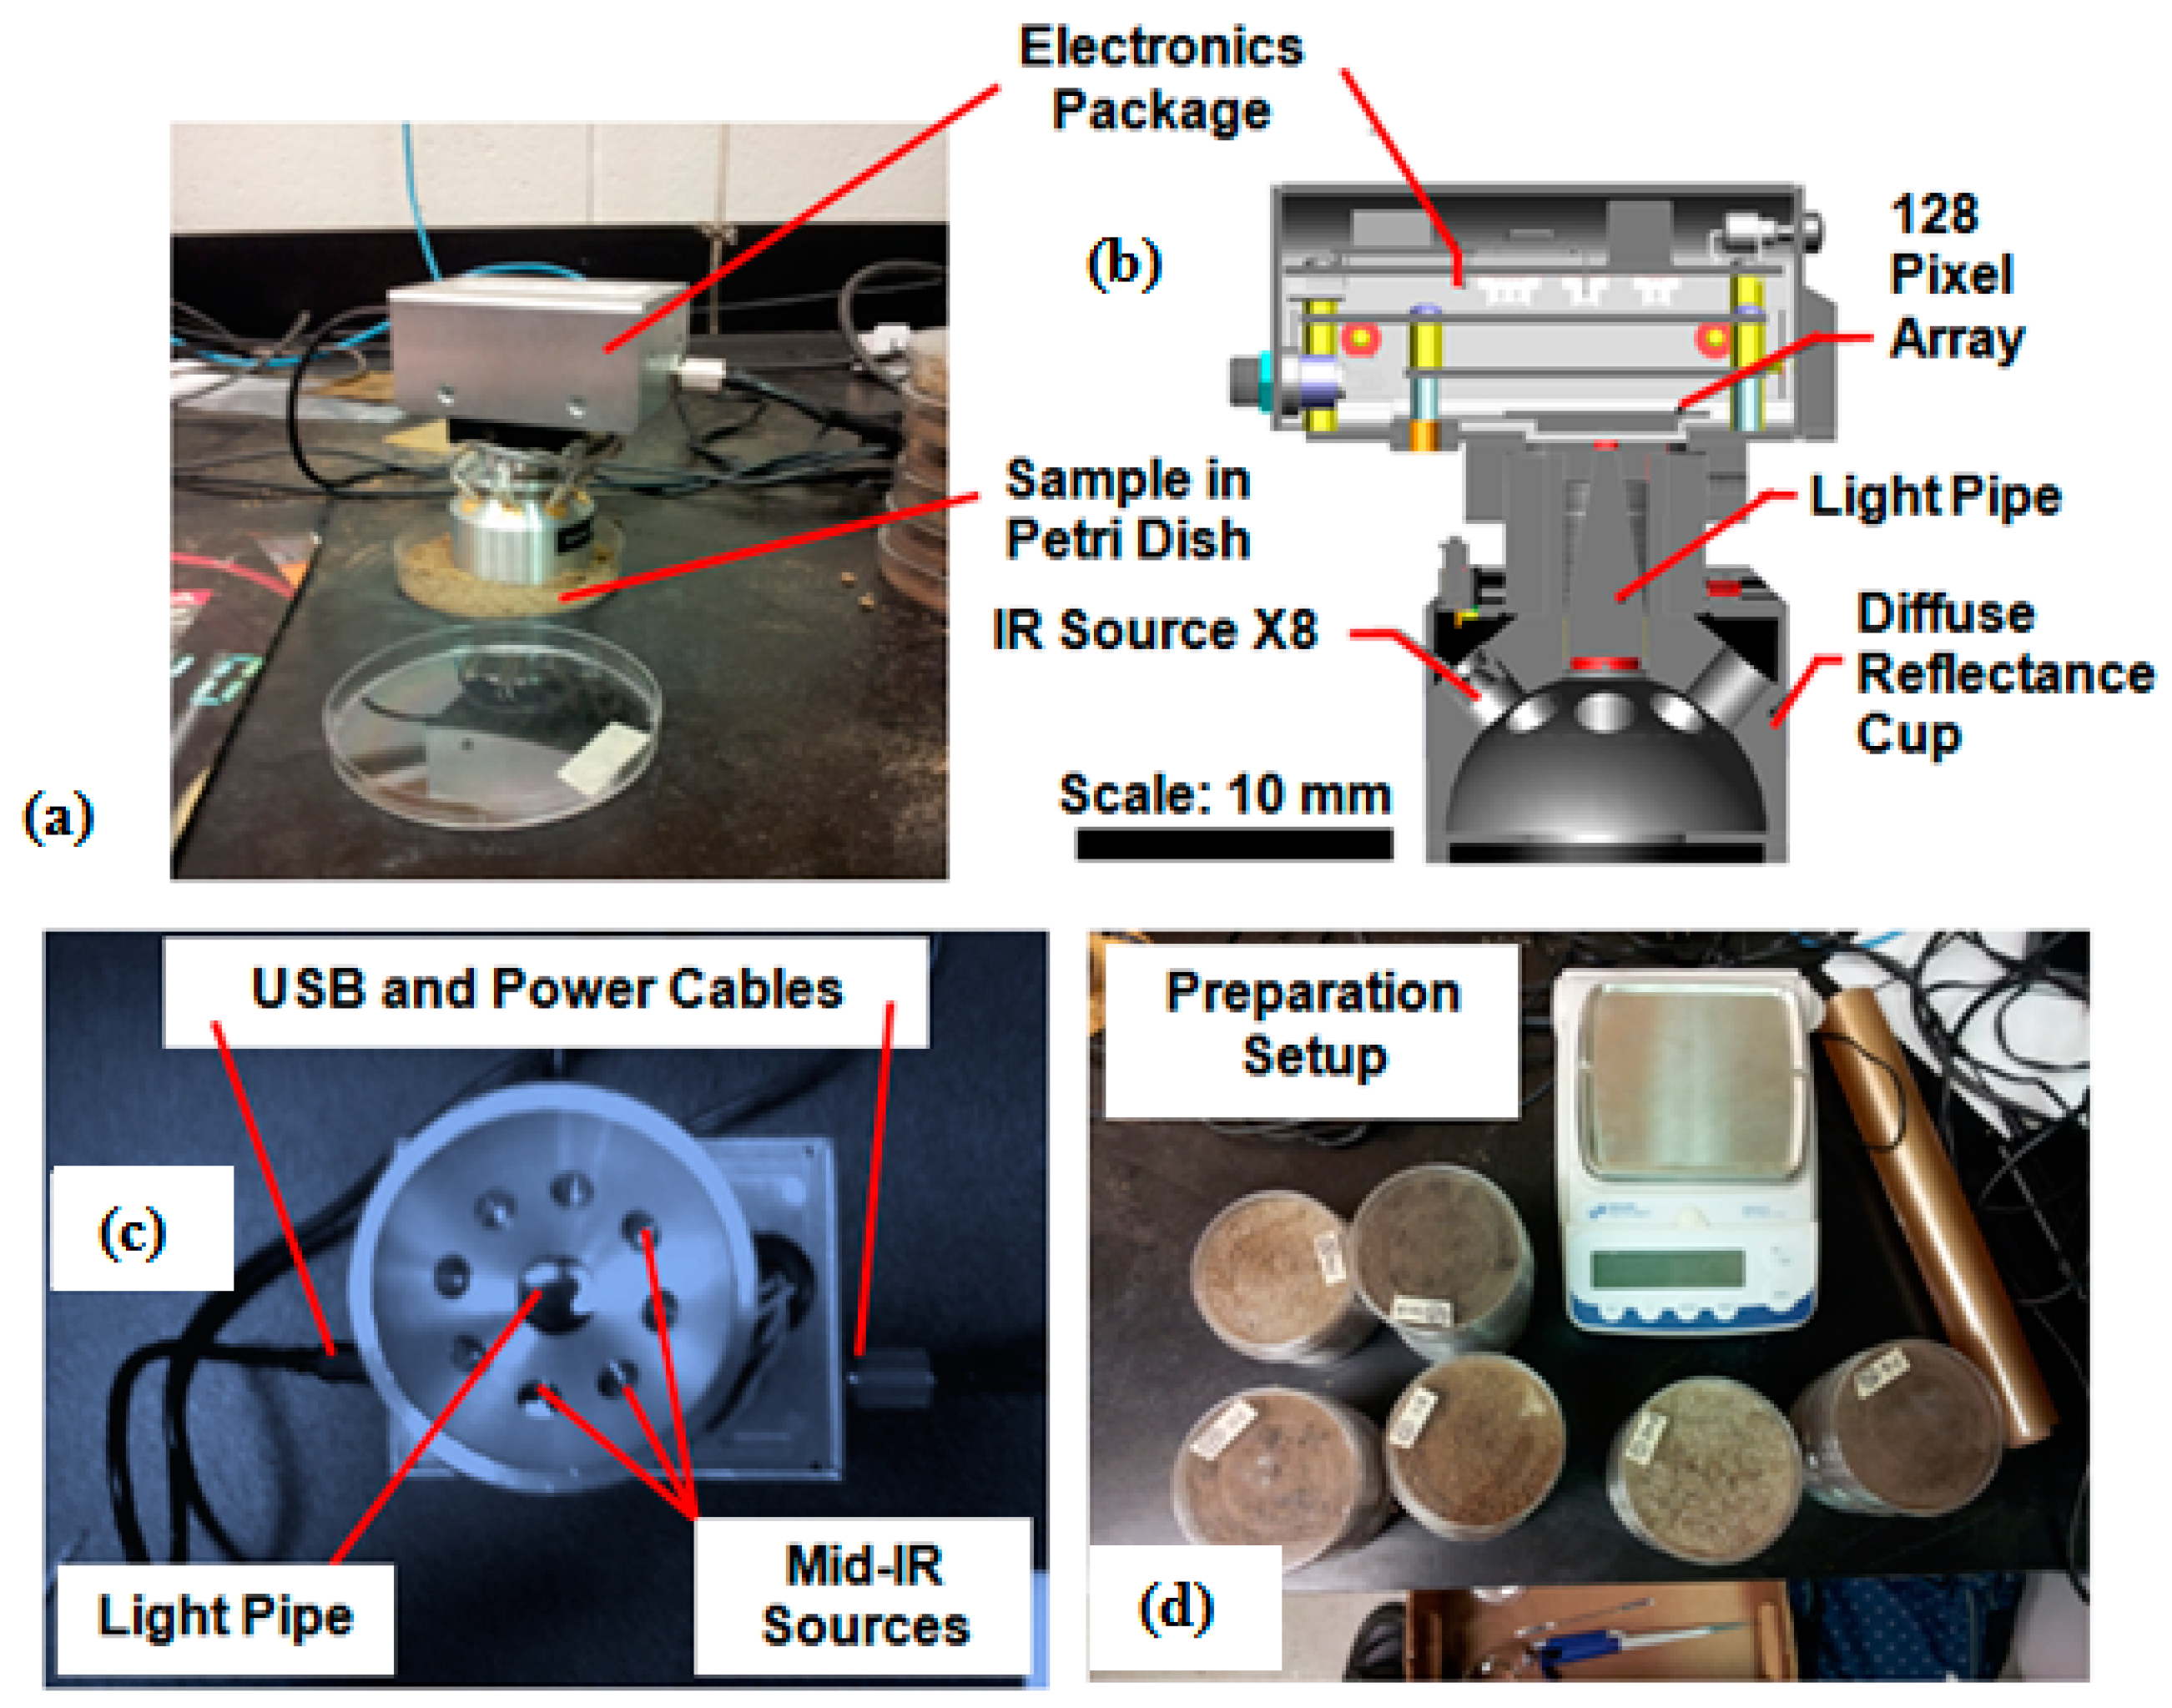
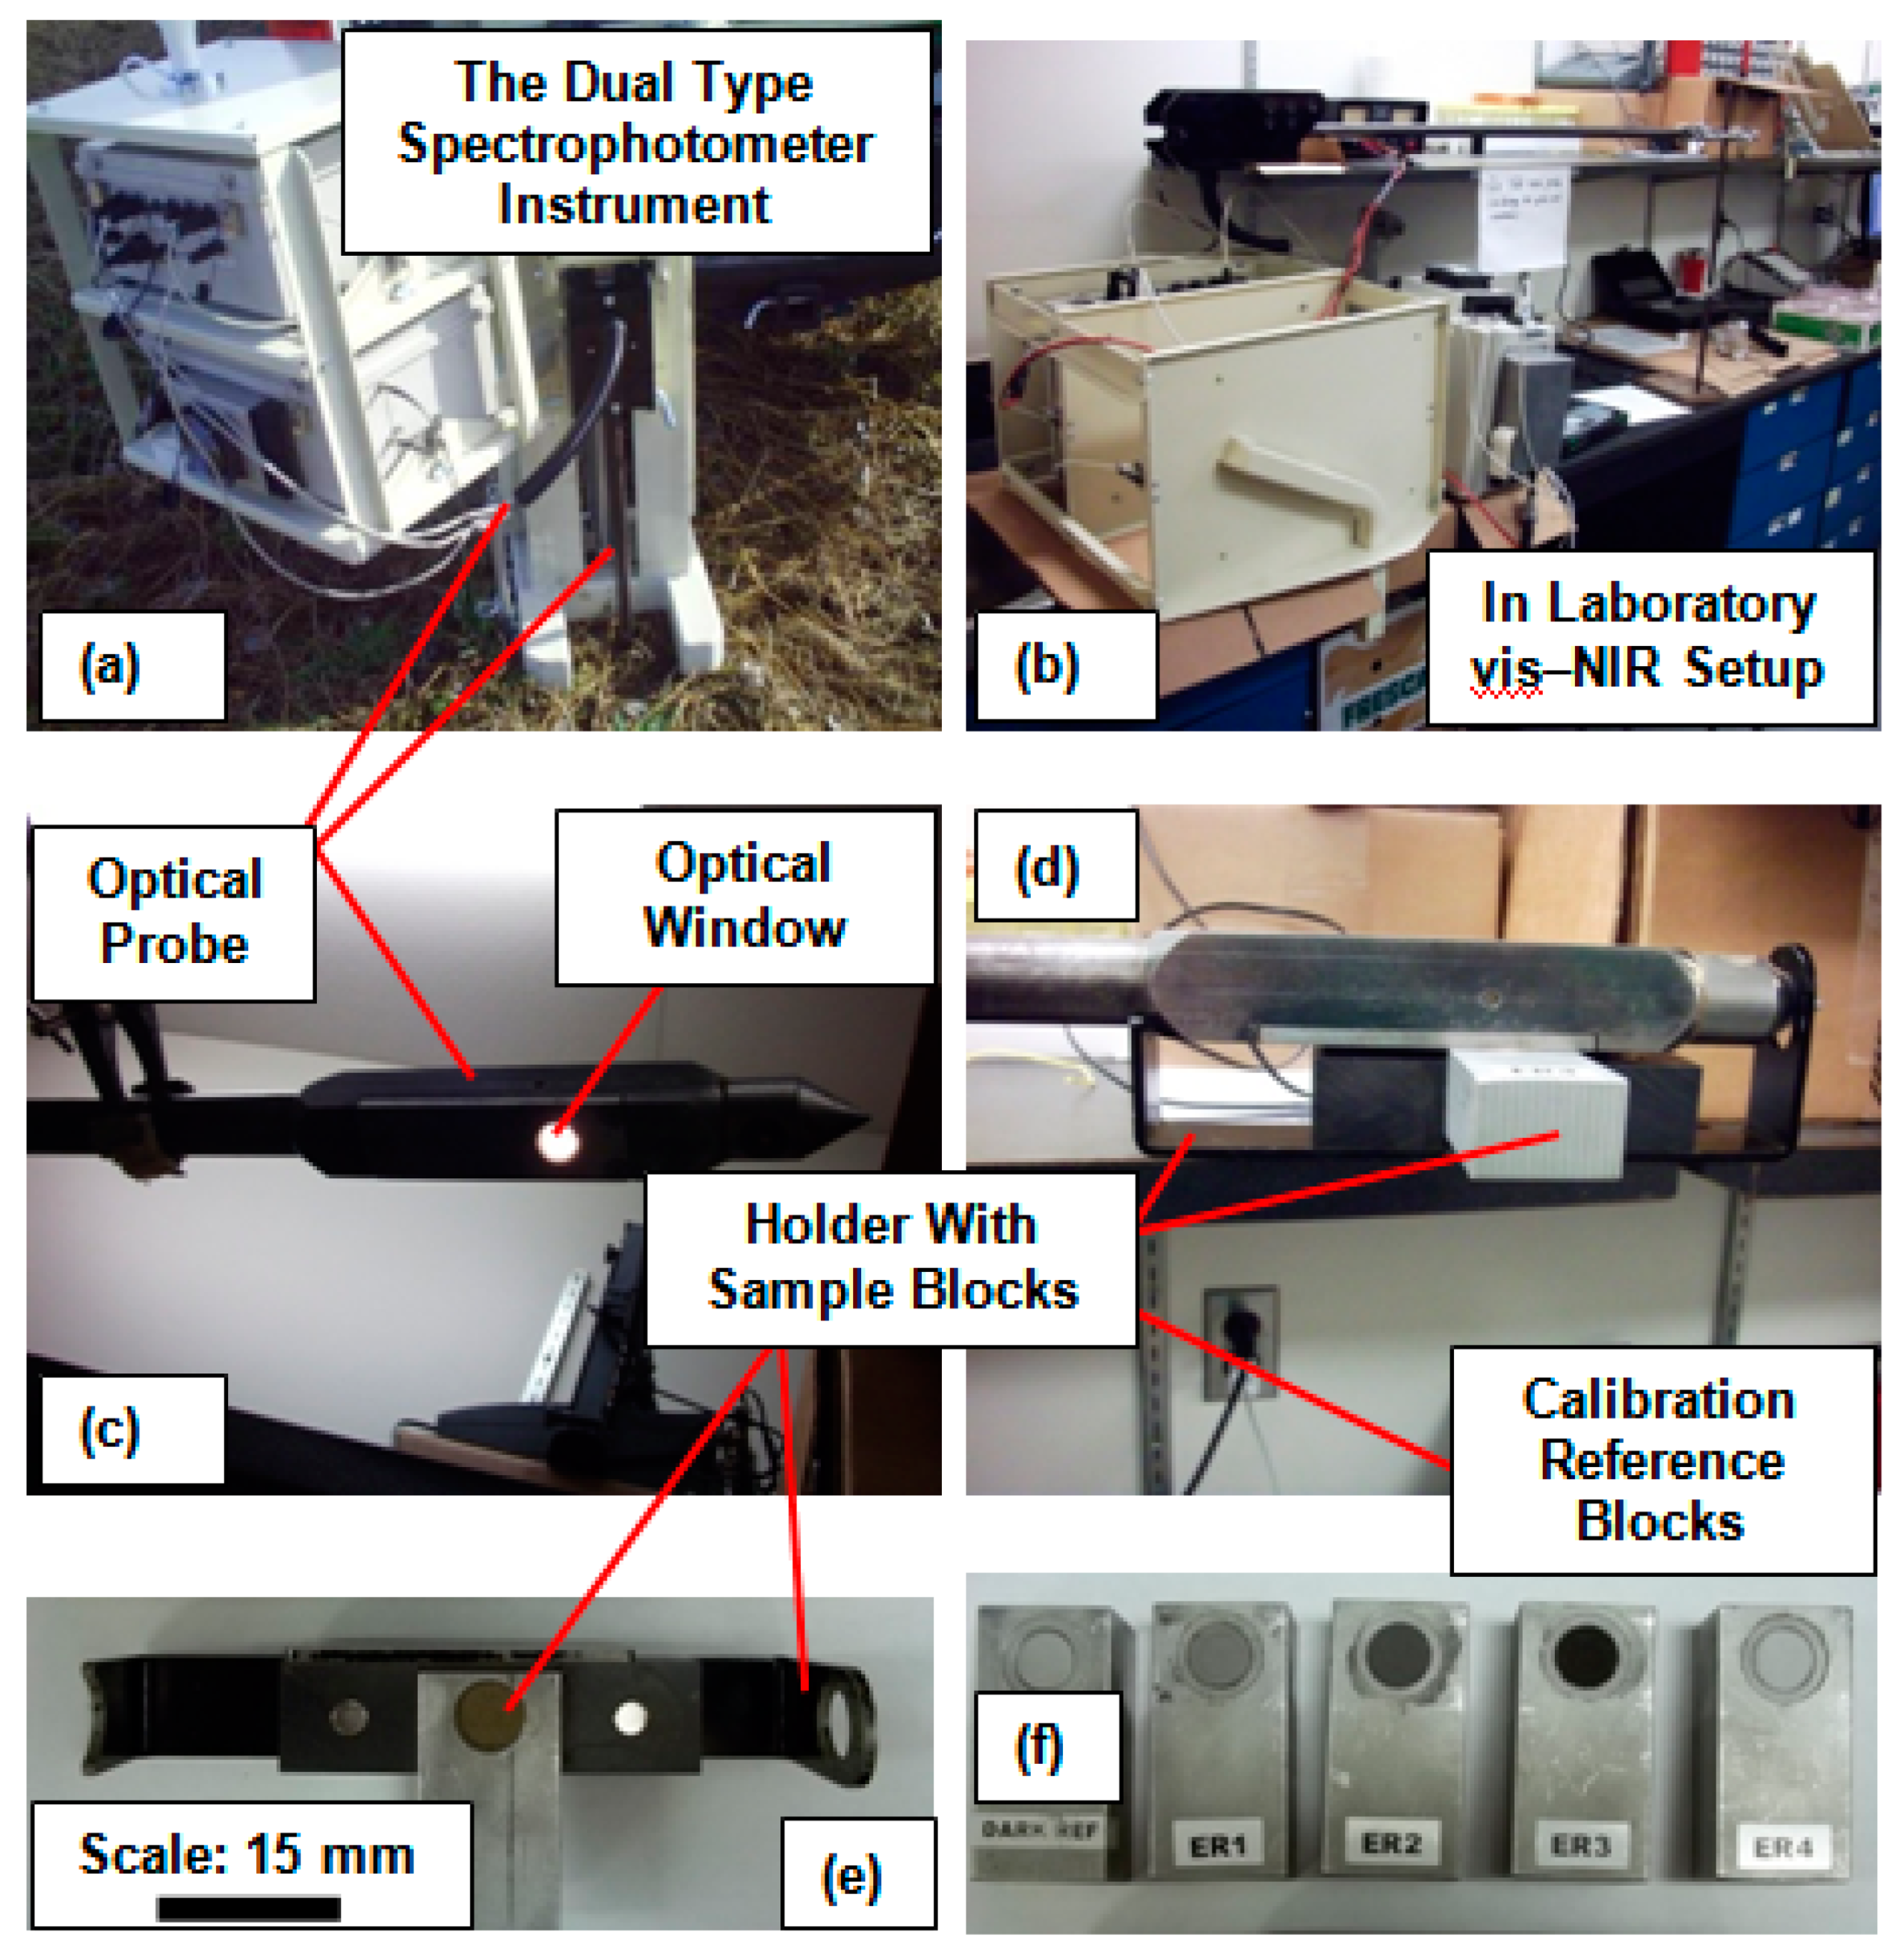
2.2. Spectral Data Collection
2.3. Spectral Data Processing
3. Results and Discussion
4. Conclusions
Author Contributions
Funding
Institutional Review Board Statement
Informed Consent Statement
Data Availability Statement
Acknowledgments
Conflicts of Interest
References
- Viscarra Rossel, R.A.; Walvoort, D.J.J.; McBratney, A.B.; Janik, L.J.; Skjemstad, J.O. Visible, near infrared, mid infrared or combined diffuse reflectance spectroscopy for simultaneous assessment of various soil properties. Geoderma 2006, 131, 59–75. [Google Scholar] [CrossRef]
- Dalal, R.; Henry, R. Simultaneous Determination of Moisture, Organic Carbon, and Total Nitrogen by Near Infrared Reflectance Spectrophotometry. Soil Sci. Soc. Am. J. 1986, 50, 120–123. [Google Scholar] [CrossRef]
- Chang, C.-W.; Laird, D.A. Near-infrared reflectance spectroscopic analysis of soil C and N. Soil Sci. 2002, 167, 110–116. [Google Scholar] [CrossRef]
- Shepherd, K.; Walsh, M. Development of reflectance spectral libraries for characterization of soil properties. Soil Sci. Soc. Am. J. 2002, 66, 988–998. [Google Scholar] [CrossRef]
- Cozzolino, D.; Moron, A. The potential of near-infrared reflectance spectroscopy to analyze soil chemical and physical characteristics. J. Agric. Sci. 2003, 140, 65–71. [Google Scholar] [CrossRef]
- Viscarra Rossel, R.A.; Walter, C.; Fouad, Y. Assessment of Two Reflectance Techniques for the Quantification of Field Soil Organic Carbon. In Precision Agriculture, Proceedings of the Fourth European Conference on Precision Agriculture, Berlin, Germany, 16–18 June 2003; Stafford, J., Ed.; Werner: Berlin, Germany, 2003; p. 697. [Google Scholar]
- Chang, C.W.; Laird, D.A.; Mausbach, M.J.; Hurburgh, C.R. Near infrared reflectance spectroscopy-principal components regression analysis of soil properties. Soil Sci. Soc. Am. J. 2001, 65, 480–490. [Google Scholar] [CrossRef] [Green Version]
- Harberhauer, G.; Gerzabek, M.H. DRIFT and transmission FT-IR spectroscopy of forest soils: An approach to determine decomposition process of forest litter. Vib. Spectrosc. 1999, 19, 413–417. [Google Scholar] [CrossRef]
- Janik, L.J.; Skjemstad, J.O. Characterisation and analysis of soils using mid-infrared partial least squares: II. Correlation with some laboratory data. Aust. J. Soil Res. 1995, 33, 637–650. [Google Scholar] [CrossRef]
- Janik, L.J.; Skjemstad, J.O.; Raven, M.D. Characterization and analysis of soils using mid infrared partial least-squares. I. Correlations with XRF-determined major-element composition. Aust. J. Soil Res. 1995, 33, 621–636. [Google Scholar] [CrossRef]
- McCarty, G.W.; Reeves, J.B., III; Reeves, V.B.; Follett, R.F.; Kimble, J.M. Mid-infrared and near-infrared diffuse reflectance spectroscopy for soil carbon measurements. Soil Sci. Soc. Am. J. 2002, 66, 640–646. [Google Scholar] [CrossRef]
- Masserschmidt, I.; Cuelbas, C.J.; Poppi, R.J.; De Andrade, J.C.; De Abreu, C.A.; Davanzo, C.U. Determination of organic matter in soils by FTIR/diffuse reflectance and multivariate calibration. J. Chemom. 1999, 13, 265–273. [Google Scholar] [CrossRef]
- Nguyen, T.T.; Janik, L.J.; Raupach, M. Diffuse reflectance infrared Fourier transform (DRIFT) spectroscopy in soils studies. Aust. J. Soil Res. 1999, 29, 49–67. [Google Scholar] [CrossRef]
- Janik, L.J.; Merry, R.H.; Skjemstad, J.O. Can mid infrared diffuse reflectance analysis replace soil extractions? Aust. J. Exp. Agric. 1998, 38, 681–696. [Google Scholar] [CrossRef]
- Dong, Y.; Yang, S.; Xu, C.; Li, Y.; Bai, W.; Fan, Z.; Wang, Y.; Li, Q. Determination of soil parameters in apple-growing regions by near- and mid-infrared spectroscopy. Pedosphere 2011, 21, 591–602. [Google Scholar] [CrossRef]
- Yang, X.; Xie, H.; Drury, C.; Reynolds, W.; Yang, J.; Zhang, X. Determination of organic carbon and nitrogen in particulate organic matter and particle size fractions of Brookston clay loam soil using infrared spectroscopy. Eur. J. Soil Sci. 2011, 63, 177–188. [Google Scholar] [CrossRef]
- Rabenarivo, M.; Chapus-Lardy, L.; Brunet, D.; Chotte, J.-L.; Rabeharisoa, L.; Barthes, B.G. Comparing near and mid-infrared reflectance spectroscopy for determining properties of Malagasy soils, using global or LOCAL calibration. J. Near Infrared Spectrosc. 2013, 21, 495–509. [Google Scholar] [CrossRef]
- Reeves, J.B., III. Near-versus mid-infrared diffuse reflectance spectroscopy for soil analysis emphasizing carbon and laboratory versus on-site analysis: Where are we and what needs to be done ? Geoderma 2010, 158, 3–14. [Google Scholar] [CrossRef]
- Bellon-Maurel, V.; McBratney, A. Near-infrared (NIR) and mid-infrared (MIR) spectroscopic techniques for assessing the amount of carbon stock in soils—Critical review and research perspectives. Soil Biol. Biochem. 2011, 43, 1398–1410. [Google Scholar] [CrossRef]
- Leenen, M.; Pätzold, S.; Tóth, G.; Welp, G. A LUCAS-based mid-infrared soil spectral library: Its usefulness for soil survey and precision agriculture. J. Plant Nutr. Soil Sci. 2022, 1–14. [Google Scholar] [CrossRef]
- Ng, W.; Minasny, B.; Jeon, S.H.; McBratney, A. Mid-infrared spectroscopy for accurate measurement of an extensive set of soil properties for assessing soil functions. Soil Secur. 2022, 6, 100043. [Google Scholar] [CrossRef]
- Metzger, K.; Zhang, C.; Daly, K. From benchtop to handheld MIR for soil analysis: Predicting lime requirement and organic matter in agricultural soils. Biosyst. Eng. 2021, 204, 257–269. [Google Scholar] [CrossRef]
- Hutengs, C.; Ludwig, B.; Jung, A.; Eisele, A.; Vohland, M. Comparison of Portable and Bench-Top Spectrometers for Mid-Infrared Diffuse Reflectance Measurements of Soils. Sensors 2018, 18, 993. [Google Scholar] [CrossRef] [PubMed] [Green Version]
- Vestergaard, R.-J.; Vasava, H.B.; Aspinall, D.; Chen, S.; Gillespie, A.; Adamchuk, V.; Biswas, A. Evaluation of Optimized Preprocessing and Modeling Algorithms for Prediction of Soil Properties Using VIS-NIR Spectroscopy. Sensors 2021, 20, 6745. [Google Scholar] [CrossRef] [PubMed]
- Mozaffari, H.; Moosavi, A.A.; Cornelis, W. Vis-NIR-spectroscopy- and loss-on-ignition-based functions to estimate organic matter content of calcareous soils. Arch. Agron. Soil Sci. 2022, 1–19. [Google Scholar] [CrossRef]
- Santos, U.J.d.; Demattê, J.A.d.; Menezes, R.S.C.; Dotto, A.C.; Guimarães, C.C.B.; Alves, B.J.R.; Primo, D.C.; Sampaio, E.V.d.B. Predicting carbon and nitrogen by visible near-infrared (Vis-NIR) and mid-infrared (MIR) spectroscopy in soils of Northeast Brazil. Geoderma Reg. 2020, 23, e00333. [Google Scholar] [CrossRef]
- Lazaar, A.; Mouazen, A.M.; Hammouti, K.E.L.; Fullen, M.; Pradhan, B.; Memon, M.S.; Andich, K.; Monir, A. The application of proximal visible and near-infrared spectroscopy to estimate soil organic matter on the Triffa Plain of Morocco. Int. Soil Water Conserv. Res. 2020, 8, 195–204. [Google Scholar] [CrossRef]
- Hutengs, C.; Seidel, M.; Oertel, F.; Ludwig, B.; Vohland, M. In situ and laboratory soil spectroscopy with portable visible-to-near-infrared and mid-infrared instruments for the assessment of organic carbon in soils. Geoderma 2019, 355, 113900. [Google Scholar] [CrossRef]
- Soriano-Disla, J.M.; Janik, L.J.; Allen, D.J.; McLaughlin, M.J. Evaluation of the performance of portable visible-infrared instruments for the prediction of soil properties. Biosyst. Eng. 2017, 161, 24–36. [Google Scholar] [CrossRef]
- Hu, W.; Chau, H.W.; Si, B.C. Vis-Near IR Reflectance Spectroscopy for Soil Organic Carbon Content Measurement in the Canadian Prairies. Clean Soil Air Water 2015, 43, 1215–1223. [Google Scholar] [CrossRef]
- Li, S.; Viscarra Rossel, R.A.; Webster, R. The cost-effectiveness of reflectance spectroscopy for estimating soil organic carbon. Eur. J. Soil Sci. 2022, 73, e13202. [Google Scholar] [CrossRef]
- Hardy, R.A.; James, M.R.; Pates, J.M.; Quinton, J.N. Using real time particle tracking to understand soil particle movements during rainfall events. CATENA 2017, 150, 32–38. [Google Scholar] [CrossRef]
- Paustian, K.; Lehmann, J.; Ogle, S.; Reay, D.; Robertson, G.P.; Smith, P. Climate-smart soils. Nature 2016, 532, 49–57. [Google Scholar] [CrossRef] [PubMed] [Green Version]
- Sudduth, K.; Hummel, J.W. Portable, Near-infrared Spectrophotometer for Rapid Soil Analysis. Trans. ASAE 1993, 36, 185–193. [Google Scholar] [CrossRef]
- Sudduth, K.; Hummel, J.W. Soil Organic Matter, CEC, and Moisture Sensing with a Portable NIR Spectrophotometer. Trans. ASAE 1993, 36, 1571–1582. [Google Scholar] [CrossRef]
- Christy, C. Real-time measurement of soil attributes using on-the-go near infrared reflectance spectroscopy. Comput. Electron. Agric. 2008, 61, 10–19. [Google Scholar] [CrossRef]
- Hodge, A.M.; Sudduth, K.A. Comparison of Two Spectrometers for Profile Soil Carbon Sensing; ASABE: St. Joseph, MI, USA, 2012; p. 121338240. [Google Scholar]
- Dhawale, N.M.; Adamchuk, V.; Viscarra, R.; Prasher, S.; Whalen, J.K.; Ismail, A. Predicting Extractable Soil Phosphorus Using Visible/Near-Infrared Hyperspectral Soil Reflectance Measurements; The Canadian Society for Bioengineering: Renfrew, ON, Canada, 2013; p. CSBE13-047. [Google Scholar]
- Wetterlind, J.; Piikki, K.; Stenberg, B.; Söderström, M. Exploring the predictability of soil texture and organic matter content with a commercial integrated soil profiling tool. Eur. J. Soil Sci. 2015, 66, 631–638. [Google Scholar] [CrossRef]
- Piikki, K.; Söderström, M. Digital soil mapping of arable land in Sweden—Validation of performance at multiple scales. Geoderma 2019, 352, 342–350. [Google Scholar] [CrossRef]
- Dhawale, N.M.; Adamchuk, V.I.; Prasher, S.O.; Viscarra Rossel, R.A.; Ismail, A.A.; Whalen, J.K.; Louargant, M. Comparing Visible/NIR and MIR Hyperspectrometry for Measuring Soil Physical Properties. In Proceedings of the 2014 ASABE and CSBE/SCGAB Annual International Meeting Sponsored by ASABE, Montreal, QC, Canada, 13–16 July 2014; ASABE: St. Joseph, MI, USA, 2014; p. 141909453rev. [Google Scholar] [CrossRef]
- Abdul, M.; Boyan, K. On-line visible and near infrared spectroscopy for in-field phosphorous management. Soil Tillage Res. 2015, 155, 471–477. [Google Scholar] [CrossRef]
- Adamchuk, V.I.; Dhawale, N.M.; Rene-Laforest, F. Development of on-the-spot soil analyzer for measuring soil chemical properties. In Proceedings of the 12th International Conference on Precision Agriculture, Sacramento, CA, USA, 20–23 July 2014; p. 1. [Google Scholar]
- Dhawale, N.M.; Adamchuk, V.I.; Prasher, S.O.; Viscarra, R.R.A.; Ismail, A.A. Analysis of the repeatability of soil spectral data obtained using different measurement techniques. In Proceedings of the 3rd Global Workshop on Proximal Soil Sensing, Potsdam, Germany, 26–29 May 2013; Gebbers, R., Ed.; ATB Leibniz-Institut fur Agratechnik Potsdam-Bornim: Potsdam, Germany, 2013; pp. 161–165. [Google Scholar]
- Dhawale, N.; Adamchuk, V.I.; Prasher, S.O.; Viscarra Rossel, R.V.; Ismail, A.A.; Kaur, J. Proximal soil sensing of soil texture and organic matter with a prototype portable mid-infrared spectrometer. Eur. J. Soil Sci. 2015, 66, 661–669. [Google Scholar] [CrossRef]
- St. Luce, M.; Ziadi, N.; Nyiraneza, J.; Tremblay, G.; Zebarthc, B.; Whalen, J.; Laterrière, M. Near infrared reflectance spectroscopy prediction of soil nitrogen supply in humid temperate regions of Canada. Soil Sci. Soc. Am. J. 2012, 76, 1454–1461. [Google Scholar] [CrossRef]
- Karyotis, K.; Angelopoulou, T.; Tziolas, N.; Palaiologou, E.; Samarinas, N.; Zalidis, G. Evaluation of a Micro-Electro Mechanical Systems Spectral Sensor for Soil Properties Estimation. Land 2021, 10, 63. [Google Scholar] [CrossRef]
- Nyiraneza, J.; N’Dayegamiye, A.; Gasser, M.O.; Giroux, M.; Grenier, M.; Landry, C.; Guertin, S. Soil and crop parameters related to corn nitrogen response in Eastern Canada. Agron. J. 2010, 102, 1478–1490. [Google Scholar] [CrossRef]
- Gee, G.W.; Bauder, J.W. Particle-Size Analysis. In Methods of Soil Analysis, Part 1—Physical and Mineralogical Methods; American Society of Agronomy: Madison, WI, USA, 1986; pp. 383–411. [Google Scholar]
- Viscarra Rossel, R.A. ParLeS: Software for chemometric analysis of spectroscopic data. Chemom. Intell. Lab. Syst. 2008, 90, 72–83. [Google Scholar] [CrossRef]
- Geladi, P.; MacDougall, D.; Martens, H. Linearization and Scatter-Correction for Near-Infrared Reflectance Spectra of Meat. Appl. Spectrosc. 1985, 39, 491–500. [Google Scholar] [CrossRef]
- Savitzky, A.; Golay, M.J.E. Smoothing and Differentiation of Data by Simplified Least Squares Procedures. Anal. Chem. 1964, 36, 1627–1639. [Google Scholar] [CrossRef]
- Soil Survey Staff. Soil Taxonomy: A Basic System of Soil Classification for Making and Interpreting Soil Surveys, 2nd ed.; Natural Resources Conservation Service; U.S. Department of Agriculture Handbook 436; U.S. Department of Agriculture: Washington, DC, USA, 1999. Available online: https://www.nrcs.usda.gov/wps/portal/nrcs/detail/soils/survey/class/taxonomy/?cid=nrcs142p2_053577 (accessed on 10 January 2022).
- Martens, H.; Næs, T. Multivariate Calibration; Springer: Berlin/Heidelberg, Germany, 1984; pp. 147–156. [Google Scholar]
- Geladi, P.; Kowalski, B.R. Partial least-squares regression: A tutorial. Anal. Chim. Acta. 1986, 185, 1–17. [Google Scholar] [CrossRef]
- De Jong, S.; Kiers, H. Principal covariates regression. J. Chemom. Intell. Lab. Syst. 1992, 14, 155–164. [Google Scholar] [CrossRef]
- Wold, S.; Sjöström, M.; Eriksson, L. PLS-regression: A basic tool of chemometrics. J. Chemom. Intell. Lab. Syst. 2001, 58, 109. [Google Scholar] [CrossRef]
- Linker, R. Soil classification via mid-infrared spectroscopy. Comput. Comput. Technol. Agric. 2008, 2, 1137–1146. [Google Scholar]
- Etzion, Y.; Linker, R.; Cogan, U.; Shmulevich, I. Determinationof protein concentration in raw milk by mid-infrared FTIR/ATR spec-troscopy. J. Dairy Sci. 2004, 87, 2779–2788. [Google Scholar] [CrossRef] [Green Version]
- Viscarra Rossel, R.A.; Jeon, Y.S.; Odeh, I.O.A.; McBratney, A.B. Using a legacy soil sample to develop a mid-IR spectral library. Aust. Soil Res. 2008, 46, 1–16. [Google Scholar] [CrossRef]
- Forrester, S.T.; Janik, L.J.; Soriano-Disla, J.-M.; Mason, S.; Burkitt, L.; Moody, P.; Gourley, J.P.C.; McLaughlin, M.J. Use of handheld mid-infrared spectroscopy and partial least-squares regression for the prediction of the phosphorus buffering index in Australian soils. Soil Res. 2015, 53, 67–80. [Google Scholar] [CrossRef]
- Biney, J.K.M. Verifying the predictive performance for soil organic carbon when employing field Vis-NIR spectroscopy and satellite imagery obtained using two different sampling methods. Comput. Electron. Agric. 2022, 194, 106796. [Google Scholar] [CrossRef]
- Dhawale, N.M.; Adamchuk, V.I.; Prasher, S.O.; Viscarra Rossel, R.A. Evaluating the Precision and Accuracy of Proximal Soil vis–NIR Sensors for Estimating Soil Organic Matter and Texture. Soil Syst. 2021, 5, 48. [Google Scholar] [CrossRef]
- Miller, R.O. A western evaluation of soil testing laboratory performance. Better Crops 2006, 90, 26–29. [Google Scholar]
- Adamchuk, V.I.; Hummel, J.; Morgan, M.; Upadhyaya, S. On-the-go soil sensors for precision agriculture. Comput. Electron. Agric. 2004, 44, 71–91. [Google Scholar] [CrossRef] [Green Version]
- Gebbers, R.; Herbst, R.; Wenkel, K.-O. Sensitivity Analysis of Soil Nutrient Mapping. In Proceedings of the EFITA Conference 09, Wageningen, The Netherlands, 6–8 July 2009; Bregt, A., Ed.; Wageningen Academic Publishers: Wageningen, The Netherlands, 2009; p. 513. [Google Scholar]
- Saifuzzaman, M.; Adamchuk, V.; Buelvas, R.; Biswas, A.; Prasher, S.; Rabe, N.; Aspinall, D.; Ji, W. Clustering Tools for Integration of Satellite Remote Sensing Imagery and Proximal Soil Sensing Data. Remote Sens. 2019, 11, 1036. [Google Scholar] [CrossRef] [Green Version]
- Dhawale, N.; Adamchuk, V.; Huang, H.; Ji, W.; Lauzon, S.; Biswas, A.; Dutilleul, P. Integrated Analysis of Multilayer Proximal Soil Sensing Data. In Proceedings of the International Conference on Precision Agriculture, St. Louis, MO, USA, 31 July–4 August 2016. [Google Scholar]
- Adamchuk, V.; Ji, W.; Viscarra Rossel, R.V.; Gebbers, R.; Tremblay, N.; Shannon, D.; Clay, D.; Kitchen, N. Proximal Soil and Plant Sensing. In ASA, CSSA, and SSSA Books; Wiley: Hoboken, NJ, USA, 2018; pp. 119–140. [Google Scholar]
- Viscarra Rossel, R.V.; Adamchuk, V.I.; Sudduth, K.A.; McKenzie, N.; Lobsey, C. Proximal Soil Sensing: An Effective Approach for Soil Measurements in Space and Time. In Advances in Agronomy; Academic Press: Cambridge, MA, USA, 2011; Volume 113, pp. 243–291. [Google Scholar]
- Rossel, R.A.V.; Behrens, T.; Ben-Dor, E.; Brown, D.J.; Demattê, J.A.M.; Shepherd, K.D.; Shi, Z.; Stenberg, B.; Stevens, A.; Adamchuk, V.; et al. A global spectral library to characterize the world’s soil. Earth-Sci. Rev. 2016, 155, 198–230. [Google Scholar] [CrossRef] [Green Version]
- Ji, W.; Viscarra Rossel, R.A.; Shi, Z. Accounting for the effects of water and the environment on proximally sensed vis–NIR soil spectra and their calibrations. Eur. J. Soil Sci. 2015, 66, 555–565. [Google Scholar] [CrossRef]
- Ji, W.; Adamchuk, V.; Biswas, A.; Dhawale, N.; Sudarsan, B.; Zhang, Y.; Viscarra Rossel, R. Assessment of soil properties in situ using a prototype portable MIR spectrometer in two agricultural fields. Biosyst. Eng. 2016, 152, 14–27. [Google Scholar] [CrossRef]
- Ji, W.; Adamchuk, V.I.; Chen, S.; Su, A.S.M.; Ismail, A.; Gan, Q.; Shi, Z.; Biswas, A. Simultaneous measurement of multiple soil properties through proximal sensor data fusion: A case study. Geoderma 2019, 341, 111–128. [Google Scholar] [CrossRef]
- Ribeiro, S.G.; Teixeira, A.d.S.; de Oliveira, M.R.R.; Costa, M.C.G.; Araújo, I.C.d.S.; Moreira, L.C.J.; Lopes, F.B. Soil Organic Carbon Content Prediction Using Soil-Reflected Spectra: A Comparison of Two Regression Methods. Remote Sens. 2021, 13, 4752. [Google Scholar] [CrossRef]
- Goldshleger, N.; Chudnovsky, A.; Ben-Dor, E. Using Reflectance Spectroscopy and Artificial Neural Network to Assess Water Infiltration Rate into the Soil Profile. Appl. Environ. Soil Sci. 2012, 2012, 439567. [Google Scholar] [CrossRef] [Green Version]
- Shen, Z.; Viscarra Rossel, R.A. Automated spectroscopic modeling with optimized convolutional neural networks. Sci. Rep. 2021, 11, 208. [Google Scholar] [CrossRef] [PubMed]
- Sun, Q.; Yu, X.; Li, H.; Fan, J. Adaptive feature extraction and fault diagnosis for three-phase inverter based on hybrid-CNN models under variable operating conditions. Complex Intell. Syst. 2022, 8, 29–42. [Google Scholar] [CrossRef]
- Morellos, A.; Pantazi, X.-E.; Moshou, D.; Alexandridis, T.; Whetton, R.; Tziotzios, G.; Wiebesohn, J.; Bill, R.; Mouazen, A. Machine Learning based Prediction of Soil Total Nitrogen, Organic Carbon and Moisture Content by Using vis–NIR Spectroscopy. Biosyst. Eng. 2016, 152, 104–116. [Google Scholar] [CrossRef] [Green Version]
- Deissa, L.; Margenot, A.J.; Culman, S.W.; Demyan, M.S. Tuning support vector machines regression models improves prediction accuracy of soil properties in MIR spectroscopy. Geoderma 2020, 365, 114227. [Google Scholar] [CrossRef]
- Vayssade, J.-A.; Paoli, J.-N.; Gée, C.; Jones, G. DeepIndices: Remote Sensing Indices Based on Approximation of Functions through Deep-Learning, Application to Uncalibrated Vegetation Images. Remote Sens. 2021, 13, 2261. [Google Scholar] [CrossRef]
- Padarian, J.; Minasny, B.; McBratney, A.B. Using deep learning to predict soil properties from regional spectral data. Geoderma Reg. 2019, 16, e00198. [Google Scholar] [CrossRef]
- Xu, Z.; Zhao, X.; Guo, X.; Guo, J. Deep learning application for predicting soil organic matter content by VIS-NIR spectroscopy. Comput. Intel. Neurosc. 2019, 2019, 3563761. [Google Scholar] [CrossRef]
- Chen, S.; Xu, D.; Li, S.; Ji, W.; Yang, M.; Zhou, Y.; Hu, B.; Xu, H.; Shi, Z. Monitoring soil organic carbon in alpine soils using in situ vis-NIR spectroscopy and a multilayer perceptron. Land Degrad. Dev. 2020, 494, 1026–1038. [Google Scholar] [CrossRef]


| Soil Property a | Instrument Type | Method | No. of Sample | No. of PLS Factor | Range | Unit | RMSE | R2 |
|---|---|---|---|---|---|---|---|---|
| Sand [1] | b | d | 116 | 7 | 58–84 | g | 2.61 | N/A |
| Sand [14] | b | d | 88 | N/A | 21–96 | f | N/A | 0.93 |
| Clay [1] | b | d | 116 | 7 | 8–24 | g | 1.74 | N/A |
| Clay [9] | b | d | 281 | 6 | N/A | f | 8.88 | 0.80 |
| Clay [14] | b | d | 88 | N/A | 2–49 | f | N/A | 0.86 |
| SOC [1] | b | d | 118 | 6 | 0.81–1.98 | g | 0.15 | N/A |
| SOC [9] | b | d | 298 | 9 | N/A | f | 1.08 | 0.92 |
| SOC [12] | b | d | 31 | N/A | 0.68–12.0 | f | 0.63 | 0.96 |
| SOC [18] | b | d | 201 | 3 | 0.11–2.63 | f | 0.18 | 0.91 |
| SOC [18] | b | d | 201 | 4 | 0.11–2.64 | f | 0.18 | 0.91 |
| SOC [18] | b | e | 201 | 5 | 0.11–2.65 | f | 0.21 | 0.87 |
| SOC [18] | b | e | 201 | 5 | 0.11–2.66 | f | 0.29 | 0.75 |
| Sand [1] | c | d | 116 | N/A | 58–84 | g | 3.33–3.77 | N/A |
| Sand [4] | c | d | 457 | N/A | 80–900 | h | 108 | 0.76 |
| Sand [5] | c | d | 319 | N/A | 2–71 | g | 7.2 | 0.80 |
| Sand [7] | c | d | 743 | 8 | 1–95 | g | 11.93 | 0.82 |
| Clay [1] | c | d | 116 | N/A | 8–24 | g | 1.91–2.28 | N/A |
| Clay [4] | c | d | 457 | N/A | 50–790 | h | 75 | 0.78 |
| Clay [5] | c | d | 319 | N/A | 8–53 | f | 3.8 | 0.90 |
| Clay [7] | c | d | 743 | 12 | 0.7–35 | f | 4 | 0.67 |
| SOC [1] | c | d | 118 | N/A | 0.81–1.98 | g | 0.18 | N/A |
| SOC [3] | c | d | 108 | 6 | 15–144 | h | 6.2 | 0.89 |
| SOC [4] | c | d | 674 | N/A | 2–59 | h | 3.1 | 0.80 |
| SOC [6] | c | d | 103 | 6 | 0.82–8.9 | f | 0.5 | 0.90 |
| Dataset Type | Statistic | Sand (g kg−1) | Clay (g kg−1) | SOC (g kg−1) |
|---|---|---|---|---|
| Calibration | Min | 0 | 42 | 5.41 |
| Median | 340 | 280 | 16.00 | |
| Max | 860 | 740 | 39.06 | |
| Mean | 378 | 290 | 17.11 | |
| SD | 203 | 142 | 5.99 | |
| Validation | Min | 0 | 50 | 9.71 |
| Median | 330 | 280 | 15.94 | |
| Max | 860 | 750 | 37.54 | |
| Mean | 370 | 299 | 17.64 | |
| SD | 236 | 163 | 6.14 |
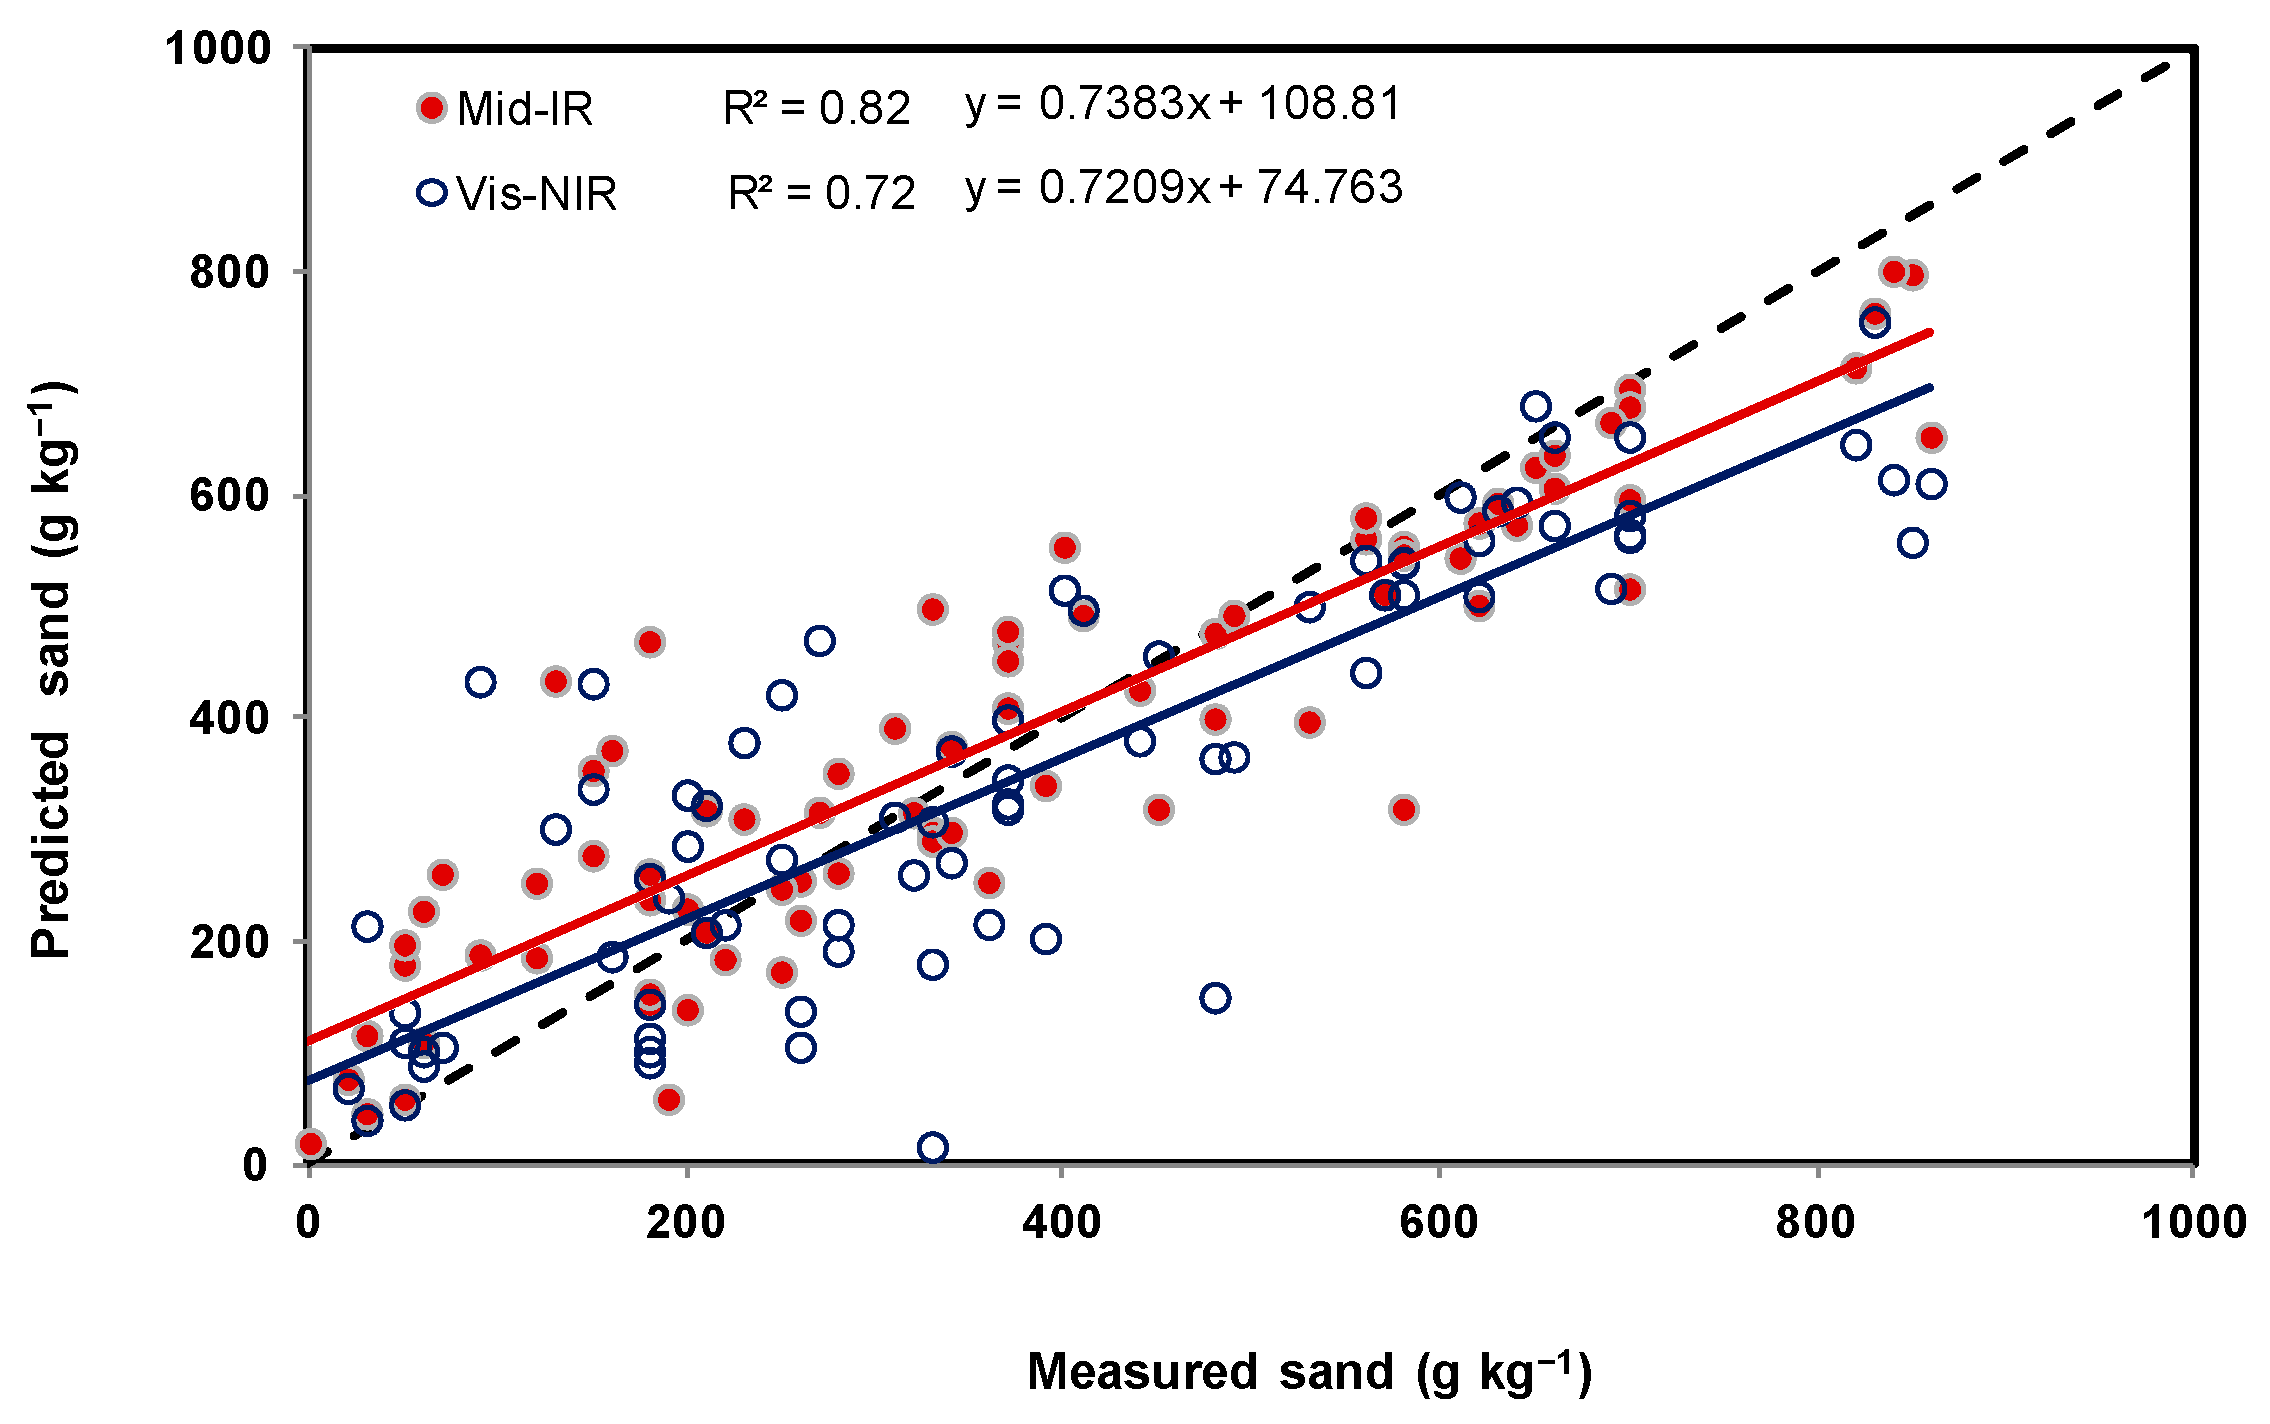
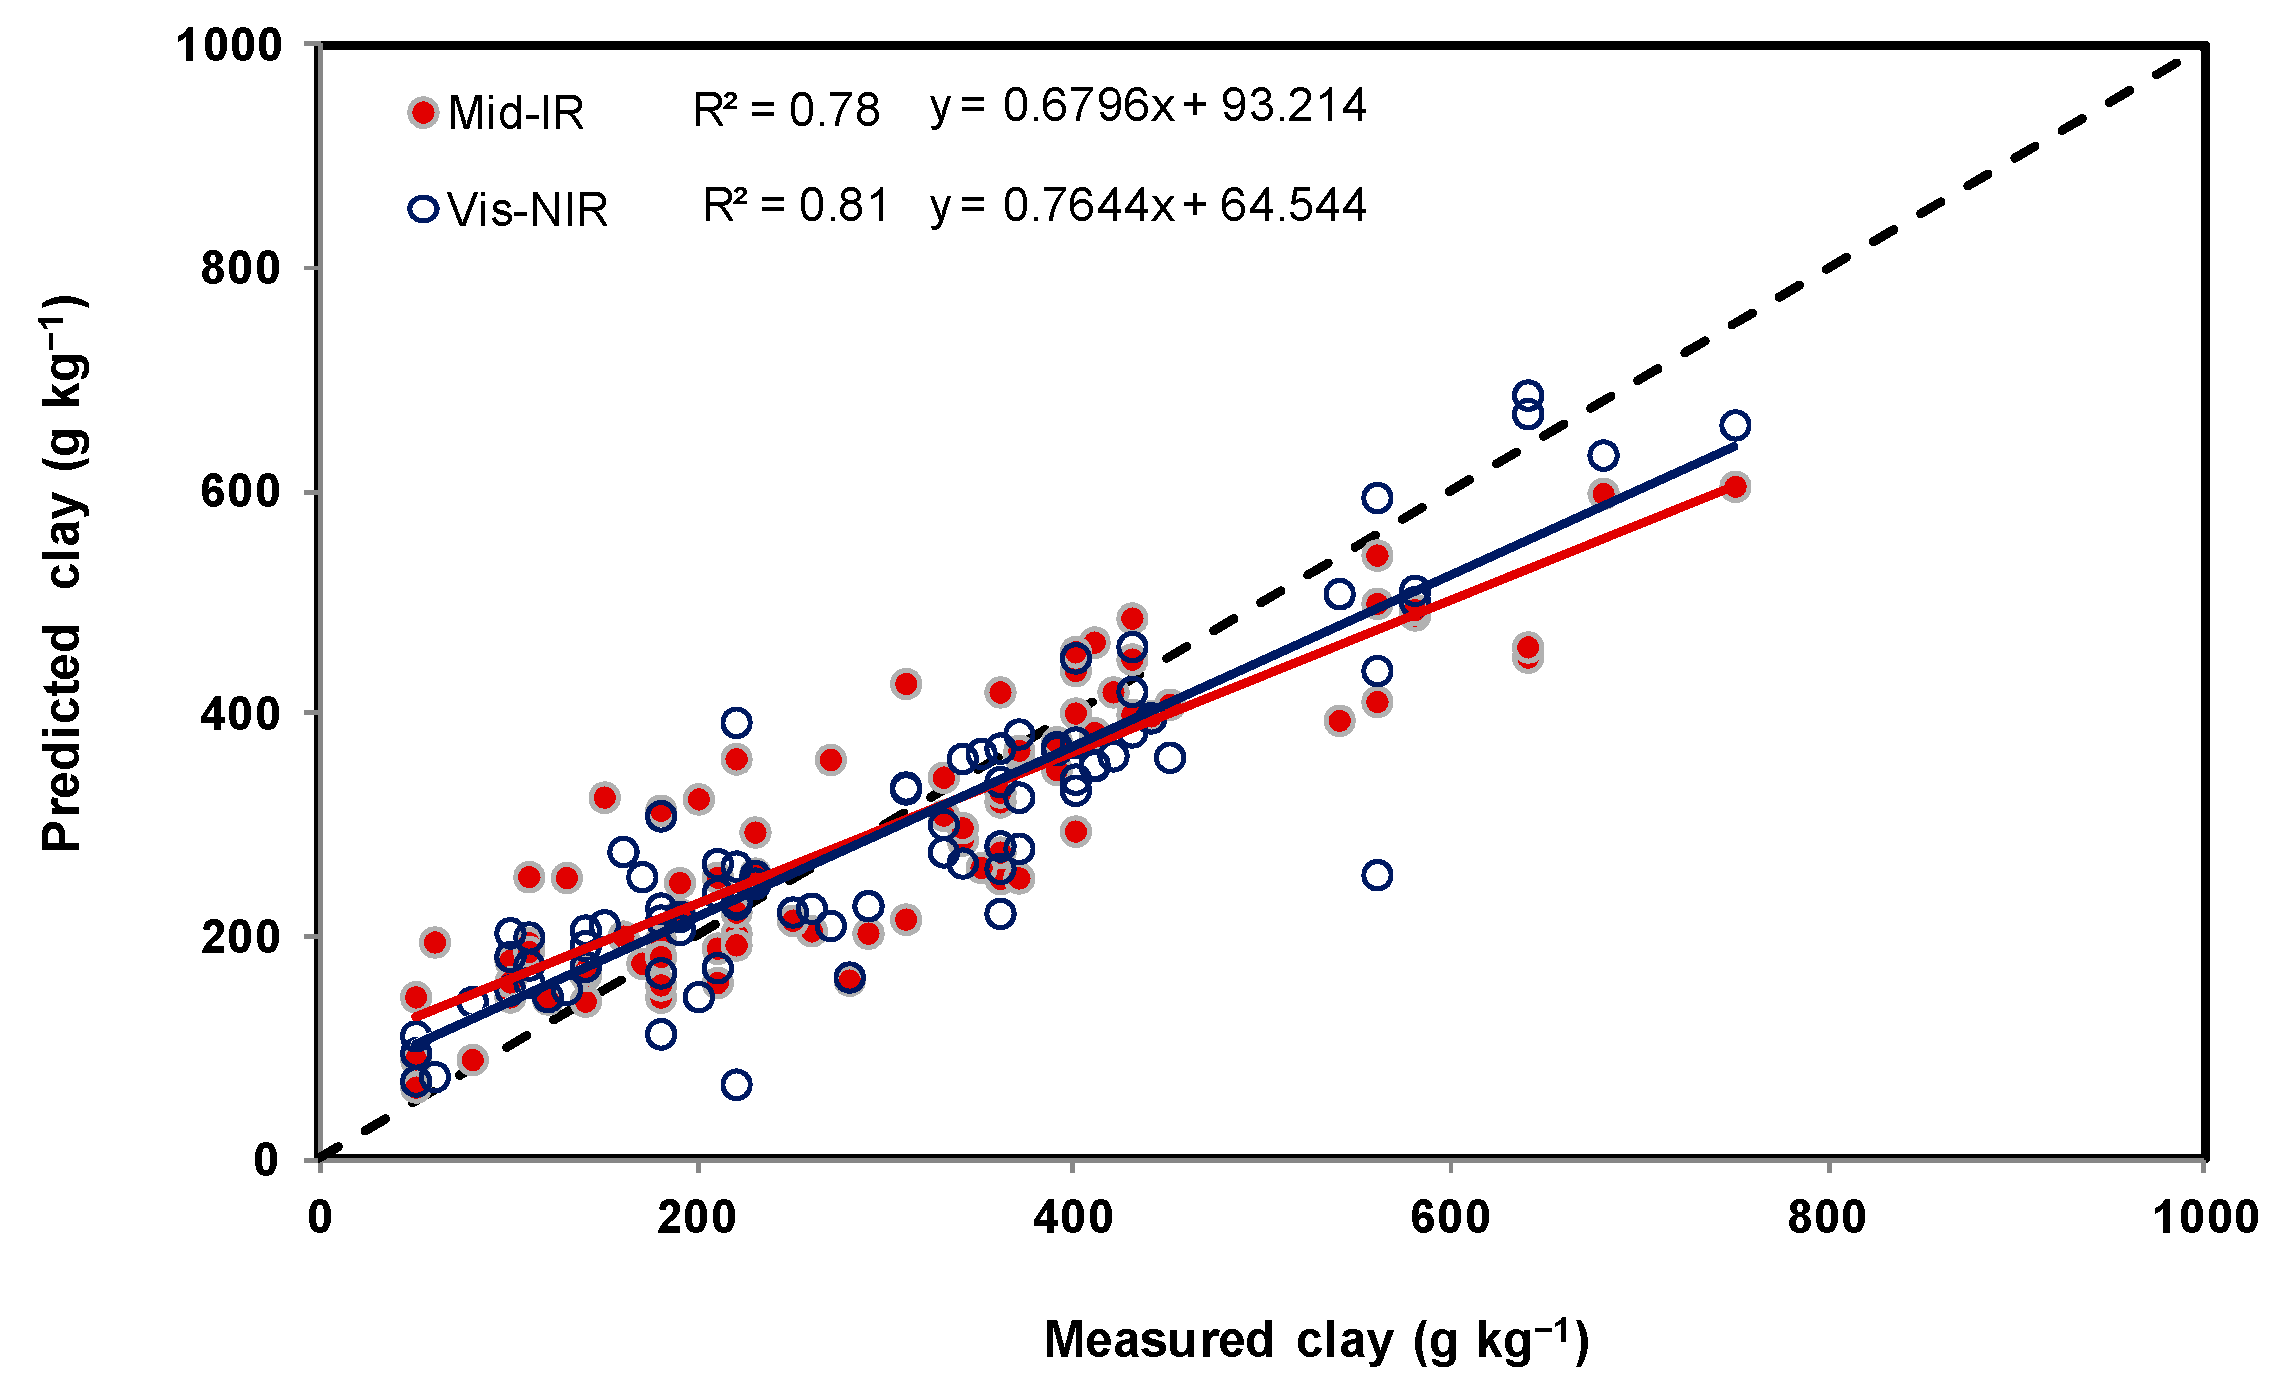
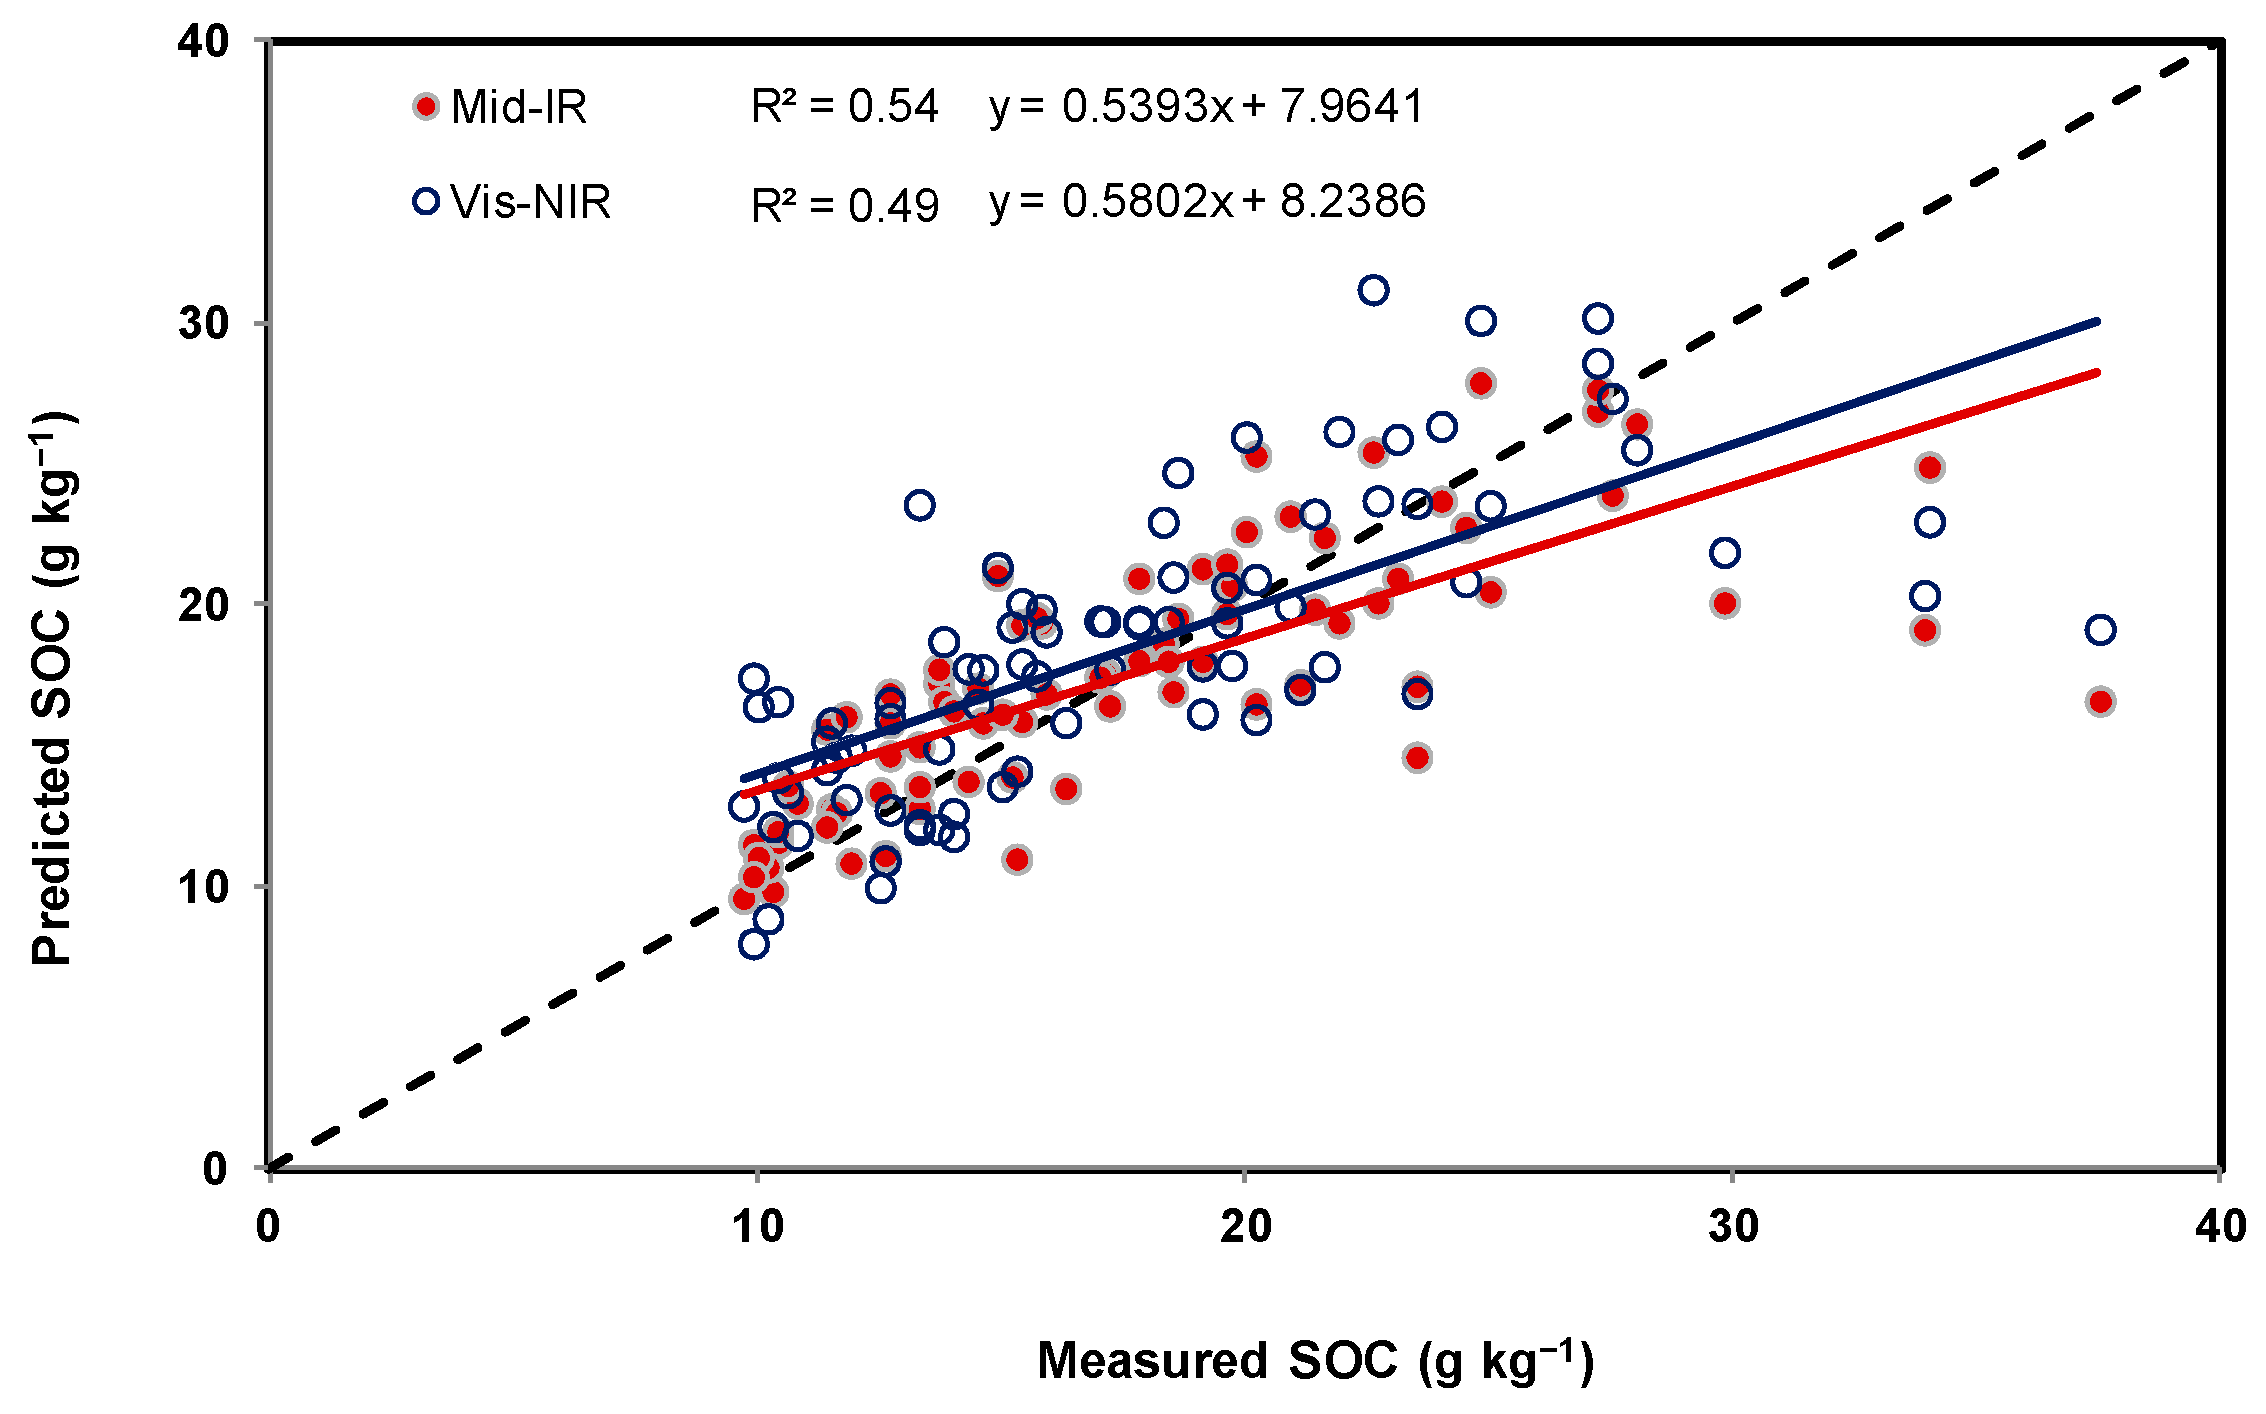
| Attribute (g kg−1) | Dataset Type | No. of PLSR Factors | R2 | RMSE | SDE | ME |
|---|---|---|---|---|---|---|
| Sand | Calibration | 5 | 0.64 | 121.4 | 121.7 | 0.05 |
| Validation | 0.82 | 103.3 | 103.2 | 1.20 | ||
| Clay | Calibration | 4 | 0.61 | 88.6 | 88.8 | −0.03 |
| Validation | 0.78 | 77.9 | 78.3 | −0.25 | ||
| SOC | Calibration | 6 | 0.63 | 3.7 | 3.7 | 0.00 |
| Validation | 0.54 | 4.1 | 4.2 | −0.02 |
| Attribute (g kg−1) | Dataset Type | No. of PLSR Factors | R2 | RMSE | SDE | ME |
|---|---|---|---|---|---|---|
| Sand | Calibration | 15 | 0.74 | 104.0 | 104.0 | 0.14 |
| Validation | 0.72 | 127.3 | 124.8 | −2.85 | ||
| Clay | Calibration | 7 | 0.79 | 65.7 | 65.8 | −0.02 |
| Validation | 0.82 | 71.7 | 71.9 | −0.58 | ||
| SOC | Calibration | 12 | 0.62 | 3.8 | 3.8 | −0.01 |
| Validation | 0.49 | 4.5 | 4.5 | 0.09 |
Publisher’s Note: MDPI stays neutral with regard to jurisdictional claims in published maps and institutional affiliations. |
© 2022 by the authors. Licensee MDPI, Basel, Switzerland. This article is an open access article distributed under the terms and conditions of the Creative Commons Attribution (CC BY) license (https://creativecommons.org/licenses/by/4.0/).
Share and Cite
Dhawale, N.M.; Adamchuk, V.I.; Prasher, S.O.; Rossel, R.A.V.; Ismail, A.A. Evaluation of Two Portable Hyperspectral-Sensor-Based Instruments to Predict Key Soil Properties in Canadian Soils. Sensors 2022, 22, 2556. https://0-doi-org.brum.beds.ac.uk/10.3390/s22072556
Dhawale NM, Adamchuk VI, Prasher SO, Rossel RAV, Ismail AA. Evaluation of Two Portable Hyperspectral-Sensor-Based Instruments to Predict Key Soil Properties in Canadian Soils. Sensors. 2022; 22(7):2556. https://0-doi-org.brum.beds.ac.uk/10.3390/s22072556
Chicago/Turabian StyleDhawale, Nandkishor M., Viacheslav I. Adamchuk, Shiv O. Prasher, Raphael A. Viscarra Rossel, and Ashraf A. Ismail. 2022. "Evaluation of Two Portable Hyperspectral-Sensor-Based Instruments to Predict Key Soil Properties in Canadian Soils" Sensors 22, no. 7: 2556. https://0-doi-org.brum.beds.ac.uk/10.3390/s22072556