
Optimizing the Sensitivity of Biological Particle Detectors through Atmospheric Particle Analysis According to Climatic Characteristics in South Korea

Abstract
:1. Introduction
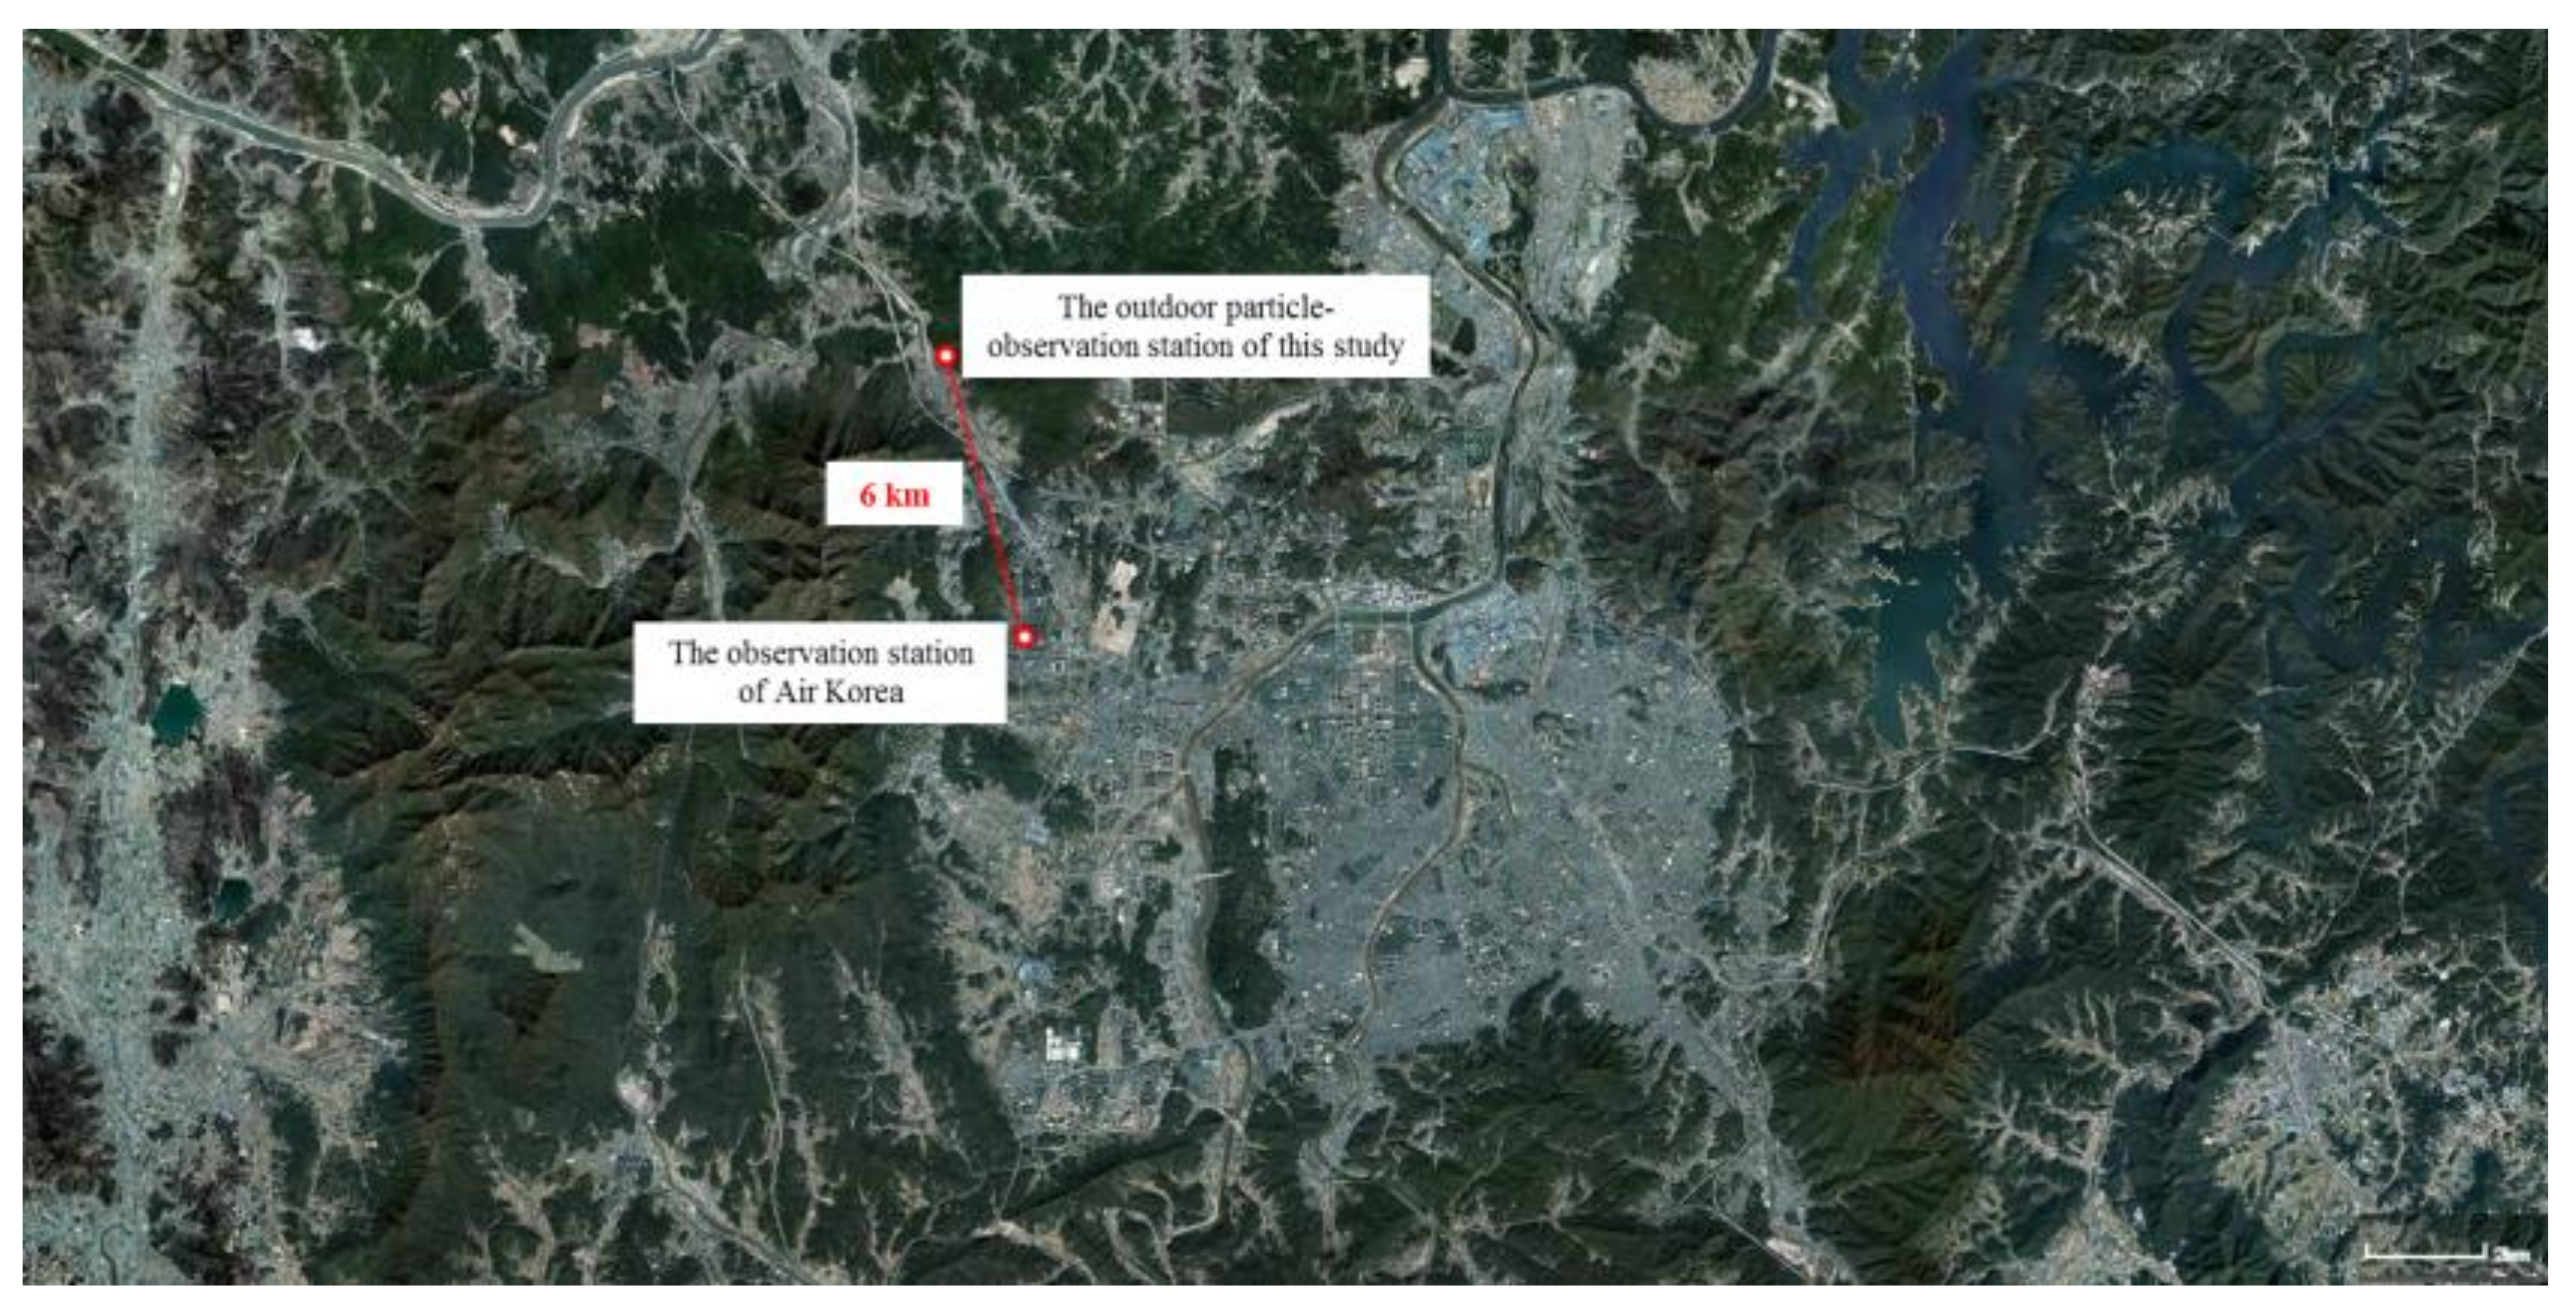
2. Materials and Methods
2.1. Optics Design
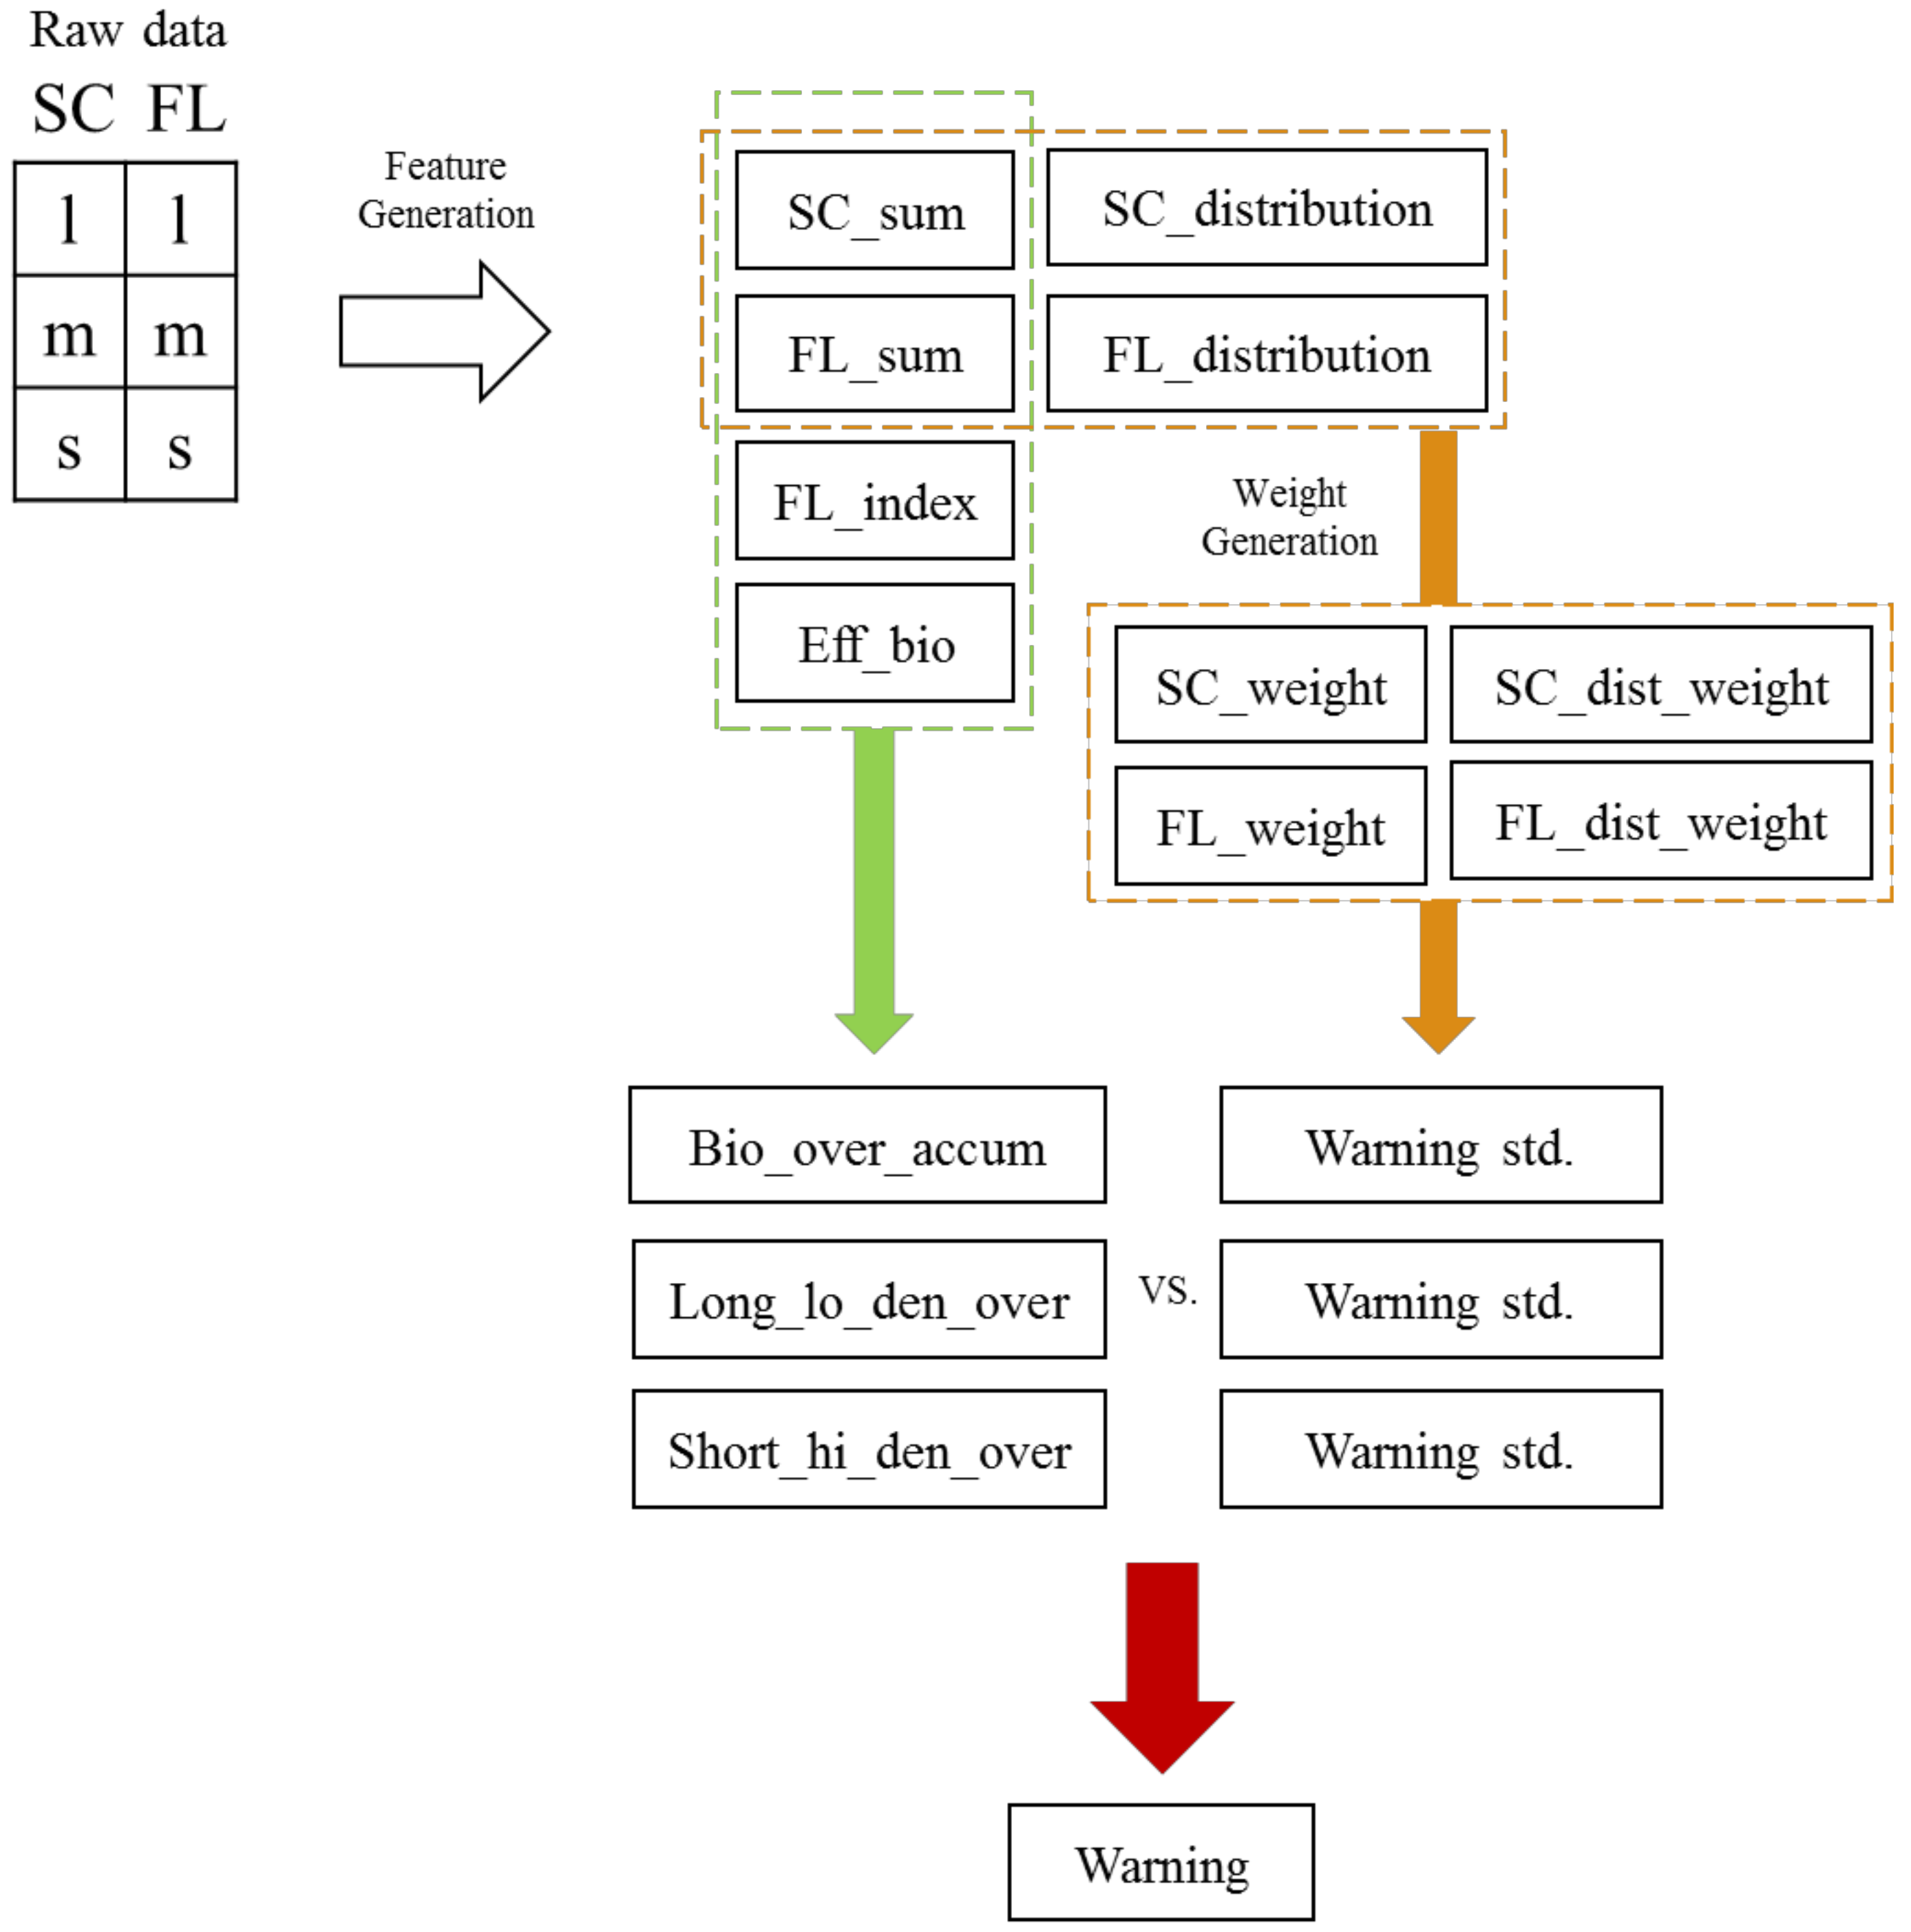
2.2. Algorithm
3. Results and Discussion
3.1. Particle Analysis in Different Climates
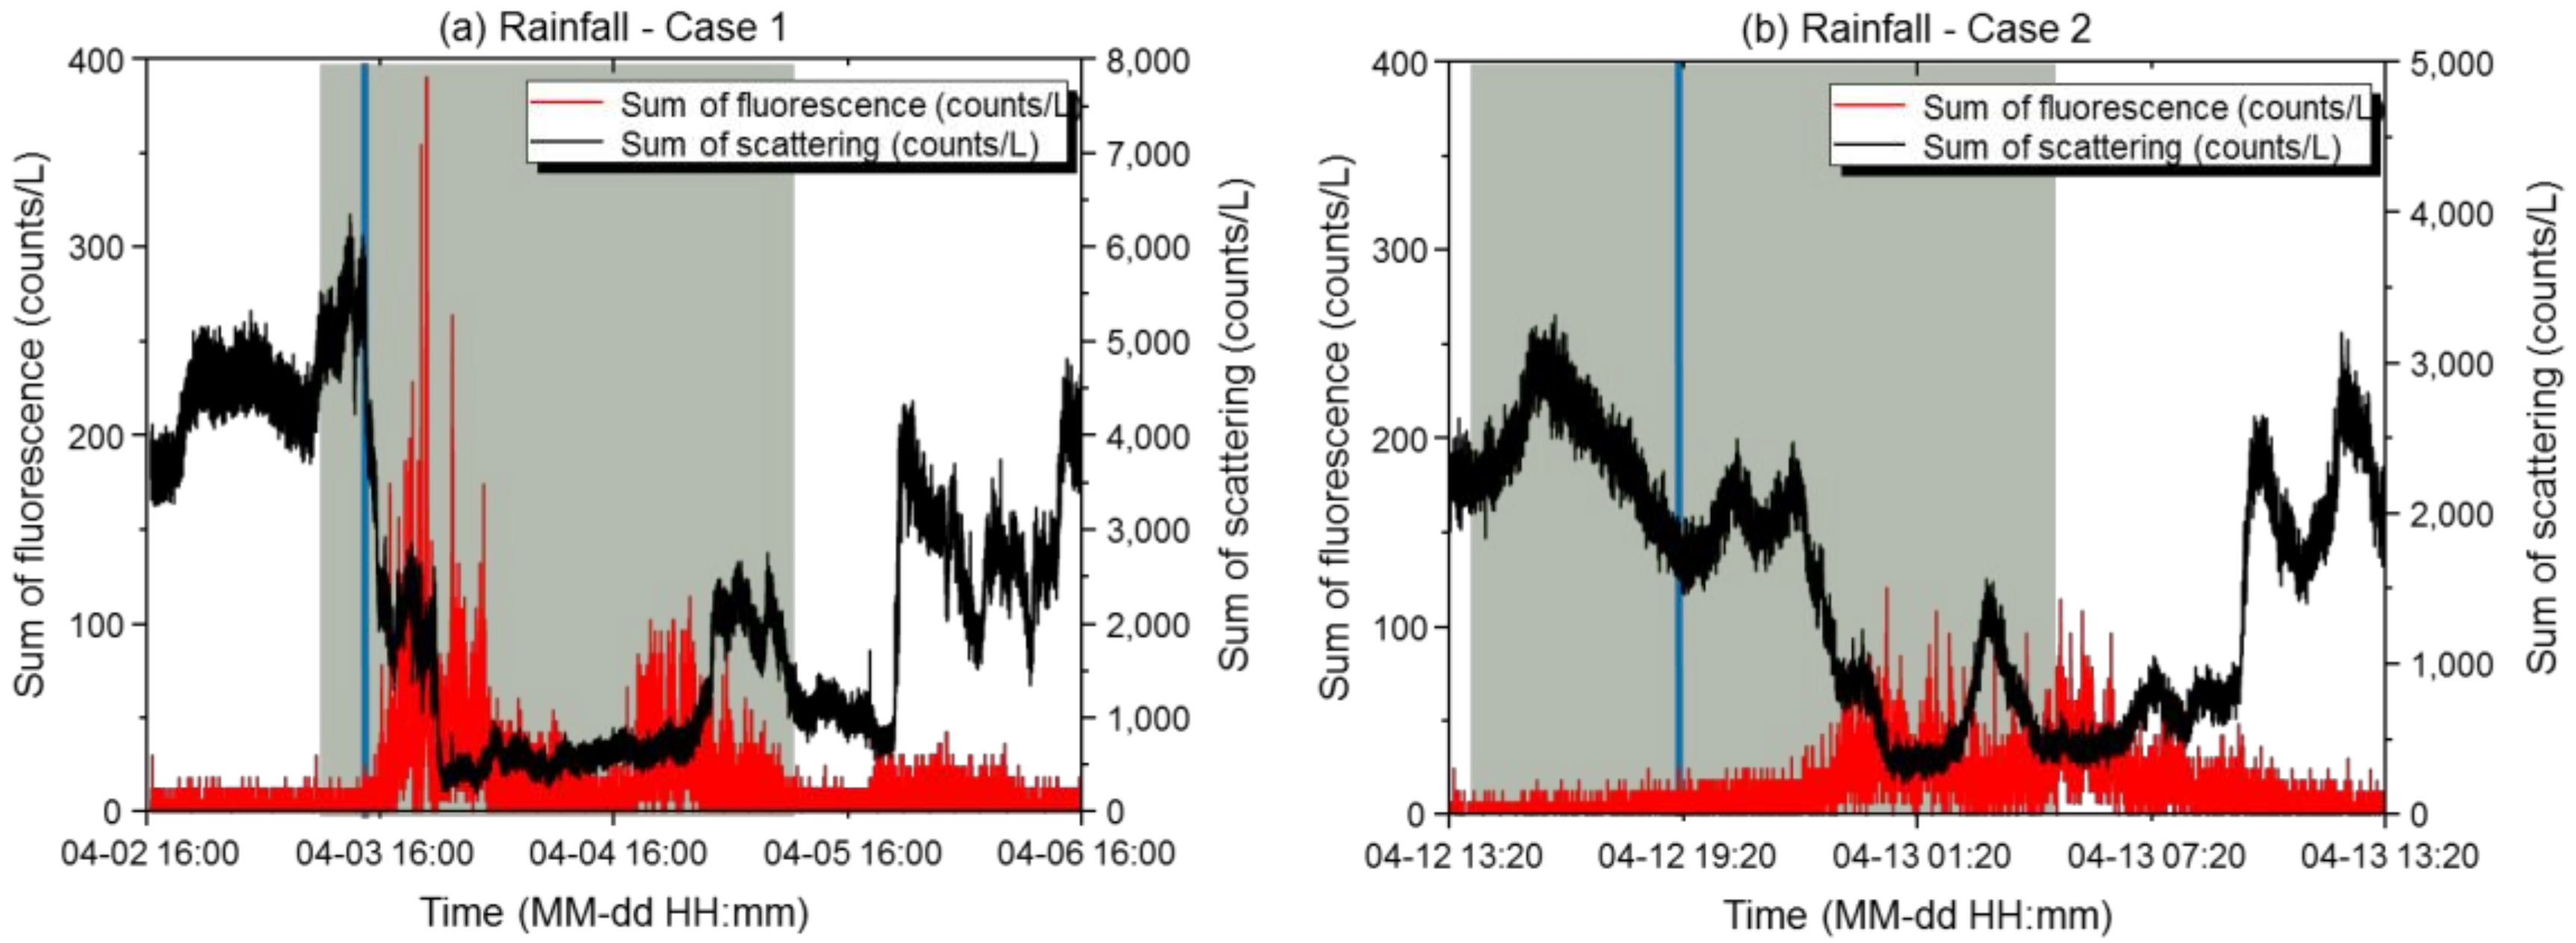
3.1.1. Rainfall
3.1.2. Snow
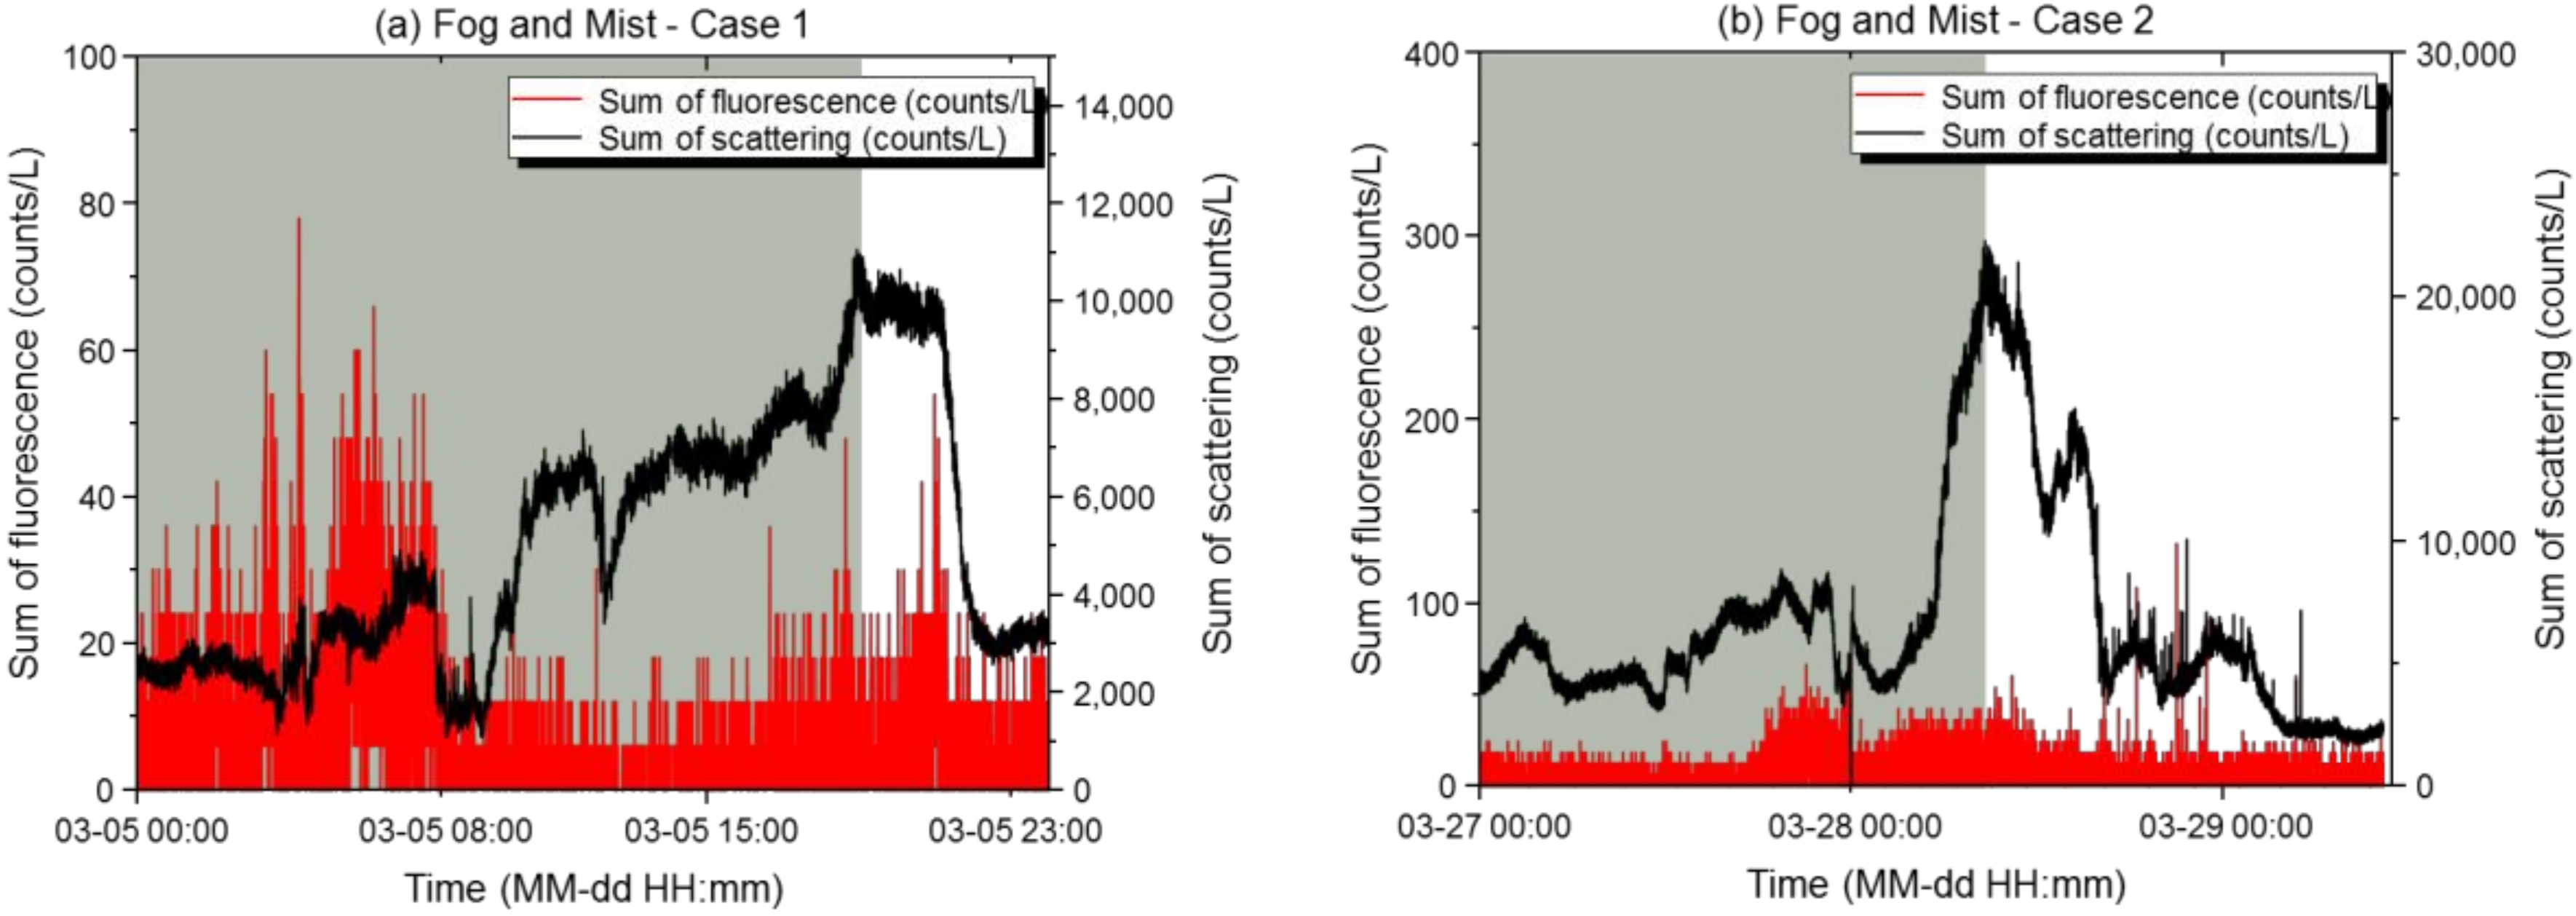
3.1.3. Fog and Mist
3.1.4. Asian Dust (Yellow Dust)
3.1.5. Water Waves
3.2. Optimizing the Sensitivity of the Biological Particle Detector
- The threshold value for the fluorescence index was determined according to the scattered light and fluorescence sums of the final background data. Based on the scattered light sum range, the reference variable for the fluorescence index of the lowest concentration was changed to x ≤ 1000, as follows: x ≤ 500, 500 < x ≤ 2000, 2000 < x ≤ 6000, and 6000 < x ≤ 10,000. Because the reference variable for the scattered light sum was changed to encompass a larger range, the fluorescence index in a very clean environment was judged more conservatively to reduce false alarms.
- As the most important variable in the alarm, the fluorescence index is set to compare the sum of fluorescence (biological particles) with the scattered light sum. When changing the reference variable of the scattered light sum, the fluorescence index was also newly determined. Based on the range of each of the five levels, the fluorescence index was set at 0.016, 0.0032, 0.001, 0.0005, and 0.0002. It was set to a higher value than before to reduce false alarms, which was intended to minimize false alarms in a normal environment. The alarm rate was learned by setting different fluorescence indexes (compared to the reference variable) for the scattered light sum obtained with 6300 h of data measurements by the biological particle detector during the experiment, reflecting the characteristics of particles in various environments. The sensitivity of the biological particle detector was developed to ensure flexible adjustments through the same process for a new atmospheric environment.
- With the algorithm, the criteria for assigning scattered light and fluorescence weights were set as follows. The weight was added to the relative concentration, initial alarm criteria, and compared with the set value for the relative concentration, initial alarm criteria. If the calculated value exceeded the set criteria, then an alarm was issued. Thereafter, the existence of biological particles was determined based on several variables, and in particular, false detections were prevented by checking whether the atmospheric particle state contained a certain level of fluorescence through the above-described fluorescence index criteria. The optimized value allowed the size that previously only received a weight of −1 to obtain a weight of −1 to −0.5. Furthermore, each reference value was set to have a higher reference value as the scattered light sum decreased. Therefore, when the scattered light range was x ≤ 30 or the fluorescence range was x ≤ 1, a weight of −1 was assigned. When the scattered light range was 0 < x < 2000 or the fluorescence range was 1 < x < 5, a weight of −0.5 was assigned. When the scattered light range was x ≥ 2000 or the fluorescence range was x ≥ 5, a weight of 0 was assigned. In the low range of the scattered light sum, an alarm could be issued even with a small number of biological particles, enabling the detector to be operated even in special situations, such as rain. Through this process, the optimized detection algorithm did not simply count biological particles, but converted the acquired signals into several variables and used them in a complex way to determine the presence or absence of biological particles.
- As the confidence interval was widened by changing the relative concentration reliability from 80% to 90%, the wider confidence intervals included the population mean to prevent the number of effective biological particles from exceeding the upper limit, thereby reducing false alarms.
4. Conclusions
Author Contributions
Funding
Institutional Review Board Statement
Informed Consent Statement
Data Availability Statement
Acknowledgments
Conflicts of Interest
References
- Gollakota, A.R.K.; Guatam, S.; Santosh, M.; Sudan, H.A.; Gandhi, R.; Jebadurai, V.S.; Shu, C.M. Bioaerosols: Characterization, pathways, sampling strategies, and challenges to geo-environment and health. Gondwana Res. 2021, 99, 178–203. [Google Scholar] [CrossRef]
- Primmerman, C.A. Detection of biological agents. Lincoln Lab. J. 2000, 12, 3–32. [Google Scholar]
- Roffey, R.; Lantorp, K.; Tegnell, A.; Elgh, F. Biological weapons and bioterrorism preparedness: Importance of public-health awareness and international cooperation. Clin. Microbiol. Infect. 2002, 8, 522–528. [Google Scholar] [CrossRef] [PubMed] [Green Version]
- Park, J.S.; Moon, K.J.; Park, S.M.; Song, I.H.; Kim, H.J.; Hong, Y.D.; Han, J.S. Possibility of the PM-10 and PM-2.5 concentration monitoring system using SMPS-APS combination. J. Kor. Soc. Environ. Anal. 2014, 17, 161–172. [Google Scholar]
- Choo, G.H.; Lee, K.; Seo, J.; Kim, S.Y.; Lee, D.W.; Shin, H.J. Optical and chemical properties of long-range transported aerosols using satellite and ground-based observations over Seoul, South Korea. Atmos. Environ. 2021, 246, 118024. [Google Scholar] [CrossRef]
- Choi, Y.; Ghim, Y.S.; Rozenhaimer, M.S.; Redemann, J.; LeBlanc, S.E.; Flynn, C.J.; Johnson, R.J.; Lee, Y.; Lee, T.; Park, T.; et al. Temporal and spatial variations of aerosol optical properties over the Korean peninsula during KORUS-AQ. Atmos. Environ. 2021, 254, 118301. [Google Scholar] [CrossRef]
- Khlystov, A.; Stanier, C.; Pandis, S.N. An algorithm for combining electrical mobility and aerodynamic size distributions data when measuring ambient aerosol special issue of aerosol science and technology on findings from the fine particulate matter supersites program. Aerosol Sci. Technol. 2004, 38.S1, 229–238. [Google Scholar] [CrossRef] [Green Version]
- Lee, B.U.; Jung, J.H.; Yun, S.H.; Hwang, G.B.; Bae, G.N. Application of UVAPS to real-time detection of inactivation of fungal bioaerosols due to thermal energy. J. Aerosol Sci. 2010, 41, 694–701. [Google Scholar] [CrossRef]
- Thompson, M.W.; Donnelly, J.; Grinshpum, S.A.; Juozaitis, A.; Willeke, K. Method and test system for evaluation of bioaerosol samplers. J. Aerosol Sci. 1994, 25, 1579–1593. [Google Scholar] [CrossRef]
- Jeong, Y.S.; Lee, J.M.; Park, J.; Chong, E.; Choi, K. Development of a real-time handheld bioaerosol monitoring system using ultraviolet-light emitting diode induced fluorescence. Instrum. Sci. Technol. 2020, 48, 417–430. [Google Scholar] [CrossRef]
- Park, J.; Jeong, Y.S.; Nam, H.; Choi, K. Signal encoder of real-time bio-aerosol counter using 280 nm UV-LED induced fluorescence. IEEE Sens. J. 2020, 20, 13471–13479. [Google Scholar] [CrossRef]
- Seo, H.; Choi, K.; Park, J. Outdoor environmental sensitivity test for the detection of biological aerosols. Instrum. Sci. Technol. 2021, 49, 642–657. [Google Scholar] [CrossRef]
- Air Korea Homepage. Available online: http://www.airkorea.or.kr/airinfo30-03-2022 (accessed on 30 March 2022).
- Joung, Y.S.; Buie, C.R. Aerosol generation by raindrop impact on soil. Nat. Commun. 2015, 6, 6083. [Google Scholar] [CrossRef] [PubMed] [Green Version]
- Elbert, W.; Taylor, P.E.; Andreae, M.O.; Pöschl, U. Contribution of fungi to primary biogenic aerosols in the atmosphere: Wet and dry discharged spores, carbohydrates, and inorganic ions. Atmos. Chem. Phys. 2007, 7, 4569–4588. [Google Scholar] [CrossRef] [Green Version]
- Ilieș, D.C.; Marcu, F.; Caciora, T.; Indrie, L.; Ilieș, A.; Albu, A.; Costea, M.; Burtă, L.; Baias, S.; Ilieș, M.; et al. Investigations of museum indoor microclimate and air quality. Case study from Romania. Atmosphere 2021, 12, 286. [Google Scholar] [CrossRef]
- Marcu, F.; Hodor, N.; Indrie, L.; Dejeu, P.; Ilieș, M.; Albu, A.; Sandor, M.; Sicora, C.; Costea, M.; Ilieș, D.C.; et al. Microbiological, health and comfort aspects of indoor air quality in a Romanian historical wooden church. Int. J. Environ. Res. Public Health 2021, 18, 9908. [Google Scholar] [CrossRef] [PubMed]
- Park, M.; Yum, S.S.; Kim, N.; Jeong, M.; Yoo, H.J.; Kim, J.E.; Park, J.; Lee, M.; Sung, M.; Ahn, J. Characterization of submicron aerosols over the Yellow Sea measured onboard the Gisang 1 research vessel in the spring of 2018 and 2019. Environ. Pollut. 2021, 284, 117180. [Google Scholar] [CrossRef] [PubMed]


| Section Title | Case Number | Measurement Period | Measurement Time (h) | Climate | Time in the Climate |
|---|---|---|---|---|---|
| 3.1.1 Rainfall | Case 1 | 2 April 2021 16:27–6 April 2021 16:01 | 96 | Heavy rain (maximum 5 mm) | 3 April 2021 10:00–4 April 2021 09:00, Maximum rainfall at 15:00 |
| Case 2 | 12 April 2021 13:20–13 April 2021 13:52 | 26 | Light rain (maximum 3.4 mm) | 12 April 2021 13:00–13 April 2021 05:00, Maximum rainfall at 19:00 | |
| 3.1.2 Snowfall | Case 1 | 2 January 2021 21:00–11 January 2021 12:00 | 112 | Heavy snow (maximum 7.6 cm) | 6 January 2021 22:00–11 January 2021 12:00, Maximum snowfall at 7 January 2021 04:00 |
| Case 2 | 16 February 2021 14:06–18 February 2021 13:26 | 71 | Light snow (maximum 5.7 cm) | 16 February 2021 14:00–18 February 2021 13:00, Maximum snowfall at 16 February 2021 16:00 | |
| 3.1.3 Fog and mist | Case 1 | 5 March 2021 00:00–23:59 | 24 | Morning fog and mist | 5 March 2021 00:00–19:00 |
| Case 2 | 27 March 2021 00:00–29 March 2021 10:16 | 58 | Afternoon fog and mist | 27 March 2021 14:00–28 March 2021 09:00 | |
| 3.1.4 Asian dust | Case 1 | 29 March 2021 00:00–30 March 2021 23:59 | 48 | Asian dust warning (PM10 maintained above 800 μg/m3 for 2 h) | 29 March 2021 00:00–30 March 2021 23:59 |
| 3.1.5 Water wave | Case 1 | 12 May 2021 14:23–14:53 | 0.5 | Light wave | 12 May 2021 14:23–14:53 |
| Abbreviation: PM10: particles with diameters less than 10 µm | |||||
Publisher’s Note: MDPI stays neutral with regard to jurisdictional claims in published maps and institutional affiliations. |
© 2022 by the authors. Licensee MDPI, Basel, Switzerland. This article is an open access article distributed under the terms and conditions of the Creative Commons Attribution (CC BY) license (https://creativecommons.org/licenses/by/4.0/).
Share and Cite
Seo, H.; Choi, K.; Jeong, Y.-S. Optimizing the Sensitivity of Biological Particle Detectors through Atmospheric Particle Analysis According to Climatic Characteristics in South Korea. Sensors 2022, 22, 3374. https://0-doi-org.brum.beds.ac.uk/10.3390/s22093374
Seo H, Choi K, Jeong Y-S. Optimizing the Sensitivity of Biological Particle Detectors through Atmospheric Particle Analysis According to Climatic Characteristics in South Korea. Sensors. 2022; 22(9):3374. https://0-doi-org.brum.beds.ac.uk/10.3390/s22093374
Chicago/Turabian StyleSeo, Hyunsoo, Kibong Choi, and Young-Su Jeong. 2022. "Optimizing the Sensitivity of Biological Particle Detectors through Atmospheric Particle Analysis According to Climatic Characteristics in South Korea" Sensors 22, no. 9: 3374. https://0-doi-org.brum.beds.ac.uk/10.3390/s22093374