
The Problem of Monitoring Activities of Older People in Multi-Resident Scenarios: An Innovative and Non-Invasive Measurement System Based on Wearables and PIR Sensors


Abstract
:1. Introduction
- -
- -
- Tag-based [8,9,10,11,12,13,14]: they use portable devices that provide a unique identifier (ID) to the wearer. These devices use different communication technologies such as Wi-Fi, Radio Frequency Identification (RFID), Bluetooth Low Energy (BLE) and ZigBee. Scanners placed in different areas of the house that listen for broadcast packets are needed to locate the tags and the individuals.
- -
- Signature-based [12,15,16,17,18,19,20]: they use different types of sensors such as microphones, passive infrared (PIR) motion sensors, ultrasound, and ultra-wideband (UWB) to generate a unique signature for the resident. The main drawback of this approach is the accuracy and dependence on the environment in which it is used.
2. Related Work
3. Materials and Methods
3.1. System Architecture and Sensor Integration
3.2. Resident Detection and Identification
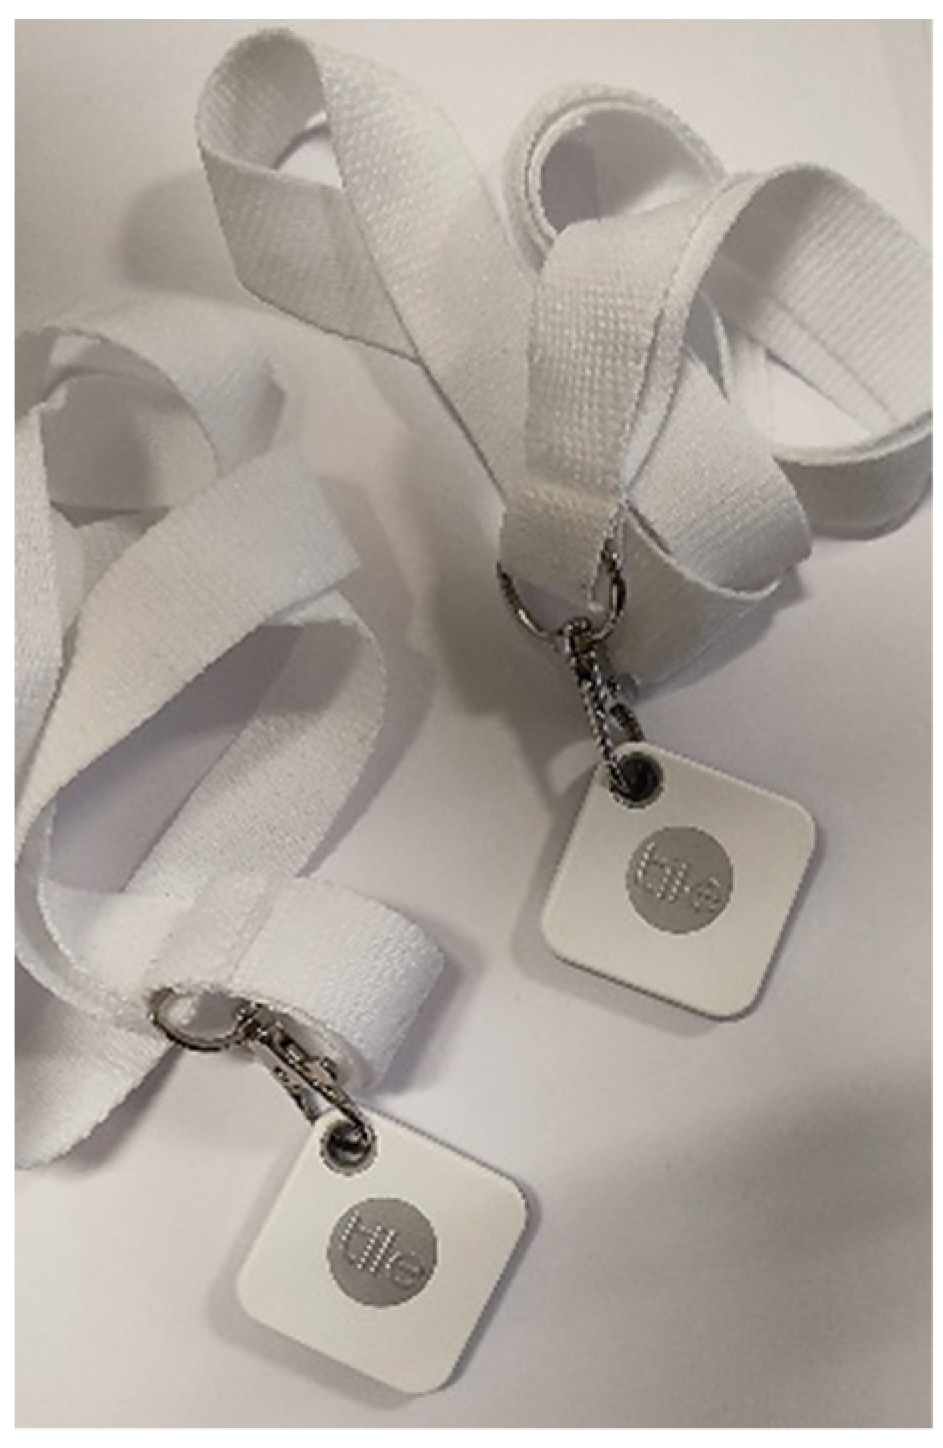
- Each resident of the home wears a tag that identifies them through a unique identifier (ID), which consists of the MAC address of the tag.
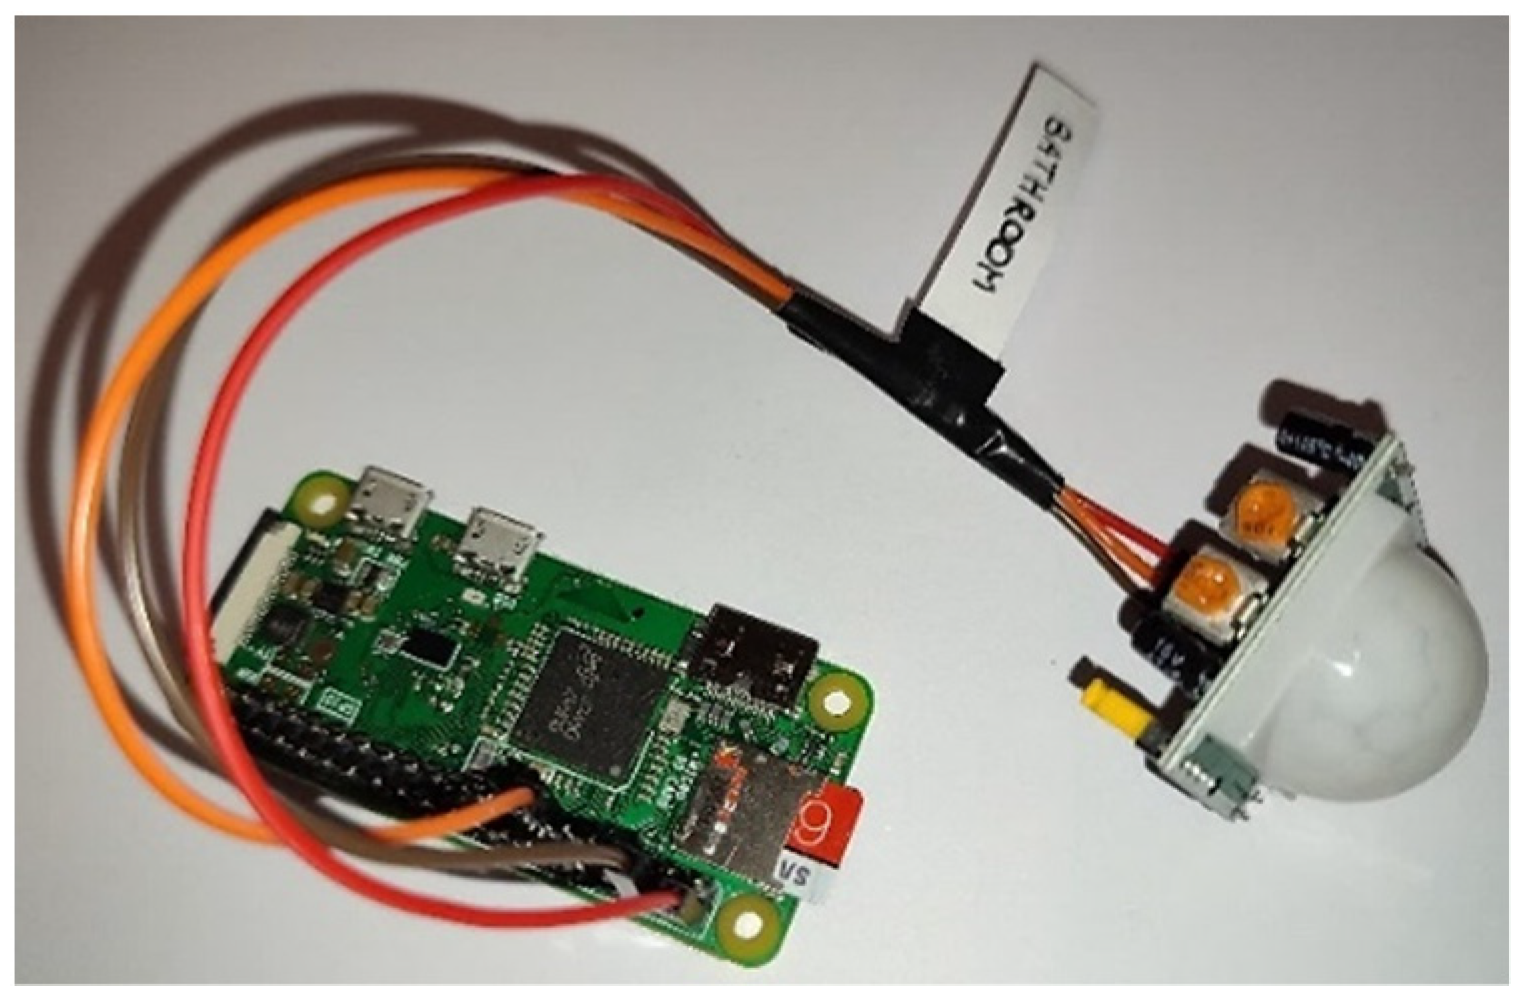
- When a PIR motion sensor is triggered by a resident’s movement, the Raspberry Pi Zero W connected to it scans the surrounding area searching for devices that emit BLE signals: the system is set to detect only the BLE signal of tags worn by residents.
- The BLE RSSI of the tags in the detection area are measured.
- To identify the resident who activated the PIR sensor, the measured RSSIs are converted into distances (in meters). The presence in the room is thus assigned to the residents in the detection area of the PIR sensor.
- 5.
- The system, meanwhile, stores the collected data in real-time in the online Google spreadsheet for further analysis. Each time the system detects a movement, it stores the identity of the resident (anonymously called “Resident 1” and “Resident 2”), the time of the event, and its location (the room in the house where motion is detected).
- 6.
- These data are then processed to obtain residents’ AL and habits using the metrics defined in Section 4.
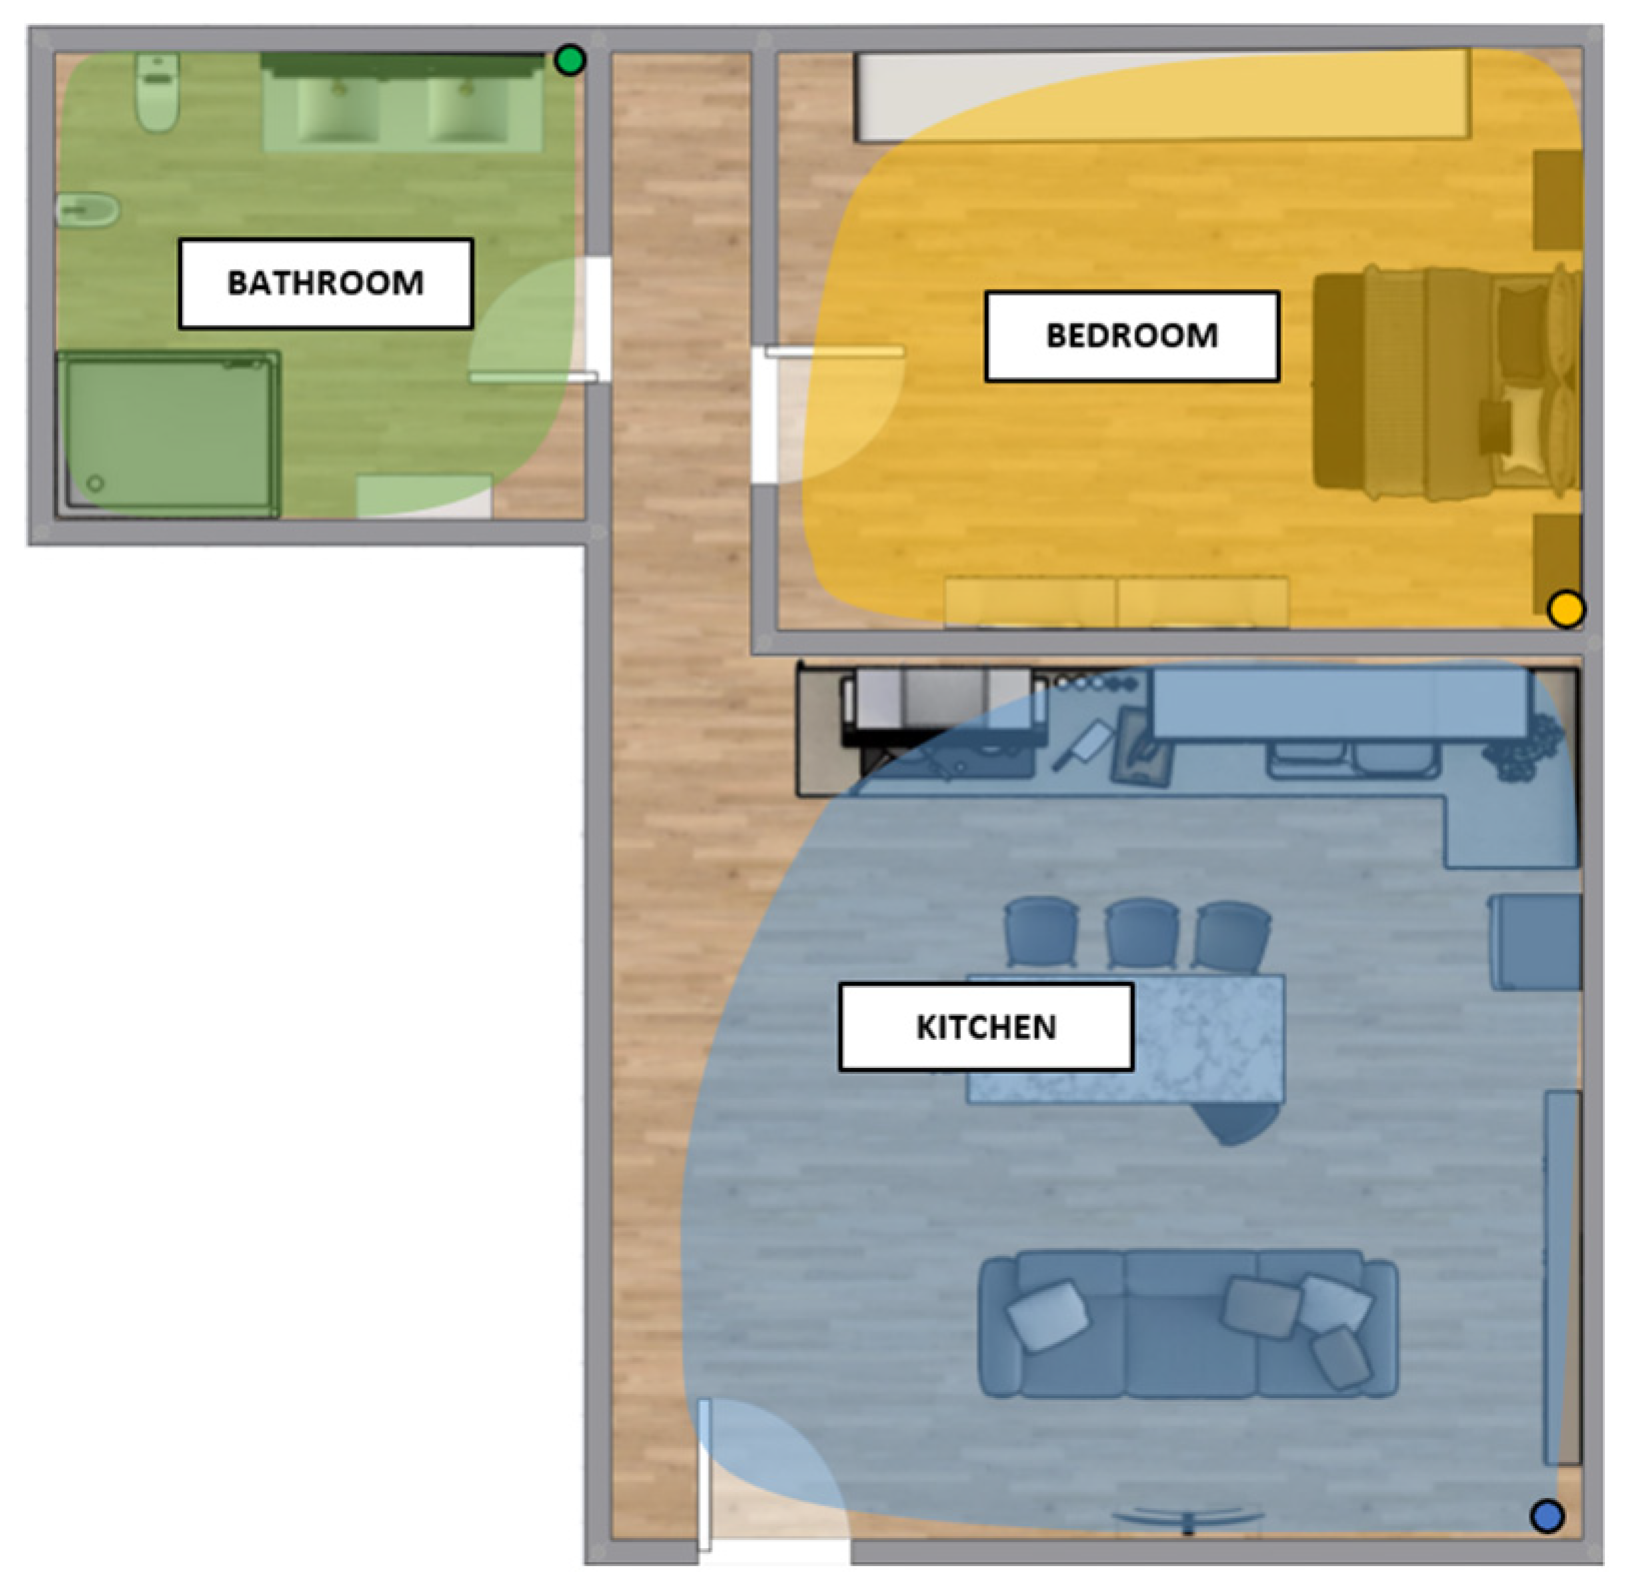
3.3. PIR Sensors Deployment
- Once the rooms of the house in which to monitor the residents have been identified, the PIR sensors should be installed in such a way as to cover the entire area. Therefore, it is important to know, in addition to the detection range of the PIR sensor, the dimensions of each room to evaluate the number of sensors needed to cover them.
- PIR sensors should be installed avoiding overlapping detection areas to prevent more than one sensor from detecting the movement of a resident, thus creating false events.
- It is preferable to install the PIR sensors at a minimum height of 1.5 m from the ground to better detect residents’ movements.
- It is preferable to avoid installing the PIR sensors near doors or leaves so that they are not obscured by them.
4. Activity Level and Habits Assessment
4.1. Daily Activity Level
4.2. Daily Habits
5. Test Phases
5.1. Movement Detection
5.2. Residents Discrimination
5.3. Real Multi-Resident Scenario
6. Results
6.1. Accuracy in Movement Detection
6.2. Accuracy in Residents Discrimination
6.3. Real Multi-Resident Scenario Test
7. Discussion
8. Conclusions
Author Contributions
Funding
Institutional Review Board Statement
Informed Consent Statement
Data Availability Statement
Acknowledgments
Conflicts of Interest
References
- Miller, K. Smart-Home Technologies to Assist Older People to Live Well at Home. Aging Sci 2013, 1, 1–9. [Google Scholar] [CrossRef] [Green Version]
- Al-Shaqi, R.; Mourshed, M.; Rezgui, Y. Progress in Ambient Assisted Systems for Independent Living by the Elderly. SpringerPlus 2016, 5, 624. [Google Scholar] [CrossRef] [PubMed] [Green Version]
- Pham, Q.C.; Dhome, Y.; Gond, L.; Sayd, P. Video Monitoring of Vulnerable People in Home Environment. In Proceedings of the Smart Homes and Health Telematics: 6th International Conference, Ames, IA, USA, 28 June–2 July 2008; Helal, S., Mitra, S., Wong, J., Chang, C.K., Mokhtari, M., Eds.; Springer: Berlin/Heidelberg, Germany, 2008; pp. 90–98. [Google Scholar]
- Ayers, D.; Shah, M. Monitoring Human Behavior from Video Taken in an Office Environment. Image Vis. Comput. 2001, 19, 833–846. [Google Scholar] [CrossRef]
- Cardinaux, F.; Bhowmik, D.; Abhayaratne, C.; Hawley, M.S. Video Based Technology for Ambient Assisted Living: A Review of the Literature. J. Ambient. Intell. Smart Environ. 2011, 3, 253–269. [Google Scholar] [CrossRef] [Green Version]
- Nasution, A.H.; Emmanuel, S. Intelligent Video Surveillance for Monitoring Elderly in Home Environments. In Proceedings of the 2007 IEEE 9th Workshop on Multimedia Signal Processing, Chania, Crete, Greece, 1–3 October 2007; pp. 203–206. [Google Scholar]
- Tang, Y.; Ma, B.; Yan, H. Intelligent Video Surveillance System for Elderly People Living Alone Based on ODVS. 2013, 3, 44–52. Adv. Internet Things 2013, 3, 44–52. [Google Scholar] [CrossRef]
- Joshi, G.P.; Acharya, S.; Kim, C.S.; Kim, B.S.; Kim, S.W. Smart Solutions in Elderly Care Facilities with RFID System and Its Integration with Wireless Sensor Networks. Int. J. Distrib. Sens. Netw. 2014, 10, 713946. [Google Scholar] [CrossRef] [Green Version]
- Kim, S.C.; Jeong, Y.S.; Park, S.O. RFID-Based Indoor Location Tracking to Ensure the Safety of the Elderly in Smart Home Environments. Pers. Ubiquit. Comput. 2013, 17, 1699–1707. [Google Scholar] [CrossRef]
- Yao, W.; Chu, C.H.; Li, Z. The Adoption and Implementation of RFID Technologies in Healthcare: A Literature Review. J. Med. Syst. 2012, 36, 3507–3525. [Google Scholar] [CrossRef]
- Zhang, B. Health Care Applications Based on ZigBee Standard. In Proceedings of the 2010 International Conference on Computer Design and Applications, Qinhuangdao, China, 25–27 June 2010; Volume 1, pp. 1–608. [Google Scholar]
- Kolakowski, J.; Djaja-Josko, V.; Kolakowski, M.; Broczek, K. UWB/BLE Tracking System for Elderly People Monitoring. Sensors 2020, 20, 1574. [Google Scholar] [CrossRef] [Green Version]
- Chaari Fourati, L.; Said, S. Remote Health Monitoring Systems Based on Bluetooth Low Energy (BLE) Communication Systems. In Proceedings of the Impact of Digital Technologies on Public Health in Developed and Developing Countries, Hammamet, Tunisia, 24–26 June 2020; Jmaiel, M., Mokhtari, M., Abdulrazak, B., Aloulou, H., Kallel, S., Eds.; Springer International Publishing: Cham, Switzerland, 2020; pp. 41–54. [Google Scholar]
- Montoliu, R.; Sansano, E.; Gascó, A.; Belmonte, O.; Caballer, A. Indoor Positioning for Monitoring Older Adults at Home: Wi-Fi and BLE Technologies in Real Scenarios. Electronics 2020, 9, 728. [Google Scholar] [CrossRef]
- Mokhtari, G.; Zhang, Q.; Nourbakhsh, G.; Ball, S.; Karunanithi, M. BLUESOUND: A New Resident Identification Sensor—Using Ultrasound Array and BLE Technology for Smart Home Platform. IEEE Sens. J. 2017, 17, 1503–1512. [Google Scholar] [CrossRef]
- Kaushik, A.R.; Lovell, N.H.; Celler, B.G. Evaluation of PIR Detector Characteristics for Monitoring Occupancy Patterns of Elderly People Living Alone at Home. In Proceedings of the 2007 29th Annual International Conference of the IEEE Engineering in Medicine and Biology Society, Lyon, France, 23–26 August 2007; pp. 3802–3805. [Google Scholar]
- O’Brien, A.; McDaid, K.; Loane, J.; Doyle, J.; O’Mullane, B. Visualisation of Movement of Older Adults within Their Homes Based on PIR Sensor Data. In Proceedings of the 2012 6th International Conference on Pervasive Computing Technologies for Healthcare (PervasiveHealth) and Workshops, San Diego, CA, USA, 21–24 May 2012; pp. 252–259. [Google Scholar]
- Kaushik, A.R.; Celler, B.G. Characterization of PIR Detector for Monitoring Occupancy Patterns and Functional Health Status of Elderly People Living Alone at Home. Technol. Health Care 2007, 15, 273–288. [Google Scholar] [CrossRef]
- Djaja-Josko, V.; Kolakowski, J. UWB Positioning System for Elderly Persons Monitoring. In Proceedings of the 2015 23rd Telecommunications Forum Telfor (TELFOR), Belgrade, Serbia, 24–25 November 2015; pp. 169–172. [Google Scholar]
- Kolakowski, J.; Djaja-Josko, V.; Kolakowski, M. UWB Monitoring System for AAL Applications. Sensors 2017, 17, 2092. [Google Scholar] [CrossRef] [PubMed]
- Chen, R.; Tong, Y. A Two-Stage Method for Solving Multi-Resident Activity Recognition in Smart Environments. Entropy 2014, 16, 2184–2203. [Google Scholar] [CrossRef]
- Hsu, K.C.; Chiang, Y.T.; Lin, G.Y.; Lu, C.H.; Hsu, J.Y.J.; Fu, L.C. Strategies for Inference Mechanism of Conditional Random Fields for Multiple-Resident Activity Recognition in a Smart Home. In Proceedings of the Trends in Applied Intelligent Systems, Cordoba, Spain, 1–4 June 2010; García-Pedrajas, N., Herrera, F., Fyfe, C., Benítez, J.M., Ali, M., Eds.; Springer: Berlin/Heidelberg, Germany, 2010; pp. 417–426. [Google Scholar]
- Wang, T.; Cook, D.J. SMRT: Multi-Resident Tracking in Smart Homes with Sensor Vectorization. IEEE Trans. Pattern Anal. Mach. Intell. 2021, 43, 2809–2821. [Google Scholar] [CrossRef]
- Natani, A.; Sharma, A.; Perumal, T. Sequential Neural Networks for Multi-Resident Activity Recognition in Ambient Sensing Smart Homes. Appl. Intell. 2021, 51, 6014–6028. [Google Scholar] [CrossRef]
- Tran, S.N.; Ngo, T.S.; Zhang, Q.; Karunanithi, M. Mixed-Dependency Models for Multi-Resident Activity Recognition in Smart Homes. Multimed. Tools Appl. 2020, 79, 23445–23460. [Google Scholar] [CrossRef]
- Casaccia, S.; Romeo, L.; Calvaresi, A.; Morresi, N.; Monteriù, A.; Frontoni, E.; Scalise, L.; Revel, G.M. Measurement of Users’ Well-Being Through Domotic Sensors and Machine Learning Algorithms. IEEE Sens. J. 2020, 20, 8029–8038. [Google Scholar] [CrossRef]
- Casaccia, S.; Revel, G.M.; Cosoli, G.; Scalise, L. Assessment of Domestic Well-Being: From Perception to Measurement. IEEE Instrum. Meas. Mag. 2021, 24, 58–67. [Google Scholar] [CrossRef]
- Paavilainen, P.; Korhonen, I.; Partinen, M. Telemetric Activity Monitoring as an Indicator of Long-Term Changes in Health and Well-Being of Older People. Gerontechnology 2005, 4, 77–85. [Google Scholar] [CrossRef]
- Virone, G.; Sixsmith, A. Monitoring Activity Patterns and Trends of Older Adults. In Proceedings of the 2008 30th Annual International Conference of the IEEE Engineering in Medicine and Biology Society, Vancouver, BC, Canada, 20–24 August 2008; pp. 2071–2074. [Google Scholar]
- Peetoom, K.K.B.; Lexis, M.A.S.; Joore, M.; Dirksen, C.D.; De Witte, L.P. Literature Review on Monitoring Technologies and Their Outcomes in Independently Living Elderly People. Disabil. Rehabil. Assist. Technol. 2015, 10, 271–294. [Google Scholar] [CrossRef] [PubMed]
- Scanaill, C.N.; Carew, S.; Barralon, P.; Noury, N.; Lyons, D.; Lyons, G.M. A Review of Approaches to Mobility Telemonitoring of the Elderly in Their Living Environment. Ann. Biomed. Eng. 2006, 34, 547–563. [Google Scholar] [CrossRef] [PubMed]
- Ogawa, M.; Togawa, T. Monitoring Daily Activities and Behaviors at Home by Using Brief Sensors. In Proceedings of the 1st Annual International IEEE-EMBS Special Topic Conference on Microtechnologies in Medicine and Biology, Proceedings (Cat. No.00EX451), Lyon, France, 12–14 October 2000; pp. 611–614. [Google Scholar]
- Ogawa, M.; Suzuki, R.; Otake, S.; Izutsu, T.; Iwaya, T.; Togawa, T. Long-Term Remote Behavioral Monitoring of the Elderly Using Sensors Installed in Domestic Houses. In Proceedings of the Second Joint 24th Annual Conference and the Annual Fall Meeting of the Biomedical Engineering Society—Engineering in Medicine and Biology, Houston, TX, USA, 23–26 October 2002; Volume 3, pp. 1853–1854. [Google Scholar]
- Ogawa, M.; Ochia, S.; Otsuka, K.; Togawa, T. Remote Monitoring of Daily Activities and Behaviors at Home. In Proceedings of the 2001 Conference Proceedings of the 23rd Annual International Conference of the IEEE Engineering in Medicine and Biology Society, Istanbul, Turkey, 25–28 October 2001; Volume 4, pp. 3973–3976. [Google Scholar]
- Suzuki, R.; Ogawa, M.; Otake, S.; Izutsu, T.; Tobimatsu, Y.; Izumi, S.-I.; Iwaya, T. Analysis of Activities of Daily Living in Elderly People Living Alone: Single-Subject Feasibility Study. Telemed. J. e-Health 2004, 10, 260–276. [Google Scholar] [CrossRef] [PubMed]
- Hayes, T.L.; Hagler, S.; Austin, D.; Kaye, J.; Pavel, M. Unobtrusive Assessment of Walking Speed in the Home Using Inexpensive PIR Sensors. In Proceedings of the 2009 Annual International Conference of the IEEE Engineering in Medicine and Biology Society, Hilton Minneapolis, MN, USA, 2–6 September 2009; pp. 7248–7251. [Google Scholar]
- Nef, T.; Urwyler, P.; Büchler, M.; Tarnanas, I.; Stucki, R.; Cazzoli, D.; Müri, R.; Mosimann, U. Evaluation of Three State-of-the-Art Classifiers for Recognition of Activities of Daily Living from Smart Home Ambient Data. Sensors 2015, 15, 11725–11740. [Google Scholar] [CrossRef] [PubMed] [Green Version]
- Zhang, C.; Tian, Y.; Capezuti, E. Privacy Preserving Automatic Fall Detection for Elderly Using RGBD Cameras. In Proceedings of the Computers Helping People with Special Needs, Linz, Austria, 11–13 July 2012; Miesenberger, K., Karshmer, A., Penaz, P., Zagler, W., Eds.; Springer: Berlin/Heidelberg, Germany, 2012; pp. 625–633. [Google Scholar]
- Zouba, N.; Bremond, F.; Thonnat, M. Multisensor Fusion for Monitoring Elderly Activities at Home. In Proceedings of the 2009 Sixth IEEE International Conference on Advanced Video and Signal Based Surveillance, Genova, Italy, 2–4 September 2009; pp. 98–103. [Google Scholar]
- Anitha, G.; Baghavathi Priya, S. Posture Based Health Monitoring and Unusual Behavior Recognition System for Elderly Using Dynamic Bayesian Network. Cluster Comput. 2019, 22, 13583–13590. [Google Scholar] [CrossRef]
- Tudor-Locke, C.; Hart, T.L.; Washington, T.L. Expected Values for Pedometer-Determined Physical Activity in Older Populations. Int. J. Behav. Nutr. Phys. Act. 2009, 6, 59. [Google Scholar] [CrossRef] [Green Version]
- Cavanaugh, J.T.; Coleman, K.L.; Gaines, J.M.; Laing, L.; Morey, M.C. Using Step Activity Monitoring to Characterize Ambulatory Activity in Community-Dwelling Older Adults. J. Am. Geriatr. Soc. 2007, 55, 120–124. [Google Scholar] [CrossRef]
- McMurdo, M.E.T.; Sugden, J.; Argo, I.; Boyle, P.; Johnston, D.W.; Sniehotta, F.F.; Donnan, P.T. Do Pedometers Increase Physical Activity in Sedentary Older Women? A Randomized Controlled Trial. J. Am. Geriatr. Soc. 2010, 58, 2099–2106. [Google Scholar] [CrossRef]
- Cheung, V.H.; Gray, L.; Karunanithi, M. Review of Accelerometry for Determining Daily Activity Among Elderly Patients. Arch. Phys. Med. Rehabil. 2011, 92, 998–1014. [Google Scholar] [CrossRef]
- Harris, T.J.; Owen, C.G.; Victor, C.R.; Adams, R.; Cook, D.G. What Factors Are Associated with Physical Activity in Older People, Assessed Objectively by Accelerometry? Br. J. Sports Med. 2009, 43, 442–450. [Google Scholar] [CrossRef]
- Hansen, B.H.; Kolle, E.; Dyrstad, S.M.; Holme, I.; Anderssen, S.A. Accelerometer-Determined Physical Activity in Adults and Older People. Med. Sci. Sports Exerc. 2012, 44, 266–272. [Google Scholar] [CrossRef] [PubMed]
- Garatachea, N. Physical Activity and Energy Expenditure Measurements Using Accelerometers in Older Adults. Nutr. Hosp. 2010, 25, 224–230. [Google Scholar] [CrossRef] [PubMed]
- Berlin, J.E.; Storti, K.L.; Brach, J.S. Using Activity Monitors to Measure Physical Activity in Free-Living Conditions. Phys. Ther. 2006, 86, 1137–1145. [Google Scholar] [CrossRef] [PubMed] [Green Version]
- McClain, J.J.; Sisson, S.B.; Tudor-Locke, C. Actigraph Accelerometer Interinstrument Reliability during Free-Living in Adults. Med. Sci. Sports Exerc. 2007, 39, 1509–1514. [Google Scholar] [CrossRef] [PubMed]
- Matthew, C.E. Calibration of Accelerometer Output for Adults. Med. Sci. Sports Exerc. 2005, 37, S512–S522. [Google Scholar] [CrossRef]
- Casaccia, S.; Naccarelli, R.; Moccia, S.; Migliorelli, L.; Frontoni, E.; Revel, G.M. Development of a Measurement Setup to Detect the Level of Physical Activity and Social Distancing of Ageing People in a Social Garden during COVID-19 Pandemic. Measurement 2021, 184, 109946. [Google Scholar] [CrossRef]
- Offermann, J.; Wilkowska, W.; Poli, A.; Spinsante, S.; Ziefle, M. Acceptance and Preferences of Using Ambient Sensor-Based Lifelogging Technologies in Home Environments. Sensors 2021, 21, 8297. [Google Scholar] [CrossRef]
- Shirali, M.; Bayo Montón, J.; Fernandez-Llatas, C.; Ghassemian, M.; Traver, V. Design and Evaluation of a Solo-Resident Smart Home Testbed for Mobility Pattern Monitoring and Behavioural Assessment. Sensors 2020, 20, 7167. [Google Scholar] [CrossRef]
- Wang, S.; Skubic, M.; Zhu, Y. Activity Density Map Visualization and Dissimilarity Comparison for Eldercare Monitoring. IEEE Trans. Inf. Technol. Biomed. 2012, 16, 607–614. [Google Scholar] [CrossRef]
- Alberdi Aramendi, A.; Weakley, A.; Aztiria Goenaga, A.; Schmitter-Edgecombe, M.; Cook, D.J. Automatic Assessment of Functional Health Decline in Older Adults Based on Smart Home Data. J. Biomed. Inform. 2018, 81, 119–130. [Google Scholar] [CrossRef]
- Sprint, G.; Cook, D.J.; Schmitter-Edgecombe, M. Unsupervised Detection and Analysis of Changes in Everyday Physical Activity Data. In Advances in Biomedical Informatics; Holmes, D.E., Jain, L.C., Eds.; Intelligent Systems Reference Library; Springer International Publishing: Cham, Switzerland, 2018; pp. 97–122. [Google Scholar]
- Ali, M.U.; Hur, S.; Park, Y. Wi-Fi-Based Effortless Indoor Positioning System Using IoT Sensors. Sensors 2019, 19, 1496. [Google Scholar] [CrossRef] [PubMed] [Green Version]
- Roy, N.; Misra, A.; Cook, D. Ambient and Smartphone Sensor Assisted ADL Recognition in Multi-Inhabitant Smart Environments. J. Ambient. Intell. Humaniz. Comput. 2016, 7, 1–19. [Google Scholar] [CrossRef] [PubMed] [Green Version]
- Bianchi, V.; Ciampolini, P.; De Munari, I. RSSI-Based Indoor Localization and Identification for ZigBee Wireless Sensor Networks in Smart Homes. IEEE Trans. Instrum. Meas. 2019, 68, 566–575. [Google Scholar] [CrossRef]
- Ni, L.M.; Liu, Y.; Lau, Y.C.; Patil, A.P. LANDMARC: Indoor Location Sensing Using Active RFID. In Proceedings of the First IEEE International Conference on Pervasive Computing and Communications ((PerCom 2003), Fort Worth, TX, USA, 26 March 2003; pp. 407–415. [Google Scholar]
- Ma, Y.; Selby, N.; Adib, F. Minding the Billions: Ultra-Wideband Localization for Deployed RFID Tags. In Proceedings of the 23rd Annual International Conference on Mobile Computing and Networking, Association for Computing Machinery, New York, NY, USA, 4 October 2017; pp. 248–260. [Google Scholar]
- Mokhtari, G.; Anvari-Moghaddam, A.; Zhang, Q.; Karunanithi, M. Multi-Residential Activity Labelling in Smart Homes with Wearable Tags Using BLE Technology. Sensors 2018, 18, 908. [Google Scholar] [CrossRef] [Green Version]
- Masciadri, A.; Carlini, I.; Comai, S.; Salice, F. Supporting Alzheimer’s Residential Care—A Novel Indoor Localization System. In Proceedings of the 15th International Joint Conference on e-Business and Telecommunications; SCITEPRESS—Science and Technology Publications, Porto, Portugal, 26–28 July 2018; pp. 272–278. [Google Scholar]
- Morita, T.; Taki, K.; Fujimoto, M.; Suwa, H.; Arakawa, Y.; Yasumoto, K. Beacon-Based Time-Spatial Recognition toward Automatic Daily Care Reporting for Nursing Homes. J. Sens. 2018, 2018, e2625195. [Google Scholar] [CrossRef] [Green Version]
- Terán, M.; Aranda, J.; Carrillo, H.; Mendez, D.; Parra, C. IoT-Based System for Indoor Location Using Bluetooth Low Energy. In Proceedings of the 2017 IEEE Colombian Conference on Communications and Computing (COLCOM), Cartagena, Colombia, 16–18 August 2017; pp. 1–6. [Google Scholar]
- Lapointe, P.; Chapron, K.; Bouchard, K.; Gaboury, S. A New Device to Track and Identify People in a Multi-Residents Context. Procedia Comput. Sci. 2020, 170, 403–410. [Google Scholar] [CrossRef]
- Komai, K.; Fujimoto, M.; Arakawa, Y.; Suwa, H.; Kashimoto, Y.; Yasumoto, K. Beacon-Based Multi-Person Activity Monitoring System for Day Care Center. In Proceedings of the 2016 IEEE International Conference on Pervasive Computing and Communication Workshops (PerCom Workshops), Sydney, Australia, 14–18 March 2016; pp. 1–6. [Google Scholar]
- Mohanapriya, M.; Lekha, J. Comparative Study between Decision Tree and Knn of Data Mining Classification Technique. J. Phys. Conf. Ser. 2018, 1142, 012011. [Google Scholar] [CrossRef]
- Rahmadani, S.; Dongoran, A.; Zarlis, M. Zakarias Comparison of Naive Bayes and Decision Tree on Feature Selection Using Genetic Algorithm for Classification Problem. J. Phys. Conf. Ser. 2018, 978, 012087. [Google Scholar] [CrossRef]


| Features | PIR Sensor (HC-SR501) |
|---|---|
| Detection range | 7 m |
| Detection angle | 120 degrees |
| Delay time | 3 s |
| Consumption | 65 mA |
| Operating voltage | 4–12 V (5 V recommended) |
| Output voltage | 3.3 V |
| Operating temperature | −15–70 °C |
| Cost | EUR 3 |
| Features | Tile Mate BLE Tag |
|---|---|
| Dimensions | 37.8 mm × 37.8 mm × 7.1 mm |
| Range | 76 m |
| Battery | Up to 3-year battery life |
| Water-resistant | Water-resistant (IP67) |
| Cost | EUR 25 |
| Features | Raspberry Pi Zero W |
|---|---|
| Communication technology | Wi-Fi 802.11 b/g/n, Bluetooth 4.1, BLE |
| CPU | Single-core 1 GHz |
| RAM | 512 MB |
| Communication ports | Mini HDMI, micro–USB OTG, micro–USB power, HAT-compatible 40-pin header, composite video and reset headers, CSI camera connector |
| Cost | EUR 25 |
| Sensor-to-Person Distance [m] | Movement | Accuracy |
|---|---|---|
| 1 | Small | 100% |
| Large | 100% | |
| 2 | Small | 80% |
| Large | 100% | |
| 3 | Small | 10% |
| Large | 80% | |
| 4 | Small | 5% |
| Large | 60% | |
| 5 | Small | 0% |
| Large | 50% | |
| 6 | Small | 0% |
| Large | 40% | |
| 7 | Small | 0% |
| Large | 25% |
| ML Algorithms | Precision [%] | Recall [%] | F1-Score [%] | Accuracy [%] |
|---|---|---|---|---|
| DT | 100 | 92 | 96 | 96 |
| SVM | 0 | 0 | 63 | 46 |
| k-NN | 53 | 100 | 70 | 53 |
| NB | 85 | 42 | 63 | 65 |
| ML Algorithms | Accuracy [%] |
|---|---|
| DT | 89 |
| SVM | 53 |
| k-NN | 85 |
| NB | 66 |
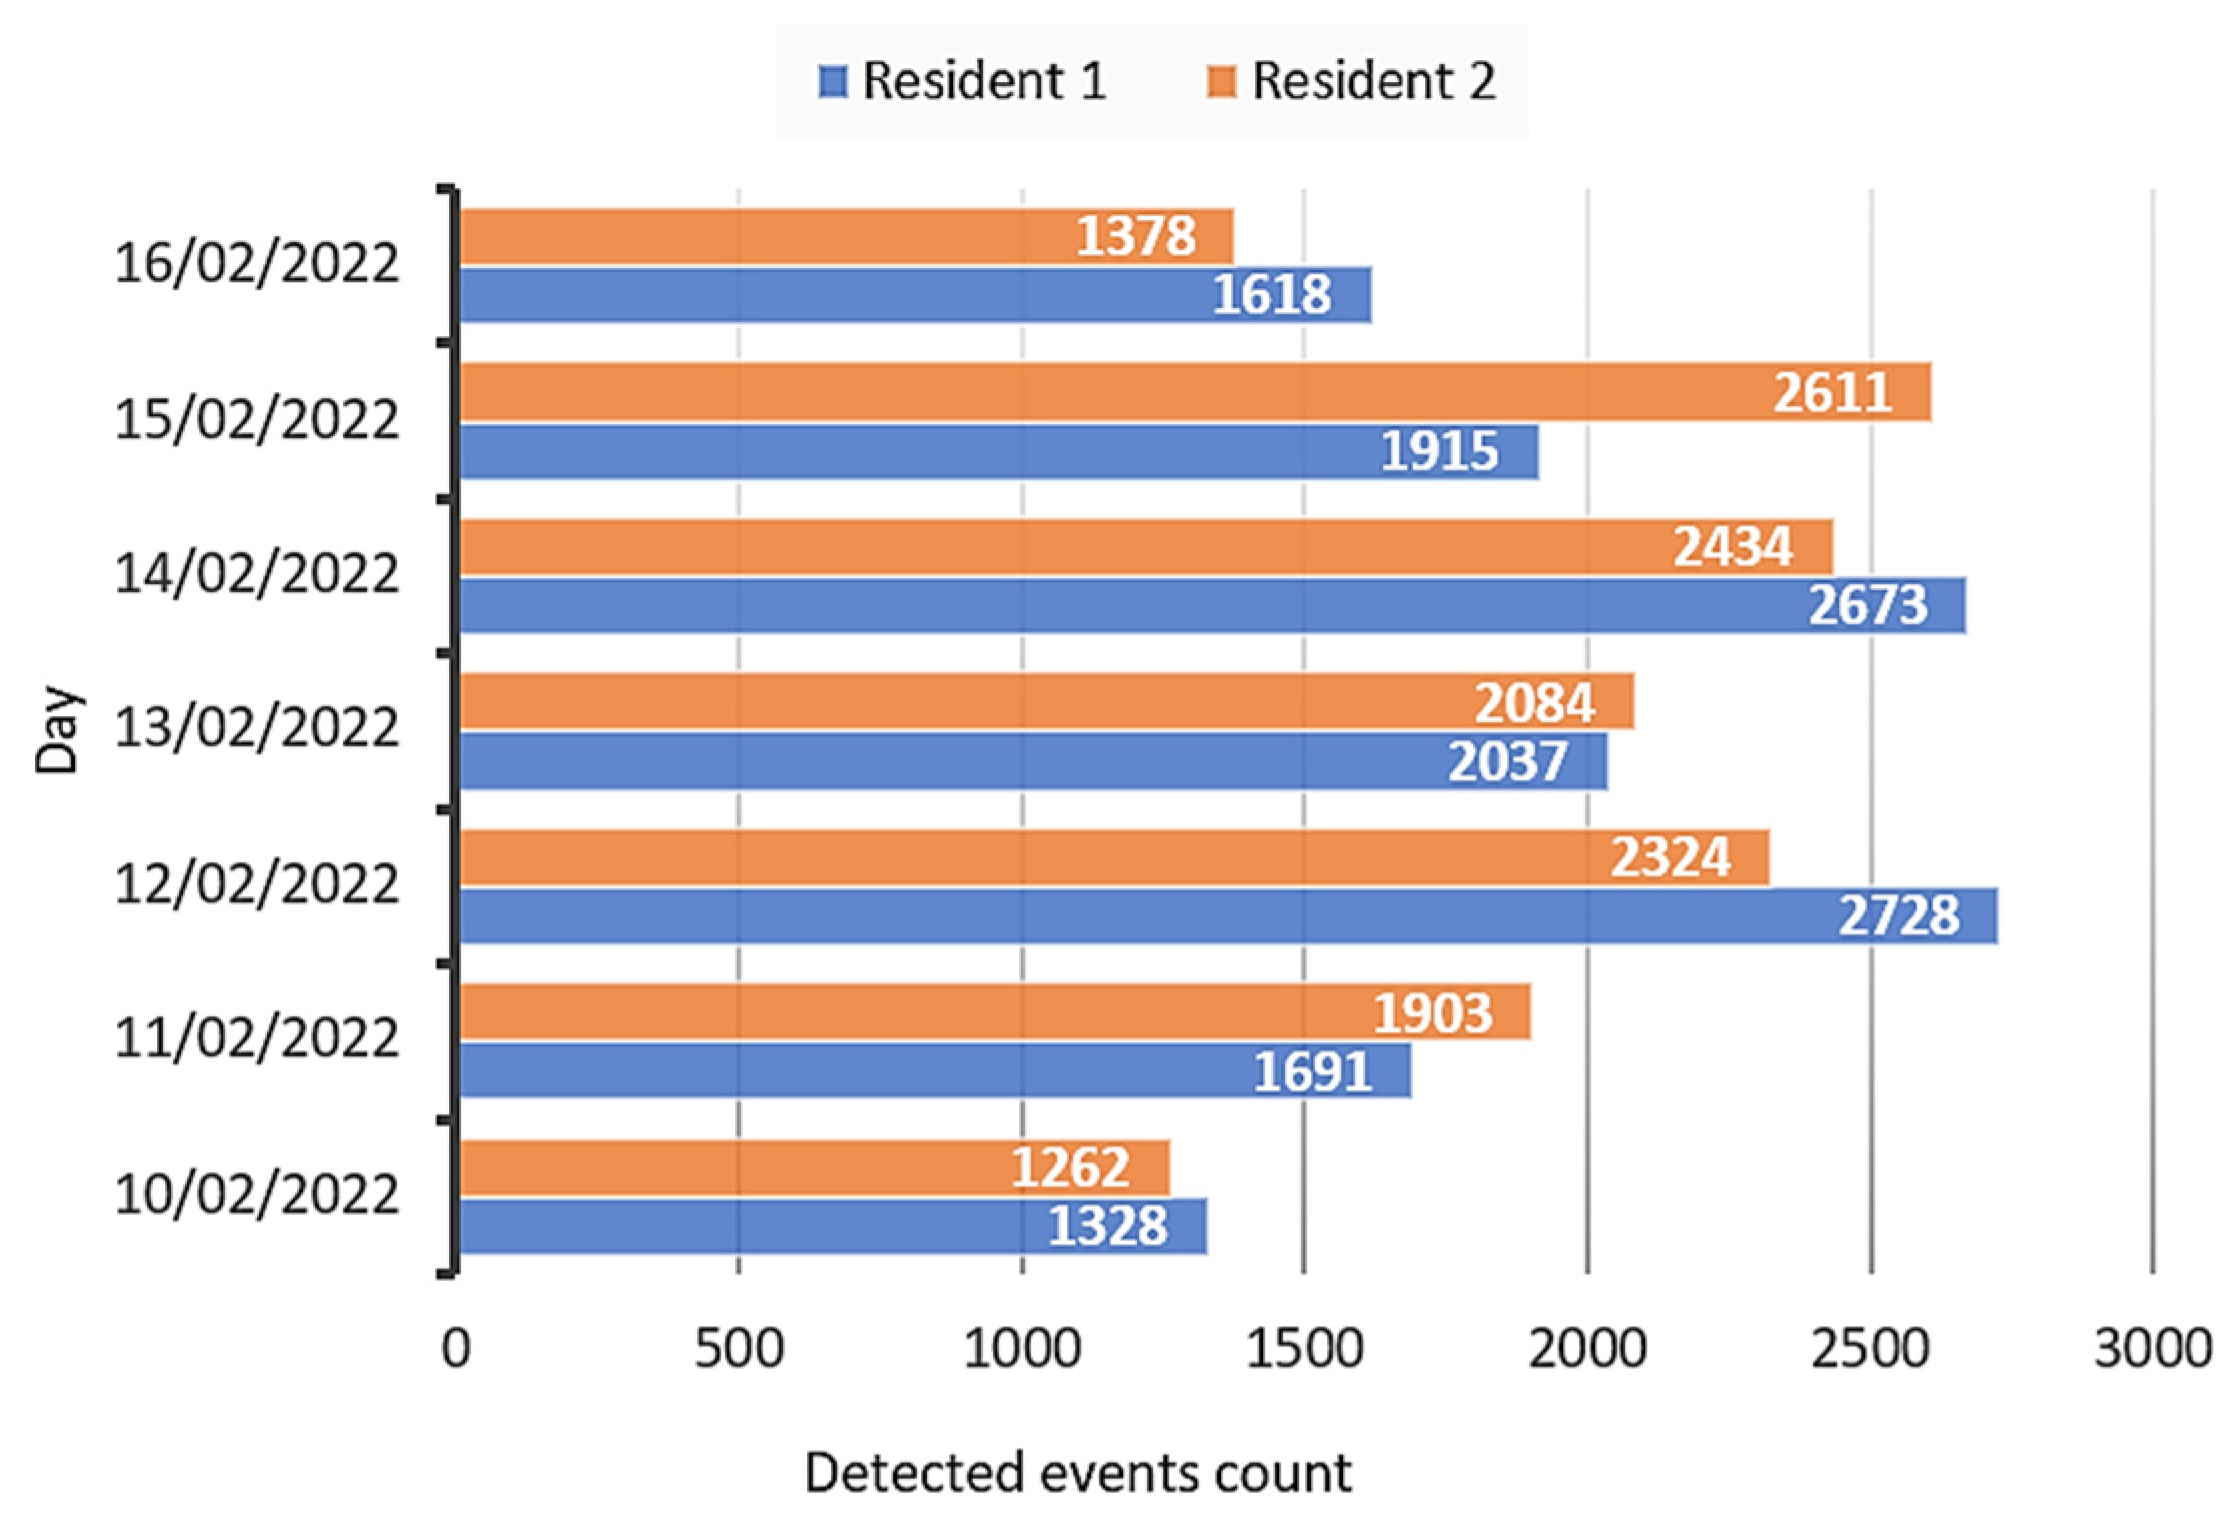
| Day | Identity | Detected Events Count | AL | DAI |
|---|---|---|---|---|
| 10 February 2022 | Resident 1 | 1328 | MAL | 2 |
| Resident 2 | 1262 | MAL | 2 | |
| 11 February 2022 | Resident 1 | 1691 | MAL | 2 |
| Resident 2 | 1903 | MAL | 2 | |
| 12 February 2022 | Resident 1 | 2728 | HAL | 3 |
| Resident 2 | 2324 | HAL | 3 | |
| 13 February 2022 | Resident 1 | 2037 | HAL | 3 |
| Resident 2 | 2084 | HAL | 3 | |
| 14 February 2022 | Resident 1 | 2673 | HAL | 3 |
| Resident 2 | 2434 | HAL | 3 | |
| 15 February 2022 | Resident 1 | 1915 | MAL | 2 |
| Resident 2 | 2611 | HAL | 3 | |
| 16 February 2022 | Resident 1 | 1618 | MAL | 2 |
| Resident 2 | 1378 | MAL | 2 |
Publisher’s Note: MDPI stays neutral with regard to jurisdictional claims in published maps and institutional affiliations. |
© 2022 by the authors. Licensee MDPI, Basel, Switzerland. This article is an open access article distributed under the terms and conditions of the Creative Commons Attribution (CC BY) license (https://creativecommons.org/licenses/by/4.0/).
Share and Cite
Naccarelli, R.; Casaccia, S.; Revel, G.M. The Problem of Monitoring Activities of Older People in Multi-Resident Scenarios: An Innovative and Non-Invasive Measurement System Based on Wearables and PIR Sensors. Sensors 2022, 22, 3472. https://0-doi-org.brum.beds.ac.uk/10.3390/s22093472
Naccarelli R, Casaccia S, Revel GM. The Problem of Monitoring Activities of Older People in Multi-Resident Scenarios: An Innovative and Non-Invasive Measurement System Based on Wearables and PIR Sensors. Sensors. 2022; 22(9):3472. https://0-doi-org.brum.beds.ac.uk/10.3390/s22093472
Chicago/Turabian StyleNaccarelli, Riccardo, Sara Casaccia, and Gian Marco Revel. 2022. "The Problem of Monitoring Activities of Older People in Multi-Resident Scenarios: An Innovative and Non-Invasive Measurement System Based on Wearables and PIR Sensors" Sensors 22, no. 9: 3472. https://0-doi-org.brum.beds.ac.uk/10.3390/s22093472