
Evaluation of Smart Sensors for Subway Electric Motor Escalators through AHP-Gaussian Method

 ,
,  ,
,
Abstract
:1. Introduction
2. Smart Sensors Application
3. Literature Review
- An initial search with the terms “Smart sensor” AND “Selection” in titles, abstracts, and keywords;
- The limitation of the search to works in English;
- The limitation of the search with keywords “MCDM”, “Smart sensors”, “Intelligent control”, “Sensors networking”, “Internet Of thing”, “Smart sensor”, “IoT”, “automation”, “Decision support system”, “Maintenance”, and “microsensors”;
- The removal of duplicate works between the two searched databases;
- The acquisition of works for complete reading;
- The complete reading of the works and a search for adherence to the current work.
4. Methodology
- (a)
- The formation of the decision matrices (m × n), Equation (1):
- (b)
- The calculation of the eigenvector (Wi), Equation (2):
- (c)
- The calculation of eigenvectors’ normalization, enabling comparability between criteria and alternatives, Equation (3):
- (d)
- The determination of the index that relates to the criteria of the consistency matrix and the criteria weights, Equation (4):
- (e)
- The determination of the consistency index (CI), Equation (5):
- (f)
- The calculation of the consistency ratio (CR), Equation (6):
Limitation of AHP-Gaussian
- Negative numbers: One limitation of the use of AHP-Gaussian is the impossibility of using parameters that present negative values. This limiting aspect needs to be considered due to the axiomatic aspects present in the model formulation [83].
- Quantitative evaluation: The AHP-Gaussian method observes data in a strictly quantitative manner. This aspect can put the decision system at risk if the data to be as used performance metrics for the alternatives are not fully representative. An alternative to this limitation is the translation of qualitative aspects into a quantitative scale; for the application of the model, however, care is needed so that the data are representative and do not generate a preference and restriction to a given alternative [86].
5. Application—Smart Sensor Selecting
5.1. Smart Sensor Monitoring for Subway Motor Escalator
5.2. Application of AHP-Gaussian Methodology
6. Results and Discussion
Impacts of Sensor Selection
7. Conclusions
Future Scope
Author Contributions
Funding
Institutional Review Board Statement
Data Availability Statement
Conflicts of Interest
References
- Alaloul, W.S.; Liew, M.S.; Zawawi, N.A.W.A.; Mohammed, B.S. Industry revolution IR 4.0: Future opportunities and challenges in Construction Industry. MATEC Web Conf. 2018, 203, 02010. [Google Scholar] [CrossRef]
- Favennec, J. Smart sensors in industry. J. Phys. E 1987, 20, 1087–1090. [Google Scholar] [CrossRef]
- Zaidan, A.A.; Zaidan, B.B.; Qahtan, M.Y.; Albahri, O.S.; Albahri, A.S.; Alaa, M.; Jumaah, F.M.; Talal, M.; Tan, K.L.; Shir, W.L.; et al. A survey on communication components for IoTbased technologies in smart. Telecommun. Syst. 2018, 69, 1–25. [Google Scholar] [CrossRef]
- Siow, E.; Tiropanis, T.; Hall, W. Analytics for the Internet of Things. ACM Comput. Surv. 2019, 51, 1–36. [Google Scholar] [CrossRef]
- Alaloul, W.S.; Liew, M.S.; Zawawi, N.A.W.A.; Kennedy, I.B. Industrial Revolution 4.0 in the construction industry: Challenges and opportunities for stakeholders. Ain Shams Eng. J. 2020, 11, 225–230. [Google Scholar] [CrossRef]
- Chiarini, A. Industry 4.0 technologies in the manufacturing sector: Are we sure they are all relevant for environmental performance? Bus. Strat. Environ. 2021, 30, 3194–3207. [Google Scholar] [CrossRef]
- Grzybowska, K.; Awasthi, A.; Sawhney, R. Sustainable Logistics and Production in Industry 4.0, 1st ed.; Springer Nature: Cham, Switzerland, 2019. [Google Scholar]
- Kalsoom, T.; Ramzan, N.; Ahmed, S.; UrRehman, M. Advances in sensor technologies in the era of smart factory and Industry. Sensors 2020, 20, 6783. [Google Scholar] [CrossRef]
- Poza-Lujan, J.; Posadas-Yagüe, J.; Simó-Ten, J.; Blanes, F. Distributed architecture to integrate sensor information: Object recognition for smart cities. Sensors 2019, 20, 112. [Google Scholar] [CrossRef]
- Corsi, C.; Razeghi, M.; Tournié, E.; Brown, G.J. Smart Sensors: Why and when the origin was and why and where the future will be. In Quantum Sensing and Nanophotonic Devices XI; SPIE: Philadelphia, PA, USA, 2013. [Google Scholar]
- Lasi, H.; Fettke, P.; Kemper, H.; Feld, T.; Hoffmann, M. Industry 4.0. Bus. Inf. Syst. Eng. 2014, 6, 239–242. [Google Scholar] [CrossRef]
- Cui, L.; Zhang, Z.; Gao, N.; Meng, Z.; Li, Z. Radio Frequency Identification and Sensing Techniques and Their Applications—A Review of the State-of-the-Art. Sensors 2019, 19, 4012. [Google Scholar] [CrossRef]
- Leticia, M.; Padilla, M.; Province, B. Assessment of teaching English Language Skills: Input to Digitized. Int. Multidiscip. Res. J. 2023, 4. [Google Scholar] [CrossRef]
- Mikalef, P.; Boura, M.; Lekakos, G.; Krogstie, J. Big data analytics and firm performance: Findings from a mixed-method approach. J. Bus. Res. 2019, 98, 261–276. [Google Scholar] [CrossRef]
- Franklin, C.S.; Dominguez, E.G.; Fryman, J.D.; Lewandowski, M.L. Collaborative robotics: New era of human–robot cooperation in the workplace. J. Safety Res. 2020, 74, 153–160. [Google Scholar] [CrossRef]
- Lee, Y.; Na, Y. Application of heuristic control technique to path planning of an autonomous guided vehicle. Int. J. Comput. Integr. Manuf. 1994, 7, 123–128. [Google Scholar] [CrossRef]
- Esengün, M.; İnce, G. The role of augmented reality in the age of industry 4.0. In Springer Series in Advanced Manufacturing; Springer International Publishing: Cham, Switzerland, 2018; pp. 201–215. [Google Scholar] [CrossRef]
- Kietzmann, J.; Pitt, L.; Berthon, P. Disruptions, decisions, and destinations: Enter the age of 3D printing and additive manufacturing. Bus. Horiz. 2015, 58, 209215. [Google Scholar] [CrossRef]
- Gunal, M.M. Simulation for Industry 4.0, 1st ed.; Springer Nature: Cham, Switzerland, 2019; p. 288. [Google Scholar] [CrossRef]
- Hamrita, T.K.; Kaluskar, N.P.; Wolfe, K.L. Advances in smart sensor technology. In Proceedings of the Fourtieth IAS Annual Meeting. Conference Record of the 2005 Industry Applications Conference, Hong Kong, China, 2–6 October 2005. [Google Scholar]
- Mahmud, M.; Wang, W. A smart sensorbased cEMD technique for rotor bar fault detection in induction motors. IEEE Trans. Instrum. Meas. 2021, 70, 111. [Google Scholar] [CrossRef]
- Derbel, F.; Strakosch, F. Integrated sensor based smart diagnostic and online monitoring of Industrial Systems. In Proceedings of the 2022 4th International Conference on Applied Automation and Industrial Diagnostics (ICAAID), Hail, Saudi Arabia, 29–31 March 2022. [Google Scholar]
- Postolache, O.; Freire, J.; Girão, P.S.; Miguel, J. Smart sensor architecture for vital signs and motor activity monitoring of wheelchair’ users. In Proceedings of the 2012 Sixth International Conference on Sensing Technology (ICST), Kolkata, India, 18–21 December 2012. [Google Scholar]
- Sadiki, S.; Faccio, M.; Ramadany, M.; Amgouz, D.; Boutahar, S. Impact of intelligent wireless sensor network on predictive maintenance cost. In Proceedings of the 2018 4th International Conference on Optimization and Applications (ICOA), Mohammedia, Morocco, 26–27 April 2018. [Google Scholar] [CrossRef]
- Bousdekis, A.; Mentzas, G. Enterprise Integration and Interoperability for big data-driven processes in the Frame of Industry 4.0. Front. Big Data 2021, 4, 644–651. [Google Scholar] [CrossRef]
- Rajagopal, M.S.; Seetharamu, K.N.; Ashwathnarayana, P.A. Transient thermal analysis of induction motors. IEEE Trans. Energy Convers. 1998, 13, 62–69. [Google Scholar] [CrossRef]
- Pech, M.; Vrchota, J.; Bednář, J. Predictive maintenance and intelligent sensors in smart factory: Review. Sensors 2021, 21, 1470. [Google Scholar] [CrossRef]
- Zamudio-Ramírez, I.; Osornio-Ríos, R.A.; Antonino-Daviu, J.A.; Quijano-Lopez, A. Smart-sensor for the automatic detection of electromechanical faults in induction motors based on the transient stray flux analysis. Sensors 2020, 20, 1477. [Google Scholar] [CrossRef]
- Luong, P.; Wang, W. Smart sensorbased synergistic analysis for rotor bar fault detection of induction motors. IEEE ASME Trans. Mechatron. 2020, 25, 1067–1075. [Google Scholar] [CrossRef]
- Zamudio-Ramirez, I.; Osornio-Rios, R.A.; Antonino-Daviu, J. Triaxial smart sensor based on the advanced analysis of stray flux and currents for the reliable fault detection in induction motors. In Proceedings of the 2020 IEEE Energy Conversion Congress and Exposition (ECCE), Detroit, MI, USA, 11–15 October 2020. [Google Scholar]
- Yang, G.; Wang, F.; Deng, F.; Xiang, X. Impact of digital transformation on enterprise carbon intensity: The Moderating Role of Digital Information Resources. Int. J. Environ. Res. Public Health 2023, 20, 2178. [Google Scholar] [CrossRef]
- Philipp, F.; Martinez, J.; Glesner, M.; Arkkio, A. A smart wireless sensor for the diagnosis of broken bars in induction motors. In Proceedings of the 2012 13th Biennial Baltic Electronics Conference, Tallinn, Estonia, 3–5 October 2012. [Google Scholar]
- Zamudio-Ramirez, I.; Osornio-Rios, R.A.; Trejo-Hernandez, M.; Romero-Troncoso RD, J.; Antonino-Daviu, J.A. Smart-sensors to estimate insulation health in induction motors via analysis of stray flux. Energies 2019, 12, 1658. [Google Scholar] [CrossRef]
- Khan, H.U.; Nazir, S. Assessing the Role of AI-Based Smart Sensors in Smart Cities Using AHP and MOORA. Sensors 2023, 23, 494. [Google Scholar] [CrossRef]
- Bouchabou, D.; Nguyen, S.M.; Lohr, C.; LeDuc, B.; Kanellos, I. A survey of human activity recognition in smart homes based on IoT sensors algorithms: Taxonomies, challenges, and opportunities with deep learning. Sensors 2021, 21, 6037. [Google Scholar] [CrossRef] [PubMed]
- Chen, L.; Hoey, J.; Nugent, C.D.; Cook, D.J.; Yu, Z. Sensor-Based Activity Recognition. IEEE Trans. Syst. Man Cybern. C Appl. Rev. 2012, 42, 790–808. [Google Scholar] [CrossRef]
- Zamudio-Ramírez, I.; Osornio-Rios, R.A.; Antonino-Daviu, J.A. Smart sensor for fault detection in induction motors based on the combined analysis of stray-flux and current signals: A flexible, robust approach. IEEE Ind. Appl. Mag. 2022, 28, 56–66. [Google Scholar] [CrossRef]
- Spencer, B.F.; Ruiz-Sandoval, M.E.; Kurata, N. Smart sensing technology: Opportunities and challenges. Struct. Contr. Health Monit. 2004, 11, 349–368. [Google Scholar] [CrossRef]
- Prosser, S.J.; Schmidt, E.D. Smart sensors for industrial applications. Sens. Rev. 1997, 17, 217–222. [Google Scholar] [CrossRef]
- Alonso, M.; Amaris, H.; Alcala, D.; Diana, M.F. Smart Sensors for Smart Grid Reliability. Sensors 2020, 20, 2187. [Google Scholar] [CrossRef]
- Ukil, A. Towards networked smart digital sensors: A review. In Proceedings of the 2008 34th Annual Conference of IEEE Industrial Electronics, Orlando, FL, USA, 10–13 November 2008. [Google Scholar]
- Betts, B. Smart sensors. IEEE Spectr. 2007, 44, 50–53. [Google Scholar] [CrossRef]
- Rafferty, J.; Nugent, C.D.; Liu, J.; Chen, L. From activity recognition to intention recognition for assisted living within smart homes. IEEE Trans. Hum. Mach. Syst. 2017, 47, 368–379. [Google Scholar] [CrossRef]
- Gomes, C.F.S.; Rodrigues, M.V.G.; Costa, I.P.D.A.; dos Santos, M. Ordering of Warships for the Brazilian Navy Using the New Method: AHP-Gaussian with Pearson’s Correlation. In Modern Management Based on Big Data II and Machine Learning and Intelligent Systems III; IOS Press: Amsterdam, The Netherlands, 2021. [Google Scholar]
- Apolinário, B.D.S.; Kowalski, F.L.; Santos, M.D. Feasibility of Thermal Analysis of Constructive Systems Using the Ahp-Gaussian Method. 2022. Available online: https://isahp.org/uploads/062.pdf (accessed on 25 February 2023).
- Silva, L.P.; Gomes, C.F.S.; Santos, M. Avaliação de Aquisições Hospitalares a Partir do Método Multicritério Ahp-Gaussiano. Anual Conference: XXVIII Simpósio de Engenharia de Produção (SIMPEP 2021), Bauru, Brasil. November 2021. Available online: https://l1nq.com/XNqsi (accessed on 16 April 2023).
- Shahriar, S.; De Souza, P.; Timms, G. Smart Query Answering for Marine Sensor Data. Sensors 2011, 11, 2885–2897. [Google Scholar] [CrossRef] [PubMed]
- Moghe, R.; Lambert, F.; Divan, D. A Novel Low-Cost Smart Current Sensor for Utility Conductors. IEEE Trans. Smart Grid 2012, 3, 653663. [Google Scholar] [CrossRef]
- Feng, J.; Xu, J.; Liao, W.; Liu, Y. Review on the Traction System Sensor Technology of a Rail Transit Train. Sensors 2017, 17, 1356. [Google Scholar] [CrossRef]
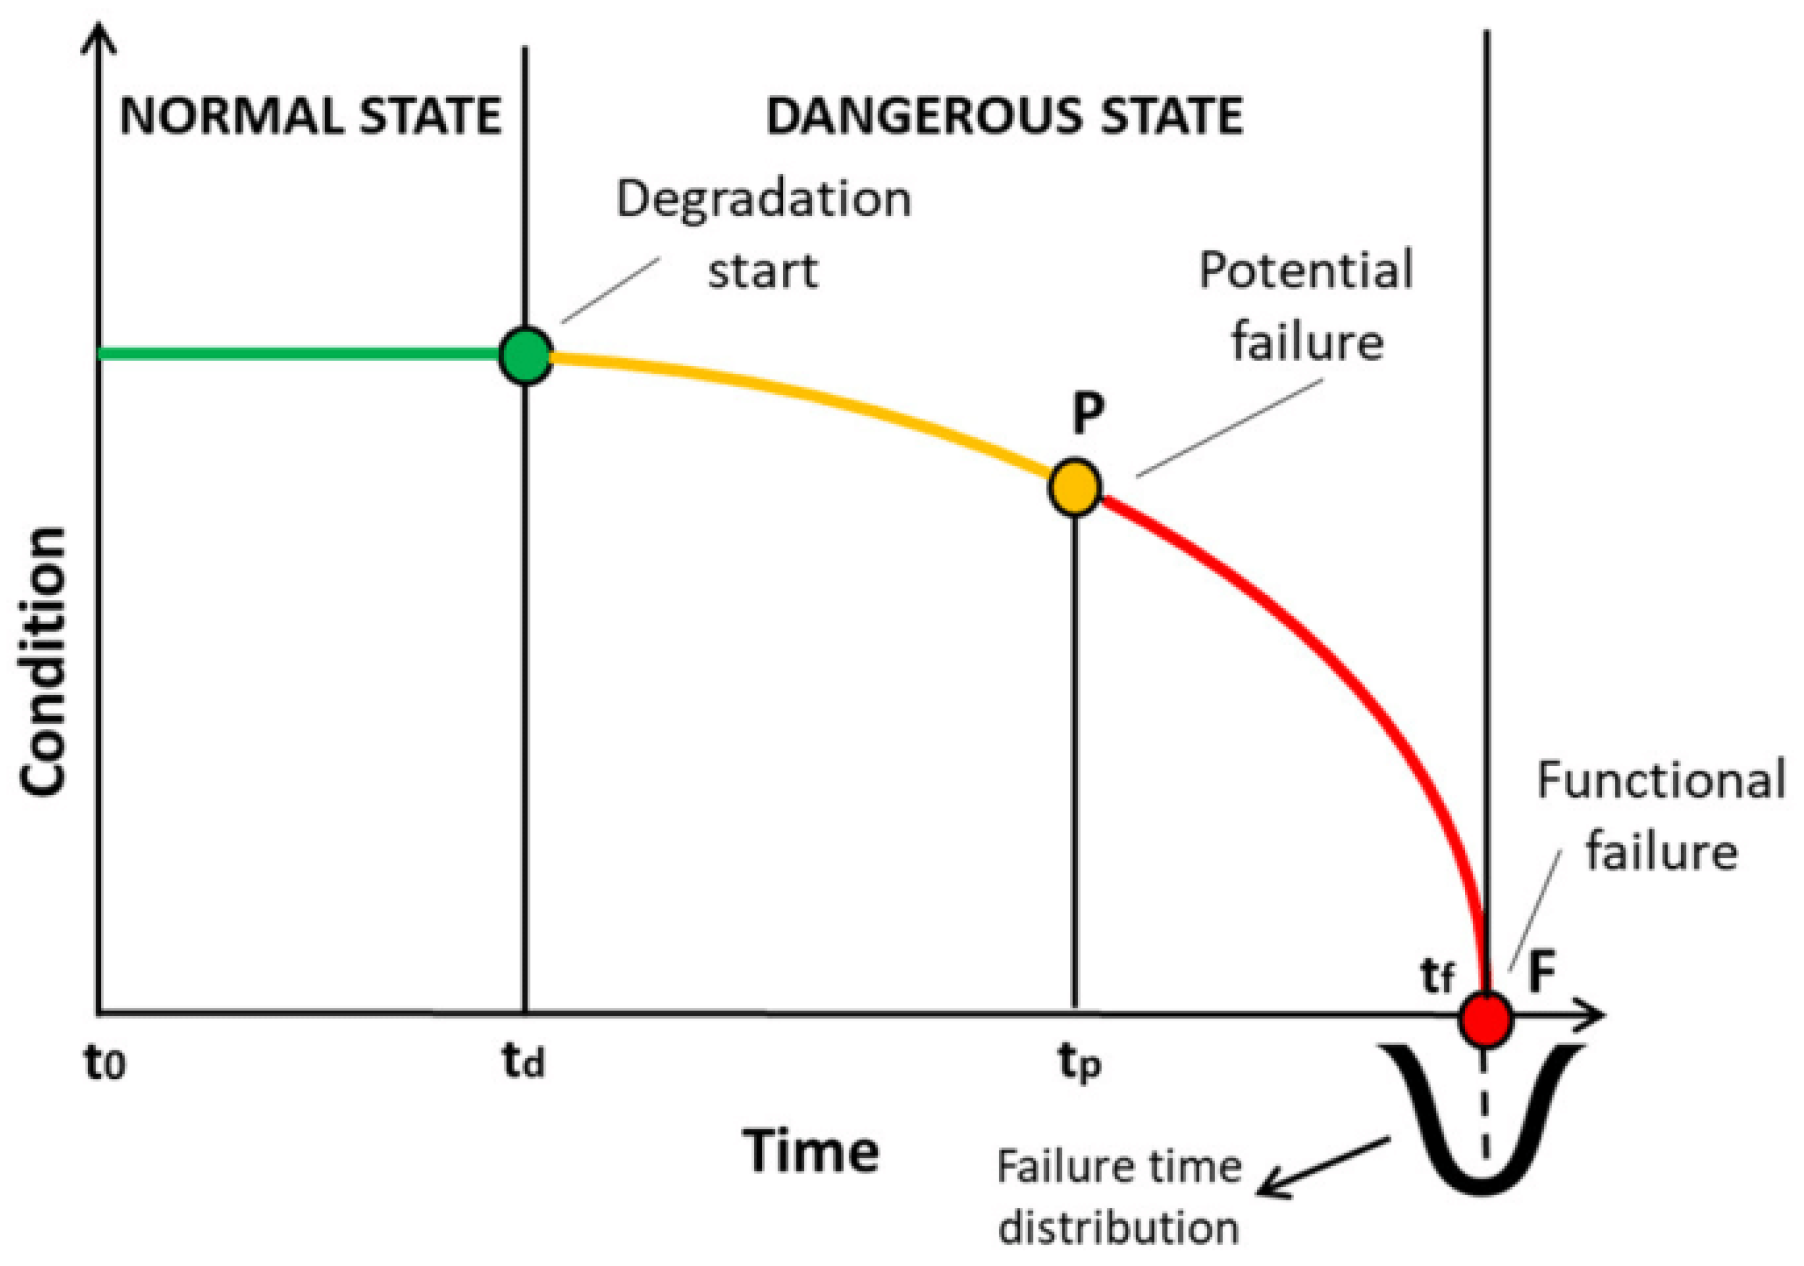
- Ochella, S.; Shafiee, M.; Sansom, C. Adopting machine learning and condition monitoring PF curves in determining and prioritizing high-value assets for life extension. Expert Syst. Appl. 2021, 176, 114897. [Google Scholar] [CrossRef]
- Jumaah, A.M.S.; Xue, J. Developing intelligent machines with smart sensors for a smart factory. Int. J. Sci. Res. Publ. (IJSRP) 2019, 9, 9430. [Google Scholar] [CrossRef]
- Wang, H.; Cao, W.; Wang, F. Digital Transformation and Manufacturing Firm Performance: Evidence from China. Sustainability 2022, 14, 10212. [Google Scholar] [CrossRef]
- Cheng, C.-C.; Lee, D. Smart sensors enable smart air conditioning control. Sensors 2014, 14, 11179–11203. [Google Scholar] [CrossRef]
- Chan, M.; Estève, D.; Escriba, C.; Campo, E. A review of smart homespresent state and future challenges. Comput. Methods Programs Biomed. 2008, 91, 5581. [Google Scholar] [CrossRef]
- Khan, M.; Silva, B.N.; Han, K. A web of things-based emerging sensor network architecture for smart control systems. Sensors 2017, 17, 332. [Google Scholar] [CrossRef]
- Kang, H.-J.; Han, J.; Kwon, G.H. The Acceptance Behavior of Smart Home Health Care Services in South Korea: An Integrated Model of UTAUT and TTF. Int. J. Environ. Res. Public Health 2022, 19, 13279. [Google Scholar] [CrossRef] [PubMed]
- Cho, M.E.; Kim, M.J. Smart Homes Supporting the Wellness of One or Two-Person Households. Sensors 2022, 22, 7816. [Google Scholar] [CrossRef] [PubMed]
- de Vera, D.D.P.; Izquierdo, Á.S.; Vercher, J.B.; Gómez, L.A.H. A ubiquitous sensor network platform for integrating smart devices into the Semantic Sensor Web. Sensors 2014, 14, 10725–10752. [Google Scholar] [CrossRef] [PubMed]
- Ghazinejad, M.; Khoshnoud, F.; Porter, S. Enhancing Interactive Learning in Engineering Classes by Implementing Virtual Laboratories. In Proceedings of the 2021 IEEE Frontiers in Education Conference (FIE), Lincoln, NE, USA, 13–16 October 2021. [Google Scholar] [CrossRef]
- Zhang, Y.; Gu, Y.; Vlatkovic, V.; Wang, X. Progress of smart sensor and smart sensor networks. In Proceedings of the Fifth World Congress on Intelligent Control and Automation (IEEE Cat. No.04EX788), Hangzhou, China, 15–19 June 2004. [Google Scholar]
- Al-Ali, A.R.; Aji, Y.R.; Othman, H.F.; Fakhreddin, F.T. Wireless smart sensors networks overview. In Proceedings of the Second IFIP International Conference on Wireless and Optical Communications Networks, 2005. WOCN 2005, Dubai, United Arab Emirates, 6–8 March 2005. [Google Scholar]
- Gervais-Ducouret, S. Next smart sensors generation. In Proceedings of the 2011 IEEE Sensors Applications Symposium, San Antonio, TX, USA, 22–24 February 2011. [Google Scholar]
- Silhavy, R.; Senkerik, R.; Oplatkova; Kominkova, Z.; Silhavy, P.; Prokopova, Z. Modern Trends and Techniques in Computer Science; Springer International Publishing: Cham, Switzerland, 2014; p. 629. [Google Scholar] [CrossRef]
- Reichenbach, M.; Kasparek, M.; Alawieh, M.; Haublein, K.; Fey, D. Real-time correlation for locating systems utilizing heterogeneous computing architectures. In Proceedings of the 2015 Conference on Design and Architectures for Signal and Image Processing (DASIP), Krakow, Poland, 23–25 September 2015. [Google Scholar] [CrossRef]
- Reichenbach, M.; Kasparek, M.; Häublein, K.; Bauer, J.N.; Alawieh, M.; Fey, D. Fast heterogeneous computing architectures for smart antennas. J. Syst. Arch. 2017, 76, 7688. [Google Scholar] [CrossRef]
- Li, Y.-G.; Yang, G.-H. Optimal stealthy switching location attacks against remote estimation in cyber-physical systems. Neurocomputing 2021, 421, 183–194. [Google Scholar] [CrossRef]
- Yao, Z.; Tan, L.; She, K. 5GBSS: 5Gbased universal blockchain smart sensors. Sensors 2022, 22, 4607. [Google Scholar] [CrossRef]
- Voicu, V.; Petreus, D.; Etz, R. IoT Blockchain for Smart Sensor. In Proceedings of the 2020 43rd International Spring Seminar on Electronics Technology (ISSE), Demanovska Valley, Slovakia, 14–15 May 2020. [Google Scholar] [CrossRef]
- Song, G.; Li, W.; Wang, B.; Ho, S.C.M. A review of rock bolt monitoring using smart sensors. Sensors 2017, 17, 776. [Google Scholar] [CrossRef]
- Meoni, A.; D’Alessandro, A.; Mancinelli, M.; Ubertini, F. A multichannel strain measurement technique for nanomodified smart cement-based sensors in reinforced concrete structures. Sensors 2021, 21, 5633. [Google Scholar] [CrossRef]
- Moghe, R.; Lambert, F.C.; Divan, D. Smart ‘Stickon’ Sensors for the Smart Grid. IEEE Trans. Smart Grid 2012, 3, 241–252. [Google Scholar] [CrossRef]
- Bagula, A.; Castelli, L.; Zennaro, M. On the design of smart parking networks in the smart cities: An optimal sensor placement model. Sensors 2015, 15, 15443–15467. [Google Scholar] [CrossRef] [PubMed]
- Wu, J.; Chen, Z.; Wang, C.; Hao, L. A Novel Low-Cost Multicoil-Based Smart Current Sensor for Three-Phase Currents Sensing of Overhead Conductors. IEEE Trans. Power Deliv. 2016, 31, 2443–2452. [Google Scholar] [CrossRef]
- Fan, F.; Ji, Q.; Wu, G.; Wang, M.; Ye, X.; Mei, Q. Dynamic barrier coverage in a wireless sensor network for smart grids. Sensors 2018, 19, 41. [Google Scholar] [CrossRef] [PubMed]
- Enlund, D.; Harrison, K.; Ringdahl, R.; Börütecene, A.; Löwgren, J.; Angelakis, V. The role of sensors in the production of smart city spaces. Big Data Soc. 2022, 9, 205395172211102. [Google Scholar] [CrossRef]
- Mendes, J.J.A., Jr.; Vieira, M.E.M.; Pires, M.B.; Stevan, S.L., Jr. Sensor fusion and smart sensor in sports and biomedical applications. Sensors 2016, 16, 1569. [Google Scholar] [CrossRef]
- Yin, Y.; Guo, C.; Li, H.; Yang, H.; Xiong, F.; Chen, D. The Progress of Research into Flexible Sensors in the Field of Smart Wearables. Sensors 2022, 22, 5089. [Google Scholar] [CrossRef]
- Pereira, R.C.A.; Moreira, M.L.; Costa, I.P.D.A.; Tenório, F.M.; Barud, N.A.; Fávero, L.P.; Al-Qudah, A.A.; Gomes, C.F.S.; dos Santos, M. Feasibility of a Hospital Information System for a Military Public Organization in the Light of the Multi-Criteria Analysis. Healthcare 2022, 10, 2147. [Google Scholar] [CrossRef] [PubMed]
- Mellem, P.M.N.; Costa, I.P.D.A.; Costa, A.P.D.A.; Moreira, M.L.; Gomes, C.F.S.; dos Santos, M.; Corriça, J.V.D.P. Prospective scenarios applied in course portfolio management: An approach in light of the Momentum and ELECTRE-MOr methods. Procedia Comput. Sci. 2022, 199, 48–55. [Google Scholar] [CrossRef]
- Santos, N.; Junior, C.D.S.R.; Moreira, M.L.; dos Santos, M.; Gomes, C.F.S.; Costa, I.P.D.A. Strategy Analysis for project portfolio evaluation in a technology consulting company by the hybrid method THOR. Procedia Comput. Sci. 2022, 199, 134–141. [Google Scholar] [CrossRef]
- Costa, I.P.D.A.; Costa, A.P.D.A.; Sanseverino, A.M.; Gomes, C.F.S.; Santos, M.D. Bibliometric studies on multi-criteria decision analysis (mcda) methods applied in military problems. Pesqui. Oper. 2022, 42. [Google Scholar] [CrossRef]
- Costa, I.P.D.A.; Moreira, M.L.; Costa, A.P.D.A.; Teixeira, L.F.H.D.S.D.B.; Gomes, C.F.S.; Dos Santos, M. Strategic Study for Managing the Portfolio of IT Courses Offered by a Corporate Training Company: An Approach in the Light of the ELECTRE-MOr Multicriteria Hybrid Method. Int. J. Inf. Technol. Decis. Mak. 2022, 21, 351–379. [Google Scholar] [CrossRef]
- Saaty, R.W. The analytic hierarchy process—What it is and how it is used. Math. Model. 1987, 9, 161–176. [Google Scholar] [CrossRef]
- dos Santos, M.; Costa, I.P.d.A.; Gomes, C.F.S. Multicriteria decision-making in the selection of warships: A new approach to the ahp method. Int. J. Anal. Hierarchy Process 2021, 13. [Google Scholar] [CrossRef]
- Junior, C.D.S.R.; Moreira, M.L.; dos Santos, M. Selection of interns for startups: An approach based on the AHP-TOPSIS-2N method and the 3DM computational platform. Procedia Comput. Sci. 2022, 199, 984–991. [Google Scholar] [CrossRef]
- de Almeida, I.D.P.; Costa, I.P.D.A.; Costa, A.P.D.A.; Corriça, J.V.D.P.; Moreira, M.L.; Gomes, C.F.S.; dos Santos, M. A multicriteria decision-making approach to classify military base for Brazilian Navy. Procedia Comput. Sci. 2022, 199, 79–86. [Google Scholar] [CrossRef]
- Costa, I.P.D.A.; Basílio, M.P.; Maêda, S.M.D.N.; Rodrigues, M.V.G.; Moreira, M.L.; Gomes, C.F.S.; dos Santos, M. Algorithm Selection for Machine Learning classification: An application of the Melchior Multicriteria Method. In Frontiers in Artificial Intelligence and Applications; IOS Press: Amsterdam, The Netherlands, 2021. [Google Scholar] [CrossRef]
- ABB. ABB Ability TM Smart Sensor Condition Monitoring for Motors. 2019. Available online: www.abb.com/smartsensor (accessed on 25 February 2023).
- WEG. WEG Motor Scan. WEG. 2022. Available online: https://www.weg.net (accessed on 25 February 2023).
- Hoyer. Hoyer Smart Motor Sensor. 2022. Available online: https://www.hoyermotors.com (accessed on 25 February 2023).
- Dynamox. Dynamox Dynapredict Solution. 2022. Available online: https://www.dynamox.net (accessed on 25 February 2023).
- Costa, I.P.D.A.; Basílio, M.P.; Maêda, S.M.D.N.; Rodrigues, M.V.G.; Moreira, M.L.; Gomes, C.F.S.; dos Santos, M. Bibliometric Studies on Multi-Criteria Decision Analysis (MCDA) Applied in Personnel Selection. Front. Artif. Intell. Appl. 2021, 42, 119–125. [Google Scholar] [CrossRef]
- Maêda, S.M.D.N.; Basílio, M.P.; Costa, I.P.D.A.; Moreira, M.L.; dos Santos, M.; Gomes, C.F.S. The SAPEVO-M-NC Method. Front. Artif. Intell. Appl. 2021, 89–95. [Google Scholar] [CrossRef]
- Rana, S.; Belokar, R.M. Quality Improvement Using FMEA: A Short Review. Int. Res. J. Eng. Technol. (IRJET) 2017, 4, 263–267. [Google Scholar]
- Petrescu, L.; Cazacu, E.; Petrescu, M.-C. Failure Mode and Effect Analysis in Automotive Industry: A Case Study. Sci. Bull. Electr. Eng. Fac. 2019, 19, 10–15. [Google Scholar] [CrossRef]
- McDermott, R.E.; Mikulak, R.J.; Beauregard, M.B. The Basics of FMEA, 2nd ed.; CRC Press: Boca Raton, FL, USA, 2009. [Google Scholar]
- Kumar, A.; Garg, P.; Pant, S.; Ram, M.; Kumar, A. Multi-Criteria Decision-Making Techniques for Complex Decision Making Problems. Math. Eng. Sci. Aerosp. (MESA) 2022, 13, 791–803. [Google Scholar]
- Boix-Cots, D.; Pardo-Bosch, F.; Pujadas, P. A systematic review on multi-criteria group decision-making methods based on weights: Analysis and classification scheme. Inf. Fusion 2023, 96, 16–36. [Google Scholar] [CrossRef]
- Więckowski, J.; Kizielewicz, B.; Sałabun, W. Handling decision-making in Intuitionistic Fuzzy environment: PyIFDM package. SoftwareX 2023, 22, 101344. [Google Scholar] [CrossRef]
- Aydoğdu, E.; Güner, E.; Aldemir, B.; Aygün, H. Complex spherical fuzzy TOPSIS based on entropy. Expert Syst. Appl. 2023, 215, 119331. [Google Scholar] [CrossRef]
- Garg, C.P.; Görçün, F.; Kundu, P.; Küçükönder, H. An integrated fuzzy MCDM approach based on Bonferroni functions for selection and evaluation of industrial robots for the automobile manufacturing industry. Expert Syst. Appl. 2023, 213, 118863. [Google Scholar] [CrossRef]
- Ali, J.; Naeem, M. Multi-Criteria Decision-Making Method Based on Complex t-Spherical Fuzzy Aczel–Alsina Aggregation Operators and Their Application. Symmetry 2022, 15, 85. [Google Scholar] [CrossRef]
- Jawad, M.; Naz, M.; Muqaddus, H. A multi-criteria decision-making approach for portfolio selection by using an automatic spherical fuzzy AHP algorithm. J. Oper. Res. Soc. 2023, 1–14. [Google Scholar] [CrossRef]
- Hezam, I.M.; Mishra, A.R.; Krishankumar, R.; Ravichandran, K.; Kar, S.; Pamucar, D.S. A single-valued neutrosophic decision framework for the assessment of sustainable transport investment projects based on discrimination measure. Manag. Decis. 2022, 61, 443–471. [Google Scholar] [CrossRef]
- Opoku-Mensah, E.; Yin, Y.; Asiedu-Ayeh, L.O.; Asante, D.; Tuffour, P.; Ampofo, S.A. Exploring governments’ role in mergers and acquisitions using IVIF MULTIMOORA-COPRAS technique. Int. J. Emerg. Mark. 2021, 18, 908–930. [Google Scholar] [CrossRef]
- Deretarla, Ö.; Erdebilli, B.; Gündoğan, M. An integrated Analytic Hierarchy Process and Complex Proportional Assessment for vendor selection in supply chain management. Decis. Anal. J. 2023, 6, 100155. [Google Scholar] [CrossRef]
- Moreira, M.L.; Silva, F.C.A.; Costa, I.P.D.A.; Gomes, C.F.S.; dos Santos, M. SAPEVO-H2 a Multi-Criteria Systematic Based on a Hierarchical Structure: Decision-Making Analysis for Assessing Anti-RPAS Strategies in Sensing Environments. Processes 2023, 11, 352. [Google Scholar] [CrossRef]
- Malathy, N.K.; Revathi, T. Entropy-based complex proportional assessment for efficient task scheduling in fog computing. Trans. Emerg. Telecommun. Technol. 2022, 34, e4690. [Google Scholar] [CrossRef]
- Gligorić, Z.; Gligorić, M.; Miljanović, I.; Lutovac, S.; Milutinović, A. Assessing Criteria Weights by the Symmetry Point of Criterion (Novel SPC Method)–Application in the Efficiency Evaluation of the Mineral Deposit Multi-Criteria Partitioning Algorithm. Comput. Model. Eng. Sci. 2023, 136, 955–979. [Google Scholar] [CrossRef]
- Chi, H.R.; Silva, R.; Santos, D.; Quevedo, J.; Corujo, D.; Abboud, O.; Radwan, A.; Hecker, A.; Aguiar, R.L. Multi-Criteria Dynamic Service Migration for Ultra-Large-Scale Edge Computing Networks. IEEE Trans. Ind. Inform. 2023, 1–12. [Google Scholar] [CrossRef]
- Gligorić, M.; Gligorić, Z.; Lutovac, S.; Negovanović, M.; Langović, Z. Novel Hybrid MPSI–MARA Decision-Making Model for Support System Selection in an Underground Mine. Systems 2022, 10, 248. [Google Scholar] [CrossRef]
- Haq, R.S.U.; Saeed, M.; Mateen, N.; Siddiqui, F.; Naqvi, M.; Yi, J.; Ahmed, S. Sustainable material selection with crisp and ambiguous data using single-valued neutrosophic-MEREC-MARCOS framework. Appl. Soft Comput. 2022, 128, 109546. [Google Scholar] [CrossRef]
- Moreira, M.L.; Gomes, C.F.S.; dos Santos, M.; Basilio, M.P.; Costa, I.P.D.A.; Junior, C.d.S.R.; Jardim, R.R.-A.J. Evaluation of drones for public security: A multicriteria approach by the PROMETHEE-SAPEVO-M1 systematic. Procedia Comput. Sci. 2022, 199, 125–133. [Google Scholar] [CrossRef]


| Characteristics | Description |
|---|---|
| Multi-functionality | Smart sensors are capable of not only detecting and measuring physical variables, but also processing, storing, and transmitting data. |
| Connectivity | Smart sensors can communicate wirelessly with other devices and systems, allowing for real-time data exchange and control. |
| Autonomy | Smart sensors can make decisions based on their measurements, without the need for human intervention. |
| Intelligence | Smart sensors use algorithms and machine learning techniques used to analyze data, identify patterns, and make predictions. |
| Integration | Smart sensors can be used to integrate systems that were previously installed. |
| Miniaturization | Smart sensors are often designed to be small and compact, making them suitable for use in a variety of applications and environments. |
| Cost-effectiveness | Smart sensors offer a cost-effective solution for monitoring and controlling physical processes, compared to traditional approaches that require multiple sensors, data loggers, and other hardware. |
| Literature Review Step | Description | SCOPUS | Science Direct |
|---|---|---|---|
| 1 | Initial search with “smart sensors” AND “Selection” terms. | 252 | 19 |
| 2 | Limitation to works written in English. | 241 | 19 |
| 3 | Limitation of the search to specific keywords, aligned with the objective of the work. | 120 | 14 |
| 4 | Removal of duplicate works in scientific databases. | 110 | 14 |
| 5 | Acquisition of works for complete reading. | 89 | 10 |
| 6 | Complete reading. | 84 | 8 |
| Works used as base for literature review | 92 | ||
| Parametervalue | Meaning | Description |
|---|---|---|
| 1 | Equal relevance | The two alternatives contribute equally to the goal. |
| 3 | Moderate relevance | Experience and judgment slightly favor one activity over another. |
| 5 | Strong relevance | Experience and judgment strongly favor one activity over another. |
| 7 | Very strong relevance | One alternative is strongly favored over another. |
| 9 | Extreme relevance | The evidence is in favor of one alternative over another (to the greatest extent possible). |
| 2,4,5,8 | Intermediate values | Used to express preferences that are between the references above. |
| # | Parameter | Description |
|---|---|---|
| C1 | Temperature range | This refers to the temperature range that the sensor can operate in, and it is important because it affects the accuracy and reliability of the sensor readings. A wider temperature range means that the sensor is more versatile and can be used in a wider range of environments. |
| C2 | Vibration range | This refers to the range of vibrations that the sensor can withstand and still produce accurate readings. A higher vibration range means that the sensor is more durable and can be used in harsh environments. |
| C3 | Weight | The weight of the sensor is an important factor to consider, especially if the motor is going to be mounted in a limited space or needs to be portable. A lighter sensor is more convenient and easier to install. |
| C4 | Distance of communication | This refers to the maximum distance that the sensor can transmit data to a receiving device. This is important to consider if the motor is located far from the data acquisition system. A longer communication distance means that the sensor can be used in larger installations. |
| C5 | Max electric power (Hp) | Electric power is an important parameter to measure in an electric motor because it provides a measure of the rate at which work is being performed. By measuring the electric power, you can determine how much electrical energy is being converted into useful mechanical energy and assess the efficiency of the motor. |
| C6 | Data Traffic Speed | The data traffic speed of the sensor refers to the speed at which it can transmit data. This is important because the speed at which the sensor can transmit data has a direct impact on the real-time monitoring and control of the motor. If the data traffic speed is slow, there may be a delay in the transmission of data, leading to less accurate and less responsive control of the motor. |
| C7 | Acquisition cost | The cost of acquiring the sensor is an important factor to consider when evaluating different options. A lower cost may mean that the sensor is less sophisticated or has lower performance compared to sensors that are more expensive. |
| # | Sensor Name Model | Image of Sensor | Max Temperature Work (°C) | Max Vibration Range (KHz) | Weight (g) | Max Distance Communication (m) | Max Electric Power (Hp) | Max Data Traffic Speed (GHz) | Average Acquisition Cost (USD *) |
|---|---|---|---|---|---|---|---|---|---|
| A1 | ABB ability smart sensor |  | 115 | 13.3 | 250 | 50 | 800 | 2.4 | 380 |
| A2 | WEG motor scan |  | 80 | 13 | 277 | 70 | 700 | 2.4 | 290 |
| A3 | Hoyer smart sensor |  | 80 | 5.1 | 500 | 50 | 700 | 2.4 | 560 |
| A4 | Dynamox Dynalogger |  | 100 | 2.5 | 320 | 60 | 1000 | 5.3 | 350 |
| # | Alternatives | C1 | C2 | C3 | C4 | C5 | C6 | C7 |
|---|---|---|---|---|---|---|---|---|
| Max | Max | Min | Max | Max | Max | Min | ||
| Temperature Work (°C) | Vibration Range (KHz) | Weight (g) | Distance Communication (m) | Electric Power (Hp) | Data Traffic Speed (GHz) | Acquisition Cost (USD) | ||
| A1 | ABB Ability Sensors | 115 | 13.3 | 250 | 50 | 800 | 2.4 | 380 |
| A2 | WEG motor Scan | 80 | 13 | 277 | 70 | 700 | 2.4 | 290 |
| A3 | Hoyer Smart sensor | 80 | 5.1 | 500 | 50 | 700 | 2.4 | 560 |
| A4 | Dynamox Dynalogger Sensor | 100 | 2.5 | 320 | 60 | 1000 | 5.3 | 350 |
| # | Alternatives | C1 | C2 | C3 | C4 | C5 | C6 | C7 |
|---|---|---|---|---|---|---|---|---|
| Max | Max | Min | Max | Max | Max | Min | ||
| Temperature Work (°C) | Vibration Range (KHz) | Weight (g) | Distance Communication (m) | Electric Power (Hp) | Data Traffic Speed (GHz) | Acquisition Cost (USD) | ||
| A1 | ABB Ability Sensors | 0.3067 | 0.3923 | 0.3141 | 0.2174 | 0.2500 | 0.1920 | 0.2454 |
| A2 | WEG motor Scan | 0.2133 | 0.3835 | 0.2835 | 0.3043 | 0.2188 | 0.1920 | 0.3215 |
| A3 | Hoyer Smart sensor | 0.2133 | 0.1504 | 0.1570 | 0.2174 | 0.2188 | 0.1920 | 0.1665 |
| A4 | Dynamox Dynalogger Sensor | 0.2667 | 0.0737 | 0.2454 | 0.2609 | 0.3125 | 0.4240 | 0.2664 |
| AHP-G Parameters | C1 | C2 | C3 | C4 | C5 | C6 | C7 |
|---|---|---|---|---|---|---|---|
| Temperature Work (°C) | Vibration Range (KHz) | Weight (g) | Distance Communication (m) | Electric Power (Hp) | Data Traffic Speed (GHz) | Acquisition Cost (USD) | |
| Average | 0.2500 | 0.2500 | 0.2500 | 0.2500 | 0.2500 | 0.2500 | 0.2500 |
| Standard deviation | 0.0454 | 0.1623 | 0.0680 | 0.0416 | 0.0442 | 0.1160 | 0.0642 |
| Gaussian factor | 0.1815 | 0.6493 | 0.2722 | 0.1665 | 0.1768 | 0.4640 | 0.2569 |
| Gaussian factor normalized | 0.0838 | 0.2996 | 0.1256 | 0.0768 | 0s.0816 | 0.2141 | 0.1185 |
| # | Alternatives | C1 | C2 | C3 | C4 | C5 | C6 | C7 |
|---|---|---|---|---|---|---|---|---|
| Max | Max | Min | Max | Max | Max | Min | ||
| Temperature Work (°C) | Vibration Range (KHz) | Weight (g) | Distance Communication (m) | Electric Power (Hp) | Data Traffic Speed (GHz) | Acquisition Cost (USD) | ||
| A1 | ABB Ability Sensors | 0.3067 | 0.3923 | 0.3141 | 0.2174 | 0.2500 | 0.1920 | 0.3067 |
| A2 | WEG motor Scan | 0.2133 | 0.3835 | 0.2835 | 0.3043 | 0.2188 | 0.1920 | 0.2133 |
| A3 | Hoyer Smart sensor | 0.2133 | 0.1504 | 0.1570 | 0.2174 | 0.2188 | 0.1920 | 0.2133 |
| A4 | Dynamox Dynalogger Sensor | 0.2667 | 0.0737 | 0.2454 | 0.2609 | 0.3125 | 0.4240 | 0.2667 |
| # | Alternatives | AHP-G | Ranking | |
|---|---|---|---|---|
| A1 | ABB Ability Sensors | 0.2900 | 0.145028 | 1 |
| A2 | WEG motor Scan | 0.2888 | 0.406709 | 2 |
| A3 | Hoyer Smart sensor | 0.1781 | 0.222807 | 4 |
| A4 | Dynamox Dynalogger Sensor | 0.2431 | 0.225456 | 3 |
| FMEA | ||||||||||
|---|---|---|---|---|---|---|---|---|---|---|
| # | Failure | Effect | S | Cause | O | Controls | D | RPN | ||
| Function | Failure Mode | Prevention | Detection | |||||||
| 1 | Coupling the motor to the escalator | Motor decoupling | Escalator shaking | 9 | High level of motor vibration | 5 | Maintenance every 4 months | External inspection every week | 5 | 225 |
| 2 | Regular operation | Motor heating | Reduced motor shelf life | 6 | Changing the energy level and effort of the motor to operate | 6 | Without prevention | During corrective maintenance | 8 | 288 |
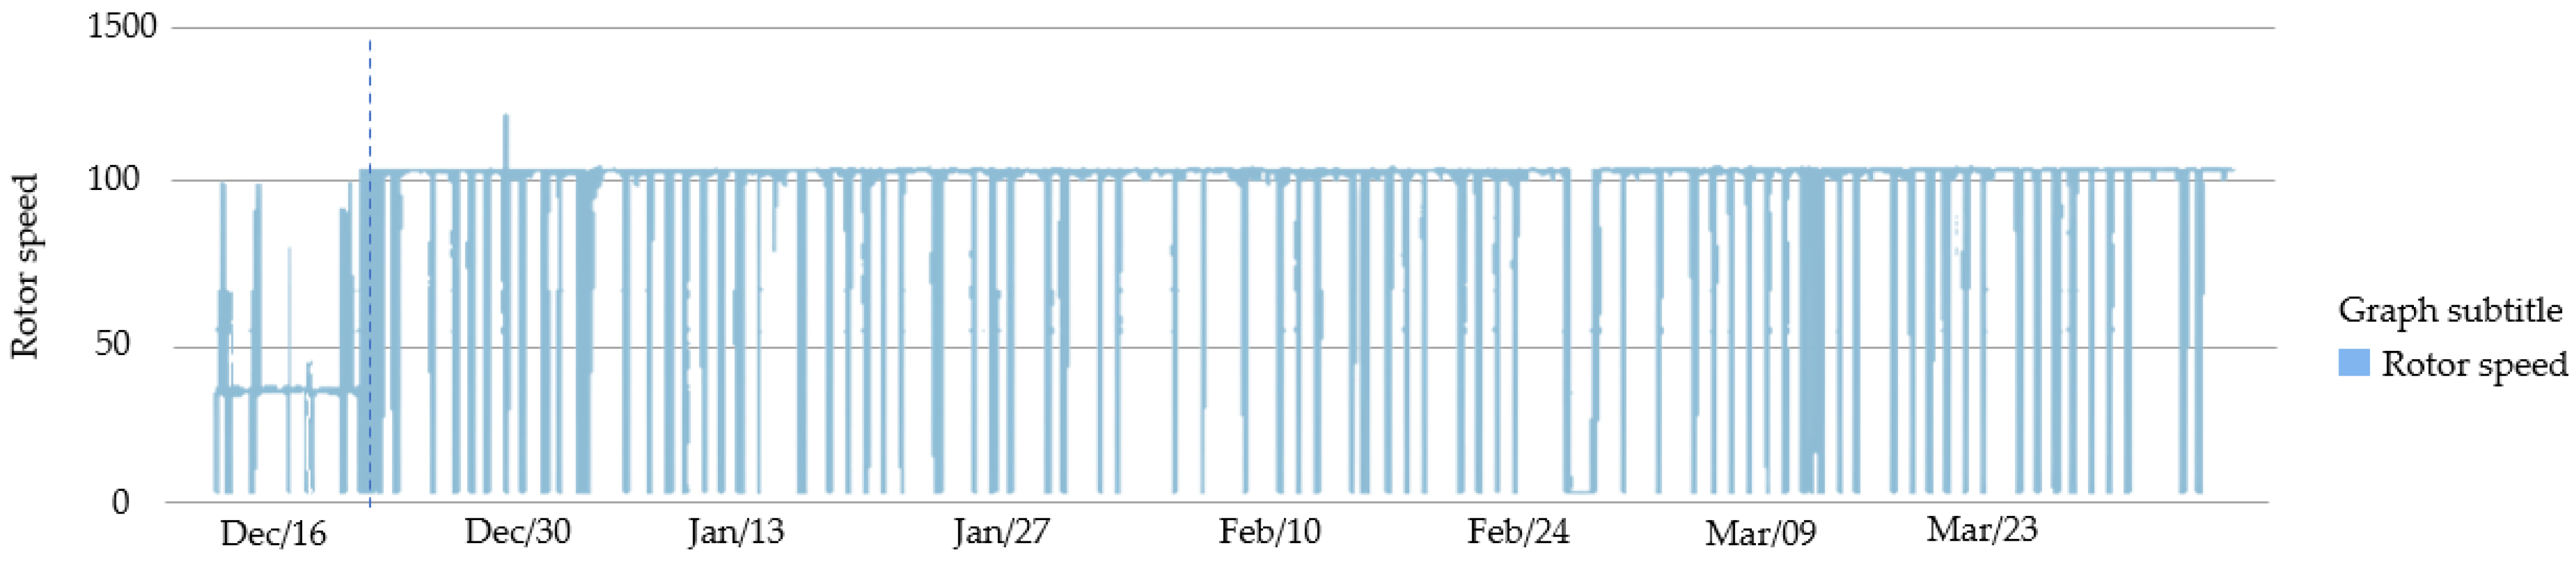
| 2.1 | Regular operation | Changing operating speed | Unsafety transport of users | 8 | Logic controller and frequency inverter malfunction | 6 | Without prevention | During corrective maintenance | 8 | 384 |
| 2.2 | Regular operation | Transmission chain breakage | Loss of operating capacity | 9 | High level of motor vibration | 5 | Maintenance every 4 months | External inspection every week | 4 | 180 |
| 2.3 | Regular operation | Misalignment of the steps | Loss of operating capacity | 9 | Clearance on the rails of the steps | 5 | Maintenance every 2 months | External inspection every week | 5 | 225 |
| 2.4 | Regular operation | High level of noise during operation | User discomfort | 7 | High level of temperature and vibration in the transmission system | 8 | Without prevention | External inspection every week | 3 | 168 |
| FMEA | ||||||||||
|---|---|---|---|---|---|---|---|---|---|---|
| # | Failure | Effect | S | Cause | O | Controls | D | RPN | ||
| Function | Failure Mode | Prevention | Detection | |||||||
| 1 | Coupling the motor to the escalator | Motor decoupling | Escalator shaking | 9 | High level of motor vibration | 5 | Full-time sensing and monitoring of vibration indices | Analysis software integrated into sensors | 2 | 90 |
| 2 | Regular operation | Motor heating | Reduced Motor shelf life | 6 | Changing the energy level and effort of the motor to operate | 6 | Full-time sensing and monitoring of temperature indices | Analysis software integrated into sensors | 2 | 72 |
| 2.1 | Regular operation | Changing operating speed | Unsafety transport of users | 8 | Logic controller and frequency inverter malfunction | 6 | Motor speed sensing and monitoring | Analysis software integrated into sensors | 2 | 96 |
| 2.2 | Regular operation | Transmission chain breakage | Loss of operating capacity | 9 | High level of motor vibration | 5 | Full-time sensing and monitoring of vibration indices | Analysis software integrated into sensors | 2 | 90 |
| 2.3 | Regular operation | Misalignment of the steps | Loss of operating capacity | 9 | Clearance on the rails of the steps | 5 | Full-time sensing and monitoring of vibration indices | Analysis software integrated into sensors | 2 | 90 |
| 2.4 | Regular operation | High level of noise during operation | User discomfort | 7 | High level of temperature and vibration in the transmission system | 8 | Full-time sensing and monitoring of vibration and temperature indices | Analysis software integrated into sensors | 2 | 112 |
Disclaimer/Publisher’s Note: The statements, opinions and data contained in all publications are solely those of the individual author(s) and contributor(s) and not of MDPI and/or the editor(s). MDPI and/or the editor(s) disclaim responsibility for any injury to people or property resulting from any ideas, methods, instructions or products referred to in the content. |
© 2023 by the authors. Licensee MDPI, Basel, Switzerland. This article is an open access article distributed under the terms and conditions of the Creative Commons Attribution (CC BY) license (https://creativecommons.org/licenses/by/4.0/).
Share and Cite
Pereira, R.C.A.; da Silva, O.S., Jr.; de Mello Bandeira, R.A.; dos Santos, M.; de Souza Rocha, C., Jr.; Castillo, C.d.S.; Gomes, C.F.S.; de Moura Pereira, D.A.; Muradas, F.M. Evaluation of Smart Sensors for Subway Electric Motor Escalators through AHP-Gaussian Method. Sensors 2023, 23, 4131. https://0-doi-org.brum.beds.ac.uk/10.3390/s23084131
Pereira RCA, da Silva OS Jr., de Mello Bandeira RA, dos Santos M, de Souza Rocha C Jr., Castillo CdS, Gomes CFS, de Moura Pereira DA, Muradas FM. Evaluation of Smart Sensors for Subway Electric Motor Escalators through AHP-Gaussian Method. Sensors. 2023; 23(8):4131. https://0-doi-org.brum.beds.ac.uk/10.3390/s23084131
Chicago/Turabian StylePereira, Ruan Carlos Alves, Orivalde Soares da Silva, Jr., Renata Albergaria de Mello Bandeira, Marcos dos Santos, Claudio de Souza Rocha, Jr., Cristian dos Santos Castillo, Carlos Francisco Simões Gomes, Daniel Augusto de Moura Pereira, and Fernando Martins Muradas. 2023. "Evaluation of Smart Sensors for Subway Electric Motor Escalators through AHP-Gaussian Method" Sensors 23, no. 8: 4131. https://0-doi-org.brum.beds.ac.uk/10.3390/s23084131