
Development and Validation of a GMP-Compliant High-Pressure Liquid Chromatography Method for the Determination of the Chemical and Radiochemical Purity of [18F]PSMA-1007, a PET Tracer for the Imaging of Prostate Cancer


Abstract
:1. Introduction
2. Results and Discussion
2.1. Recommended Acceptance Criteria for the Chemical and Radiochemical Purity of [18F]PSMA-1007 Determined by Radio-HPLC
2.2. Development and Validation of the Radio-HPLC Method
2.3. Development and Validation of the HPLC Method Concerning Chemical Purity
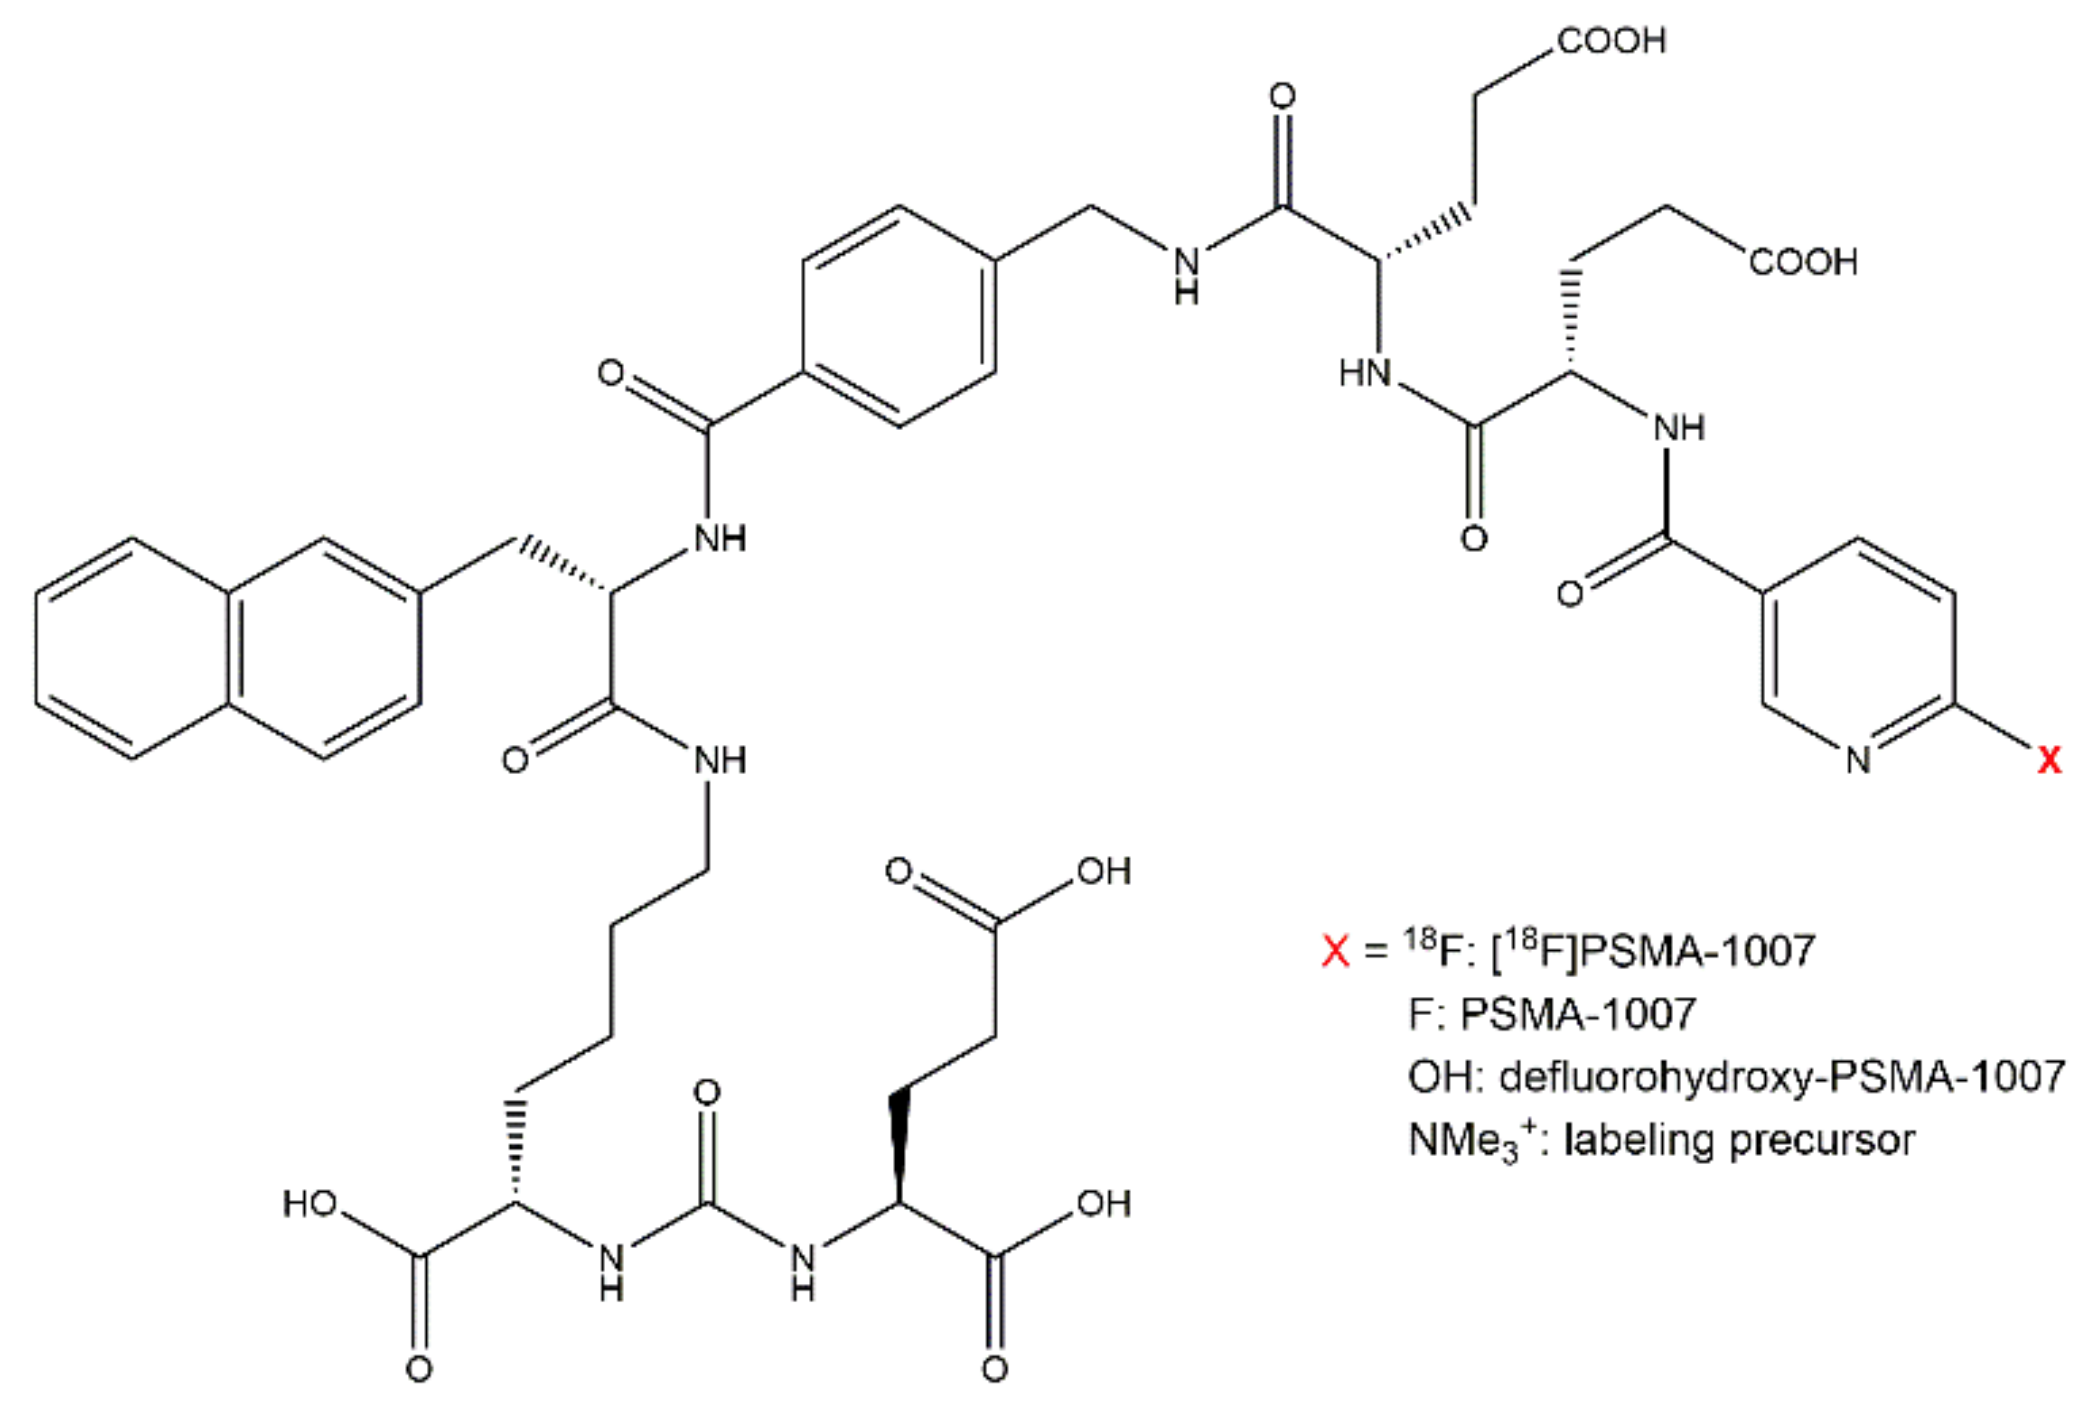
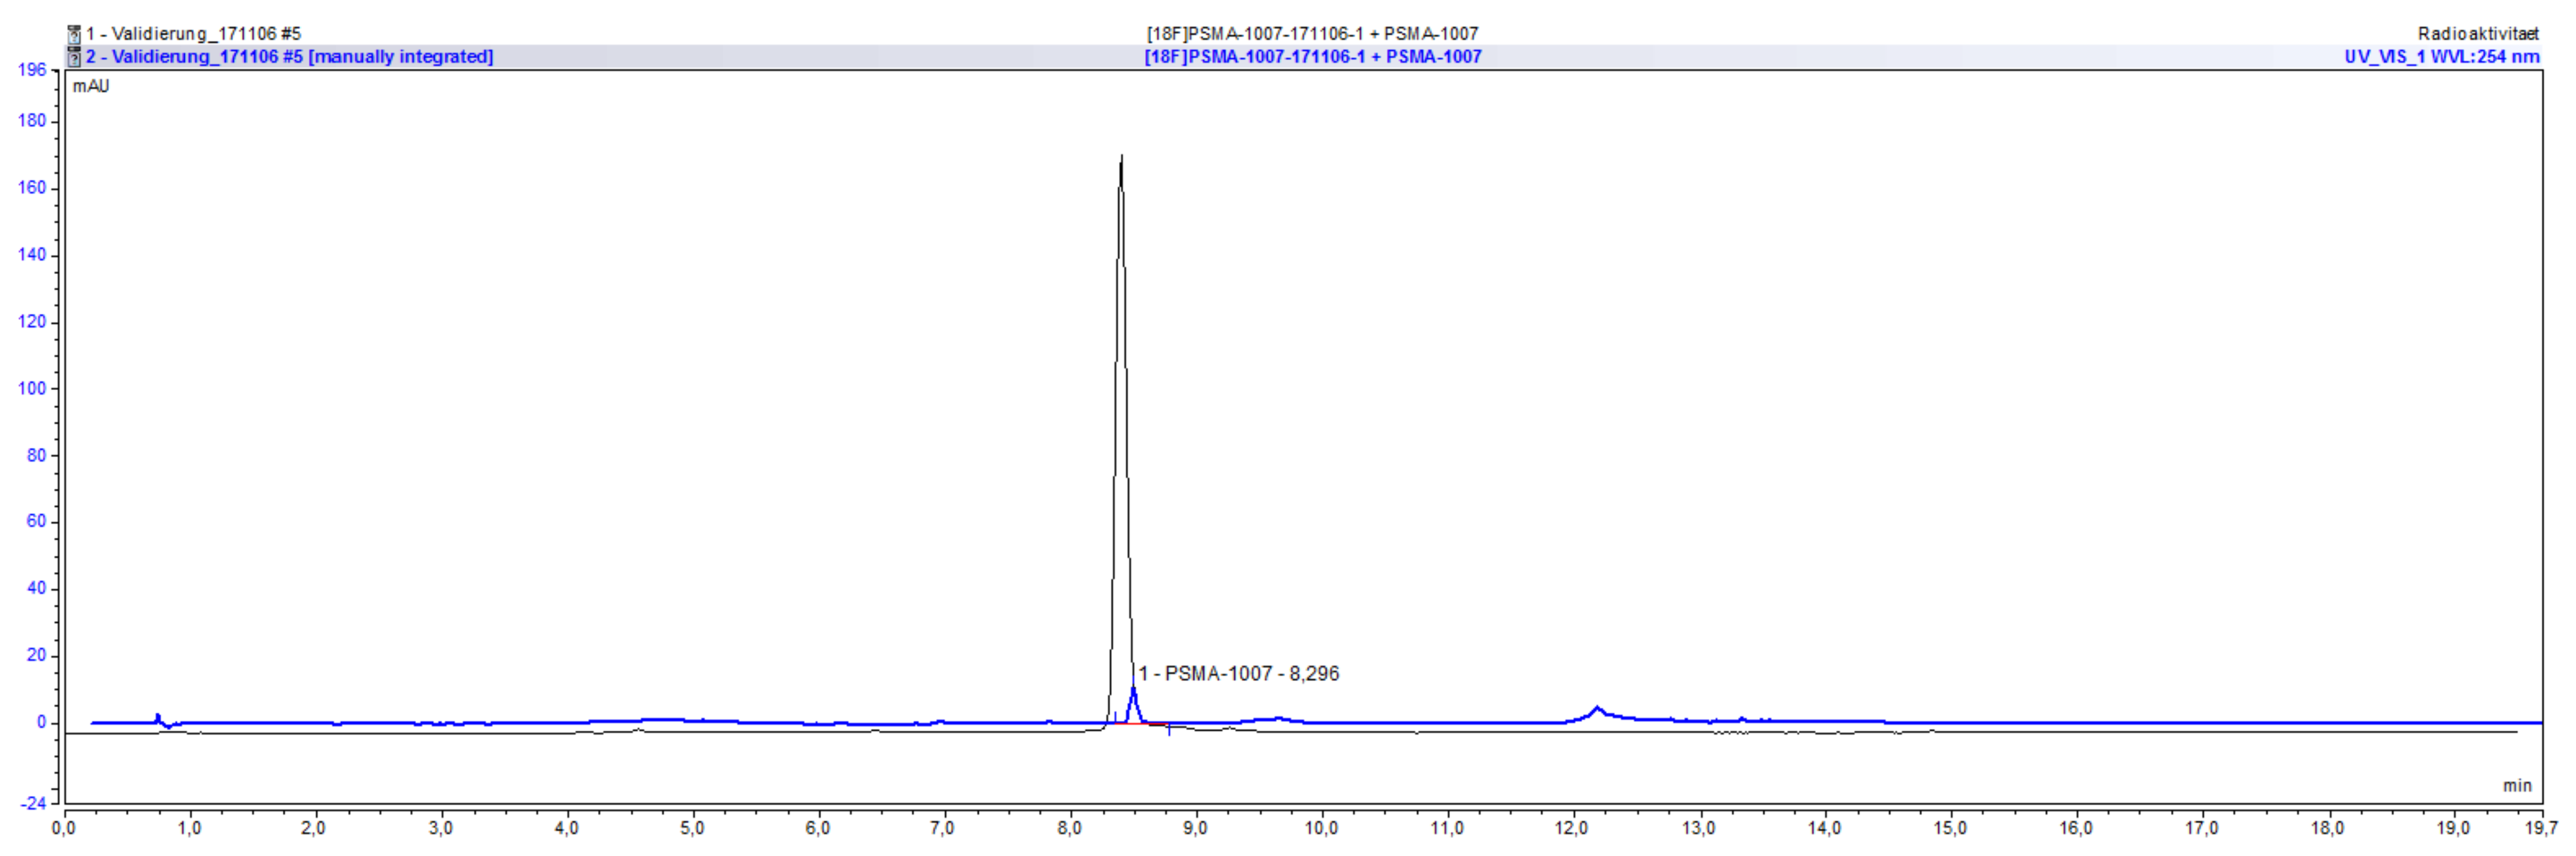
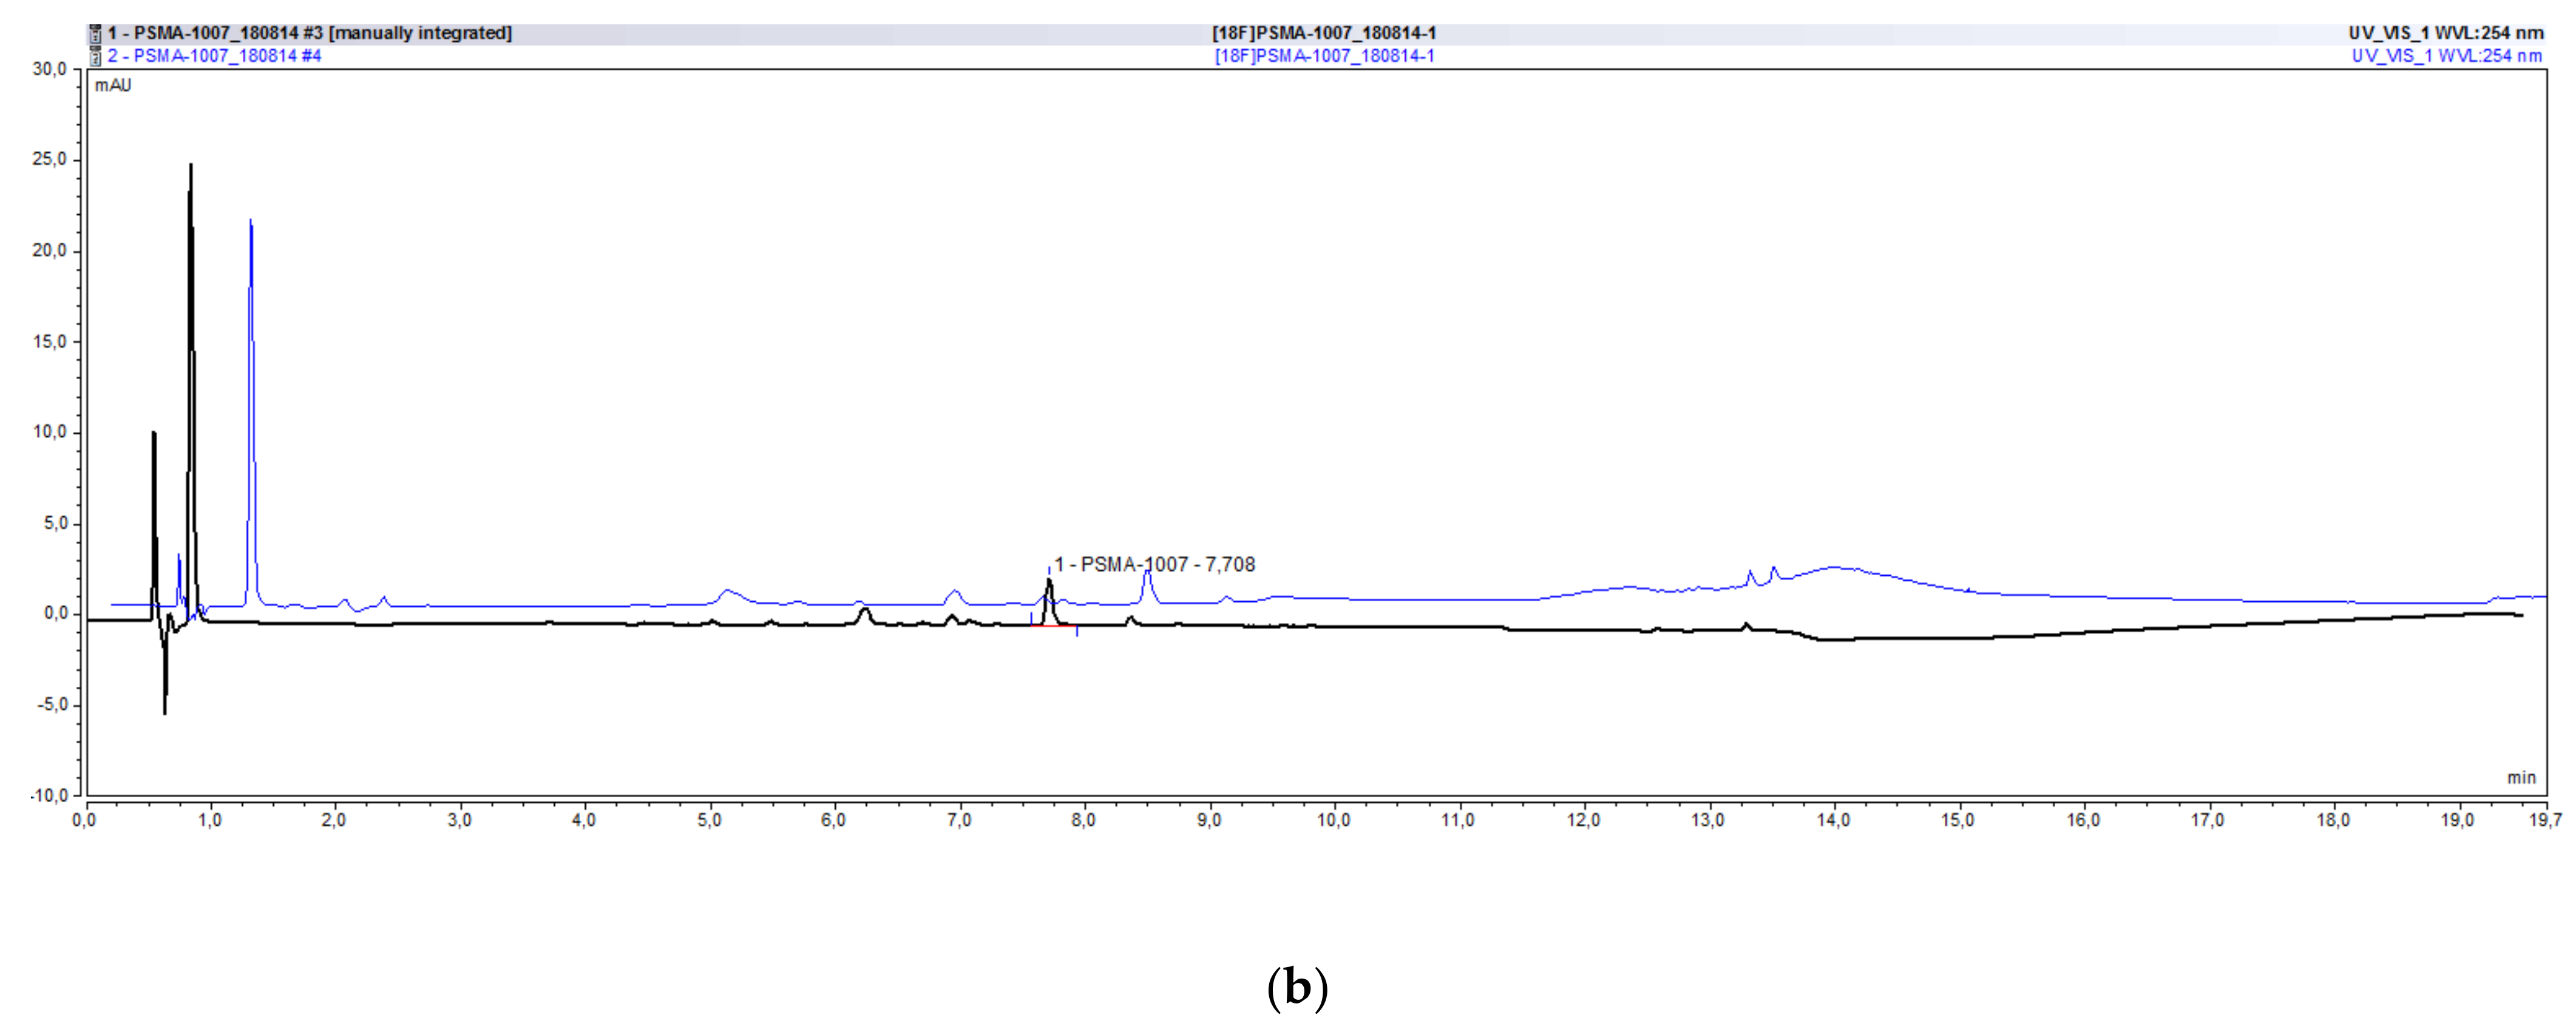
2.3.1. Chemical Identity of PSMA-1007, Possible Impurities and Specificity
2.3.2. Precision and Repeatability
2.3.3. Range and Linearity
2.3.4. Limit of Quantitation
2.3.5. Accuracy
2.4. Validation of the HPLC Method Concerning Radiochemical Purity
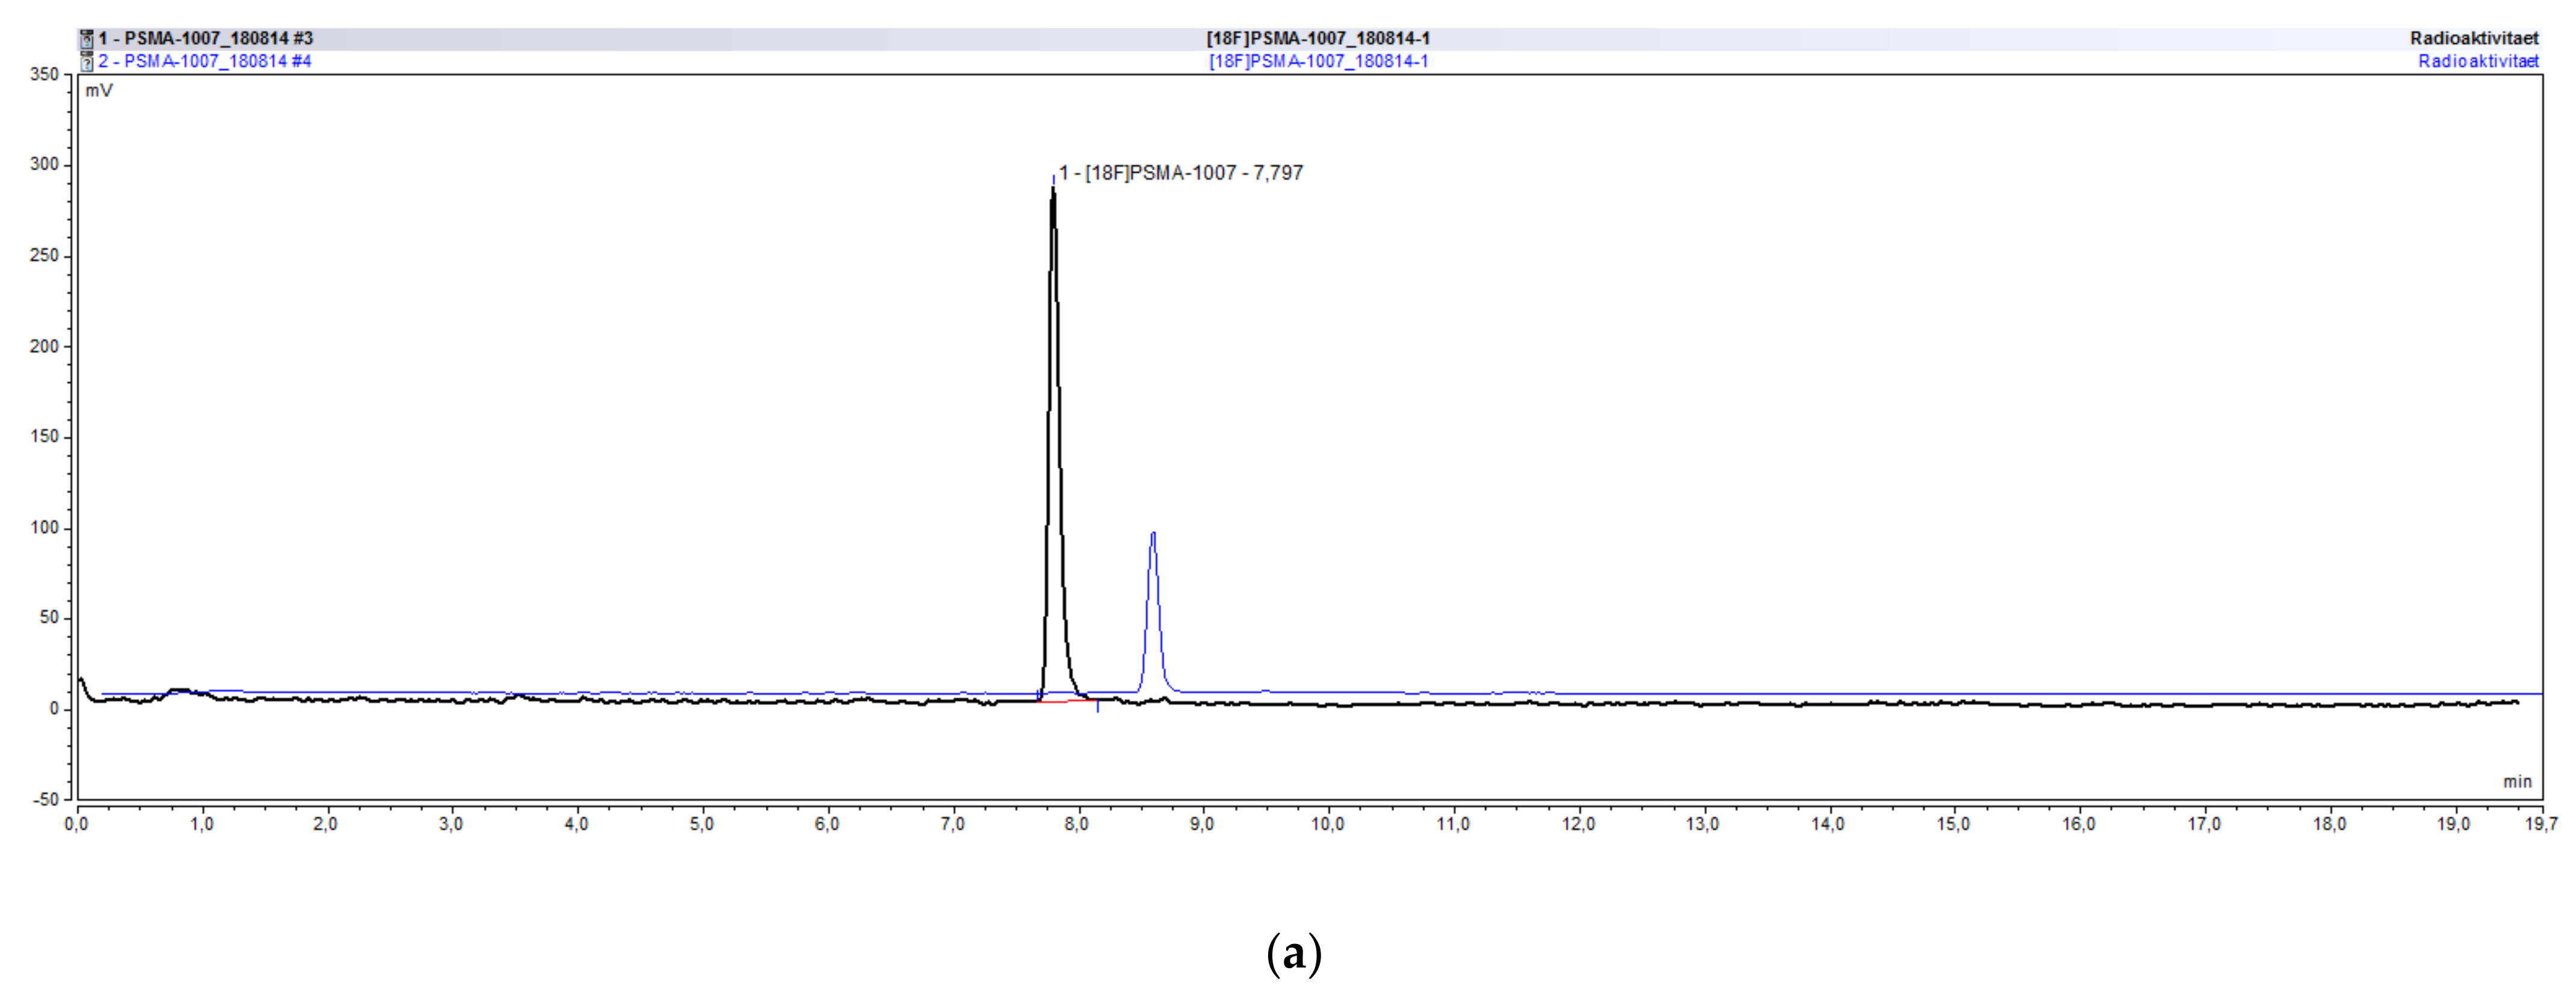
2.4.1. Radiochemical Identity of [18F]PSMA-1007, Possible Impurities and Specificity
2.4.2. Recovery
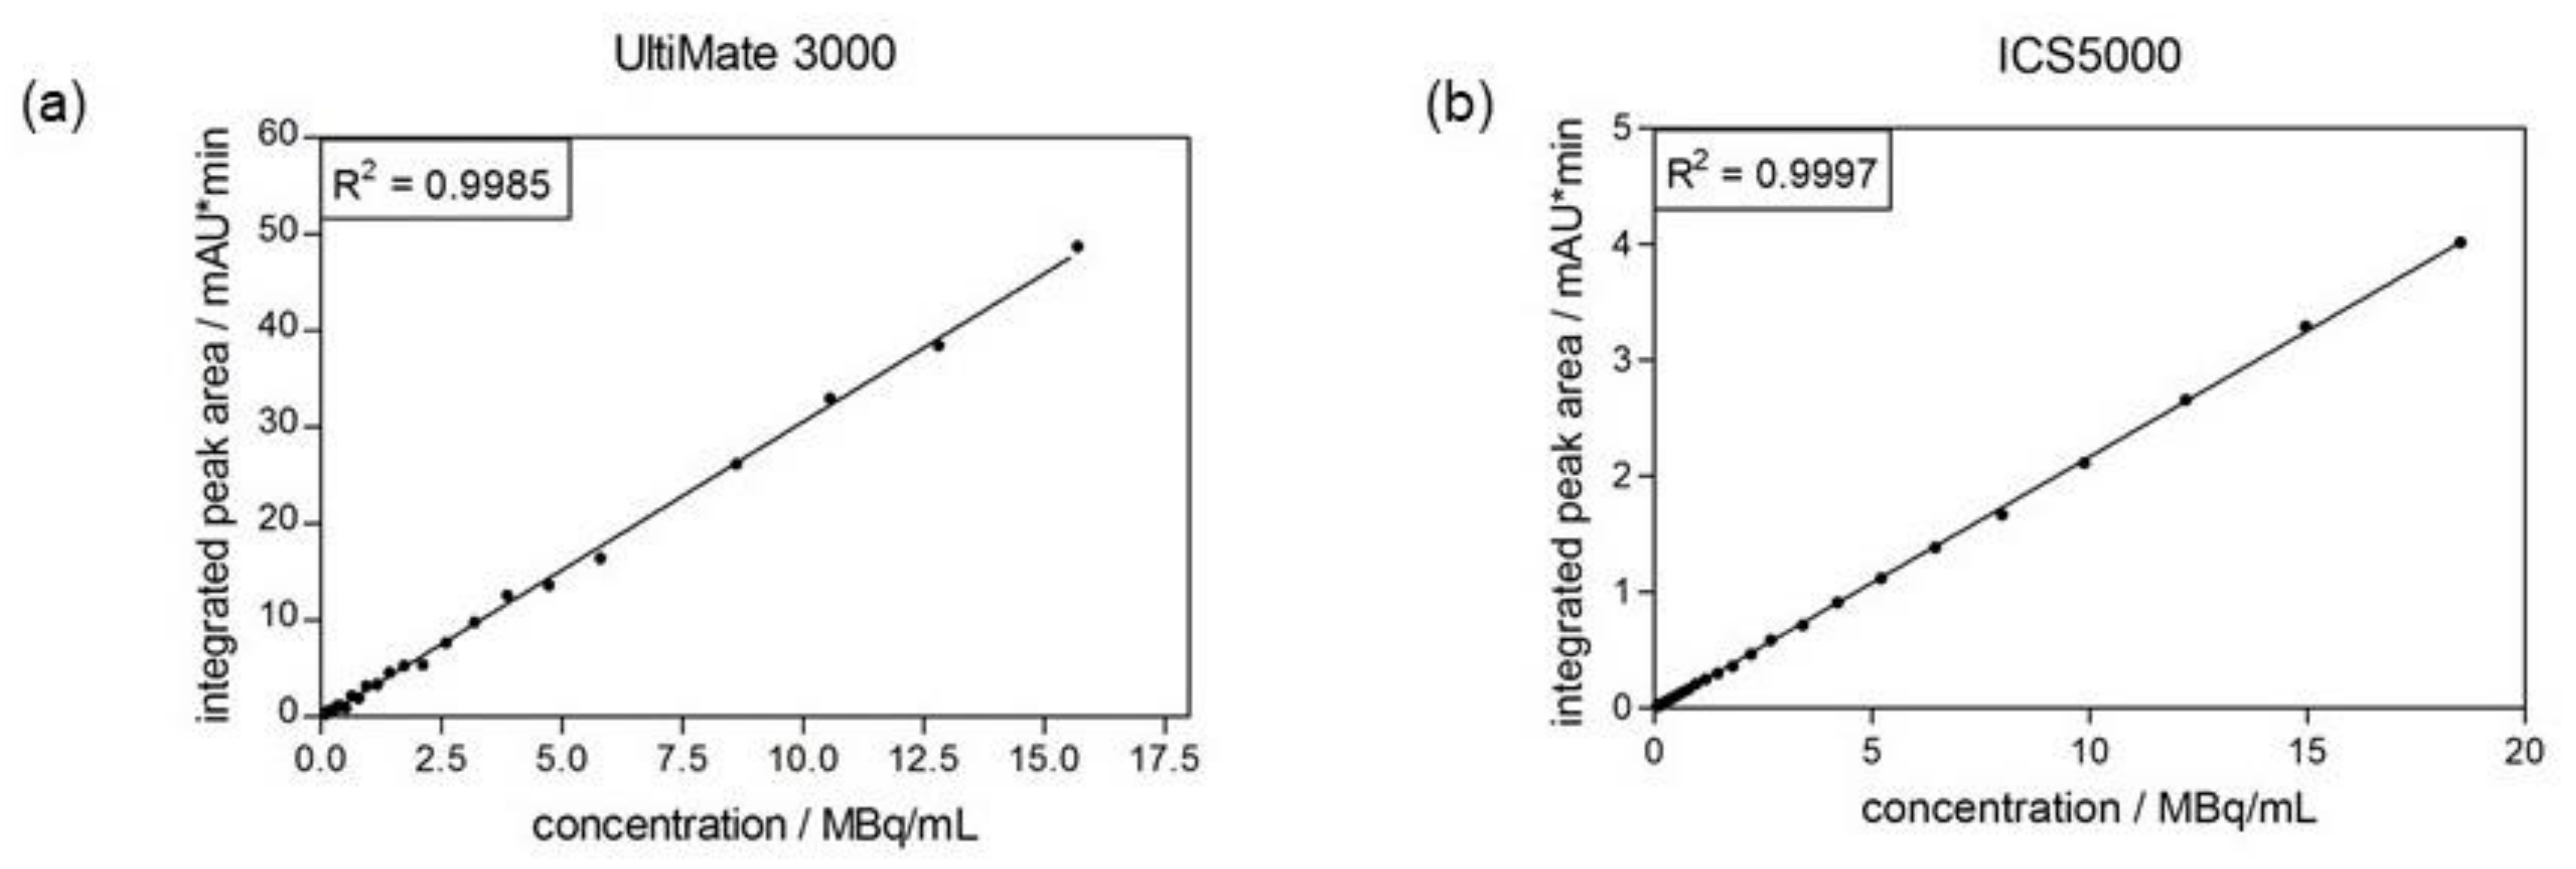
2.4.3. Linearity
2.4.4. Limit of Quantitation
2.4.5. Intermediate Precision
2.5. Comparison of Batch Results of [18F]PSMA-1007
3. Materials and Methods
3.1. Reagents and Equipment
3.2. Preparation of Reference Standard Solutions
3.3. Validation of the HPLC Method—Chemical Purity
3.3.1. Identity and Specificity
3.3.2. Precision/Repeatability
3.3.3. Linearity
3.3.4. Limit of Quantitation—LOQ
3.3.5. Accuracy
3.4. Validation of the HPLC Method—Radiochemical Purity
3.4.1. Radiochemical Identity and Specificity
3.4.2. Recovery
3.4.3. Linearity
3.4.4. Limit of Quantitation
3.4.5. Intermediate Precision
4. Conclusions
Author Contributions
Funding
Institutional Review Board Statement
Informed Consent Statement
Data Availability Statement
Conflicts of Interest
References
- Eder, M.; Schäfer, M.; Bauder-Wüst, U.; Hull, W.-E.; Wängler, C.; Mier, W.; Haberkorn, U.; Eisenhut, M. 68Ga-Complex Lipophilicity and the Targeting Property of a Urea-Based PSMA Inhibitor for PET Imaging. Bioconj. Chem. 2012, 23, 688–697. [Google Scholar] [CrossRef] [PubMed]
- Afshar-Oromieh, A.; Haberkorn, U.; Eder, M.; Eisenhut, M.; Zechmann, C.M. [68Ga]Gallium-labelled PSMA ligand as superior PET tracer for the diagnosis of prostate cancer: Comparison with 18F-FECH. Eur. J. Nucl. Med. Mol. Imaging 2012, 39, 1085–1086. [Google Scholar] [CrossRef] [PubMed]
- Eder, M.; Neels, O.; Müller, M.; Bauder-Wüst, U.; Remde, Y.; Schäfer, M.; Hennrich, U.; Eisenhut, M.; Afshar-Oromieh, A.; Haberkorn, U.; et al. Novel Preclinical and Radiopharmaceutical Aspects of [68Ga]Ga-PSMA-HBED-CC: A New PET Tracer for Imaging of Prostate Cancer. Pharmaceuticals 2014, 7, 779–796. [Google Scholar] [CrossRef] [PubMed]
- Afshar-Oromieh, A.; Holland-Letz, T.; Giesel, F.L.; Kratochwil, C.; Mier, W.; Haufe, S.; Debus, N.; Eder, M.; Eisenhut, M.; Schäfer, M.; et al. Diagnostic performance of 68Ga-PSMA-11 (HBED-CC) PET/CT in patients with recurrent prostate cancer: Evaluation in 1007 patients. Eur. J. Nucl. Med. Mol. Imaging 2017, 44, 1258–1268. [Google Scholar] [CrossRef] [PubMed] [Green Version]
- Gallium-68 Cyclotron Production. IAEA-TECDOC-1863. Available online: https://www.researchgate.net/publication/331035585_Gallium-68_Cyclotron_Production (accessed on 12 January 2021).
- Cardinale, J.; Schäfer, M.; Benešová, M.; Bauder-Wüst, U.; Leotta, K.; Eder, M.; Neels, O.C.; Haberkorn, U.; Giesel, F.L.; Kopka, K. Preclinical evaluation of 18F-PSMA-1007: A new PSMA ligand for prostate cancer imaging. J. Nucl. Med. 2017, 58, 425–431. [Google Scholar] [CrossRef] [PubMed] [Green Version]
- Giesel, F.L.; Hadaschik, B.; Cardinale, J.; Radtke, J.; Vinsensia, M.; Lehnert, W.; Kesch, C.; Tolstov, Y.; Singer, S.; Grabe, N.; et al. F-18 labelled PSMA-1007: Biodistribution, radiation dosimetry and histopathological validation of tumor lesions in prostate cancer patients. Eur. J. Nucl. Med. Mol. Imaging 2017, 44, 678–688. [Google Scholar] [CrossRef] [PubMed] [Green Version]
- Rahbar, K.; Weckesser, M.; Ahmadzadehfar, H.; Schäfers, M.; Stegger, L.; Bögemann, M. Advantage of 18F-PSMA-1007 over 68Ga-PSMA-11 PET imaging for differentiation of local recurrence vs. urinary tracer excretion. Eur. J. Nucl. Med. Mol. Imaging 2018, 45, 1076–1077. [Google Scholar] [CrossRef] [PubMed]
- Giesel, F.L.; Will, L.; Lawal, I.; Lengana, T.; Kratochwil, C.; Vorster, M.; Neels, O.; Reyneke, F.; Haberkorn, U.; Kopka, K.; et al. Intraindividual comparison of 18F-PSMA-1007 and 18F-DCFPyL PET/CT in the prospective evaluation of patients with newly diagnosed prostate carcinoma: A pilot study. J. Nucl. Med. 2018, 59, 1076–1080. [Google Scholar] [CrossRef] [PubMed] [Green Version]
- Giesel, F.L.; Knorr, K.; Spohn, F.; Will, L.; Maurer, T.; Flechsig, P.; Neels, O.; Schiller, K.; Amaral, H.; Weber, W.A.; et al. Detection efficacy of 18F-PSMA-1007 PET/CT in 251 patients with biochemical recurrence of prostate cancer after radical prostatectomy. J. Nucl. Med. 2019, 60, 362–368. [Google Scholar] [CrossRef] [PubMed] [Green Version]
- Kuten, J.; Fahoum, I.; Savin, Z.; Shamni, O.; Gitstein, G.; Hershkovitz, D.; Mabjeesh, N.J.; Yossepowitch, O.; Mishani, E.; Even-Sapir, E. Head-to-Head Comparison of 68Ga-PSMA-11 with 18F-PSMA-1007 PET/CT in Staging Prostate Cancer Using Histopathology and Immunohistochemical Analysis as a Reference Standard. J. Nucl. Med. 2020, 61, 527–532. [Google Scholar] [CrossRef] [PubMed] [Green Version]
- Dietlein, F.; Kobe, C.; Hohberg, M.; Zlatopolskiy, B.D.; Krapf, P.; Endepols, H.; Täger, P.; Hammes, J.; Heidenreich, A.; Persigehl, T.; et al. Intraindividual Comparison of 18F-PSMA-1007 with Renally Excreted PSMA Ligands for PSMA PET Imaging in Patients with Relapsed Prostate Cancer. J. Nucl. Med. 2020, 61, 729–734. [Google Scholar] [CrossRef] [PubMed] [Green Version]
- Cardinale, J.; Martin, R.; Remde, Y.; Schäfer, M.; Hienzsch, A.; Hübner, S.; Zerges, A.-M.; Marx, H.; Hesse, R.; Weber, K.; et al. Procedures for the GMP-Compliant Production and Quality Control of [18F]PSMA-1007: A Next Generation Radiofluorinated Tracer for the Detection of Prostate Cancer. Pharmaceuticals 2017, 10, 77. [Google Scholar] [CrossRef] [PubMed] [Green Version]
- Shamni, O.; Nebeling, B.; Grievink, H.; Mishani, E. Fine-tuning of the automated [18F]PSMA-1007 radiosynthesis. J. Label. Compd. Radiopharm. 2019, 62, 252–258. [Google Scholar] [CrossRef] [PubMed]
- Naka, S.; Watabe, T.; Kurimoto, K.; Uemura, M.; Soeda, F.; Neels, O.C.; Kopka, K.; Tatsumi, M.; Kato, H.; Nonomura, N.; et al. Automated [18F]PSMA-1007 production by a single use cassette-type synthesizer for clinical examination. EJNMMI Radiopharm. Chem. 2020, 5, 18. [Google Scholar] [CrossRef] [PubMed]
- European Pharmacopeia, 10th Edition. 2020. Available online: https://www.edqm.eu/en/european-pharmacopoeia-ph-eur-10th-edition (accessed on 8 September 2020).
- Monograph “PSMA-1007 (18F) Injection” (Monograph Number: 07/2021:3116). European Pharmacopeia, 10th Edition. 2020. Available online: https://www.edqm.eu/en/european-pharmacopoeia-ph-eur-10th-edition (accessed on 19 January 2021).
- CPMP/ICH/381/95—ICH harmonized tripartite guideline—Validation of Analytical Procedures: Text and Methodology Q2(R1). 2006. Available online: https://www.ema.europa.eu/en/ich-q2-r1-validation-analytical-procedures-text-methodology (accessed on 8 September 2020).
- Gillings, N.; Todde, S.; Behe, M.; Decristoforo, C.; Elsinga, P.; Ferrari, V.; Hjelstuen, O.; Kolenc Peitl, P.; Koziorowski, J.; Laverman, P.; et al. EANM guideline on the validation of analytical methods for radiopharmaceuticals. EJNMMI Radiopharm. Chem. 2020, 5, 7. [Google Scholar] [CrossRef] [PubMed]
- Monograph “Fluoroethyl-L-tyrosine (18F) Injection” (Monograph Number: 2466), European Pharmacopeia 10th Edition. 2020. Available online: https://www.edqm.eu/en/european-pharmacopoeia-ph-eur-10th-edition (accessed on 8 September 2020).
- Operator’s Manual Autosampler ICS5000: Dionex AS-AP Operator’s Manual, Thermo Fisher. 2012. Available online: http://tools.thermofisher.com/content/sfs/manuals/Man-065361-AS-AP-Autosampler-Man065361-EN.pdf (accessed on 14 September 2020).
- Operator’s Manual Autosampler Ultimate 3000: WPS-3000 Autosamplers Operating Instructions, Thermo Fisher. 2013. Available online: https://assets.thermofisher.com/TFS-Assets/CMD/manuals/MAN-LC-WPS-3000SL-RS-Operation-Sep13-DOC4828-2250-1-8.pdf (accessed on 14 September 2020).


| Parameter | Acceptance Criteria |
|---|---|
| Chemical Purity | PSMA-1007: ≤0.1 mg/Vmax # ≙ 10 µg/mL |
| Any other impurity: ≤ area of reference peak * | |
| Sum of all impurities: ≤ 5 × area of reference peak * | |
| Disregard limit for peak areas ≤ 0.3 × area of reference peak * | |
| Radiochemical Purity | ≥95% |
| Column | Precolumn: Chromolith Performance RP-18e (10 × 4.6 mm) (Merck; Germany) Column: Chromolith Perfomance RP-18e (100 × 4.6 mm) (Merck; Germany) |
| Column temperature | Room temperature |
| Injection volume | 25 µL |
| Detector 1 | UV detector @ 254 nm |
| Detector 2 | Radioactivity detector |
| Mobile Phase | A: Acetonitrile, B: 0.1% TFA in water |
| Gradient | Start 5% A; till 1.5 min increasing to 15% A; till 10.5 min to 35 % A; till 13 min to 95% A; till 19 min back to 5% A |
| Flow rate | 3 mL/min |
| Run time | 19 min |
| Column | Solid core octadecylsilyl silica gel for chromatography (2.7 µ) |
| Column temperature | 30 °C |
| Injection volume | 20 µL |
| Detector 1 | UV detector @ 225 nm |
| Detector 2 | Radioactivity detector |
| Mobile Phase | A: Acetonitrile, B: sodium dihydrogen phosphate (3.12 g/L) in water (pH 2.5 with phosphoric acid) |
| Gradient | Start 23% A; 2–14 min increasing to 30% A; 14–17 min increasing to 60% A; till 21 min remaining at 60% A |
| Flow rate | 1.3 mL/min |
| Run time | >21 min (≈25 min) |
| Chemical Purity (UV detector) | |
|---|---|
| Parameter | Acceptance criteria |
| Specificity | Resolution > 2.0 |
| Precision/Repeatability | RSD < 2% |
| Linearity | R2 ≥ 0.99 |
| LOQ | S/N > 10 |
| Accuracy | Average bias < 5% |
| Radiochemical Purity (radiodetector) | |
| Parameter | Acceptance criteria |
| Identity | Difference tR ≤ 5% |
| Specificity | Resolution > 1.5 |
| Recovery | > 95% |
| Linearity | R2 ≥ 0.99 |
| LOQ | S/N > 10 |
| Intermediate Precision | RSD < 2% |
| UltiMate 3000 | ||
|---|---|---|
| Concentration PSMA-1007 µg/mL | Integrated Peak Areas Average ± SD mAU*min | RSD% |
| 8 | 0.9313 ± 0.0024 | 0.26 |
| 9 | 1.0632 ± 0.0010 | 0.10 |
| 10 | 1.1667 ± 0.0024 | 0.21 |
| 11 | 1.2842 ± 0.0003 | 0.03 |
| 12 | 1.3992 ± 0.0025 | 0.18 |
| ICS5000 | ||
| Concentration PSMA-1007 µg/mL | Integrated Peak Areas Average ± SD mAU*min | RSD% |
| 8 | 0.3781 ± 0.0006 | 0.17 |
| 9 | 0.4493 ± 0.0031 | 0.70 |
| 10 | 0.4851 ± 0.0019 | 0.38 |
| 11 | 0.5445 ± 0.0018 | 0.34 |
| 12 | 0.5965 ± 0.0020 | 0.34 |
| UltiMate 3000 | ||
|---|---|---|
| Concentration PSMA-1007 µg/mL | Integrated Peak Areas Average ± SD mAU*min | RSD% |
| 8 | 0.9085 ± 0.0025 | 0.27 |
| 9 | 1.0229 ± 0.0021 | 0.20 |
| 10 | 1.1400 ± 0.0019 | 0.17 |
| 11 | 1.2495 ± 0.0011 | 0.09 |
| 12 | 1.3703 ± 0.0058 | 0.42 |
| ICS5000 | ||
| Concentration PSMA-1007 µg/mL | Integrated Peak Areas Average ± SD mAU*min | RSD% |
| 8 | 0.7677 ± 0.0062 | 0.80 |
| 9 | 0.8748 ± 0.0050 | 0.57 |
| 10 | 0.9807 ± 0.0108 | 1.10 |
| 11 | 1.0917 ± 0.0047 | 0.43 |
| 12 | 1.1932 ± 0.0066 | 0.55 |
| Concentration PSMA-1007 µg/mL | UltiMate 3000 | ICS5000 | ||
|---|---|---|---|---|
| NaCl | PBS | NaCl | PBS | |
| 8 | 239 | 565 | 64 | 248 |
| 3 | 91 | 91 | 38 | 143 |
| 1.5 | 47 | 39 | 17 | 53 |
| 0.75 | 23 | 18 | 9.5 | 22 |
| 0.3 | 7.2 | 6.9 | - | 9.6 |
| UltiMate 3000 | ||
|---|---|---|
| Concentration PSMA-1007 µg/mL | Calculated Amount Average ± SD µg/mL | Average bias% |
| 8 | 7.94 ± 0.02 | −0.71 |
| 9 | 9.09 ± 0.01 | 0.97 |
| 10 | 9.98 ± 0.02 | −0.19 |
| 11 | 10.99 ± 0.001 | −0.05 |
| 12 | 11.99 ± 0.02 | −0.06 |
| ICS5000 | ||
| Concentration PSMA-1007 µg/mL | Calculated Amount Average ± SD µg/mL | Average bias% |
| 8 | 7.90 ± 0.01 | −1.26 |
| 9 | 9.23 ± 0.07 | 2.53 |
| 10 | 9.90 ± 0.02 | −1.04 |
| 11 | 11.00 ± 0.03 | 0.03 |
| 12 | 11.97 ± 0.02 | −0.22 |
| UltiMate 3000 | ||
|---|---|---|
| Concentration PSMA-1007 µg/mL | Calculated Amount Average ± SD µg/mL | Average Bias% |
| 8 | 8.00 ± 0.02 | 0.04 |
| 9 | 9.00 ± 0.02 | −0.03 |
| 10 | 10.02 ± 0.02 | 0.15 |
| 11 | 10.97 ± 0.01 | −0.27 |
| 12 | 11.98 ± 0.05 | −0.15 |
| ICS5000 | ||
| Concentration PSMA-1007 µg/mL | Calculated Amount Average ± SD µg/mL | Average Bias% |
| 8 | 8.00 ± 0.06 | −0.03 |
| 9 | 9.00 ± 0.06 | −0.01 |
| 10 | 9.99 ± 0.10 | −0.09 |
| 11 | 11.03 ± 0.04 | 0.28 |
| 12 | 11.98 ± 0.06 | −0.16 |
| Batch | Amount PSMA-1007/µg/mL | RCP/% | ||
|---|---|---|---|---|
| UltiMate 3000 | ICS5000 | UltiMate 3000 | ICS5000 | |
| 180129-1 | 6.42 | 6.28 | 99.23 | 99.25 |
| 180219-1 | 7.99 | 8.13 | 99.00 | 98.99 |
| 180305-1 | 11.05 | 10.56 | 99.06 | 99.03 |
| 180312-1 | 10.03 | 10.01 | 99.19 | 99.09 |
| 180314-1 | 9.14 | 9.10 | 99.12 | 99.22 |
Publisher’s Note: MDPI stays neutral with regard to jurisdictional claims in published maps and institutional affiliations. |
© 2021 by the authors. Licensee MDPI, Basel, Switzerland. This article is an open access article distributed under the terms and conditions of the Creative Commons Attribution (CC BY) license (http://creativecommons.org/licenses/by/4.0/).
Share and Cite
Katzschmann, I.; Marx, H.; Kopka, K.; Hennrich, U. Development and Validation of a GMP-Compliant High-Pressure Liquid Chromatography Method for the Determination of the Chemical and Radiochemical Purity of [18F]PSMA-1007, a PET Tracer for the Imaging of Prostate Cancer. Pharmaceuticals 2021, 14, 188. https://0-doi-org.brum.beds.ac.uk/10.3390/ph14030188
Katzschmann I, Marx H, Kopka K, Hennrich U. Development and Validation of a GMP-Compliant High-Pressure Liquid Chromatography Method for the Determination of the Chemical and Radiochemical Purity of [18F]PSMA-1007, a PET Tracer for the Imaging of Prostate Cancer. Pharmaceuticals. 2021; 14(3):188. https://0-doi-org.brum.beds.ac.uk/10.3390/ph14030188
Chicago/Turabian StyleKatzschmann, Ines, Heike Marx, Klaus Kopka, and Ute Hennrich. 2021. "Development and Validation of a GMP-Compliant High-Pressure Liquid Chromatography Method for the Determination of the Chemical and Radiochemical Purity of [18F]PSMA-1007, a PET Tracer for the Imaging of Prostate Cancer" Pharmaceuticals 14, no. 3: 188. https://0-doi-org.brum.beds.ac.uk/10.3390/ph14030188