
Pretargeted Imaging beyond the Blood–Brain Barrier—Utopia or Feasible?

 , , , ,
Abstract
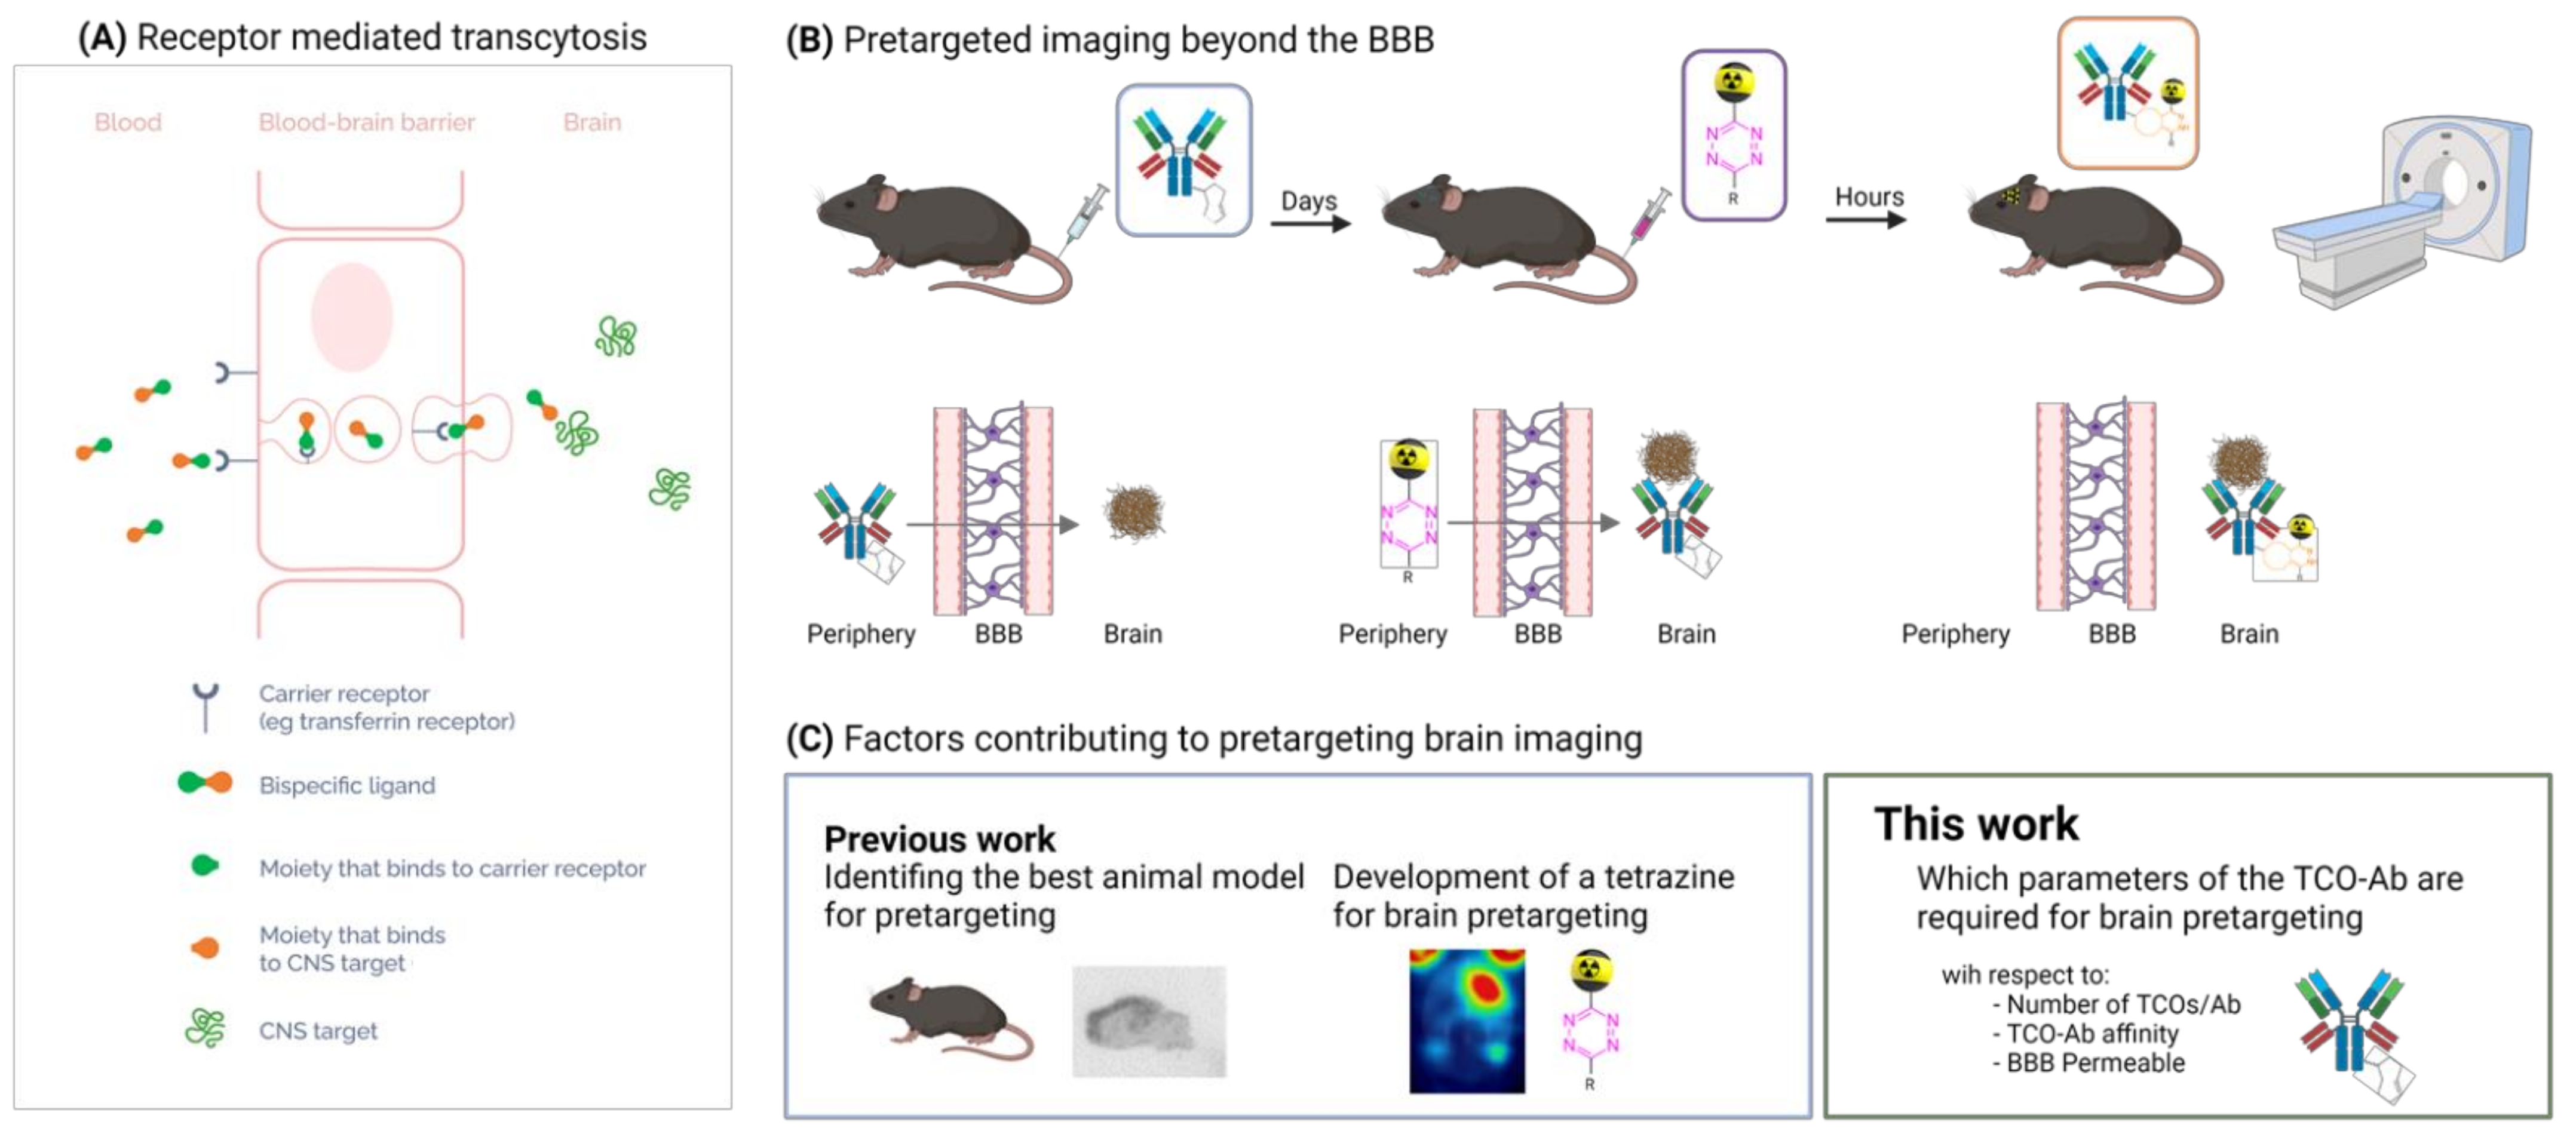
:1. Introduction
2. Results and Discussion
2.1. Theoretical Considerations to Determine the Minimum Required TCO Concentration
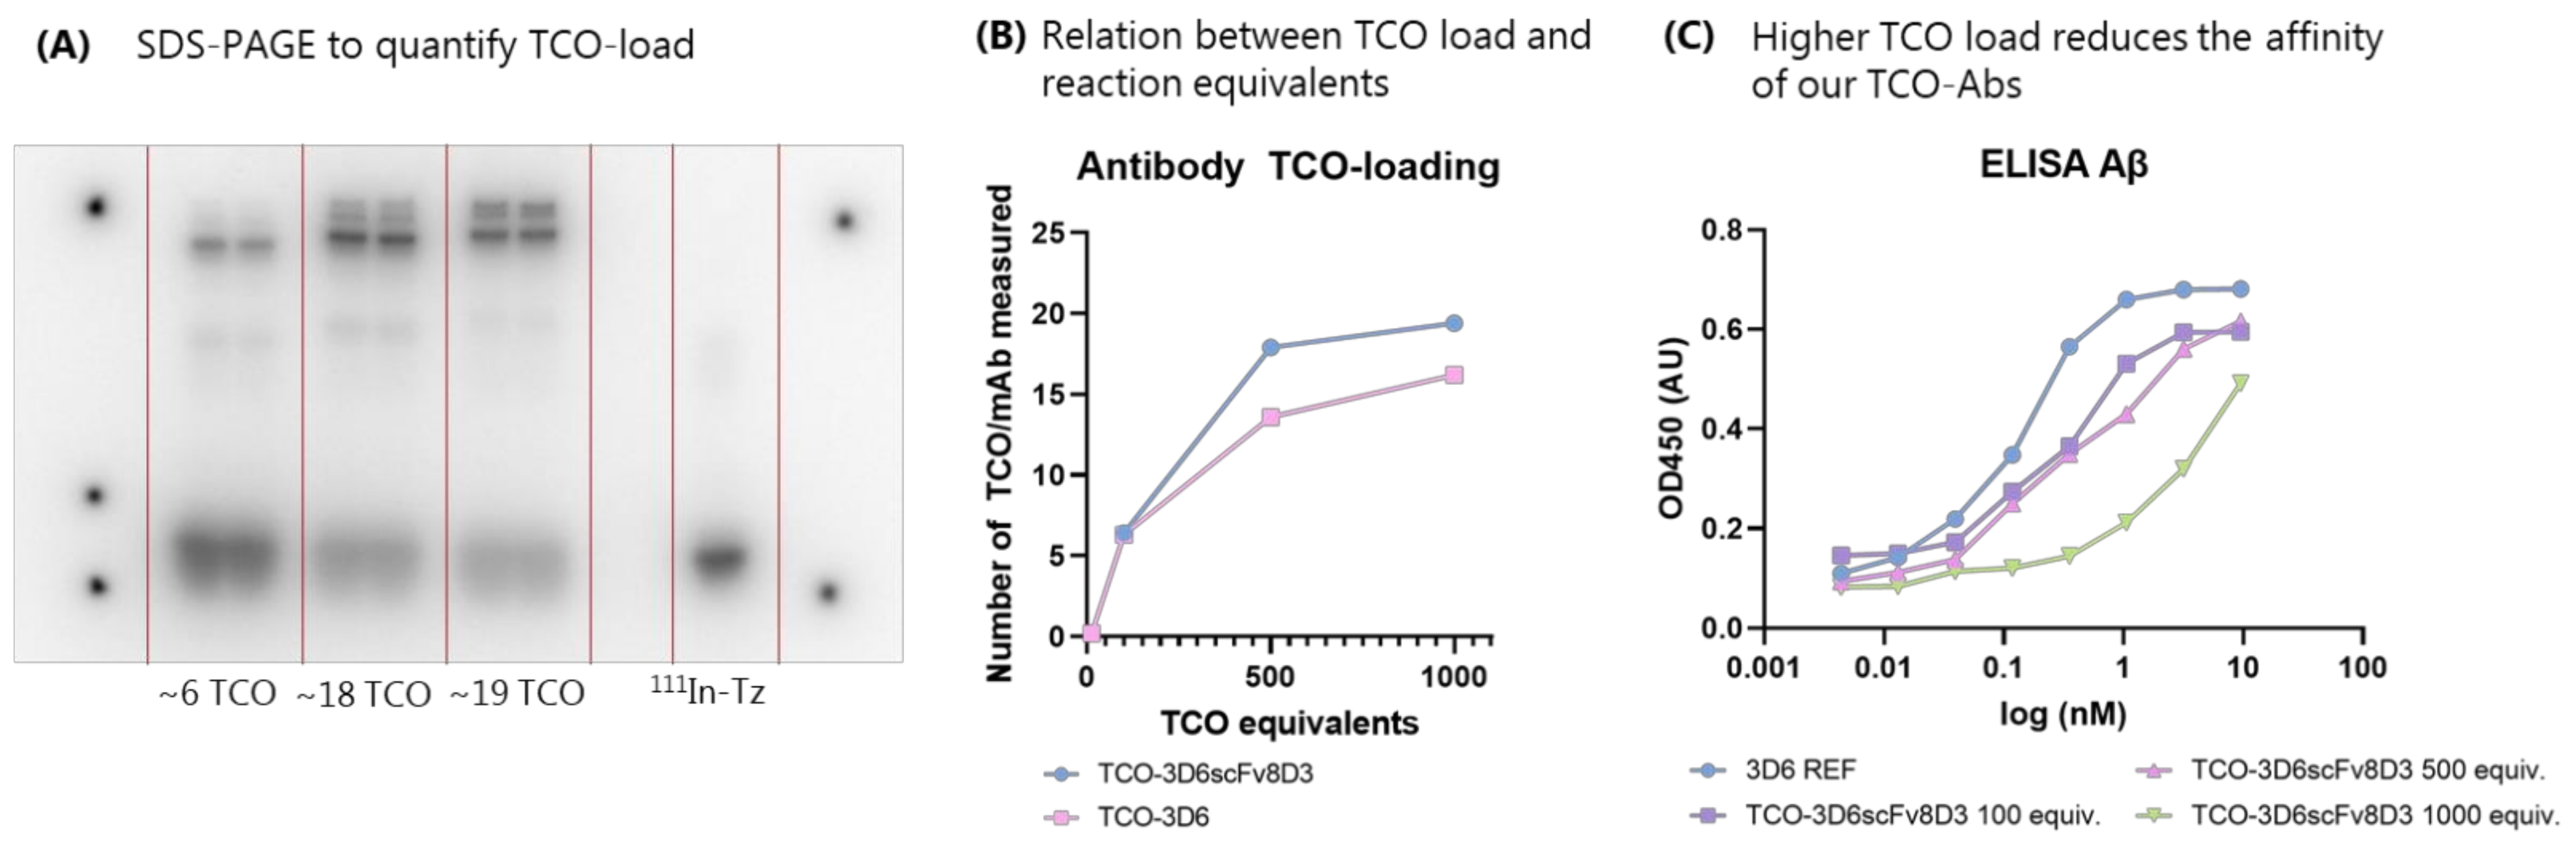
2.2. Antibody Modifications and TCO Quantification (NTCO)
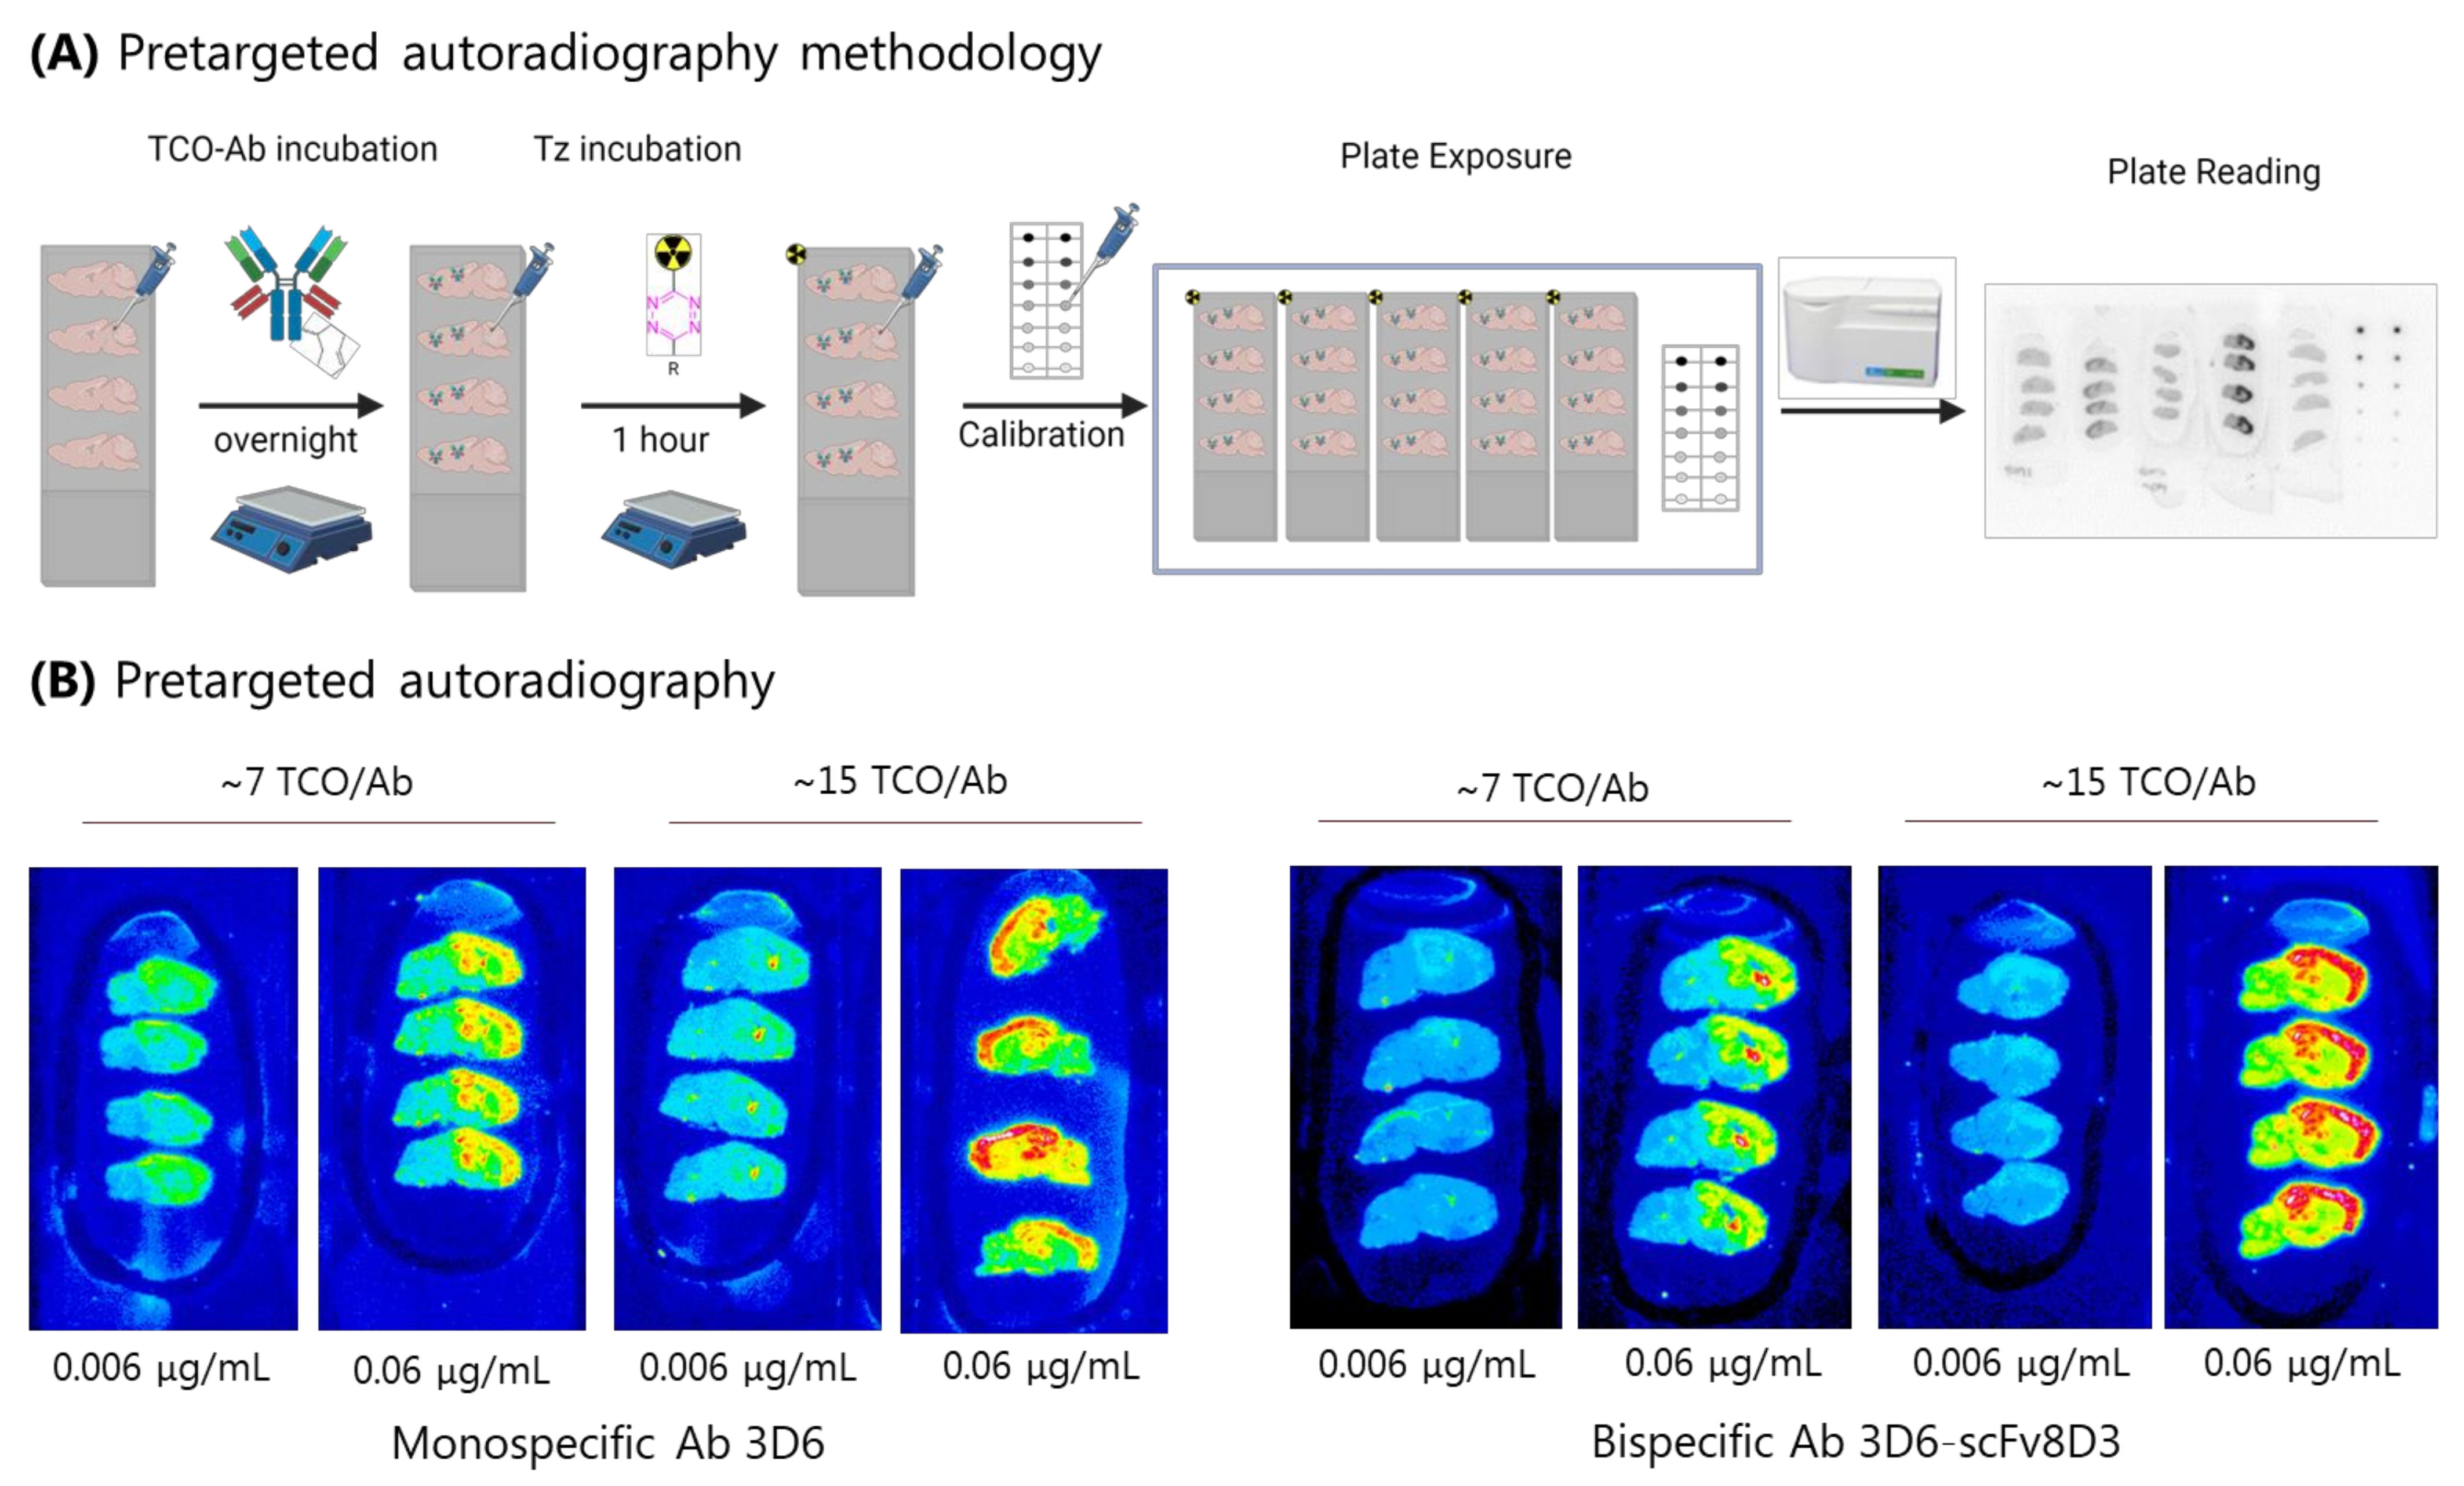
2.3. Pretargeted Autoradiography to Determine the Minimum Amount of Abs () Required for Sufficient Imaging Contrast
2.4. Determination of TCO-Abs () Bound to Tissue and Tissue Volume (vtiss)
2.5. Minimum Required TCO Concentration In Vitro
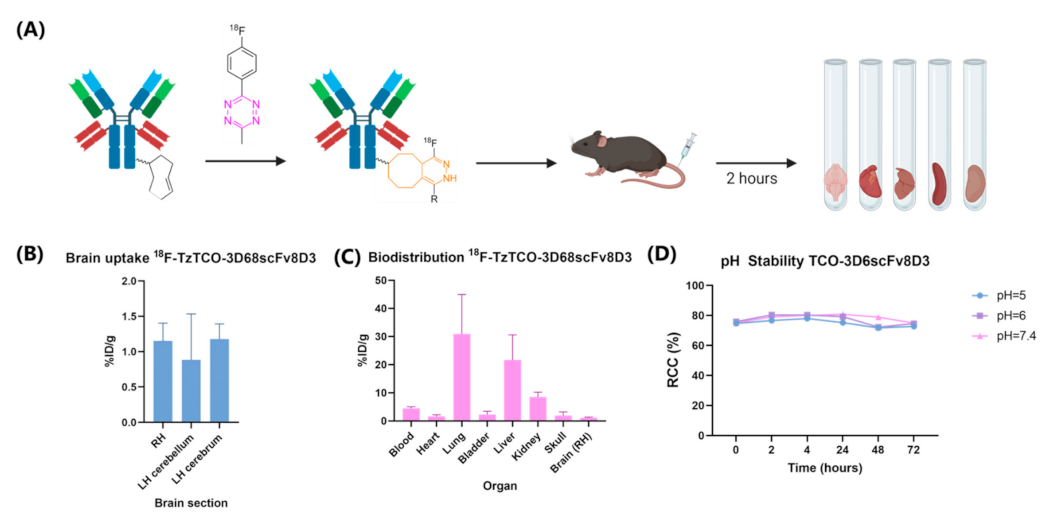
2.6. Biodistribution TCO-3D6scFv8D3–Determination of Abtraffic
2.7. Is Pretargeting Feasible? Abmin vs. Abtraffic
2.8. pH Stability of TCOs Conjugated to 3D6scFv8D3
3. Materials and Methods
3.1. Materials
3.2. General Information
3.3. Radiolabeling of Tz [18F]1
3.4. Radiolabeling of TCO-3D6scFv8D3 with Tz [18F]1
3.5. Radiolabeling of Tz [111In]2
3.6. Radiolabeling of TCO-3D6scFv8D3 with Tz [111In]2
4. Pretargeted Autoradiography
5. Determination of TCO-Ab Bound to Tissue
6. Ex Vivo Biodistribution of [18F]3D6scFv8D3
6.1. Animals
6.2. Animal Injection and Ex Vivo Biodistribution Procedure
7. TCO Stability in TCO-3D6scFv8D3 at Different pH
8. Conclusions
Supplementary Materials
Author Contributions
Funding
Institutional Review Board Statement
Informed Consent Statement
Data Availability Statement
Acknowledgments
Conflicts of Interest
References
- Khalil, M.M.; Tremoleda, J.L.; Bayomy, T.B.; Gsell, W. Molecular SPECT Imaging: An Overview. Int. J. Mol. Imaging 2011, 2011, 796025. [Google Scholar] [CrossRef] [PubMed]
- Basu, S.; Kwee, T.C.; Surti, S.; Akin, E.A.; Yoo, D.; Alavi, A. Fundamentals of PET and PET/CT imaging. Ann. N. Y. Acad. Sci. 2011, 1228, 1–18. [Google Scholar] [CrossRef] [PubMed]
- Piel, M.; Vernaleken, I.; Rösch, F. Positron emission tomography in CNS drug discovery and drug monitoring. J. Med. Chem. 2014, 57, 9232–9258. [Google Scholar] [CrossRef] [PubMed]
- Ametamey, S.M.; Honer, M.; Schubiger, P.A. Molecular imaging with PET. Chem. Rev. 2008, 108, 1501–1516. [Google Scholar] [CrossRef] [PubMed]
- Theek, B.; Rizzo, L.Y.; Ehling, J.; Kiessling, F.; Lammers, T. The theranostic path to personalized nanomedicine. Clin. Transl. Imaging 2014, 2, 67–76. [Google Scholar] [CrossRef] [PubMed]
- Fowler, J.S.; Volkow, N.D.; Wang, G.J.; Ding, Y.S.; Dewey, S.L. PET and drug research and development. J. Nucl. Med. 1999, 40, 1154–1163. [Google Scholar] [CrossRef] [PubMed]
- Hicks, R.J.; Dorow, D.; Roselt, P. PET tracer development—A tale of mice and men. Cancer Imaging 2006, 6, 102–106. [Google Scholar] [CrossRef]
- Kristensen, J.L.; Herth, M.M. In Vivo Imaging in Drug Discovery. In Textbook of Drug Design and Discovery; CRC Press: Boca Raton, FL, USA, 2017; pp. 119–135. [Google Scholar]
- Lewis, J.S.; Windhorst, A.D.; Zeglis, B.M. Radiopharmaceutical Chemistry; Springer: Berlin/Heidelberg, Germany, 2019; ISBN 9781617799884. [Google Scholar]
- Armstrong, M.J.; Okun, M.S. Diagnosis and Treatment of Parkinson Disease: A Review. J. Am. Med. Assoc. 2020, 323, 548–560. [Google Scholar] [CrossRef]
- Stoessl, A.J. Neuroimaging in the early diagnosis of neurodegenerative disease. Transl. Neurodegener. 2012, 1, 5. [Google Scholar]
- Sehlin, D.; Fang, X.T.; Cato, L.; Antoni, G.; Lannfelt, L.; Syvänen, S. Antibody-based PET imaging of amyloid beta in mouse models of Alzheimer’s disease. Nat. Commun. 2016, 7, 10759. [Google Scholar] [CrossRef]
- Sehlin, D.; Fang, X.T.; Meier, S.R.; Jansson, M.; Syvänen, S. Pharmacokinetics, biodistribution and brain retention of a bispecific antibody-based PET radioligand for imaging of amyloid-β. Sci. Rep. 2017, 7, 17254. [Google Scholar] [CrossRef] [PubMed] [Green Version]
- He, K.; Zeng, S.; Qian, L. Recent progress in the molecular imaging of therapeutic monoclonal antibodies. J. Pharm. Anal. 2020, 10, 397–413. [Google Scholar] [CrossRef] [PubMed]
- Dammes, N.; Peer, D. Monoclonal antibody-based molecular imaging strategies and theranostic opportunities. Theranostics 2020, 10, 938–955. [Google Scholar] [CrossRef] [PubMed]
- Psimadas, D.; Valotassiou, V.; Alexiou, S.; Tsougos, I.; Georgoulias, P. Radiolabeled mAbs as Molecular Imaging and/or Therapy Agents Targeting PSMA. Cancer Investig. 2018, 36, 118–128. [Google Scholar] [CrossRef]
- Jones, T.; Rabiner, E.A. The Development, Past Achievements, and Future Directions of Brain PET. J. Cereb. Blood Flow Metab. 2012, 32, 1426–1454. [Google Scholar] [CrossRef]
- Gunn, R.N.; Slifstein, M.; Searle, G.E.; Price, J.C. Quantitative imaging of protein targets in the human brain with PET. Phys. Med. Biol. 2015, 60, R363–R411. [Google Scholar] [CrossRef]
- Sehlin, D.; Syvänen, S.; Ballanger, B.; Barthel, H.; Bischof, G.N.; Boche, D.; Boecker, H.; Bohn, K.P.; Borghammer, P.; Cross, D.; et al. Engineered antibodies: New possibilities for brain PET? Eur. J. Nucl. Med. Mol. Imaging 2019, 46, 2848–2858. [Google Scholar] [CrossRef]
- Dong, X. Current strategies for brain drug delivery. Theranostics 2018, 8, 1481–1493. [Google Scholar] [CrossRef]
- Kola, I.; Landis, J. Can the pharmaceutical industry reduce attrition rates? Nat. Rev. Drug Discov. 2004, 3, 711–718. [Google Scholar] [CrossRef]
- Lingineni, K.; Belekar, V.; Tangadpalliwar, S.R.; Garg, P. The role of multidrug resistance protein (MRP-1) as an active efflux transporter on blood–brain barrier (BBB) permeability. Mol. Divers. 2017, 21, 355–365. [Google Scholar] [CrossRef]
- Anthony, D.P.; Hegde, M.; Shetty, S.S.; Rafic, T.; Mutalik, S.; Rao, B.S.S. Targeting receptor-ligand chemistry for drug delivery across blood-brain barrier in brain diseases. Life Sci. 2021, 274, 119326. [Google Scholar] [CrossRef] [PubMed]
- Feigin, V.L.; Nichols, E.; Alam, T.; Bannick, M.S.; Beghi, E.; Blake, N.; Culpepper, W.J.; Dorsey, E.R.; Elbaz, A.; Ellenbogen, R.G.; et al. Global, regional, and national burden of neurological disorders, 1990–2016: A systematic analysis for the Global Burden of Disease Study 2016. Lancet Neurol. 2019, 18, 459–480. [Google Scholar] [CrossRef]
- Lalatsa, A.; Schatzlein, A.G.; Uchegbu, I.F. Strategies to deliver peptide drugs to the brain. Mol. Pharm. 2014, 11, 1081–1093. [Google Scholar] [CrossRef] [PubMed]
- Zeiadeh, I.; Najjar, A.; Karaman, R. Strategies for enhancing the permeation of cns-active drugs through the blood-brain barrier: A review. Molecules 2018, 23, 1289. [Google Scholar] [CrossRef] [PubMed]
- Pothin, E.; Lesuisse, D.; Lafaye, P. Brain delivery of single-domain antibodies: A focus on VHH and VNAR. Pharmaceutics 2020, 12, 937. [Google Scholar] [CrossRef]
- Cavaco, M.; Gaspar, D.; Castanho, M.A.R.B.; Neves, V. Antibodies for the treatment of brain metastases, a dream or a reality? Pharmaceutics 2020, 12, 62. [Google Scholar] [CrossRef]
- Gabathuler, R. Approaches to transport therapeutic drugs across the blood-brain barrier to treat brain diseases. Neurobiol. Dis. 2010, 37, 48–57. [Google Scholar] [CrossRef]
- Abbott, N.J. Blood-brain barrier structure and function and the challenges for CNS drug delivery. J. Inherit. Metab. Dis. 2013, 36, 437–449. [Google Scholar] [CrossRef]
- Pardridge, W.M. Delivery of Biologics Across the Blood–Brain Barrier with Molecular Trojan Horse Technology. BioDrugs 2017, 31, 503–519. [Google Scholar] [CrossRef]
- Pulgar, V.M. Transcytosis to cross the blood brain barrier, new advancements and challenges. Front. Neurosci. 2019, 12, 1019. [Google Scholar] [CrossRef]
- Pardridge, W.M. Blood—Brain barrier delivery. Drug Discov. Today 2007, 12, 54–61. [Google Scholar] [CrossRef] [PubMed]
- Bellettato, C.M.; Scarpa, M. Possible strategies to cross the blood–brain barrier. Ital. J. Pediatr. 2018, 44, 127–133. [Google Scholar] [CrossRef] [PubMed]
- Lalatsa, A.; Butt, A.M. Physiology of the Blood-Brain Barrier and Mechanisms of Transport across the BBB. In Nanotechnology-Based Targeted Drug Delivery Systems for Brain Tumors; Elsevier Inc.: Amsterdam, The Netherlands, 2018; ISBN 9780128122181. [Google Scholar]
- Meyer, A.H.; Li, J.; Lenter, M.; Hildebrandt, T.; Leparc, G.; Wood, M.J.A. Neuropharmacology Targeting blood-brain-barrier transcytosis e perspectives for drug delivery. Neuropharmacology 2017, 120, 4–7. [Google Scholar] [CrossRef]
- Ullman, J.C.; Arguello, A.; Getz, J.A.; Bhalla, A.; Mahon, C.S.; Wang, J.; Giese, T.; Bedard, C.; Kim, D.J.; Blumenfeld, J.R.; et al. Brain delivery and activity of a lysosomal enzyme using a blood-brain barrier transport vehicle in mice. Sci. Transl. Med. 2020, 12, 1–13. [Google Scholar] [CrossRef] [PubMed]
- Syvänen, S.; Hultqvist, G.; Gustavsson, T.; Gumucio, A.; Laudon, H.; Söderberg, L.; Ingelsson, M.; Lannfelt, L.; Sehlin, D. Efficient clearance of Aβ protofibrils in AβPP-transgenic mice treated with a brain-penetrating bifunctional antibody. Alzheimers. Res. Ther. 2018, 10, 49. [Google Scholar] [CrossRef]
- Kariolis, M.S.; Wells, R.C.; Getz, J.A.; Kwan, W.; Mahon, C.S.; Tong, R.; Kim, D.J.; Srivastava, A.; Bedard, C.; Henne, K.R.; et al. Brain delivery of therapeutic proteins using an Fc fragment blood-brain barrier transport vehicle in mice and monkeys. Sci. Transl. Med. 2020, 12, 1–13. [Google Scholar] [CrossRef]
- Yu, Y.J.; Zhang, Y.; Kenrick, M.; Hoyte, K.; Luk, W.; Lu, Y.; Atwal, J.; Elliott, J.M.; Prabhu, S.; Watts, R.J.; et al. Boosting Brain Uptake of a Therapeutic Antibody by Reducing Its Affinity for a Transcytosis Target. Sci. Transl. Med. 2011, 3, 84ra44. [Google Scholar] [CrossRef]
- Johnsen, K.B.; Burkhart, A.; Thomsen, L.B.; Andresen, T.L.; Moos, T. Targeting the transferrin receptor for brain drug delivery. Prog. Neurobiol. 2019, 181, 101665. [Google Scholar] [CrossRef]
- Farzin, L.; Sheibani, S.; Moassesi, M.E.; Shamsipur, M. An overview of nanoscale radionuclides and radiolabeled nanomaterials commonly used for nuclear molecular imaging and therapeutic functions. J. Biomed. Mater. Res.—Part A 2019, 107, 251–285. [Google Scholar] [CrossRef]
- Cook, B.E.; Adumeau, P.; Membreno, R.; Carnazza, K.E.; Brand, C.; Reiner, T.; Agnew, B.J.; Lewis, J.S.; Zeglis, B.M. Pretargeted PET Imaging Using a Site-Specifically Labeled Immunoconjugate. Bioconjug. Chem. 2016, 27, 1789–1795. [Google Scholar] [CrossRef]
- Staudt, M.; Herth, M.M.; Poulie, C.B.M. Pretargeted Theranostics. In Theranostics—An Old Concept in New Clothing; IntechOpen: London, UK, 2021; pp. 1–19. [Google Scholar] [CrossRef]
- Stéen, E.J.L.; Edem, P.E.; Nørregaard, K.; Jørgensen, J.T.; Shalgunov, V.; Kjaer, A.; Herth, M.M. Pretargeting in Nuclear Imaging and Radionuclide Therapy: Improving Efficacy of Theranostics and Nanomedicines. Biomaterials 2018, 179, 209–245. [Google Scholar] [PubMed]
- Rossin, R.; Robillard, M.S. Pretargeted imaging using bioorthogonal chemistry in mice. Curr. Opin. Chem. Biol. 2014, 21, 161–169. [Google Scholar] [CrossRef]
- Rossin, R.; Renart Verkerk, P.; van den Bosch, S.M.; Vulders, R.C.M.; Verel, I.; Lub, J.; Robillard, M.S. In Vivo Chemistry for Pretargeted Tumor Imaging in Live Mice. Angew. Chem. 2010, 122, 3447–3450. [Google Scholar] [CrossRef]
- Bratteby, K.; Shalgunov, V.; Herth, M.M. Aliphatic 18F-Radiofluorination: Recent Advances in the Labeling of Base-Sensitive Substrates. ChemMedChem 2021, 16, 2612–2622. [Google Scholar] [CrossRef]
- García-Vázquez, R.; Jørgensen, J.T.; Bratteby, K.E.; Shalgunov, V.; Hvass, L.; Herth, M.M.; Kjær, A.; Battisti, U.M. Development of18F-Labeled Bispyridyl Tetrazines for In Vivo Pretargeted PET Imaging. Pharmaceuticals 2022, 15, 245. [Google Scholar] [CrossRef] [PubMed]
- Bratteby, K.; Shalgunov, V.; Battisti, U.M.; Petersen, I.N.; Van Den Broek, S.L.; Ohlsson, T.; Gillings, N.; Erlandsson, M.; Herth, M.M. Insights into Elution of Anion Exchange Cartridges: Opening the Path toward Aliphatic 18F-Radiolabeling of Base-Sensitive Tracers. ACS Pharmacol. Transl. Sci. 2021, 4, 1556–1566. [Google Scholar] [CrossRef]
- García-Vázquez, R.; Battisti, U.M.; Jørgensen, J.T.; Shalgunov, V.; Hvass, L.; Stares, D.L.; Petersen, I.N.; Crestey, F.; Löffler, A.; Svatunek, D.; et al. Direct Cu-mediated aromatic18F-labeling of highly reactive tetrazines for pretargeted bioorthogonal PET imaging. Chem. Sci. 2021, 12, 11668–11675. [Google Scholar] [CrossRef] [PubMed]
- Shalgunov, V.; Lopes van den Broek, S.; Andersen, I.V.; Garcia Vazquez, R.; Raval, N.; Palner, M.; Mori, Y.; Schäfer, G.; Mikula, H.; Beschorner, N.; et al. Pretargeted Imaging Beyond the Blood-Brain Barrier. ChemRxiv 2022. [Google Scholar] [CrossRef]
- Rossin, R.; Van Duijnhoven, S.M.J.; Läppchen, T.; Van Den Bosch, S.M.; Robillard, M.S. Trans-cyclooctene tag with improved properties for tumor pretargeting with the Diels-Alder reaction. Mol. Pharm. 2014, 11, 3090–3096. [Google Scholar] [CrossRef]
- Wang, M.; Vannam, R.; Lambert, W.D.; Xie, Y.; Wang, H.; Giglio, B.; Ma, X.; Wu, Z.; Fox, J.; Li, Z. Hydrophilic 18 F-labeled trans -5-oxocene (oxoTCO) for efficient construction of PET agents with improved tumor-to-background ratios in neurotensin receptor (NTR) imaging. Chem. Commun. 2019, 55, 2485–2488. [Google Scholar] [CrossRef]
- Hultqvist, G.; Syvänen, S.; Fang, X.T.; Lannfelt, L.; Sehlin, D. Bivalent brain shuttle increases antibody uptake by monovalent binding to the transferrin receptor. Theranostics 2017, 7, 308–318. [Google Scholar] [CrossRef] [PubMed]
- Fang, X.T.; Sehlin, D.; Lannfelt, L.; Syvänen, S.; Hultqvist, G. Efficient and inexpensive transient expression of multispecific multivalent antibodies in Expi293 cells. Biol. Proced. Online 2017, 19, 11. [Google Scholar] [CrossRef] [PubMed]
- Poulie, C.B.M.; Jørgensen, J.T.; Shalgunov, V.; Kougioumtzoglou, G.; Jeppesen, T.E.; Kjaer, A.; Herth, M.M. Evaluation of [64cu]cu-nota-peg7-h-tz for pretargeted imaging in ls174t xenografts—Comparison to [111in]in-dota-peg11-bispy-tz. Molecules 2021, 26, 544. [Google Scholar] [CrossRef] [PubMed]
- Forsberg, A.; Engler, H.; Almkvist, O.; Blomquist, G.; Hagman, G.; Wall, A.; Ringheim, A.; Långström, B.; Nordberg, A. PET imaging of amyloid deposition in patients with mild cognitive impairment. Neurobiol. Aging 2008, 29, 1456–1465. [Google Scholar] [CrossRef]
- Cardinale, J.; Giammei, C.; Jouini, N.; Mindt, T.L. Bioconjugation Methods for Radiopharmaceutical Chemistry. In Radiopharmaceutical Chemistry; Springer International Publishing: Cham, Switzerland, 2019; pp. 449–466. [Google Scholar] [CrossRef]
- Griem-Krey, N.; Klein, A.B.; Herth, M.; Wellendorph, P. Autoradiography as a Simple and Powerful Method for Visualization and Characterization of Pharmacological Targets. J. Vis. Exp. 2019, 145, e58879. [Google Scholar] [CrossRef]
- Patel, S.; Hamill, T.; Hostetler, E.; Burns, H.D.; Gibson, R.E. An in vitro assay for predicting successful imaging radiotracers. Mol. Imaging Biol. 2003, 5, 65–71. [Google Scholar] [CrossRef]
- Pagnon de la Vega, M. Characterization of the Novel “Uppsala Mutation” Causing a Familial Form of Early Onset Alzheimer’s Disease. Ph.D. Thesis, Uppsala University, Uppsala, Sweden, 2021. Available online: http://uu.diva-portal.org/smash/record.jsf?aq2=%5B%5B%5D%5D&c=9&af=%5B%5D&searchType=LIST_COMING&sortOrder2=title_sort_asc&query=&language=en&pid=diva2%3A1571680&aq=%5B%5B%5D%5D&sf=all&aqe=%5B%5D&sortOrder=author_sort_asc&onlyFullText=false&noOfRows=50&dswid=3520 (accessed on 17 June 2022).
- Kovačević, N.; Henderson, J.T.; Chan, E.; Lifshitz, N.; Bishop, J.; Evans, A.C.; Henkelman, R.M.; Chen, X.J. A three-dimensional MRI atlas of the mouse brain with estimates of the average and variability. Cereb. Cortex 2005, 15, 639–645. [Google Scholar] [CrossRef]
- Badea, A.; Ali-Sharief, A.A.; Johnson, G.A. Morphometric analysis of the C57BL/6J mouse brain. Neuroimage 2007, 37, 683–693. [Google Scholar] [CrossRef]
- Faresjö, R.; Bonvicini, G.; Fang, X.T.; Aguilar, X.; Sehlin, D.; Syvänen, S. Brain pharmacokinetics of two BBB penetrating bispecific antibodies of different size. Fluids Barriers CNS 2021, 18, 26. [Google Scholar] [CrossRef]
- Hu, Y.-B.; Dammer, E.B.; Ren, R.-J.; Wang, G. The endosomal-lysosomal system: From acidification and cargo sorting to neurodegeneration. Transl. Neurodegener. 2015, 4, 18. [Google Scholar] [CrossRef]
- Zhang, C.-J.; Tan, C.Y.J.; Ge, J.; Na, Z.; Chen, G.Y.J.; Uttamchandani, M.; Sun, H.; Yao, S.Q. Preparation of Small-Molecule Microarrays by trans -Cyclooctene Tetrazine Ligation and Their Application in the High-Throughput Screening of Protein-Protein Interaction Inhibitors of Bromodomains. Angew. Chem. 2013, 125, 14310–14314. [Google Scholar] [CrossRef]
- Rossin, R.; Läppchen, T.; Van Den Bosch, S.M.; Laforest, R.; Robillard, M.S. Diels-alder reaction for tumor pretargeting: In vivo chemistry can boost tumor radiation dose compared with directly labeled antibody. J. Nucl. Med. 2013, 54, 1989–1995. [Google Scholar] [CrossRef] [PubMed]
- Fang, X.T.; Hultqvist, G.; Meier, S.R.; Antoni, G.; Sehlin, D.; Syvänen, S. High detection sensitivity with antibody-based PET radioligand for amyloid beta in brain. Neuroimage 2019, 184, 881–888. [Google Scholar] [CrossRef] [PubMed]
- Meyer, P.T.; Elmenhorst, D.; Zilles, K.; Bauer, A. Simplified quantification of cerebral A1 adenosine receptors using [18F]CPFPX and PET: Analyses based on venous blood sampling. Synapse 2005, 55, 212–223. [Google Scholar] [CrossRef] [PubMed]
- Raval, N.R.; Johansen, A.; Donovan, L.L.; Ros, N.F.; Ozenne, B.; Hansen, H.D.; Knudsen, G.M.P. 804A single dose of psilocybin increases synaptic density and decreases 5-HT2A receptor density in the pig brain. Eur. Neuropsychopharmacol. 2020, 40, S453–S454. [Google Scholar] [CrossRef]


| Experimental Determined Data | Min. Concentration Needed to Reach Sufficient Imaging Contrast: Target-to-Background >2 | Success Criteria | Is BBB Pretargeting Feasible? | |||
|---|---|---|---|---|---|---|
| TCO/Ab | Dosing [mg/kg] | Brain Uptake [%ID/g] | Abmin | Abtraffic | Abtraffic − Abmin = | |
| 6.8 | 2 | 1.1 | 1.6 | 2.6 | 1 | Yes |
| 3 | 2 | 1.1 | 3.6 | 2.6 | −1 | No * |
| 3 | 5 | 0.7 | 3.6 | 4.2 | 0.6 | Yes |
| 12 | 1 | 1.1 | 0.9 | 1.3 | 0.4 | Yes |
Publisher’s Note: MDPI stays neutral with regard to jurisdictional claims in published maps and institutional affiliations. |
© 2022 by the authors. Licensee MDPI, Basel, Switzerland. This article is an open access article distributed under the terms and conditions of the Creative Commons Attribution (CC BY) license (https://creativecommons.org/licenses/by/4.0/).
Share and Cite
Lopes van den Broek, S.; Shalgunov, V.; García Vázquez, R.; Beschorner, N.; Bidesi, N.S.R.; Nedergaard, M.; Knudsen, G.M.; Sehlin, D.; Syvänen, S.; Herth, M.M. Pretargeted Imaging beyond the Blood–Brain Barrier—Utopia or Feasible? Pharmaceuticals 2022, 15, 1191. https://0-doi-org.brum.beds.ac.uk/10.3390/ph15101191
Lopes van den Broek S, Shalgunov V, García Vázquez R, Beschorner N, Bidesi NSR, Nedergaard M, Knudsen GM, Sehlin D, Syvänen S, Herth MM. Pretargeted Imaging beyond the Blood–Brain Barrier—Utopia or Feasible? Pharmaceuticals. 2022; 15(10):1191. https://0-doi-org.brum.beds.ac.uk/10.3390/ph15101191
Chicago/Turabian StyleLopes van den Broek, Sara, Vladimir Shalgunov, Rocío García Vázquez, Natalie Beschorner, Natasha S. R. Bidesi, Maiken Nedergaard, Gitte M. Knudsen, Dag Sehlin, Stina Syvänen, and Matthias M. Herth. 2022. "Pretargeted Imaging beyond the Blood–Brain Barrier—Utopia or Feasible?" Pharmaceuticals 15, no. 10: 1191. https://0-doi-org.brum.beds.ac.uk/10.3390/ph15101191