

Data-Driven Technology Roadmaps to Identify Potential Technology Opportunities for Hyperuricemia Drugs

 ,
,
Abstract
:1. Introduction
2. Theoretical Background
2.1. Technology Opportunity Analysis
2.2. Technology Roadmap and Data-Driven Technology Roadmap
2.3. Data Analysis Techniques and Data-Driven Technology Roadmap
2.3.1. Bidirectional Encoder Representations for Transformers with the Data-Driven Technology Roadmap
2.3.2. Subject-Action-Object Analysis with the Data-Driven Technology Roadmap
2.3.3. Biterm Topic Model with the Data-Driven Technology Roadmap
2.3.4. Link Prediction with Data-Driven Technology Roadmap
3. Methodology
3.1. Collecting and Pre-Processing Data for Technology and Market
3.1.1. Data Collection
3.1.2. Setting the Timeframe of Data-Driven TRM
3.2. Layer Mapping
3.2.1. Classifying the Data into Layers Based on BERT
3.2.2. Semantic Analysis for the Technology Layer and Market Layer Based on SAO
3.3. Contents Mapping
3.3.1. Pre-Processing the SAO Components
3.3.2. Identify Topics of SAO Components for Technology and Market Layers Based on BTM
3.4. Opportunity Finding
3.4.1. Identify Potential Connections Based on Link Prediction
3.4.2. Integrating TRM and Analyzing Technology Opportunities
4. Illustrative Example
4.1. Collecting and Pre-Processing Data for Technology and Market
4.1.1. Data Collection
4.1.2. Setting the Timeframe of Data-Driven TRM
4.2. Layer Mapping
4.2.1. Classifying the Data into Layers Based on BERT
4.2.2. Semantic Analysis for the Technology Layer and Market Layer Based on SAO
4.3. Contents Mapping
4.3.1. Pre-Processing the SAO Components
4.3.2. Identify Topics of SAO Components for Technology and Market Layers Based on BTM
4.4. Opportunity Finding
4.4.1. Identify Potential Connections Based on Link Prediction
4.4.2. Integrating TRM and Analyzing Opportunities
5. Discussion
6. Conclusions
Supplementary Materials
Author Contributions
Funding
Institutional Review Board Statement
Informed Consent Statement
Data Availability Statement
Conflicts of Interest
References
- Feng, X.; Yang, Y.; Xie, H.; Zhuang, S.; Fang, Y.; Dai, Y.; Jiang, P.; Chen, H.; Tang, H.; Tang, L. The Association Between Hyperuricemia and Obesity Metabolic Phenotypes in Chinese General Population: A Retrospective Analysis. Front. Nutr. 2022, 9, 773220. [Google Scholar] [CrossRef] [PubMed]
- Al-Amodi, Y.A.; Hosny, K.M.; Alharbi, W.S.; Safo, M.K.; El-Say, K. Investigating the Potential of Transmucosal Delivery of Febuxostat from Oral Lyophilized Tablets Loaded with a Self-Nanoemulsifying Delivery System. Pharmaceutics 2020, 12, 534. [Google Scholar] [CrossRef] [PubMed]
- Galindo, T.; Reyna, J.; Weyer, A. Evidence for Transient Receptor Potential (TRP) Channel Contribution to Arthritis Pain and Pathogenesis. Pharmaceuticals 2018, 11, 105. [Google Scholar] [CrossRef] [PubMed] [Green Version]
- Tátrai, P.; Erdő, F.; Dörnyei, G.; Krajcsi, P. Modulation of Urate Transport by Drugs. Pharmaceutics 2021, 13, 899. [Google Scholar] [CrossRef] [PubMed]
- Yang, B.; Kwon, I. Thermostable and Long-Circulating Albumin-Conjugated Arthrobacter globiformis Urate Oxidase. Pharmaceutics 2021, 13, 1298. [Google Scholar] [CrossRef] [PubMed]
- Da Cruz, R.M.D.; Mendonca, F.J.B.; De Melo, N.B.; Scotti, L.; De Araujo, R.S.A.; De Almeida, R.N.; De Moura, R.O. Thiophene-Based Compounds with Potential Anti-Inflammatory Activity. Pharmaceuticals 2021, 14, 692. [Google Scholar] [CrossRef]
- Kanbay, M.; Jensen, T.; Solak, Y.; Le, M.; Roncal-Jimenez, C.; Rivard, C.; Lanaspa, M.A.; Nakagawa, T.; Johnson, R.J. Uric acid in metabolic syndrome: From an innocent bystander to a central player. Eur. J. Intern. Med. 2016, 29, 3–8. [Google Scholar] [CrossRef] [Green Version]
- Cong, R.; Zhang, X.; Song, Z.; Chen, S.; Liu, G.; Liu, Y.; Pang, X.; Dong, F.; Xing, W.; Wang, Y.; et al. Assessing the Causal Effects of Adipokines on Uric Acid and Gout: A Two-Sample Mendelian Randomization Study. Nutrients 2022, 14, 1091. [Google Scholar] [CrossRef]
- Ye, C.; Huang, X.; Wang, R.; Halimulati, M.; Aihemaitijiang, S.; Zhang, Z. Dietary Inflammatory Index and the Risk of Hyperuricemia: A Cross-Sectional Study in Chinese Adult Residents. Nutrients 2021, 13, 4504. [Google Scholar] [CrossRef]
- Shi, J.; He, L.; Yu, D.; Ju, L.; Guo, Q.; Piao, W.; Xu, X.; Zhao, L.; Yuan, X.; Cao, Q.; et al. Prevalence and Correlates of Metabolic Syndrome and Its Components in Chinese Children and Adolescents Aged 7–17: The China National Nutrition and Health Survey of Children and Lactating Mothers from 2016–2017. Nutrients 2022, 14, 3348. [Google Scholar] [CrossRef]
- Chen, H.-W.; Chen, Y.-C.; Lee, J.-T.; Yang, F.M.; Kao, C.-Y.; Chou, Y.-H.; Chu, T.-Y.; Juan, Y.-S.; Wu, W.-J. Prediction of the Uric Acid Component in Nephrolithiasis Using Simple Clinical Information about Metabolic Disorder and Obesity: A Machine Learning-Based Model. Nutrients 2022, 14, 1829. [Google Scholar] [CrossRef] [PubMed]
- Toyoda, Y.; Takada, T.; Saito, H.; Hirata, H.; Ota-Kontani, A.; Tsuchiya, Y.; Suzuki, H. Identification of Inhibitory Activities of Dietary Flavonoids against URAT1, a Renal Urate Re-Absorber: In Vitro Screening and Fractional Approach Focused on Rooibos Leaves. Nutrients 2022, 14, 575. [Google Scholar] [CrossRef] [PubMed]
- Fahmy, U.; Aldawsari, H.; Badr-Eldin, S.; Ahmed, O.; Alhakamy, N.; Alsulimani, H.; Caraci, F.; Caruso, G. The Encapsulation of Febuxostat into Emulsomes Strongly Enhances the Cytotoxic Potential of the Drug on HCT 116 Colon Cancer Cells. Pharmaceutics 2020, 12, 956. [Google Scholar] [CrossRef] [PubMed]
- Duda, G.N.; Grainger, D.W.; Frisk, M.L.; Bruckner-Tuderman, L.; Carr, A.; Dirnagl, U.; Einhäupl, K.M.; Gottschalk, S.; Gruskin, E.; Huber, C.; et al. Changing the Mindset in Life Sciences Toward Translation: A Consensus. Sci. Transl. Med. 2014, 6, 264cm12. [Google Scholar] [CrossRef] [PubMed] [Green Version]
- Kim, J.; Geum, Y. How to develop data-driven technology roadmaps:The integration of topic modeling and link prediction. Technol. Forecast. Soc. Chang. 2021, 171, 120972. [Google Scholar] [CrossRef]
- Lara, R.A.N.; Beltrán, J.A.; Brizuela, C.A.; Del Rio, G. Relevant Features of Polypharmacologic Human-Target Antimicrobials Discovered by Machine-Learning Techniques. Pharmaceuticals 2020, 13, 204. [Google Scholar] [CrossRef] [PubMed]
- Luo, L.X.; Zheng, T.Y.; Wang, Q.; Liao, Y.L.; Zheng, X.Q.; Zhong, A.; Huang, Z.N.; Luo, H. Virtual Screening Based on Machine Learning Explores Mangrove Natural Products as KRAS(G12C) Inhibitors. Pharmaceuticals 2022, 15, 584. [Google Scholar] [CrossRef]
- Walsh, E.I.; Cherbuin, N. Mapping the Literature on Nutritional Interventions in Cognitive Health: A Data-Driven Approach. Nutrients 2018, 11, 38. [Google Scholar] [CrossRef] [Green Version]
- Janssen, A.; Bennis, F.C.; Mathôt, R.A.A. Adoption of Machine Learning in Pharmacometrics: An Overview of Recent Implementations and Their Considerations. Pharmaceutics 2022, 14, 1814. [Google Scholar] [CrossRef]
- Ko, Y.K.; Gim, J.-A. New Drug Development and Clinical Trial Design by Applying Genomic Information Management. Pharmaceutics 2022, 14, 1539. [Google Scholar] [CrossRef]
- Raza, M.S.; Khahro, S.H.; Memon, S.A.; Ali, T.H.; Memon, N.A. Global trends in research on carbon footprint of buildings during 1971–2021: A bibliometric investigation. Environ. Sci. Pollut. Res. 2021, 28, 63227–63236. [Google Scholar] [CrossRef] [PubMed]
- Du, J.; Li, P.; Guo, Q.; Tang, X. Measuring the knowledge translation and convergence in pharmaceutical innovation by funding-science-technology-innovation linkages analysis. J. Inf. 2018, 13, 132–148. [Google Scholar] [CrossRef]
- Ramos, A.G.; Daim, T.; Gaats, L.; Hutmacher, D.W.; Hackenberger, D. Technology roadmap for the development of a 3D cell culture workstation for a biomedical industry startup. Technol. Forecast. Soc. Chang. 2021, 174, 121213. [Google Scholar] [CrossRef]
- Cheng, X.; Yan, X.; Lan, Y.; Guo, J. BTM: Topic Modeling over Short Texts. IEEE Trans. Knowl. Data Eng. 2014, 26, 2928–2941. [Google Scholar] [CrossRef]
- Kang, H.; Goo, S.; Lee, H.; Chae, J.-W.; Yun, H.-Y.; Jung, S. Fine-tuning of BERT Model to Accurately Predict Drug–Target Interactions. Pharmaceutics 2022, 14, 1710. [Google Scholar] [CrossRef] [PubMed]
- Guven, Z.A.; Unalir, M.O. Natural language based analysis of SQuAD: An analytical approach for BERT. Expert Syst. Appl. 2022, 195, 116592. [Google Scholar] [CrossRef]
- Jang, H.; Park, S.; Yoon, B. Exploring Technology Opportunities Based on User Needs: Application of Opinion Mining and SAO Analysis. Eng. Manag. J. 2022, 1–14. [Google Scholar] [CrossRef]
- McCoy, K.; Gudapati, S.; He, L.; Horlander, E.; Kartchner, D.; Kulkarni, S.; Mehra, N.; Prakash, J.; Thenot, H.; Vanga, S.; et al. Biomedical Text Link Prediction for Drug Discovery: A Case Study with COVID-19. Pharmaceutics 2021, 13, 794. [Google Scholar] [CrossRef]
- Nuñez de Villavicencio-Diaz, T.; Rabalski, A.J.; Litchfield, D.W. Protein Kinase CK2: Intricate Relationships within Regulatory Cellular Networks. Pharmaceuticals 2017, 10, 27. [Google Scholar] [CrossRef] [Green Version]
- Russo, S.; Bonassi, S. Prospects and Pitfalls of Machine Learning in Nutritional Epidemiology. Nutrients 2022, 14, 1705. [Google Scholar] [CrossRef]
- Otani, K.; Kanno, K.; Akutsu, T.; Ohdaira, H.; Suzuki, Y.; Urashima, M. Applying Machine Learning to Determine 25(OH)D Threshold Levels Using Data from the AMATERASU Vitamin D Supplementation Trial in Patients with Digestive Tract Cancer. Nutrients 2022, 14, 1689. [Google Scholar] [CrossRef] [PubMed]
- Hamed, A.A.; Fandy, T.E.; Tkaczuk, K.L.; Verspoor, K.; Lee, B.S. COVID-19 Drug Repurposing: A Network-Based Framework for Exploring Biomedical Literature and Clinical Trials for Possible Treatments. Pharmaceutics 2022, 14, 567. [Google Scholar] [CrossRef] [PubMed]
- Keutzer, L.; You, H.; Farnoud, A.; Nyberg, J.; Wicha, S.G.; Maher-Edwards, G.; Vlasakakis, G.; Moghaddam, G.K.; Svensson, E.M.; Menden, M.P.; et al. Machine Learning and Pharmacometrics for Prediction of Pharmacokinetic Data: Differences, Similarities and Challenges Illustrated with Rifampicin. Pharmaceutics 2022, 14, 1530. [Google Scholar] [CrossRef]
- Liu, Z.; Wang, Y.; Feng, J. Vehicle-type strategies for manufacturer’s car sharing. Kybernetes 2022. ahead-of-print. [Google Scholar] [CrossRef]
- Meqbil, Y.J.; Rijn, R.M.V. Opportunities and Challenges for In Silico Drug Discovery at Delta Opioid Receptors. Pharmaceuticals 2022, 15, 873. [Google Scholar] [CrossRef]
- Jia, X.; Chen, J.; Tang, X. Construction of Technology Road-Map(TRM) Specific to Pharmaceutical Industry. Sci. Technol. Manag. Res. 2018, 11, 128–133. [Google Scholar]
- Zhou, X.; Huang, L.; Porter, A.; Vicente-Gomila, J.M. Tracing the system transformations and innovation pathways of an emerging technology: Solid lipid nanoparticles. Technol. Forecast. Soc. Chang. 2019, 146, 785–794. [Google Scholar] [CrossRef]
- Wang, L.-Y.; Zhao, D. Cross-domain function analysis and trend study in Chinese construction industry based on patent semantic analysis. Technol. Forecast. Soc. Chang. 2020, 162, 120331. [Google Scholar] [CrossRef]
- Han, M.; Geum, Y. Roadmapping for Data: Concept and Typology of Data-Integrated Smart-Service Roadmaps. IEEE Trans. Eng. Manag. 2020, 69, 142–154. [Google Scholar] [CrossRef]
- Borschiver, S.; Vasconcelos, R.C.; Silva, F.C.; Freitas, G.C.; Santos, P.E.; Bomfim, R.O.D. Technology roadmap for hyaluronic acid and its derivatives market. Biofuels Bioprod. Biorefining 2018, 13, 435–444. [Google Scholar] [CrossRef]
- Rincón-López, J.; Almanza-Arjona, Y.C.; Riascos, A.P.; Rojas-Aguirre, Y. When Cyclodextrins Met Data Science: Unveiling Their Pharmaceutical Applications through Network Science and Text-Mining. Pharmaceutics 2021, 13, 1297. [Google Scholar] [CrossRef] [PubMed]
- Yu, X.; Zhang, B. Obtaining advantages from technology revolution: A patent roadmap for competition analysis and strategy planning. Technol. Forecast. Soc. Chang. 2019, 145, 273–283. [Google Scholar] [CrossRef]
- Han, X.; Zhu, D.; Wang, X.; Li, J.; Qiao, Y. Technology Opportunity Analysis: Combining SAO Networks and Link Prediction. IEEE Trans. Eng. Manag. 2019, 68, 1288–1298. [Google Scholar] [CrossRef]
- Ma, T.T.; Zhou, X.; Liu, J.; Lou, Z.K.; Hua, Z.T.; Wang, R.T. Combining topic modeling and SAO semantic analysis to identify technological opportunities of emerging technologies. Technol. Forecast. Soc. Chang. 2021, 173, 121159. [Google Scholar] [CrossRef]
- Ma, T.T.; Porter, A.L.; Guo, Y.; Ready, J.; Xu, C.; Gao, L.D. A technology opportunities analysis model: Applied to dye-sensitised solar cells for China. Technol. Anal. Strateg. Manag. 2014, 26, 87–104. [Google Scholar] [CrossRef]
- Shibata, N.; Kajikawa, Y.; Takeda, Y.; Matsushima, K. Detecting emerging research fronts based on topological measures in citation networks of scientific publications. Technovation 2008, 28, 758–775. [Google Scholar] [CrossRef]
- Kajikawa, Y.; Yoshikawa, J.; Takeda, Y.; Matsushima, K. Tracking emerging technologies in energy research: Toward a roadmap for sustainable energy. Technol. Forecast. Soc. Chang. 2008, 75, 771–782. [Google Scholar] [CrossRef]
- Lee, P.-C.; Su, H.-N.; Wu, F.-S. Quantitative mapping of patented technology—The case of electrical conducting polymer nanocomposite. Technol. Forecast. Soc. Chang. 2010, 77, 466–478. [Google Scholar] [CrossRef]
- Jeong, Y.; Park, I.; Yoon, B. Identifying emerging Research and Business Development (R&BD) areas based on topic modeling and visualization with intellectual property right data. Technol. Forecast. Soc. Chang. 2019, 146, 655–672. [Google Scholar] [CrossRef]
- Yoon, B.; Magee, C.L. Exploring technology opportunities by visualizing patent information based on generative topographic mapping and link prediction. Technol. Forecast. Soc. Chang. 2018, 132, 105–117. [Google Scholar] [CrossRef]
- Cheng, Y.-Y.; Qu, H.-B.; Zhang, B.-L. Chinese medicine industry 4.0: Advancing digital pharmaceutical manufacture toward intelligent pharmaceutical manufacture. China J. Chin. Mater. Med. 2016, 41, 1–5. [Google Scholar]
- Zhang, Y.; Zhang, G.; Chen, H.; Porter, A.L.; Zhu, D.; Lu, J. Topic analysis and forecasting for science, technology and innovation: Methodology with a case study focusing on big data research. Technol. Forecast. Soc. Chang. 2016, 105, 179–191. [Google Scholar] [CrossRef]
- Pavlinek, M.; Podgorelec, V. Text classification method based on self-training and LDA topic models. Expert Syst. Appl. 2017, 80, 83–93. [Google Scholar] [CrossRef]
- Zhang, Y.; Robinson, D.K.; Porter, A.L.; Zhu, D.; Zhang, G.; Lu, J. Technology roadmapping for competitive technical intelligence. Technol. Forecast. Soc. Chang. 2016, 110, 175–186. [Google Scholar] [CrossRef] [Green Version]
- Wu, Q.; Zhang, C.; Hong, Q.; Chen, L. Topic evolution based on LDA and HMM and its application in stem cell research. J. Inf. Sci. 2014, 40, 611–620. [Google Scholar] [CrossRef]
- Aaldering, L.J.; Song, C.H. Tracing the technological development trajectory in post-lithium-ion battery technologies: A patent-based approach. J. Clean. Prod. 2019, 241, 118343. [Google Scholar] [CrossRef]
- Wang, Z.X.; Peng, X.G.; Xia, A.; Shah, A.A.; Huang, Y.; Zhu, X.Q.; Zhu, X.; Liao, Q. The role of machine learning to boost the bioenergy and biofuels conversion. Bioresour. Technol. 2022, 343, 126099. [Google Scholar] [CrossRef]
- Son, W.; Lee, S. Integrating fuzzy-set theory into technology roadmap development to support decision-making. Technol. Anal. Strat. Manag. 2016, 31, 447–461. [Google Scholar] [CrossRef]
- Cho, Y.; Yoon, S.-P.; Kim, K.-S. An industrial technology roadmap for supporting public R&D planning. Technol. Forecast. Soc. Chang. 2016, 107, 1–12. [Google Scholar] [CrossRef]
- Valerio, K.G.D.; Da Silva, C.E.S.; Neves, S.M. Overview on the technology roadmapping (TRM) literature: Gaps and perspectives. Technol. Anal. Strateg. Manag. 2020, 1, 1–12. [Google Scholar]
- Milshina, Y.; Vishnevskiy, K. Roadmapping in fast changing environments—The case of the Russian media industry. J. Eng. Technol. Manag. 2019, 52, 32–47. [Google Scholar] [CrossRef]
- Phaal, R.; Farrukh, C.; Probert, D. Characterisation of technology roadmaps: Purpose and format. In Proceedings of the PICMET ‘01. Portland International Conference on Management of Engineering and Technology. Proceedings Vol.1: Book of Summaries (IEEE Cat. No.01CH37199), Portland, OR, USA, 29 July–2 August 2001. [Google Scholar] [CrossRef]
- Ghazinoory, S.; Dastranj, N.; Saghafi, F.; Kulshreshtha, A.; Hasanzadeh, A. Technology roadmapping architecture based on technological learning: Case study of social banking in Iran. Technol. Forecast. Soc. Chang. 2017, 122, 231–242. [Google Scholar] [CrossRef]
- Lee, J.H.; Phaal, R.; Lee, S.-H. An integrated service-device-technology roadmap for smart city development. Technol. Forecast. Soc. Chang. 2013, 80, 286–306. [Google Scholar] [CrossRef]
- Wang, J.; Li, K.; Feng, L. Tracing the technological trajectory of coal slurry pipeline transportation technology: An HMM-based topic modeling approach. Front. Energy Res. 2022, 10, 1303. [Google Scholar] [CrossRef]
- Kerr, C.; Phaal, R.; Thams, K. Customising and deploying roadmapping in an organisational setting: The LEGO Group experience. J. Eng. Technol. Manag. 2019, 52, 48–60. [Google Scholar] [CrossRef]
- Pearson, R.; Costley, A.; Phaal, R.; Nuttall, W. Technology Roadmapping for mission-led agile hardware development: A case study of a commercial fusion energy start-up. Technol. Forecast. Soc. Chang. 2020, 158, 120064. [Google Scholar] [CrossRef]
- Aleina, S.C.; Viola, N.; Fusaro, R.; Longo, J.; Saccoccia, G. Basis for a methodology for roadmaps generation for hypersonic and re-entry space transportation systems. Technol. Forecast. Soc. Chang. 2018, 128, 208–225. [Google Scholar] [CrossRef]
- Daim, T.U.; Yoon, B.-S.; Lindenberg, J.; Grizzi, R.; Estep, J.; Oliver, T. Strategic roadmapping of robotics technologies for the power industry: A multicriteria technology assessment. Technol. Forecast. Soc. Chang. 2018, 131, 49–66. [Google Scholar] [CrossRef]
- Tierney, R.; Hermina, W.; Walsh, S. The pharmaceutical technology landscape: A new form of technology roadmapping. Technol. Forecast. Soc. Chang. 2013, 80, 194–211. [Google Scholar] [CrossRef]
- Jeong, Y.; Yoon, B. Development of patent roadmap based on technology roadmap by analyzing patterns of patent development. Technovation 2015, 39-40, 37–52. [Google Scholar] [CrossRef]
- De Alcantara, D.P.; Martens, M.L. Technology Roadmapping (TRM): A systematic review of the literature. Technol. Forecast. Soc. Chang. 2019, 138, 127–238. [Google Scholar] [CrossRef]
- Pereira, C.G.; Lavoie, J.R.; Garces, E.; Basso, F.; Dabić, M.; Porto, G.S.; Daim, T. Forecasting of emerging therapeutic monoclonal antibodies patents based on a decision model. Technol. Forecast. Soc. Chang. 2019, 139, 185–199. [Google Scholar] [CrossRef]
- Martin, H.; Daim, T.U. Technology roadmap development process (TRDP) for the service sector: A conceptual framework. Technol. Soc. 2012, 34, 94–105. [Google Scholar] [CrossRef]
- Willyard, C.H.; McClees, C.W. Motorola’s Technology Roadmap Process. Res. Manag. 1987, 30, 13–19. [Google Scholar] [CrossRef]
- Lee, H.; Geum, Y. Development of the scenario-based technology roadmap considering layer heterogeneity: An approach using CIA and AHP. Technol. Forecast. Soc. Chang. 2017, 117, 12–24. [Google Scholar] [CrossRef]
- Wang, Y.-H.; Lin, G.-Y. Exploring AI-healthcare innovation: Natural language processing-based patents analysis for technology-driven roadmapping. Kybernetes 2022. [Google Scholar] [CrossRef]
- Jeong, Y.; Jang, H.; Yoon, B. Developing a risk-adaptive technology roadmap using a Bayesian network and topic modeling under deep uncertainty. Scientometrics 2021, 126, 3697–3722. [Google Scholar] [CrossRef]
- Byungun, Y.; Robert, P. Structuring technological information for technology roadmapping: Data mining approach. Technol. Anal. Strateg. Manag. 2013, 25, 1119–1137. [Google Scholar]
- Geum, Y.; Lee, H.; Lee, Y.; Park, Y. Development of data-driven technology roadmap considering dependency: An ARM-based technology roadmapping. Technol. Forecast. Soc. Chang. 2015, 91, 264–279. [Google Scholar] [CrossRef]
- Zhang, H.; Daim, T.; Zhang, Y.P. Integrating patent analysis into technology roadmapping: A latent dirichlet allocation based technology assessment and roadmapping in the field of Blockchain-ScienceDirect. Technol. Forecast. Soc. Chang. 2021, 167, 120729. [Google Scholar] [CrossRef]
- Tan, M.S.; Cheah, P.L.; Chin, A.; Looi, L.M.; Chang, S.W. A review on omics-based biomarkers discovery for Alzheimer’s disease from the bioinformatics perspectives: Statistical approach vs. machine learning approach. Comput. Biol. Med. 2021, 139, 104947. [Google Scholar] [CrossRef] [PubMed]
- Lu, K.; Yang, G.; Wang, X. Topics emerged in the biomedical field and their characteristics. Technol. Forecast. Soc. Chang. 2022, 174, 121218. [Google Scholar] [CrossRef]
- Wang, X.; Ma, P.; Huang, Y.; Guo, J.; Zhu, D.; Porter, A.L.; Wang, Z. Combining SAO semantic analysis and morphology analysis to identify technology opportunities. Scientometrics 2017, 111, 3–24. [Google Scholar] [CrossRef]
- Wang, X.; Qiu, P.; Zhu, D.; Mitkova, L.; Lei, M.; Porter, A.L. Identification of technology development trends based on subject–action–object analysis: The case of dye-sensitized solar cells. Technol. Forecast. Soc. Chang. 2015, 98, 24–46. [Google Scholar] [CrossRef]
- Liu, B.; Lai, M.; Wu, J.-L.; Fu, C.; Binaykia, A. Patent analysis and classification prediction of biomedicine industry: SOM-KPCA-SVM model. Multimedia Tools Appl. 2020, 79, 10177–10197. [Google Scholar] [CrossRef]
- Gomez, J.C. Analysis of the effect of data properties in automated patent classification. Scientometrics 2019, 121, 1239–1268. [Google Scholar] [CrossRef]
- Yun, J.; Geum, Y. Automated classification of patents: A topic modeling approach. Comput. Ind. Eng. 2020, 147, 106636. [Google Scholar] [CrossRef]
- Yang, W.; Chen, L. Machine condition recognition via hidden semi-Markov model. Comput. Ind. Eng. 2021, 158, 107430. [Google Scholar] [CrossRef]
- Ercan, S.; Kayakutlu, G. Patent value analysis using support vector machines. Soft Comput. 2014, 18, 313–328. [Google Scholar] [CrossRef]
- Wen, G.; Chen, H.; Li, H.; Hu, Y.; Li, Y.; Wang, C. Cross domains adversarial learning for Chinese named entity recognition for online medical consultation. J. Biomed. Inform. 2020, 112, 103608. [Google Scholar] [CrossRef]
- Kumar, A.; Gupta, P.; Balan, R.; Neti, L.B.M.; Malapati, A. BERT Based Semi-Supervised Hybrid Approach for Aspect and Sentiment Classification. Neural Process. Lett. 2021, 53, 4207–4224. [Google Scholar] [CrossRef]
- Taju, S.W.; Shah, S.M.A.; Ou, Y.-Y. ActTRANS: Functional classification in active transport proteins based on transfer learning and contextual representations. Comput. Biol. Chem. 2021, 93, 107537. [Google Scholar] [CrossRef] [PubMed]
- Tan, X.; Zhuang, M.; Lu, X.; Mao, T. An Analysis of the Emotional Evolution of Large-Scale Internet Public Opinion Events Based on the BERT-LDA Hybrid Model. IEEE Access 2021, 9, 15860–15871. [Google Scholar] [CrossRef]
- Kim, S.; Yoon, B. Patent infringement analysis using a text mining technique based on SAO structure. Comput. Ind. 2021, 125, 103379. [Google Scholar] [CrossRef]
- Choi, S.; Park, H.; Kang, D.; Lee, J.Y.; Kim, K. An SAO-based text mining approach to building a technology tree for technology planning. Expert Syst. Appl. 2012, 39, 11443–11455. [Google Scholar] [CrossRef]
- Park, H.; Yoon, J.; Kim, K. Identifying patent infringement using SAO based semantic technological similarities. Scientometrics 2012, 90, 515–529. [Google Scholar] [CrossRef]
- Guo, R.; Zhao, W.; Wei, L.; Zhang, S.; Feng, L.; Guo, Y. A variety of simple and ultra-low-cost methods preparing SLiCE extracts and their application to DNA cloning. J. Microbiol. Methods 2022, 202, 106565. [Google Scholar] [CrossRef]
- Kim, H.; Hyeok, Y.; Kim, K. Semantic SAO network of patents for reusability of inventive knowledge. In Proceedings of the 2012 IEEE 6th International Conference on Management of Innovation and Technology (ICMIT), Bali, Indonesia, 11–13 June 2012. [Google Scholar]
- Yang, C.; Zhu, D.; Zhang, G. Semantic-Based Technology Trend Analysis. In Proceedings of the 2015 10th International Conference on Intelligent Systems and Knowledge Engineering (ISKE), Taipei, Taiwan, 24–27 November 2015. [Google Scholar]
- Huang, L.; Shang, L.; Wang, K.; Porter, A.L.; Zhang, Y. Identifying target for technology mergers and acquisitions using patent information and semantic analysis. In Proceedings of the 2015 Portland International Conference on Management of Engineering and Technology (PICMET), Portland, OR, USA, 2–6 August 2015. [Google Scholar]
- Yang, C.; Zhu, D.; Wang, X.; Zhang, Y.; Zhang, G.; Lu, J. Requirement-oriented core technological components’ identification based on SAO analysis. Scientometrics 2017, 112, 1229–1248. [Google Scholar] [CrossRef]
- Guo, J.; Wang, X.; Li, Q.; Zhu, D. Subject–action–object-based morphology analysis for determining the direction of technological change. Technol. Forecast. Soc. Chang. 2016, 105, 27–40. [Google Scholar] [CrossRef]
- Lee, Y.; Kim, S.Y.; Song, I.; Park, Y.; Shin, J. Technology opportunity identification customized to the technological capability of SMEs through two-stage patent analysis. Scientometrics 2014, 100, 227–244. [Google Scholar] [CrossRef]
- Vicente-Gomila, J.M.; Artacho-Ramirez, M.A.; Ting, M.; Porter, A.L. Combining tech mining and semantic TRIZ for technology assessment: Dye-sensitized solar cell as a case. Technol. Forecast. Soc. Chang. 2021, 169, 120826. [Google Scholar] [CrossRef]
- Chao, Y.; Cui, H.; Jun, S. An improved SAO network-based method for technology trend analysis: A case study of graphene. J. Informetr. 2018, 12, 271–286. [Google Scholar]
- Cascini, G.; Zini, M. Measuring patent similarity by comparing inventions functional trees. In Computer-Aided Innovation; Springer: Boston, MA, USA, 2008; pp. 31–42. [Google Scholar] [CrossRef] [Green Version]
- Wang, J.; Wang, X.; Li, W. Research on Potential Adverse Drug Reaction Forecasting Based on SAO Semantic Structure. IEEE Trans. Eng. Manag. 2022, PP, 1–14. [Google Scholar] [CrossRef]
- Guo, Y.; Yu, M.; Jing, N.; Zhang, S. Production of soluble bioactive mouse leukemia inhibitory factor from Escherichia coli using MBP tag. Protein Expr. Purif. 2018, 150, 86–91. [Google Scholar] [CrossRef]
- Feng, J.; Liu, Z.; Feng, L. Identifying opportunities for sustainable business models in manufacturing: Application of patent analysis and generative topographic mapping. Sustain. Prod. Consum. 2021, 27, 509–522. [Google Scholar] [CrossRef]
- Yoon, B.; Kim, S.; Kim, S.; Seol, H. Doc2vec-based link prediction approach using SAO structures: Application to patent network. Scientometrics 2021, 127, 5385–5414. [Google Scholar] [CrossRef]
- Liu, L.; Tang, L.; Dong, W.; Yao, S.; Zhou, W. An overview of topic modeling and its current applications in bioinformatics. SpringerPlus 2016, 5, 1608. [Google Scholar] [CrossRef] [Green Version]
- Anandarajan, M.; Hill, C.; Nolan, T. Probabilistic Topic Models. In Practical Text Analytics: Maximizing the Value of Text Data; Springer: Cham, Switzerland, 2019; pp. 117–130. [Google Scholar]
- Chen, H.; Zhang, G.; Zhu, D.; Lu, J. Topic-based technological forecasting based on patent data: A case study of Australian patents from 2000 to 2014. Technol. Forecast. Soc. Chang. 2017, 119, 39–52. [Google Scholar] [CrossRef]
- Erzurumlu, S.S.; Pachamanova, D. Topic modeling and technology forecasting for assessing the commercial viability of healthcare innovations. Technol. Forecast. Soc. Chang. 2020, 156, 120041. [Google Scholar] [CrossRef]
- Yan, X.; Guo, J.; Lan, Y.; Cheng, X. A biterm topic model for short texts. In Proceedings of the 22nd International Conference on World Wide Web, Rio de Janeiro, Brazil, 13–17 May 2013; pp. 1445–1456. [Google Scholar]
- Younas, M.; Jawawi, D.N.A.; Ghani, I.; Shah, M.A. Extraction of non-functional requirement using semantic similarity distance. Neural Comput. Appl. 2020, 32, 7383–7397. [Google Scholar] [CrossRef]
- Rashid, J.; Shah, S.M.A.; Irtaza, A. Fuzzy topic modeling approach for text mining over short text. Inf. Process. Manag. 2019, 56, 102060. [Google Scholar] [CrossRef]
- Lü, L.; Zhou, T. Link prediction in complex networks: A survey. Phys. A Stat. Mech. its Appl. 2011, 390, 1150–1170. [Google Scholar] [CrossRef] [Green Version]
- Lü, L.; Jin, C.-H.; Zhou, T. Similarity index based on local paths for link prediction of complex networks. Phys. Rev. E 2009, 80, 46122. [Google Scholar] [CrossRef] [PubMed]
- Liben-Nowelly, D.; Kleinberg, J. The Link Prediction Problem for Social Networks. In Proceedings of the Twelfth International Conference on Information and Knowledge Management, New Orleans, LA, USA, 3–8 November 2003. [Google Scholar]
- Thomas, H. The role of patents for bridging the science to market gap. J. Econ. Behav. Organ. 2007, 63, 624–647. [Google Scholar]
- He, T.; Fu, W.; Xu, J.; Zhang, Z.; Zhou, J.; Yin, Y.; Xie, Z. Discovering Interdisciplinary Research Based on Neural Networks. Front. Bioeng. Biotechnol. 2022, 10, 908733. [Google Scholar] [CrossRef]
- Lei, C.; Ruan, J. A novel link prediction algorithm for reconstructing protein–protein interaction networks by topological similarity. Bioinformatics 2012, 29, 355–364. [Google Scholar] [CrossRef] [Green Version]
- Shibata, N.; Kajikawa, Y.; Sakata, I. Link prediction in citation networks. J. Am. Soc. Inf. Sci. Technol. 2012, 63, 78–85. [Google Scholar] [CrossRef]
- Ma, J.; Pan, Y.; Su, C.-Y. Organization-oriented technology opportunities analysis based on predicting patent networks: A case of Alzheimer’s disease. Scientometrics 2022, 127, 5497–5517. [Google Scholar] [CrossRef]
- Chakraborty, S.; Nijssen, E.J.; Valkenburg, R. A systematic review of industry-level applications of technology roadmapping: Evaluation and design propositions for roadmapping practitioners. Technol. Forecast. Soc. Chang. 2022, 179, 121141. [Google Scholar] [CrossRef]
- Kim, S.; Park, I.; Yoon, B. SAO2Vec: Development of an algorithm for embedding the subject–action–object (SAO) structure using Doc2Vec. PLoS ONE 2020, 15, e0227930. [Google Scholar] [CrossRef] [Green Version]
- Kozlowski, D.; Dusdal, J.; Pang, J.; Zilian, A. Semantic and relational spaces in science of science: Deep learning models for article vectorisation. Scientometrics 2021, 126, 5881–5910. [Google Scholar] [CrossRef]
- Blondel, V.D.; Guillaume, J.-L.; Lambiotte, R.; Lefebvre, E. Fast unfolding of communities in large networks. J. Stat. Mech. Theory Exp. 2008, 2008, P10008. [Google Scholar] [CrossRef] [Green Version]
- Lambiotte, R.; Delvenne, J.C.; Barahona, M.J.P. Laplacian Dynamics and Multiscale Modular Structure in Networks. arXiv 2012. [Google Scholar] [CrossRef]


| Type | Data Source | Retrieval Strategy | Count |
|---|---|---|---|
| Paper | Medline | MH = (gout OR hyperuricemia) | 6124 |
| Patent | Derwent | IP = (A61P-019/06) | 5158 |
| Market | ABI | hyperuricemia | 4582 |
| Time Series | Sentences | SAO Components | |||
|---|---|---|---|---|---|
| Original | Duplicate | Incomplete | Reserved | ||
| 2010–2013 | 12,161 | 9912 | 202 | 8263 | 1447 |
| 2014–2018 | 24,441 | 19,902 | 596 | 16,408 | 2898 |
| 2019–2021 | 17,424 | 13,034 | 224 | 10,812 | 1998 |
| In total | 54,026 | 42,848 | 1022 | 35,483 | 6343 |
| Time Series | Sentences | SAO Components | |||
|---|---|---|---|---|---|
| Original | Duplicate | Incomplete | Reserved | ||
| 2010–2013 | 4371 | 2439 | 219 | 1960 | 260 |
| 2014–2018 | 17,799 | 6315 | 1035 | 4767 | 513 |
| 2019–2021 | 9460 | 3548 | 427 | 2818 | 303 |
| In total | 31,630 | 12,302 | 1681 | 9545 | 1076 |
| Layer | SAO Components | Time Series | Group |
|---|---|---|---|
| Technology | S | 2010–2013 | T-S-TS1 |
| 2014–2018 | T-S-TS2 | ||
| 2019–2021 | T-S-TS3 | ||
| A | 2010–2013 | T-A-TS1 | |
| 2014–2018 | T-A-TS2 | ||
| 2019–2021 | T-A-TS3 | ||
| O | 2010–2013 | T-O-TS1 | |
| 2014–2018 | T-O-TS2 | ||
| 2019–2021 | T-O-TS3 | ||
| Market | S | 2010–2013 | M-S-TS1 |
| 2014–2018 | M-S-TS2 | ||
| 2019–2021 | M-S-TS3 | ||
| A | 2010–2013 | M-A-TS1 | |
| 2014–2018 | M-A-TS2 | ||
| 2019–2021 | M-A-TS3 | ||
| O | 2010–2013 | M-O-TS1 | |
| 2014–2018 | M-O-TS2 | ||
| 2019–2021 | M-O-TS3 |
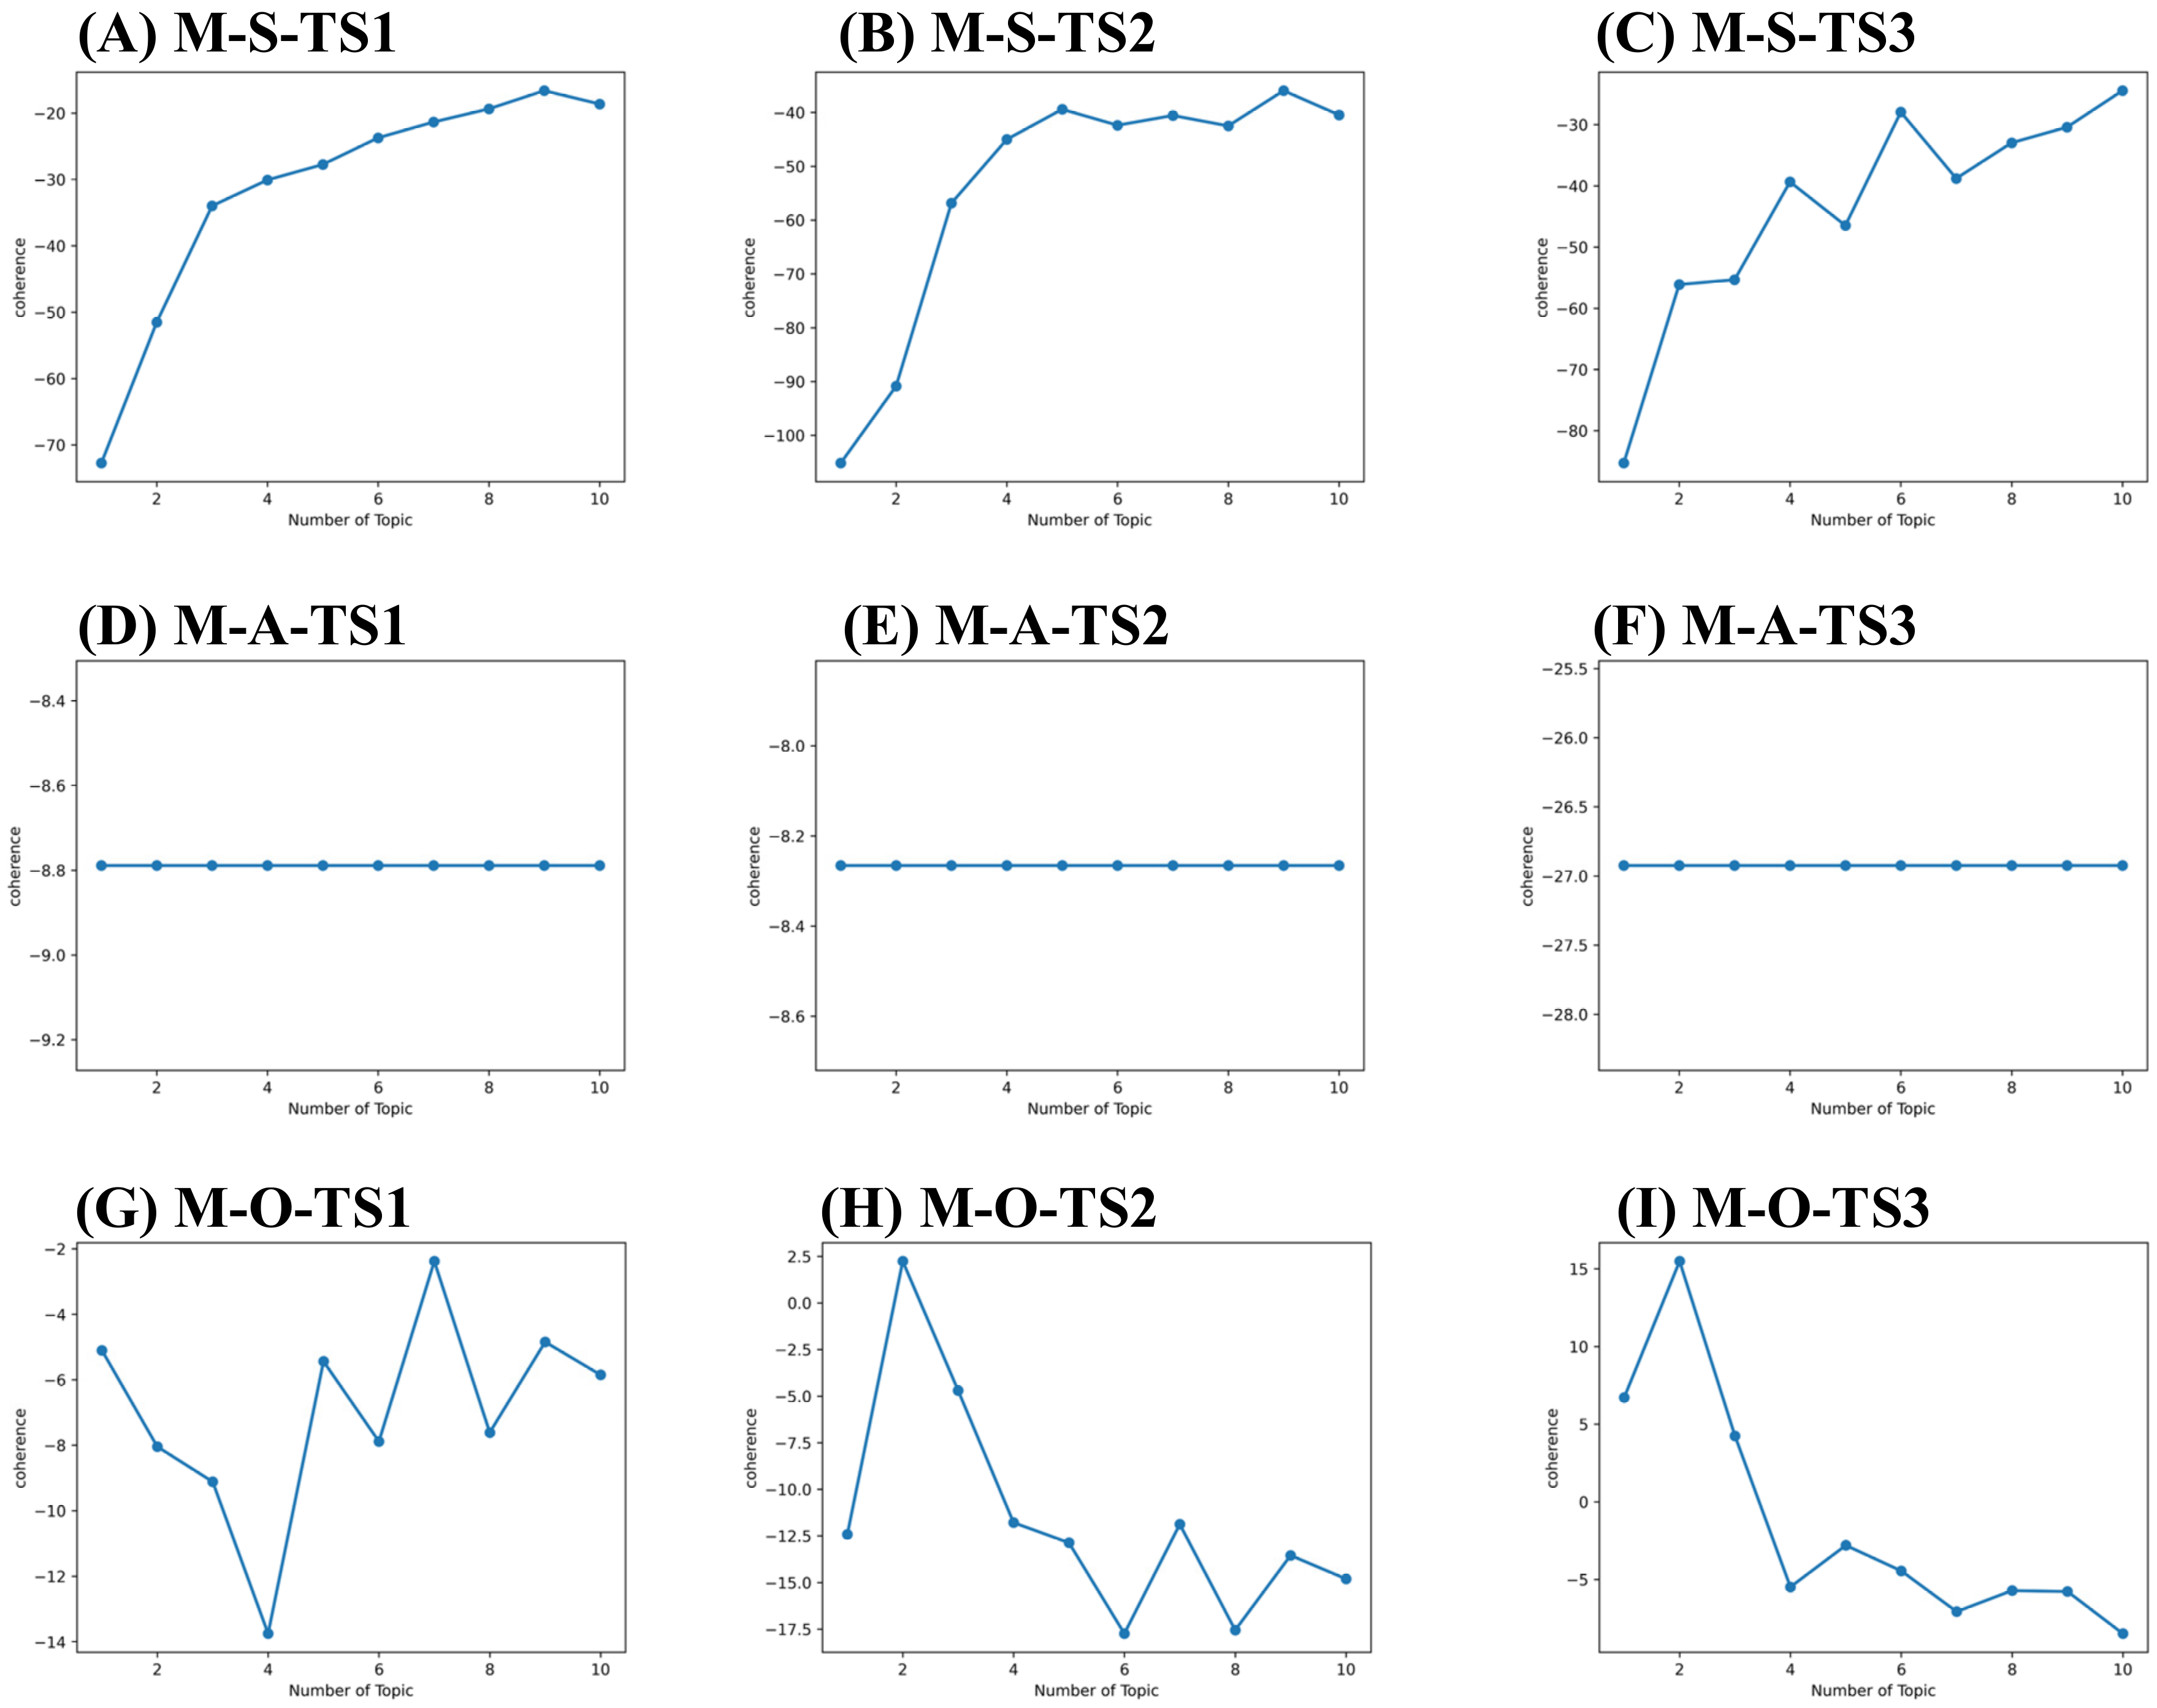
| Technology | Market | ||||
|---|---|---|---|---|---|
| Group | Number of Topics | Coherence | Group | Number of Topics | Coherence |
| T-S-TS1 | 9 | −45.59 | M-S-TS1 | 9 | −16.61 |
| T-A-TS1 | 1 | 12.03 | M-A-TS1 | 1 | −8.79 |
| T-O-TS1 | 10 | −61.45 | M-O-TS1 | 7 | −2.38 |
| T-S-TS2 | 10 | −78.55 | M-S-TS2 | 9 | −35.95 |
| T-A-TS2 | 2 | −30.04 | M-A-TS2 | 1 | −8.27 |
| T-O-TS2 | 10 | −87.32 | M-O-TS2 | 2 | 2.24 |
| T-S-TS3 | 9 | −64.03 | M-S-TS3 | 10 | −24.46 |
| T-A-TS3 | 1 | −16.53 | M-A-TS3 | 1 | −26.92 |
| T-O-TS3 | 9 | −70.89 | M-O-TS3 | 2 | 15.48 |
Publisher’s Note: MDPI stays neutral with regard to jurisdictional claims in published maps and institutional affiliations. |
© 2022 by the authors. Licensee MDPI, Basel, Switzerland. This article is an open access article distributed under the terms and conditions of the Creative Commons Attribution (CC BY) license (https://creativecommons.org/licenses/by/4.0/).
Share and Cite
Feng, L.; Zhao, W.; Wang, J.; Lin, K.-Y.; Guo, Y.; Zhang, L. Data-Driven Technology Roadmaps to Identify Potential Technology Opportunities for Hyperuricemia Drugs. Pharmaceuticals 2022, 15, 1357. https://0-doi-org.brum.beds.ac.uk/10.3390/ph15111357
Feng L, Zhao W, Wang J, Lin K-Y, Guo Y, Zhang L. Data-Driven Technology Roadmaps to Identify Potential Technology Opportunities for Hyperuricemia Drugs. Pharmaceuticals. 2022; 15(11):1357. https://0-doi-org.brum.beds.ac.uk/10.3390/ph15111357
Chicago/Turabian StyleFeng, Lijie, Weiyu Zhao, Jinfeng Wang, Kuo-Yi Lin, Yanan Guo, and Luyao Zhang. 2022. "Data-Driven Technology Roadmaps to Identify Potential Technology Opportunities for Hyperuricemia Drugs" Pharmaceuticals 15, no. 11: 1357. https://0-doi-org.brum.beds.ac.uk/10.3390/ph15111357