Ultra-Early and Early Changes in Bile Acids and Insulin after Sleeve Gastrectomy among Obese Patients

 ,
,
Abstract
:1. Introduction
2. Materials and Methods
2.1. Patients and Study Design
2.2. Study Measurements
2.3. Surgical Procedure
2.4. Statistical Analysis
3. Results
Correlations
4. Discussion
5. Conclusions
Author Contributions
Funding
Conflicts of Interest
References
- Blüher, M. Obesity: global epidemiology and pathogenesis. Nat. Rev. Endocrinol. 2019, 5, 288–298. [Google Scholar] [CrossRef]
- Cătoi, A.F.; Pârvu, A.E.; Mureşan, A.; Busetto, L. Metabolic mechanisms in obesity and type 2 Diabetes: Insights from bariatric/metabolic surgery. Obes. Facts 2015, 8, 350–363. [Google Scholar]
- Browning, M.G.; Pessoa, B.M.; Khoraki, J.; Campos, G.M. Changes in bile acid metabolism, transport, and signaling as central drivers for metabolic improvements after bariatric surgery. Curr. Obes. Rep. 2019, 8, 175–184. [Google Scholar] [CrossRef] [PubMed]
- Gonçalves, C.G.; Glade, M.J.; Meguid, M.M. Metabolically healthy obese individuals: Key protective factors. Nutrition 2016, 32, 14–20. [Google Scholar] [CrossRef]
- Cătoi, A.F.; Busetto, L. Metabolically healthy obesity and bariatric surgery. Obes. Surg. 2019, 29, 2989–3000. [Google Scholar] [CrossRef] [PubMed]
- Pucci, A.; Batterham, R.L. Mechanisms underlying the weight loss effects of RYGB and SG: Similar, yet different. J. Endocrinol. Investig. 2019, 42, 117–128. [Google Scholar] [CrossRef] [PubMed]
- Albaugh, V.L.; Banan, B.; Ajouz, H.; Abumrad, N.N.; Flynn, C.R. Bile acids and bariatric surgery. Mol Aspects Med. 2017, 56, 75–89. [Google Scholar] [CrossRef]
- Heneghan, H.M.; Nissen, S.; Schauer, P.R. Gastrointestinal surgery for obesity and diabetes: Weight loss and control of hyperglycemia. Curr. Atheroscler. Rep. 2012, 14, 579–587. [Google Scholar] [CrossRef]
- Cole, A.J.; Teigen, L.M.; Jahansouz, C.; Earthman, C.P.; Sibley, S.D. The Influence of bariatric surgery on serum bile acids in humans and potential metabolic and hormonal implications: A systematic review. Curr. Obes. Rep. 2015, 4, 441–450. [Google Scholar] [CrossRef]
- Thaler, J.P.; Cummings, D.E. Minireview: Hormonal and metabolic mechanisms of diabetes remission after gastrointestinal surgery. Endocrinology 2009, 150, 2518–2525. [Google Scholar] [CrossRef]
- Fouladi, F.; Mitchell, J.E.; Wonderlich, J.A.; Steffen, K.J. The contributing role of bile acids to metabolic improvements after obesity and metabolic surgery. Obes. Surg. 2016, 26, 2492–2502. [Google Scholar] [CrossRef] [PubMed]
- Mazidi, M.; de Caravatto, P.P.; Speakman, J.R.; Cohen, R.V. Mechanisms of action of surgical interventions on weight-related diseases: The potential role of bile acids. Obes. Surg. 2017, 27, 826–836. [Google Scholar] [CrossRef] [PubMed]
- Steinert, R.E.; Peterli, R.; Keller, S.; Meyer-Gerspach, A.C.; Drewe, J.; Peters, T.; Beglinger, C. Bile acids and gut peptide secretion after bariatric surgery: A 1-year prospective randomized pilot trial. Obesity (Silver Spring) 2013, 21, E660–E668. [Google Scholar] [CrossRef] [PubMed]
- Gerhard, G.S.; Styer, A.M.; Wood, G.C.; Roesch, S.L.; Petrick, A.T.; Gabrielsen, J.; Strodel, W.E.; Still, C.D.; Argyropoulos, G. A role for fibroblast growth factor 19 and bile acids in diabetes remission after Roux-en-Y gastric bypass. Diabetes Care 2013, 36, 1859–1864. [Google Scholar] [CrossRef]
- Vincent, R.P.; Omar, S.; Ghozlan, S.; Taylor, D.R.; Cross, G.; Sherwood, R.A.; Fandriks, L.; Olbers, T.; Werling, M.; Alaghband-Zadeh, J.; et al. Higher circulating bile acid concentrations in obese patients with type 2 diabetes. Ann. Clin. Biochem. 2013, 50, 360–364. [Google Scholar] [CrossRef]
- Haeusler, R.A.; Camastra, S.; Nannipieri, M. Increased bile acid synthesis and impaired bile acid transport in human obesity. J. Clin. Endocrinol. Metab. 2016, 101, 1935–1944. [Google Scholar] [CrossRef]
- Haluzíková, D.; Lacinová, Z.; Kaválková, P.; Drápalová, J.; Křížová, J.; Bártlová, M.; Mráz, M.; Petr, T.; Vítek, L.; Kasalický, M.; et al. Laparoscopic sleeve gastrectomy differentially affects serum concentrations of FGF-19 and FGF-21 in morbidly obese subjects. Obesity 2013, 21, 1335–1342. [Google Scholar] [CrossRef]
- Patti, M.E.; Houten, S.M.; Bianco, A.C.; Bernier, R.; Larsen, P.R.; Holst, J.J.; Badman, M.K.; Maratos-Flier, E.; Mun, E.C.; Pihlajamaki, J.; et al. Serum bile acids are higher in humans with prior gastric bypass: Potential contribution to improved glucose and lipid metabolism. Obesity 2009, 17, 1671–1677. [Google Scholar] [CrossRef]
- Nakatani, H.; Kasama, K.; Oshiro, T.; Watanabe, M.; Hirose, H.; Itoh, H. Serum bile acid along with plasma incretins and serum high-molecular weight adiponectin levels are increased after bariatric surgery. Metabolism 2009, 58, 1400–1407. [Google Scholar] [CrossRef]
- Ferrell, M.J.; Chiang, J.Y.L. Understanding bile acid signaling in diabetes: From pathophysiology to therapeutic targets. Diabetes Metab J. 2019, 43, 257–272. [Google Scholar] [CrossRef]
- Mueller, M.; Thorell, A.; Claudel, T.; Jha, P.; Koefeler, H.; Lackner, C.; Hoesel, B.; Fauler, G.; Stojakovic, T.; Einarsson, C.; et al. Ursodeoxycholic acid exerts farnesoid X receptorantagonistic effects on bile acid and lipid metabolism in morbid obesity. J. Hepatol. 2015, 62, 1398–1404. [Google Scholar] [CrossRef] [PubMed]
- Staels, B.; Kuipers, F. Bile acid sequestrants and the treatment of type 2 diabetes mellitus. Drugs 2007, 67, 1383–1392. [Google Scholar] [CrossRef] [PubMed]
- Vítek, L. Bile Acids in the treatment of cardiometabolic diseases. Ann Hepatol. 2017, 16, s43–s52. [Google Scholar] [CrossRef] [PubMed]
- Buchwald, H.; Oien, D.M. Metabolic/bariatric surgery worldwide 2011. Obes. Surg. 2013, 23, 427–436. [Google Scholar] [CrossRef] [PubMed]
- Kaska, L.; Sledzinski, T.; Chomiczewska, A.; Dettlaff-Pokora, A.; Swierczynski, J. Improved glucose metabolism following bariatric surgery is associated with increased circulating bile acid concentrations and remodeling of the gut microbiome. World J. Gastroenterol. 2016, 22, 8698–8719. [Google Scholar] [CrossRef]
- Kohli, R.; Bradley, D.; Setchell, K.D.; Eagon, J.C.; Abumrad, N.; Klein, S. Weight loss induced by Roux-en-Y gastric bypass but not laparoscopic adjustable gastric banding increases circulating bile acids. J. Clin. Endocrinol. Metab. 2013, 98, E708–E712. [Google Scholar] [CrossRef]
- Sachdev, S.; Wang, Q.; Billington, C.; Connett, J.; Ahmed, L.; Inabnet, W.; Chua, S.; Ikramuddin, S.; Korner, J. FGF 19 and bile acids increase following Roux-en-Y gastric bypass but not after medical management in patients with type 2 diabetes. Obes. Surg. 2016, 26, 957–965. [Google Scholar] [CrossRef]
- Albaugh, V.L.; Flynn, C.R.; Cai, S.; Xiao, Y.; Tamboli, R.A.; Abumrad, N.N. Early increases in bile acids post Roux-en-Y gastric bypass are driven by insulin-sensitizing, secondary bile acids. J. Clin. Endocrinol. Metab. 2015, 100, E1225–E1233. [Google Scholar] [CrossRef]
- Jahansouz, C.; Xu, H.; Hertzel, A.V.; Serrot, F.J.; Kvalheim, N.; Cole, A.; Abraham, A.; Luthra, G.; Ewing, K.; Leslie, D.B.; et al. Bile acids increase independently from hypocaloric restriction after bariatric surgery. Ann. Surg. 2016, 264, 1022–1028. [Google Scholar] [CrossRef]
- Khan, F.H.; Shaw, L.; Zhang, W.; Salazar Gonzalez, R.M.; Mowery, S.; Oehrle, M.; Zhao, X.; Jenkins, T.; Setchell, K.D.; Inge, T.H.; et al. Fibroblast growth factor 21 correlates with weight loss after vertical sleeve gastrectomy in adolescents. Obesity (Silver Spring) 2016, 24, 2377–2383. [Google Scholar] [CrossRef]
- Huang, H.H.; Lee, W.J.; Chen, S.C.; Chen, T.F.; Lee, S.D.; Chen, C.Y. Bile acid and fibroblast growth factor 19 regulation in obese diabetics, and non-alcoholic fatty liver disease after sleeve gastrectomy. J. Clin. Med. 2019, 8, 815. [Google Scholar] [CrossRef]
- Shimizu, H.; Hatao, F.; Imamura, K.; Takanishi, K.; Tsujino, M. Early effects of sleeve gastrectomy on obesity-related cytokines and bile acid metabolism in morbidly obese japanese patients. Obes. Surg. 2017, 27, 3223–3229. [Google Scholar] [CrossRef]
- Belgaumkar, A.P.; Vincent, R.P.; Carswell, K.A.; Hughes, R.D.; Alaghband-Zadeh, J.; Mitry, R.R.; le Roux, C.W.; Patel, A.G. Changes in bile acid profile after laparoscopic sleeve gastrectomy are associated with improvements in metabolic profile and fatty liver disease. Obes. Surg. 2016, 26, 1195–1202. [Google Scholar] [CrossRef] [PubMed]
- Chen, Y.; Lu, J.; Nemati, R.; Plank, L.D.; Murphy, R. Acute changes of bile acids and FGF19 after sleeve gastrectomy and Roux-en-Y gastric bypass. Obes. Surg. 2019. [Google Scholar] [CrossRef] [PubMed]
- Brethauer, S.A.; Kim, J.; el Chaar, M.; Papasavas, P.; Eisenberg, D.; Rogers, A.; Ballem, N.; Kligman, M.; Kothari, S.; ASMBS Clinical Issues Committee. Standardized outcomes reporting in metabolic and bariatric surgery. Surg. Obes. Relat. Dis. 2015, 11, 489–506. [Google Scholar] [CrossRef] [PubMed]
- Mattheus, D.R.; Hosker, J.P.; Rudenski, A.S.; Naylor, B.A.; Treacher, D.F.; Turner, R.C. Homeostasis model assessment: insulin resistance and beta-cell function from fasting plasma glucose and insulin concentrations in man. Diabetologia 1985, 28, 412–419. [Google Scholar] [CrossRef] [PubMed] [Green Version]
- Cătoi, A.F.; Pârvu, A.; Mironiuc, A.; Galea, R.F.; Mureşan, A.; Bidian, C.; Pop, I. Effects of sleeve gastrectomy on insulin resistance. Clujul Med. 2016, 89, 267–272. [Google Scholar]
- Hutch, C.R.; Sandoval, D.A. Physiological and molecular responses to bariatric surgery: markers or mechanisms underlying T2DM resolution? Ann. N. Y. Acad. Sci. 2017, 1391, 5–19. [Google Scholar] [CrossRef] [Green Version]
- Albaugh, V.L.; Flynn, C.R.; Tamboli, R.A.; Abumrad, N.N. Recent advances in metabolic and bariatric surgery. F1000Research 2016, 5 (F1000 Faculty Rev), 978. [Google Scholar]
- Escalona, A.; Muñoz, R.; Irribarra, V.; Solari, S.; Allende, F.; Francisco, M.J. Bile acids synthesis decreases after laparoscopic sleeve gastrectomy. Surg. Obes. Relat. Dis. 2016, 12, 763–769. [Google Scholar] [CrossRef]
- Haeusler, R.A.; Astiarraga, B.; Camastra, S.; Accili, D.; Ferrannini, E. Human insulin resistance is associated with increased plasma levels of 12α-hydroxylated bile acids. Diabetes 2013, 62, 4184–4191. [Google Scholar] [CrossRef] [Green Version]
- Sun, W.; Zhang, D.; Wang, Z.; Sun, J.; Xu, B.; Chen, Y.; Ding, L.; Huang, X.; Lv, X.; Lu, J.; et al. Insulin resistance is associated with total bile acid level in type 2 diabetic and nondiabetic population: A cross-sectional study. Medicine (Baltimore) 2016, 95, e2778. [Google Scholar] [CrossRef]
- De Vuono, S.; Ricci, M.A.; Nulli Migliola, E.; Monti, M.C.; Morretta, E.; Boni, M.; Ministrini, S.; Carino, A.; Fiorucci, S.; Distrutti, E.; et al. Serum bile acid levels before and after sleeve gastrectomy and their correlation with obesity-related comorbidities. Obes. Surg. 2019, 29, 2517–2526. [Google Scholar] [CrossRef] [PubMed]
- Echeverría, F.; Ortiz, M.; Valenzuela, R.; Videla, L.A. Long-chain polyunsaturated fatty acids regulation of PPARs, signaling: Relationship to tissue development and aging. Prostaglandins Leukot Essent Fatty Acids 2016, 114, 28–34. [Google Scholar] [CrossRef] [PubMed]
- Valenzuela, R.; Videla, L.A. The importance of the long-chain polyunsaturated fatty acid n-6/n-3 ratio in development of non-alcoholic fatty liver associated with obesity. Food Funct. 2011, 2, 644–648. [Google Scholar] [CrossRef] [PubMed]
- Zhang, Y.; Lickteig, A.J.; Csanaky, I.L.; Klaassen, C.D. Editor’s Highlight: Clofibrate decreases bile acids in livers of male mice by increasing biliary bile acid excretion in a PPARα-dependent manner. Toxicol Sci. 2017, 160, 351–360. [Google Scholar] [CrossRef] [PubMed]
- Molinaro, A.; Wahlström, A.; Marschall, H.U. Role of bile acids in metabolic control. Trends Endocrinol. Metab. 2018, 29, 31–41. [Google Scholar] [CrossRef] [PubMed]
- Martinot, E.; Sèdes, L.; Baptissart, M.; Lobaccaro, J.M.; Caira, F.; Beaudoin, C.; Volle, D.H. Bile acids and their receptors. Mol. Aspects Med. 2017, 56, 2–9. [Google Scholar] [CrossRef]
- Shapiro, H.; Kolodziejczyk, A.A.; Halstuch, D.; Elinav, E. Bile acids in glucose metabolism in health and disease. J. Exp. Med. 2018, 215, 383–396. [Google Scholar] [CrossRef]
- Argyropoulos, G. Bariatric Surgery: Prevalence, predictors, and mechanisms of diabetes remission. Curr. Diab. Rep. 2015, 15, 15. [Google Scholar] [CrossRef]
- Staels, B.; Prawitt, J. Soaping up type 2 diabetes with bile acids: The link between glucose and bile acid metabolism in humans tightens: Quality matters! Diabetes 2013, 62, 3987–3989. [Google Scholar] [CrossRef] [Green Version]
- Watanabe, M.; Houten, S.M.; Mataki, C.; Christoffolete, M.A.; Kim, B.W.; Sato, H.; Messaddeq, N.; Harney, J.W.; Ezaki, O.; Kodama, T.; et al. Bile acids induce energy expenditure by promoting intracellular thyroid hormone activation. Nature 2006, 439, 484–489. [Google Scholar]
- Flynn, C.R.; Albaugh, V.L.; Abumrad, N.N. Metabolic effects of bile acids: Potential role in bariatric surgery. Cell. Mol. Gastroenterol. Hepatol. 2019, 8, 235–246. [Google Scholar] [CrossRef] [Green Version]
- Ahmad, N.N.; Pfalzer, A.; Kaplan, L.M. Roux-en-Y gastric bypass normalizes the blunted postprandial bile acid excursion associated with obesity. Int. J. Obes. (Lond) 2013, 37, 1553–1559. [Google Scholar] [CrossRef] [PubMed] [Green Version]
- De Giorgi, S.; Campos, V.; Egli, L.; Toepel, U.; Carrel, G.; Cariou, B.; Rainteau, D.; Schneiter, P.; Tappy, L.; Giusti, V. Long-term effects of Roux-en-Y gastric bypass on postprandial plasma lipid and bile acids kinetics in female non diabetic subjects: A cross-sectional pilot study. Clin. Nutr. 2015, 34, 911–917. [Google Scholar] [CrossRef] [PubMed]
- Jørgensen, N.B.; Dirksen, C.; Bojsen-Møller, K.N.; Kristiansen, V.B.; Wulff, B.S.; Rainteau, D.; Humbert, L.; Rehfeld, J.F.; Holst, J.J.; Madsbad, S.; et al. Improvements in glucose metabolism early after gastric bypass surgery are not explained by increases in total bile acids and fibroblast growth factor 19 concentrations. J. Clin. Endocrinol. Metab. 2015, 100, E396–E406. [Google Scholar] [CrossRef] [PubMed] [Green Version]
- Werling, M.; Vincent, R.P.; Cross, G.F.; Marschall, H.U.; Fändriks, L.; Lönroth, H.; Taylor, D.R.; Alaghband-Zadeh, J.; Olbers, T.; Le Roux, C.W. Enhanced fasting and post-prandial plasma bile acid responses after Roux-en-Y gastric bypass surgery. Scand. J. Gastroenterol. 2013, 48, 1257–1264. [Google Scholar] [CrossRef]
- Meydan, C.; Goldstein, N.; Weiss-Shwartz, E.; Lederfine, D.; Goitein, D.; Rubin, M.; Spivak, H. Immediate Metabolic Response Following Sleeve Gastrectomy in Obese Diabetics. Obes. Surg. 2015, 25, 2023–2029. [Google Scholar]
- Rizzello, M.; Abbatini, F.; Casella, G.; Alessandri, G.; Fantini, A.; Leonetti, F.; Basso, N. Early postoperative insulin-resistance changes after sleeve gastrectomy. Obes. Surg. 2010, 20, 50–55. [Google Scholar] [CrossRef]
- Bhutta, H.Y.; Rajpal, N.; White, W.; Freudenberg, J.M.; Liu, Y.; Way, J.; Rajpal, D.; Cooper, D.C.; Young, A.; Tavakkoli, A.; et al. Effect of Roux-en-Y gastric bypass surgery on bile acid metabolism in normal and obese diabetic rats. PLoS ONE 2015, 23, e0122273. [Google Scholar] [CrossRef]


| Pre-SG (n = 24) | 7 d after SG | 30 d after SG | |
|---|---|---|---|
| Weight (kg) | 130.96 ± 26.66 | 126.94 ± 27.14 * | 121.7 ± 29.46 * |
| BMI (kg/m2) | 46.15 ± 6.70 | 43.98 ± 6.91 * | 41.96 ± 7.48 * |
| Leptin (ng/mL) | 17.89 ± 12.81 | 9.81 ± 9.48 * | 10.15 ± 7.05 * |
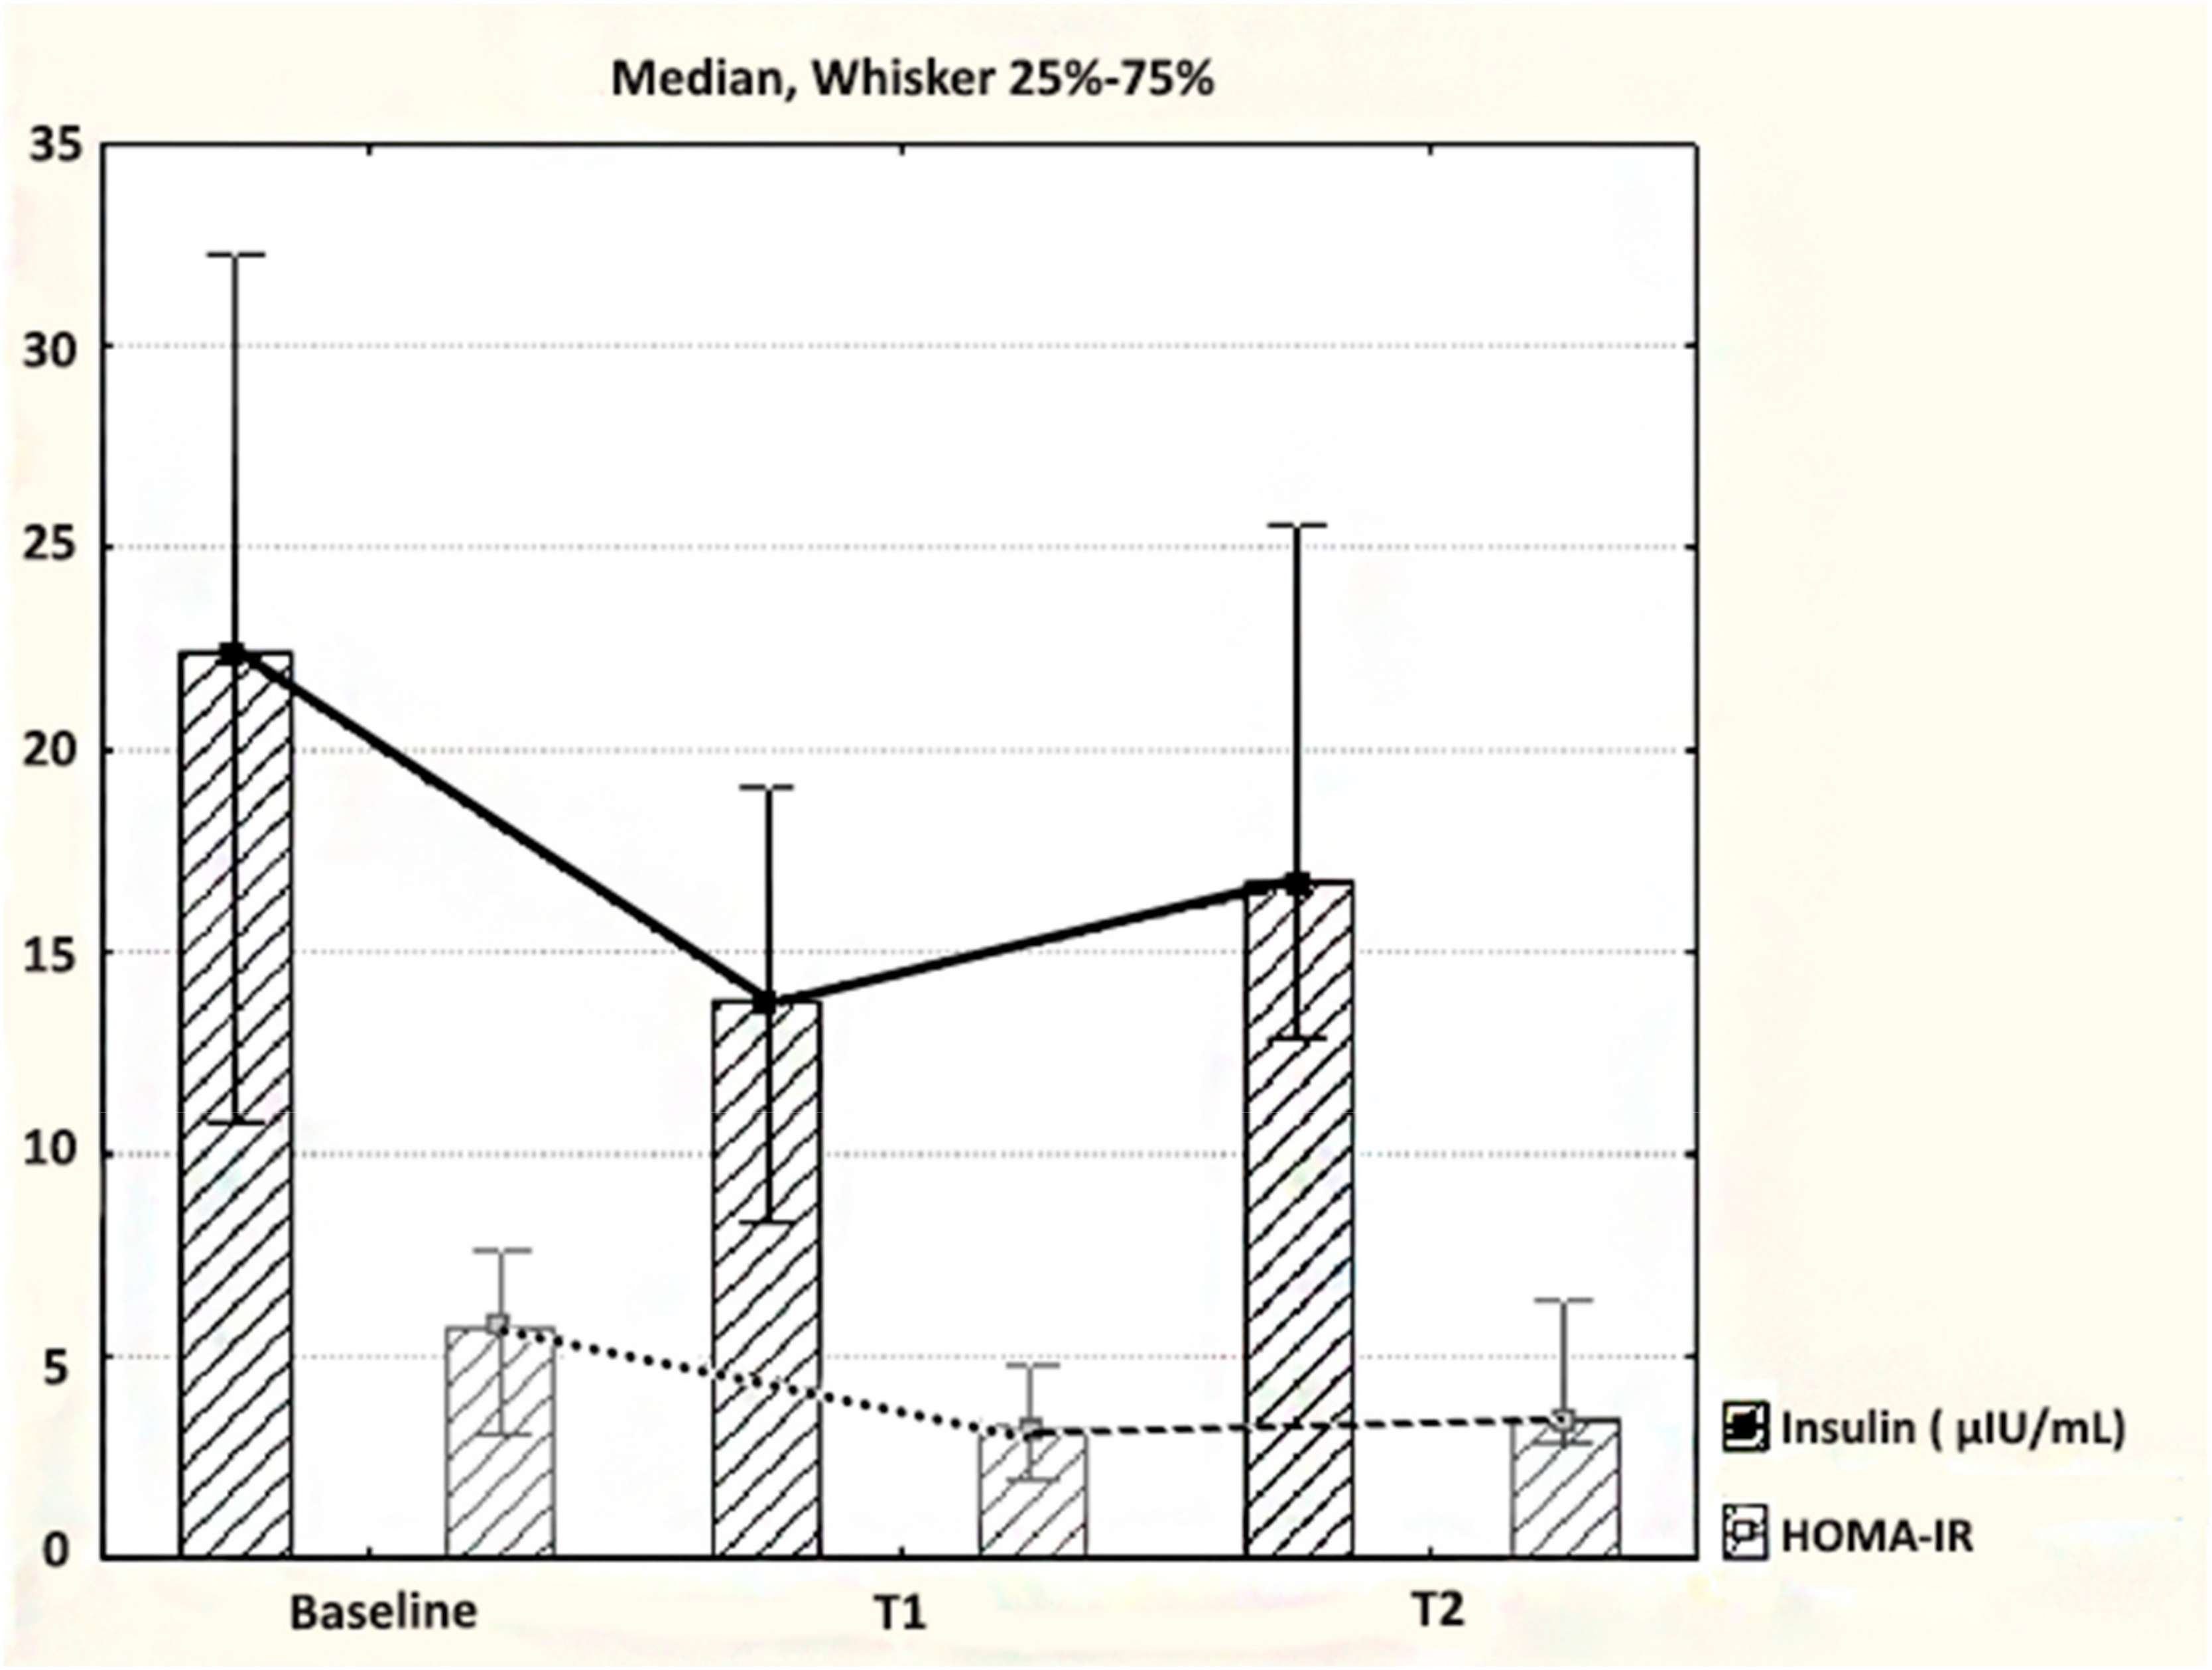
| Fasting insulin(μIU/mL) | 23.47 ± 13.20 | 13.71 (8.33–19.07) | 16.69 (12.84–25.62) |
| Fasting glucose (mg/dL) | 99.29 ± 21.57 | 96.88 ± 9.39 | 93.07 ± 10.24 |
| Homeostasis model assessment of insulin resistance (HOMA-IR) | 5.85 ± 3.62 | 3.19 (2.14–4.51) | 3.40 (2.91–5.25) |
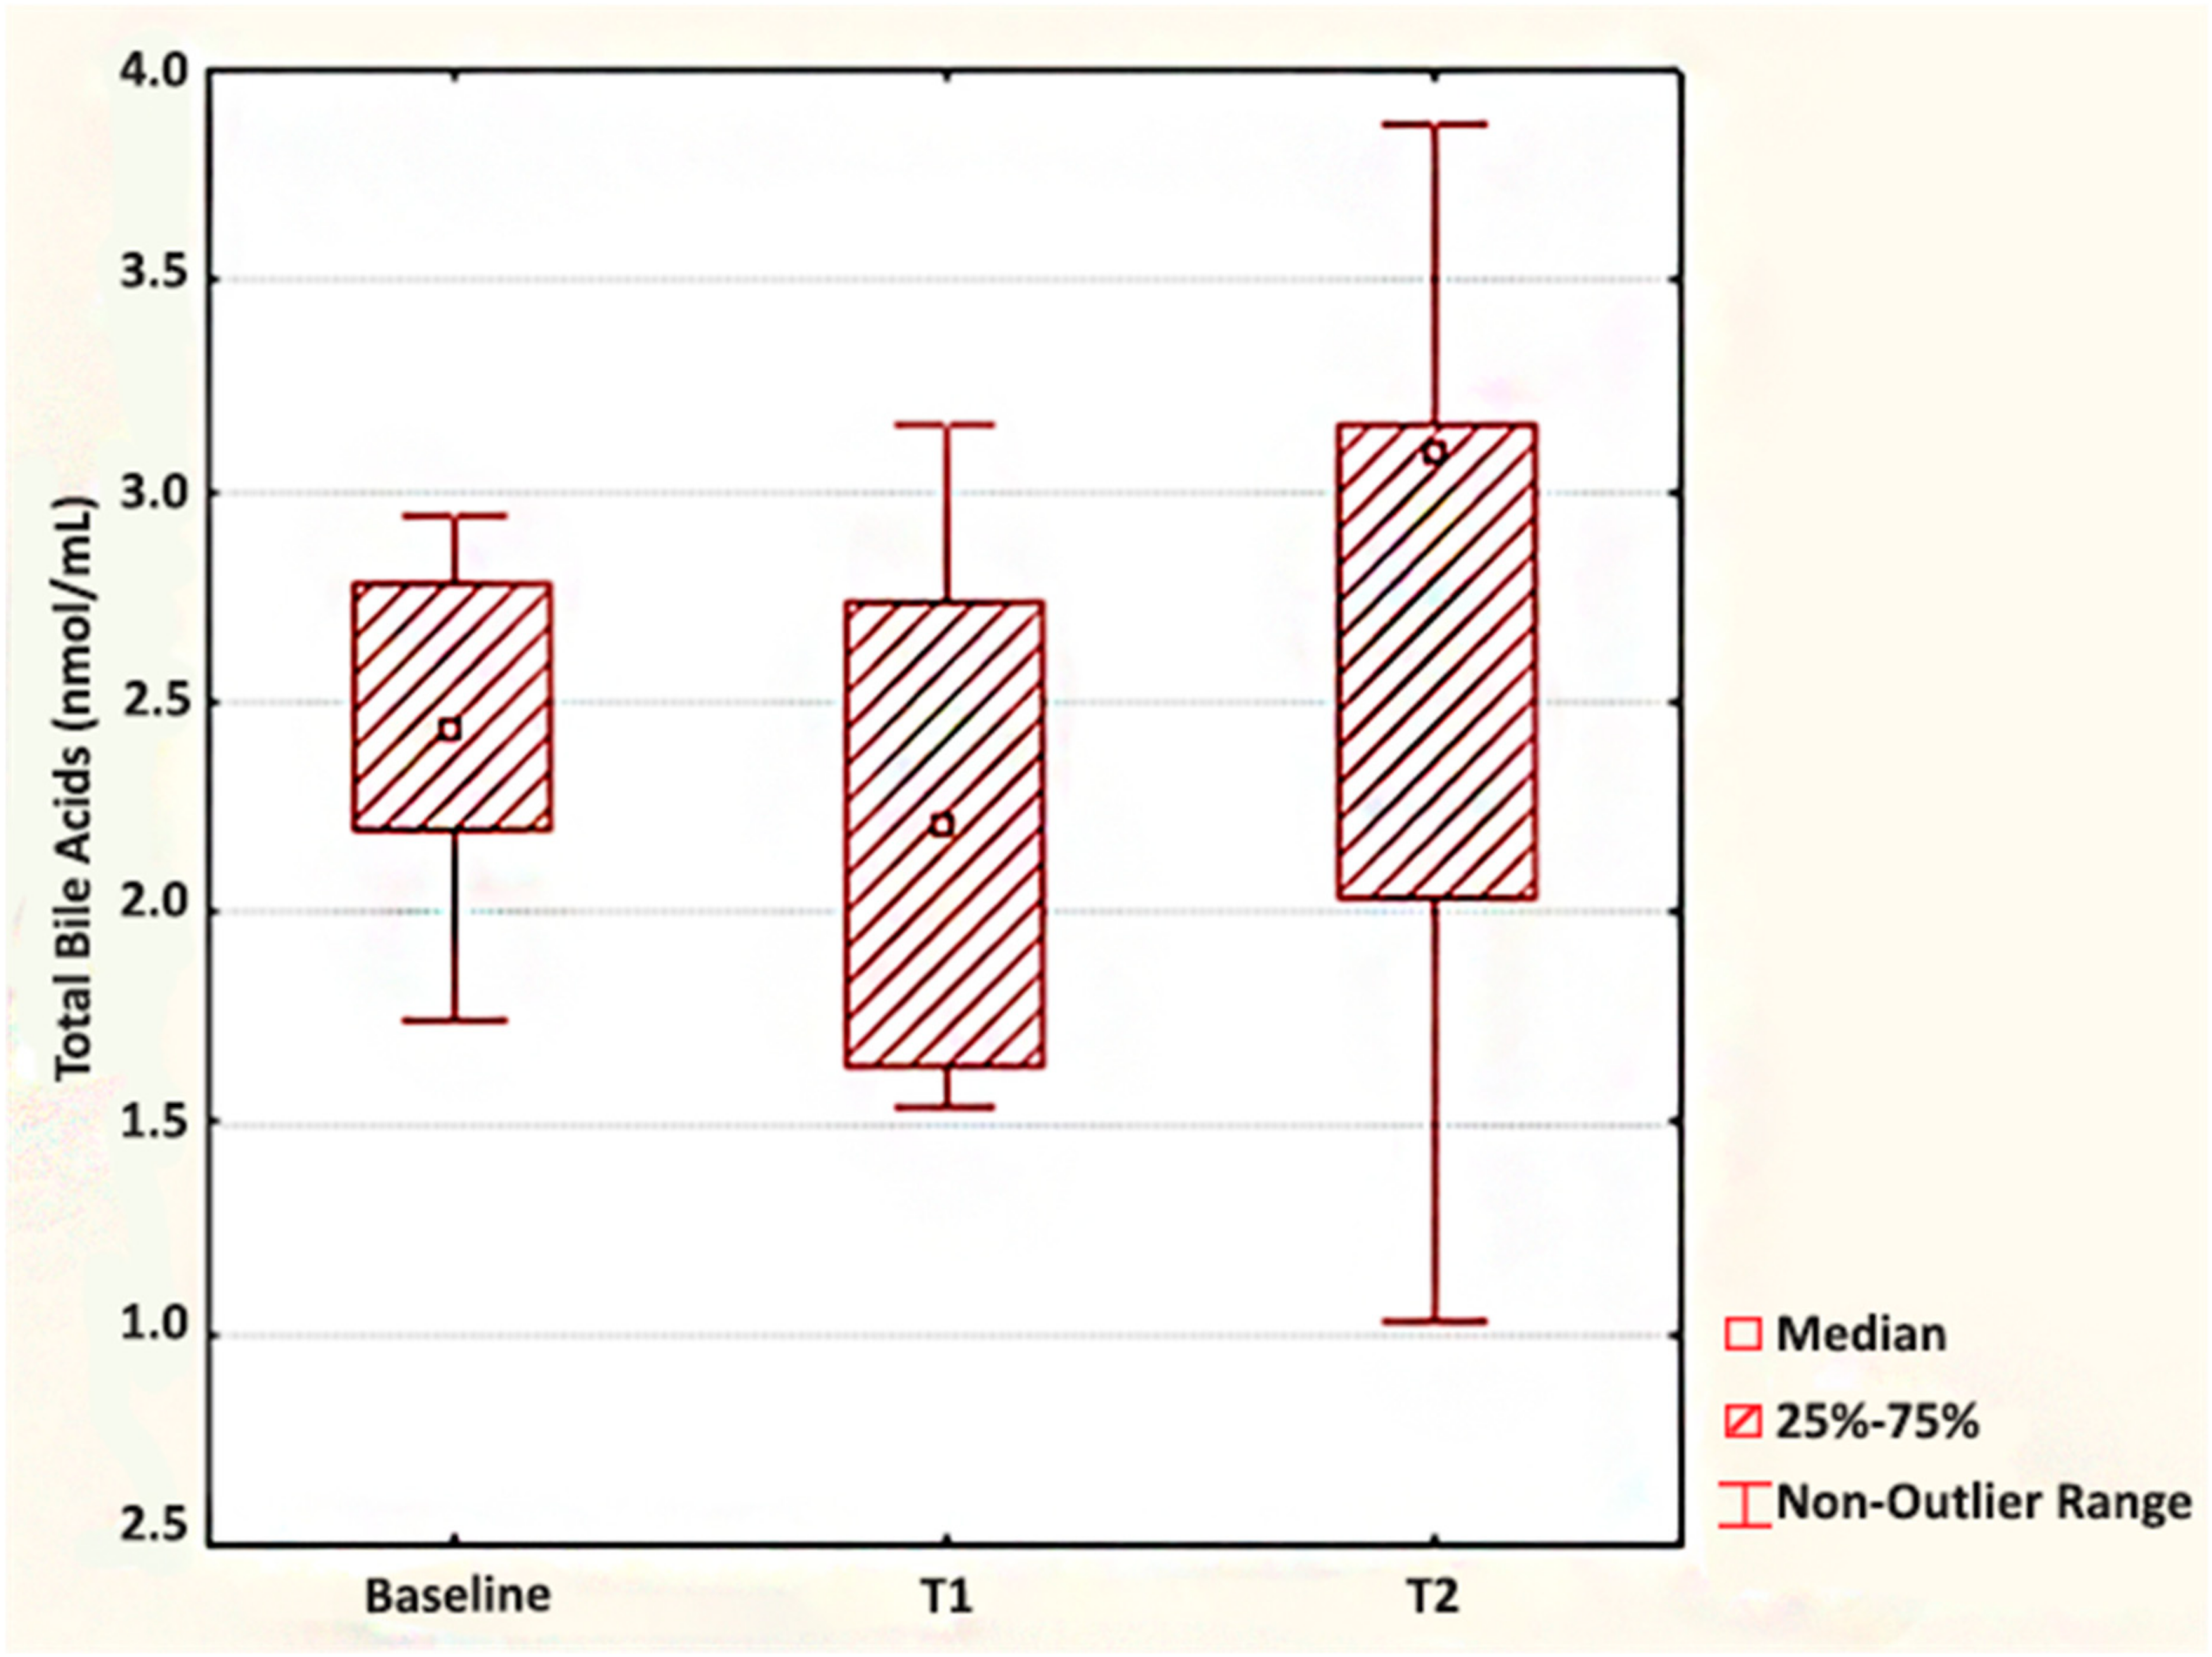
| Total fasting BA (nmol/mL) | 2.45 ± 0.38 | 2.20 (1.64–2.74) | 3.09 (2.03–3.16) |
| Total cholesterol (mg/dL) | 195.58 ± 33.34 | 186.69 ± 23.47 | 184.47 ± 35.81 |
| Triglycerides (mg/dL) | 152 ± 63.62 | 116.50 (110–190.5) | 144 (118.5–161.5) |
| High-density lipoprotein (HDL) cholesterol (mg/dL) | 52.14 ± 13.88 | 76 (71–80) | 76 (70.50–87.50) * |
| Low-density lipoprotein (LDL) cholesterol (mg/dL) | 112.48 ± 40.11 | 94.33 ± 29.54 | 73.09 ± 29.25 * |
| Parameters | Total BA (nmol/mL) at Baseline | Total BA at 7 d after SG | Total BA at 30 d after SG | |||
|---|---|---|---|---|---|---|
| r | p | r | p | r | p | |
| BMI (kg/m2) | −0.028 | 0.931 | −0.071 | 0.879 | 0.145 | 0.756 |
| Leptin (ng/mL) | −0.325 | 0.359 | −0.293 | 0.444 | −0.521 | 0.150 |
| Fasting insulin (μIU/mL) | −0.232 | 0.467 | −0.164 | 0.674 | −0.807 | 0.009 |
| Fasting glucose (mg/dL) | −0.370 | 0.236 | −0.611 | 0.108 | −0.761 | 0.047 |
| HOMA-IR | −0.176 | 0.584 | −0.180 | 0.670 | −0.855 | 0.014 |
| Total cholesterol (mg/dL) | 0.000 | 1.000 | −0.235 | 0.575 | 0.303 | 0.509 |
| Triglycerides (mg/dL) | 0.218 | 0.459 | −0.347 | 0.399 | 0.837 | 0.019 |
| HDL cholesterol (mg/dL) | -0.275 | 0.509 | 0.029 | 0.957 | 0.339 | 0.456 |
| LDL cholesterol (mg/dL) | −0.096 | 0.821 | 0.240 | 0.568 | 0.218 | 0.638 |
| Authors, Year of Publication | Sample Size | Postsurgical Follow-Up | Total Fasting BA Changes after Surgery |
|---|---|---|---|
| Steinert et al., 2013 | 7 | 1 week, 3 and 12 months | Decrease at one week Small but nonsignificant increase at 3 months Significant increase at one year |
| Haluzíková et al., 2013 | 17 | 6, 12, 24 months | No change |
| Escalona et al., 2016 | 19 | 1, 3, 6, 12 months | Decrease at one month Increase at 3, 6 and 12 months |
| Belgaumkar et al., 2016 | 18 | 6 months | No change |
| Jahansouz et al., 2016 | 12 | 7 d | Significant increase |
| Shimizu et al., 2017 | 10 | 1 and 6 months | No change |
| Chen et al., 2019 | 11 | 3 d and 3 months | Significant increase at 3 d Significant decrease at 3 months (but still higher than preoperative levels) |
| De Vuono et al., 2019 | 79 | 12 months | Significant reduction of primary BA and increase of secondary BA |
| Huang et al., 2019 | 18 | 3 and 12 months | Significant decrease at 3 and 12 months after surgery |
© 2019 by the authors. Licensee MDPI, Basel, Switzerland. This article is an open access article distributed under the terms and conditions of the Creative Commons Attribution (CC BY) license (http://creativecommons.org/licenses/by/4.0/).
Share and Cite
Cӑtoi, A.F.; Pârvu, A.E.; Mironiuc, A.; Silaghi, H.; Pop, I.D.; Andreicuț, A.D. Ultra-Early and Early Changes in Bile Acids and Insulin after Sleeve Gastrectomy among Obese Patients. Medicina 2019, 55, 757. https://0-doi-org.brum.beds.ac.uk/10.3390/medicina55120757
Cӑtoi AF, Pârvu AE, Mironiuc A, Silaghi H, Pop ID, Andreicuț AD. Ultra-Early and Early Changes in Bile Acids and Insulin after Sleeve Gastrectomy among Obese Patients. Medicina. 2019; 55(12):757. https://0-doi-org.brum.beds.ac.uk/10.3390/medicina55120757
Chicago/Turabian StyleCӑtoi, Adriana Florinela, Alina Elena Pârvu, Aurel Mironiuc, Horațiu Silaghi, Ioana Delia Pop, and Andra Diana Andreicuț. 2019. "Ultra-Early and Early Changes in Bile Acids and Insulin after Sleeve Gastrectomy among Obese Patients" Medicina 55, no. 12: 757. https://0-doi-org.brum.beds.ac.uk/10.3390/medicina55120757