An Optoelectronic System for Measuring the Range of Motion in Healthy Volunteers: A Cross-Sectional Study


 ,
,  ,
,
Abstract
:1. Introduction
2. Materials and Methods
2.1. Participants and Study Design
2.2. Instrumentation
2.3. Procedures
2.4. Data Analysis
3. Results
4. Discussion
5. Conclusions
Author Contributions
Funding
Conflicts of Interest
References
- Tanino, H.; Sato, T.; Nishida, Y.; Mitsutake, R.; Ito, H. Hip stability after total hip arthroplasty predicted by intraoperative stability test and range of motion: A cross-sectional study. BMC Musculoskelet Disord 2018, 19, 373. [Google Scholar] [CrossRef] [PubMed]
- Youdas, J.W.; McLean, T.J.; Krause, D.A.; Hollman, J.H. Changes in active ankle dorsiflexion range of motion after acute inversion ankle sprain. J. Sport Rehabil. 2009, 18, 358–374. [Google Scholar] [CrossRef] [PubMed]
- Gajdosik, R.L.; Bohannon, R.W. Clinical measurement of range of motion. Review of goniometry emphasizing reliability and validity. Phys. Ther. 1987, 67, 1867–1872. [Google Scholar] [CrossRef] [PubMed]
- Jones, A.; Sealey, R.; Crowe, M.; Gordon, S. Concurrent validity and reliability of the simple goniometer iPhone app compared with the universal goniometer. Physiother. Theory Pr. 2014, 30, 512–516. [Google Scholar] [CrossRef] [PubMed]
- Ferriero, G.; Vercelli, S.; Sartorio, F.; Muñoz Lasa, S.; Ilieva, E.; Brigatti, E.; Ruella, C.; Foti, C. Reliability of a smartphone-based goniometer for knee joint goniometry. Int. J. Rehabil. Res. 2013, 36, 146–151. [Google Scholar] [CrossRef] [Green Version]
- Moral-Muñoz, J.A.; Esteban-Moreno, B.; Arroyo-Morales, M.; Cobo, M.J.; Herrera-Viedma, E. Agreement Between face-to-face and free software video analysis for assessing hamstring flexibility in adolescents. J. Strength Cond Res. 2015, 29, 2661–2665. [Google Scholar] [CrossRef]
- Abd Elrahim, R.; Embaby, E.; Ali, M.; Kamel, R. Inter-rater and intra-rater reliability of Kinovea software for measurement of shoulder range of motion. Bull. Fac. Phys. Ther. 2016, 21, 80. [Google Scholar]
- Yazdifar, M.; Yazdifar, M.R.; Mahmud, J.; Esat, I.; Chizari, M. Evaluating the hip range of motion using the goniometer and video tracking methods. Procedia Eng. 2013, 68, 77–82. [Google Scholar] [CrossRef]
- Penning, L.I.F.; Guldemond, N.A.; de Bie, R.A.; Walenkamp, G. Reproducibility of a 3-dimensional gyroscope in measuring shoulder anteflexion and abduction. BMC Musculoskelet. Disord 2012, 13, 135. [Google Scholar] [CrossRef] [PubMed]
- Clark, R.A.; Paterson, K.; Ritchie, C.; Blundell, S.; Bryant, A.L. Design and validation of a portable, inexpensive and multi-beam timing light system using the Nintendo Wii hand controllers. J. Sci. Med. Sport 2011, 14, 177–182. [Google Scholar] [CrossRef]
- Padulo, J.; Vando, S.; Chamari, K.; Chaouachi, A.; Bagno, D.; Pizzolato, F. Validity of the MarkWiiR for kinematic analysis during walking and running gaits. Biol. Sport 2015, 32, 53–58. [Google Scholar] [CrossRef]
- Deutsch, J.E.; Brettler, A.; Smith, C.; Welsh, J.; John, R.; Guarrera-Bowlby, P.; Kafri, M. Nintendo wii sports and wii fit game analysis, validation, and application to stroke rehabilitation. Top. Stroke Rehabil. 2011, 18, 701–719. [Google Scholar] [CrossRef] [PubMed]
- Dos Santos, L.R.A.; Carregosa, A.A.; Masruha, M.R.; Dos Santos, P.A.; Da Silveira Coêlho, M.L.; Ferraz, D.D.; Da Silva Ribeiro, N.M. The use of nintendo wii in the rehabilitation of poststroke patients: A systematic review. J. Stroke Cereb. Dis. 2015, 24, 2298–2305. [Google Scholar] [CrossRef]
- Abellán, F.J.; Arenas, A.; Núñez, M.J.; Victoria, L. The use of a Nintendo Wii remote control in physics experiments. Eur. J. Phys. 2013, 34, 1277–1286. [Google Scholar] [CrossRef]
- Laza-Cagigas, R.; Goss-Sampson, M.; Larumbe-Zabala, E.; Termkolli, L.; Naclerio, F. Validity and reliability of a novel optoelectronic device to measure movement velocity, force and power during the back squat exercise. J. Sports Sci. 2019, 37, 795–802. [Google Scholar] [CrossRef] [PubMed]
- Peña García-Orea, G.; Belando-Pedreño, N.; Merino-Barrero, J.A.; Jiménez-Ruiz, A.; Heredia-Elvar, J.R. Validation of an opto-electronic instrument for the measurement of weighted countermovement jump execution velocity. Sports Biomech. 2018, 1–15. [Google Scholar] [CrossRef] [PubMed]
- Lee, J.C. Hacking the Nintendo Wii Remote. I EEE Pervasive Comput. 2008, 7, 39–45. [Google Scholar] [CrossRef]
- Norkin, C.C.; White, D.J. Measurement of Joint Motion: A Guide to Goniometry; F.A. Davis Company: Philadelphia, CO, USA, 2016; ISBN 978-0-8036-5847-9. [Google Scholar]
- Streiner, D.L.; Norman, G.R. Health Measurement Scales; Oxford University Press: Oxford, UK, 2008; ISBN 978-0-19-923188-1. [Google Scholar]
- Brosseau, L.; Tousignant, M.; Budd, J.; Chartier, N.; Duciaume, L.; Plamondon, S.; O’Sullivan, J.P.; O’Donoghue, S.; Balmer, S. Intratester and intertester reliability and criterion validity of the parallelogram and universal goniometers for active knee flexion in healthy subjects. Physiother. Res. Int. 1997, 2, 150–166. [Google Scholar] [CrossRef] [PubMed]
- Brosseau, L.; Balmer, S.; Tousignant, M.; O’Sullivan, J.P.; Goudreault, C.; Goudreault, M.; Gringras, S. Intra- and intertester reliability and criterion validity of the parallelogram and universal goniometers for measuring maximum active knee flexion and extension of patients with knee restrictions. Arch. Phys. Med. Rehabil. 2001, 82, 396–402. [Google Scholar] [CrossRef] [PubMed]
- Ockendon, M.; Gilbert, R.E. Validation of a novel smartphone accelerometer-based knee goniometer. J. Knee Surg. 2012, 25, 341–345. [Google Scholar] [CrossRef] [PubMed]
- Santos, C.M.; Ferreira, G.; Malacco, P.L.; Sabino, G.S.; Moraes, G.F.; Felício, D.C. Intra and inter examiner reliability and measurement error of goniometer and digital inclinometer use. Rev. Bras. Med. Esporte 2012, 18, 38–41. [Google Scholar] [CrossRef]


| Mean (SD) | Range | |
|---|---|---|
| Age (years) | 34.8 (12.5) | 18–61 |
| Body mass (kg) | 74.9 (20.7) | 54–170 |
| Stature (cm) | 171.4 (8.6) | 156–188 |
| BMI (kg/m2) | 25.3 (5.9) | 20.6–56.1 |
| Gender | Males (n = 19) | Females (n = 16) |
| Laterality | Right (n = 30) | Left (n = 5) |
| Movement | Goniometer (SD) | VeloFlex (SD) | Pearson Coefficient | Lo A− (%) | Lo A+ (%) | Mean Difference (%) | SD Difference (%) |
|---|---|---|---|---|---|---|---|
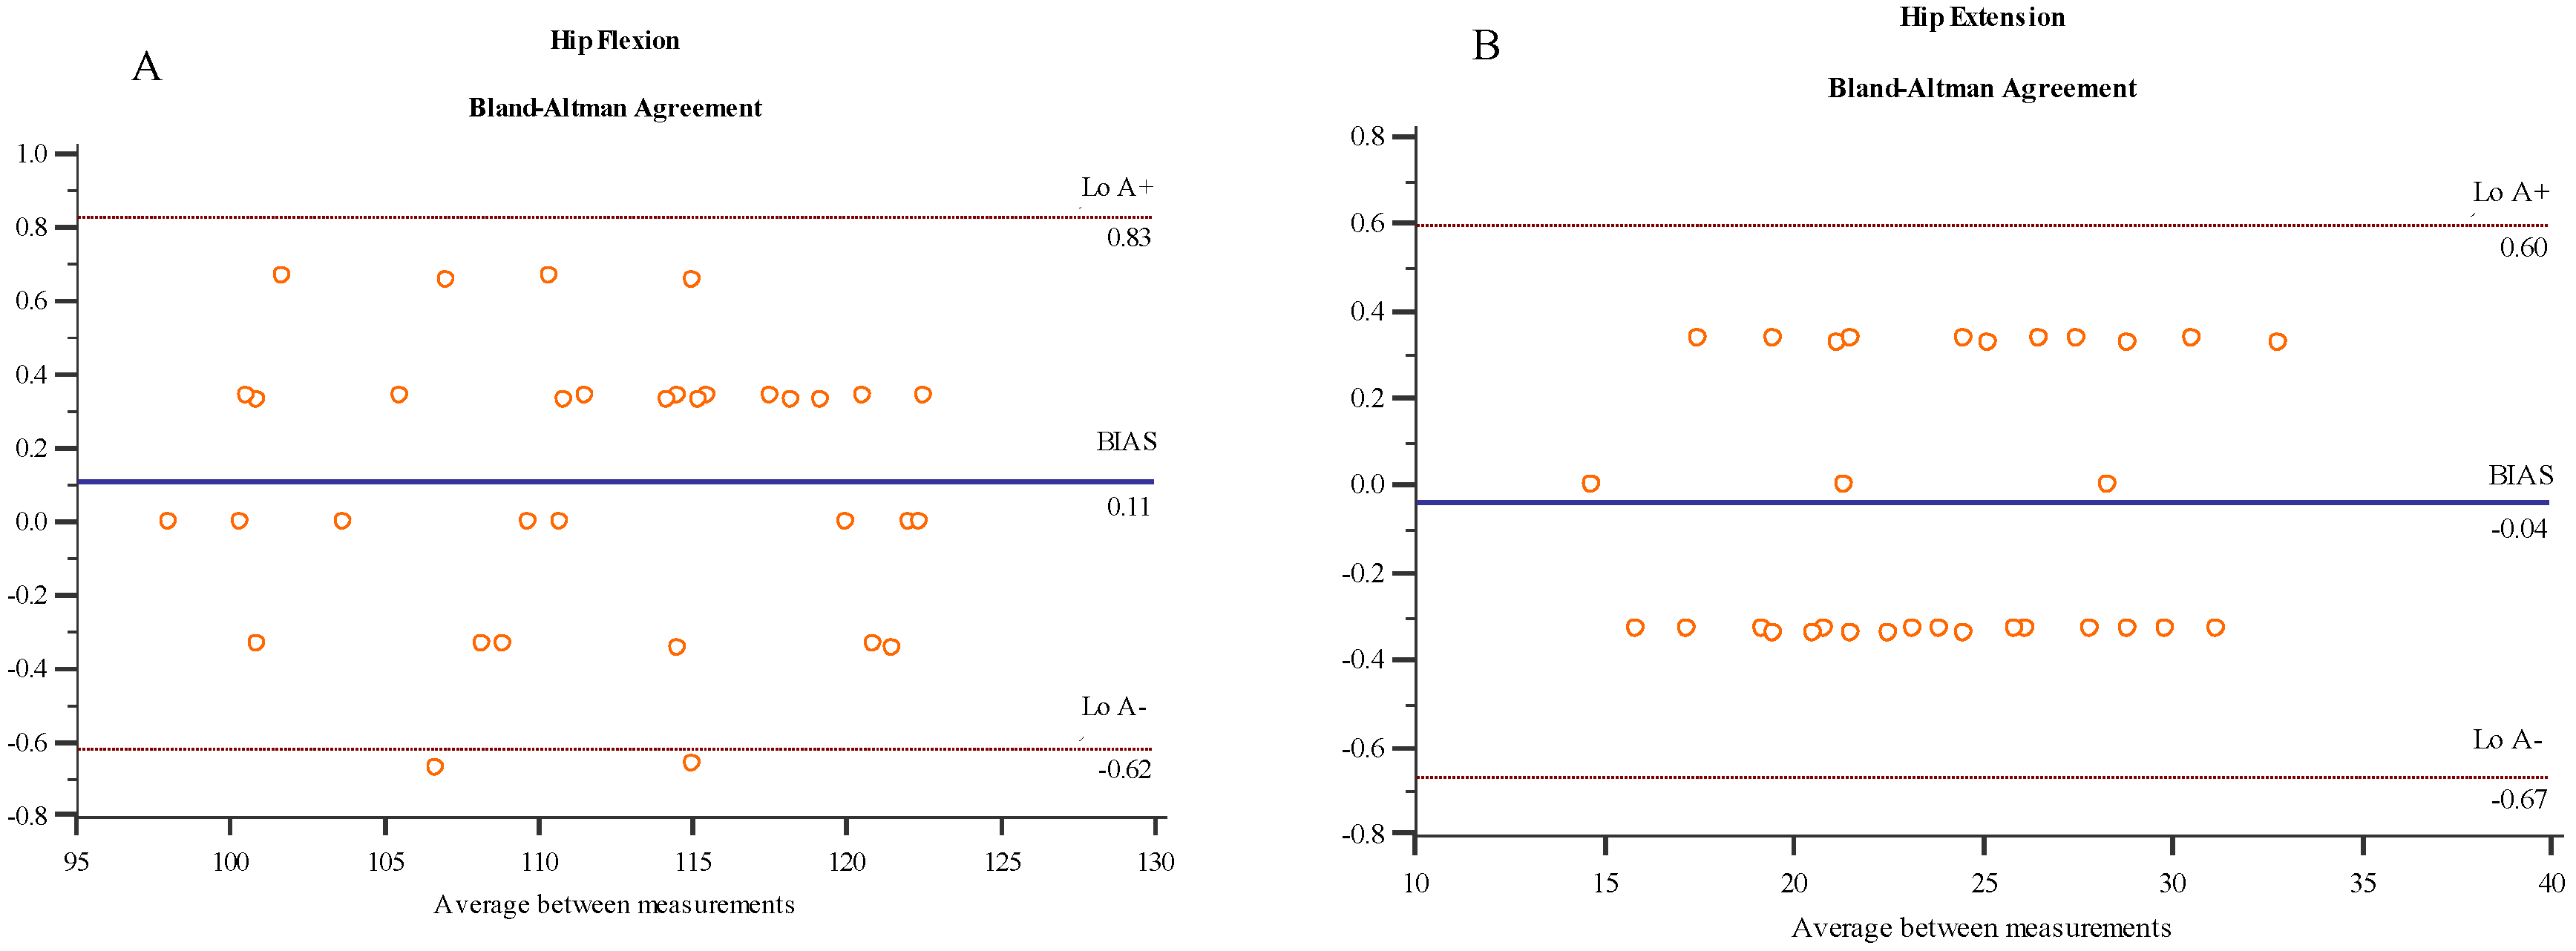
| HF | 111.70° (7.34°) | 111.81° (7.34°) | 0.999 | −0.62° (−0.6%) | 0.83° (0.7%) | 0.11° (0.1%) | 0.37° (0.3%) |
| HE | 23.96° (4.47°) | 23.92° (4.53°) | 0.998 | −0.67° (−2.7%) | 0.60° (2.4%) | −0.04° (−0.2%) | 0.32° (1.4%) |
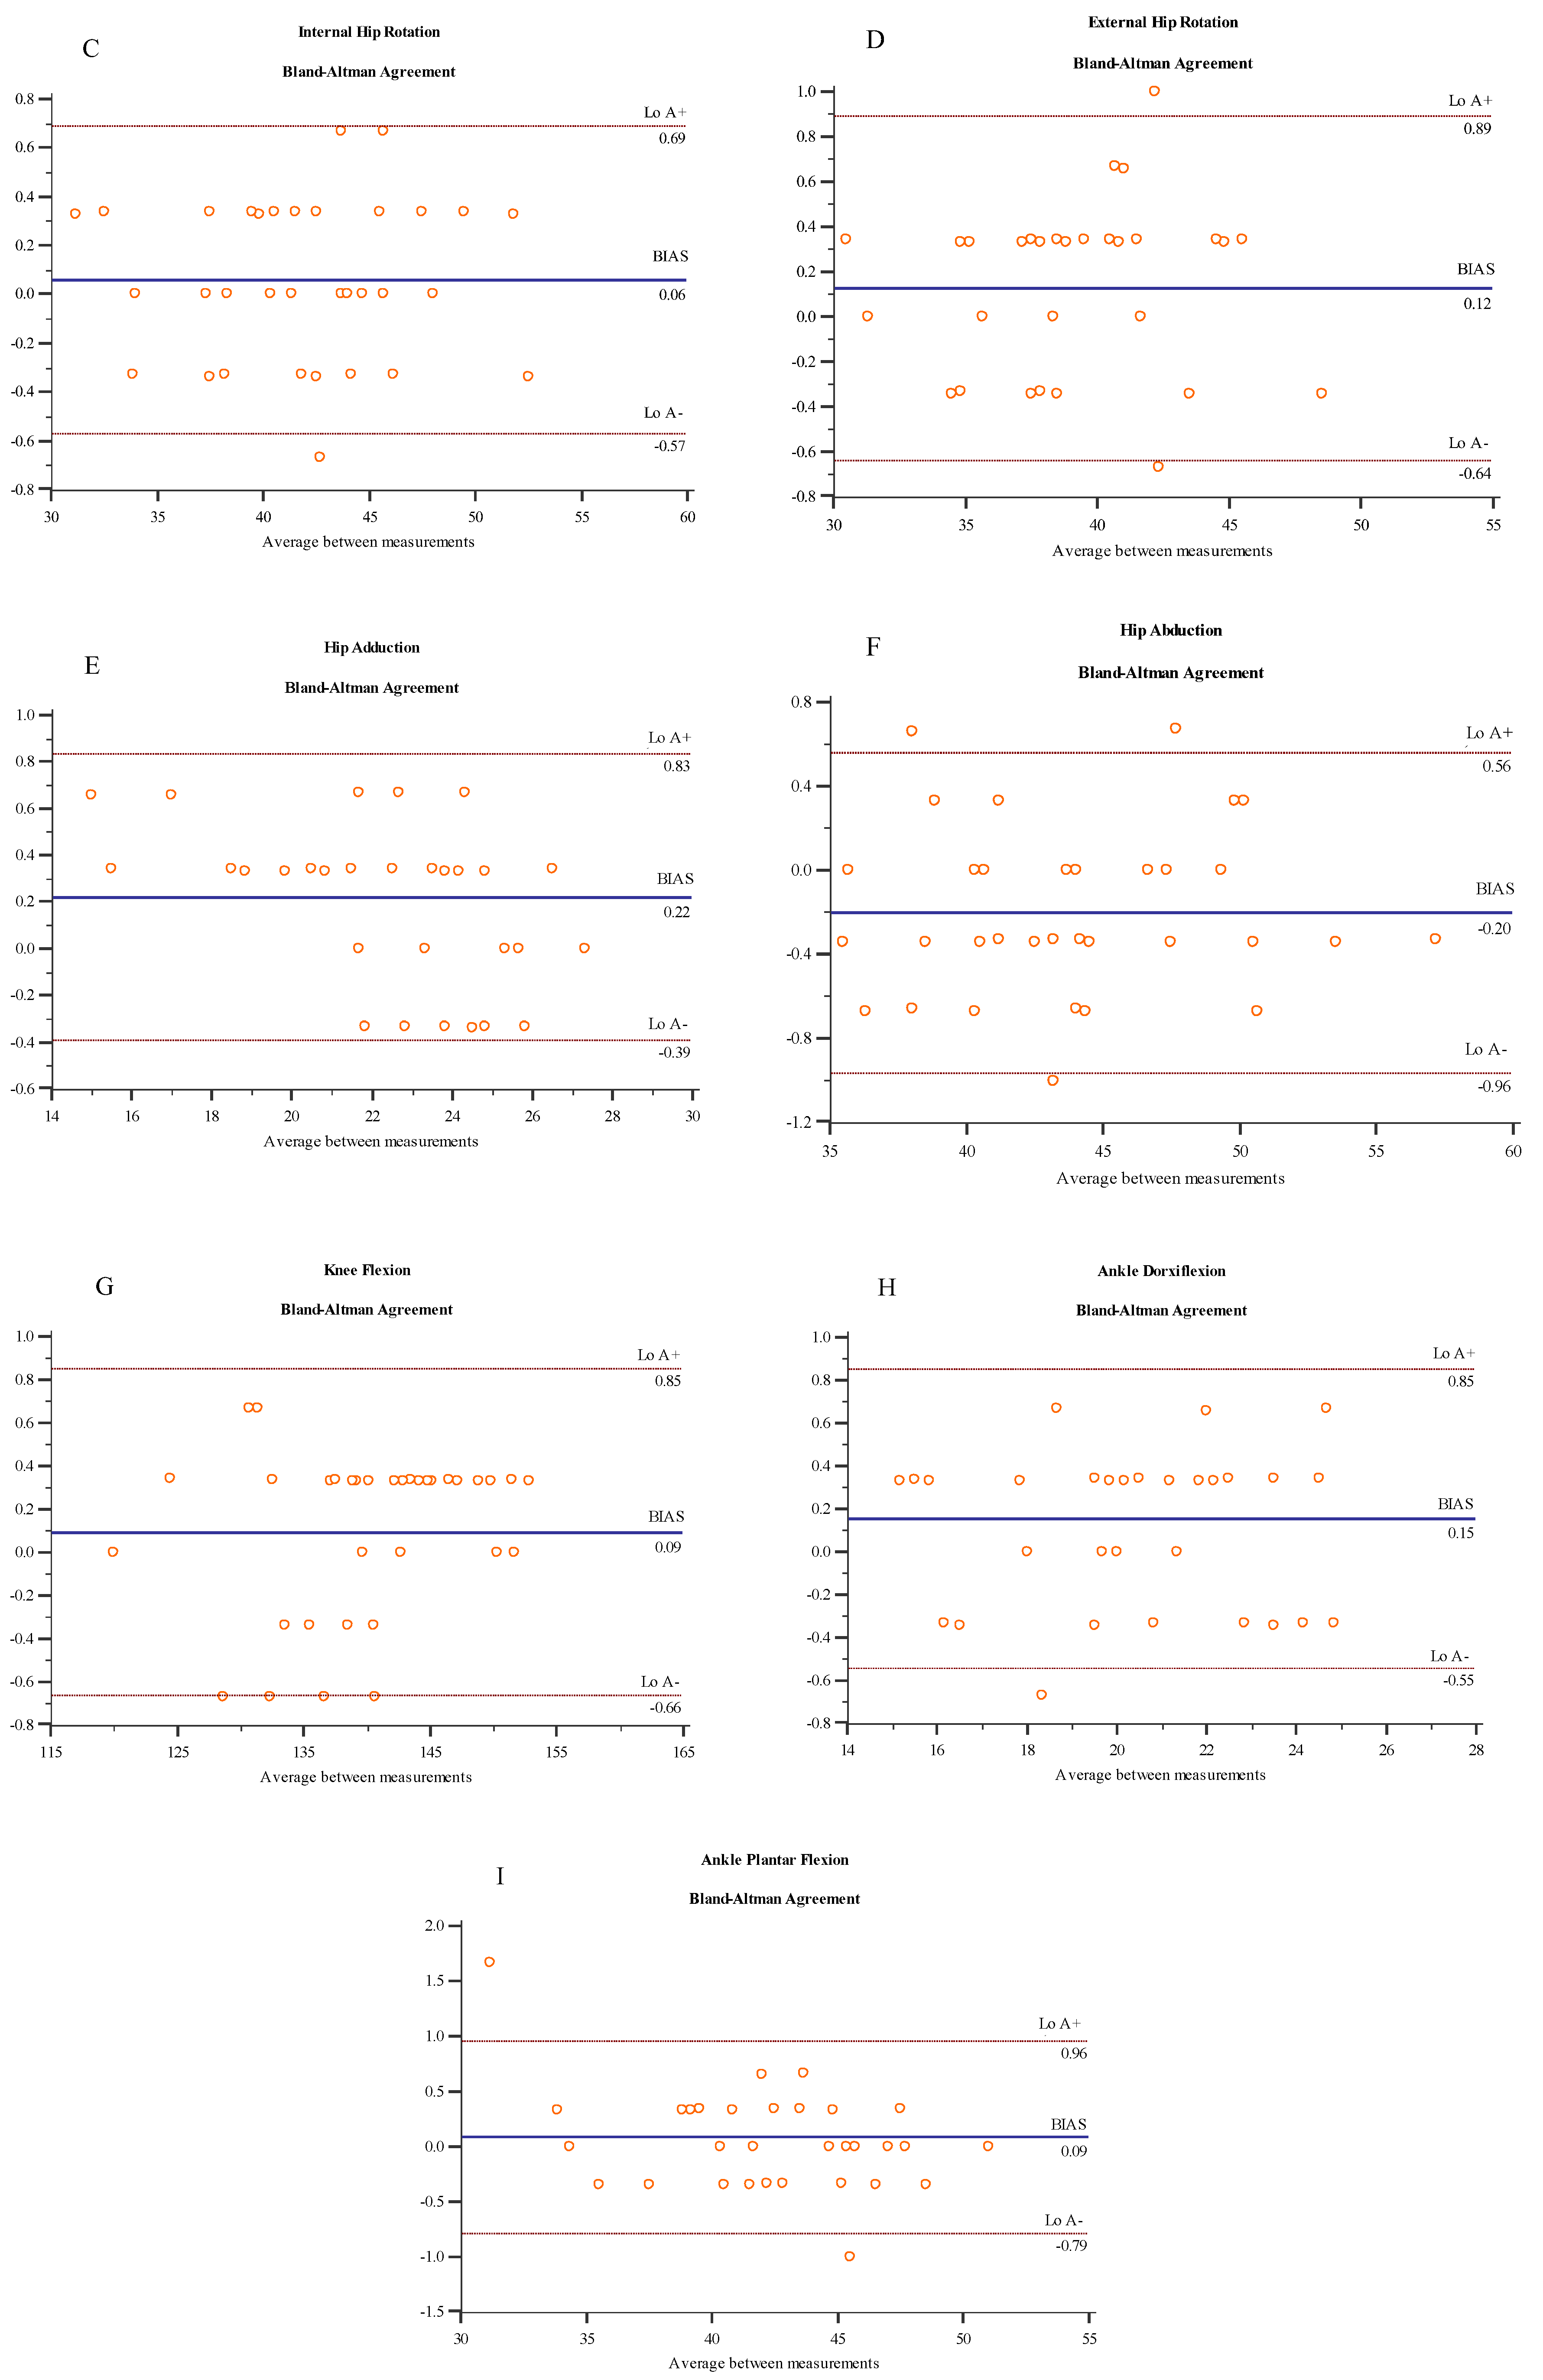
| HIR | 42.04° (5.06°) | 42.09° (5.06°) | 0.998 | −0.57° (−1.3%) | 0.69° (1.6%) | 0.06° (0.1%) | 0.32° (0.8%) |
| HER | 39.44° (3.91°) | 39.56° (3.91°) | 0.995 | −0.64° (−1.6% | 0.89° (2.2%) | 0.12° (0.3%) | 0.39° (1%) |
| HAD | 22.41° (3.05°) | 22.63° (2.92°) | 0.995 | −0.39° (−1.7%) | 0.83° (3.7%) | 0.22° (1.1%) | 0.31° (1.5%) |
| HAB | 44.21° (5.24°) | 44.01° (5.26°) | 0.997 | −0.96° (−2.1%) | 0.56° (1.2%) | −0.20° (−0.5%) | 0.39° (0.9%) |
| KF | 139.88° (7.75°) | 139.97° (7.84°) | 0.999 | −0.66° (−0.4%) | 0.85° (0.6%) | 0.09° (0.06%) | 0.39° (0.3%) |
| ADF | 20.27° (2.83°) | 20.42° (2.84°) | 0.992 | −0.55° (−2.6%) | 0.85° (4.1%) | 0.15° (0.8%) | 0.36° (1.8%) |
| APF | 42.28° (4.43°) | 42.36° (4.26°) | 0.995 | −0.79° (−1.8%) | 0.96° (2.2%) | 0.09° (0.3%) | 0.45° (1.2%) |
| Movement | Retest (SD) | ICC (95% CI) | SEM (SEM%) | MDC |
|---|---|---|---|---|
| HF | 111.37° (−7.81°) | 0.97 (0.95 to 0.99) | 1.17° (1.05%) | 3.26° |
| HE | 23.40° (−4.43°) | 0.98 (0.95 to 0.99) | 0.24° (1.03%) | 0.68° |
| HIR | 41.30° (−5.13°) | 0.98 (0.96 to 0.99) | 0.78° (1.90%) | 2.17° |
| HER | 39.48° (−4.55°) | 0.96 (0.93 to 0.98) | 0.79° (1.99%) | 2.18° |
| HAD | 22.26° (−3.21°) | 0.96 (0.93 to 0.98) | 0.59° (2.61%) | 1.63° |
| HAB | 44.30° (−5.65°) | 0.99 (0.97 to 0.99) | 0.87° (1.97%) | 2.42° |
| KF | 139.43° (−7.85°) | 0.99 (0.98 to 0.99) | 0.74° (0.53%) | 2.06° |
| ADF | 20.06° (−2.70°) | 0.93 (0.87 to 0.97) | 0.70° (1.71%) | 1.95° |
| APF | 41.85° (−4.39°) | 0.98 (0.95 to 0.99) | 0.65° (1.54%) | 1.81° |
| Movement | Examiner 2 (SD) | ICC (95% CI) | SEM (SEM%) | MDC |
|---|---|---|---|---|
| HF | 111.31° (−7.03°) | 0.95 (0.91 to 0.97) | 1.60° (1.43%) | 4.42° |
| HE | 23.64° (−4.39°) | 0.95 (0.91 to 0.98) | 0.93° (3.95%) | 2.57° |
| HIR | 41.90° (−5.42°) | 0.96 (0.91 to 0.98) | 1.10° (2.64%) | 3.04° |
| HER | 39.29° (−4.10°) | 0.94 (0.88 to 0.97) | 1.07° (2.72%) | 2.96° |
| HAD | 22.40° (3.24°) | 0.91 (0.82 to 0.95) | 0.97° (4.35%) | 2.69° |
| HAB | 42.78° (−5.14°) | 0.98 (0.95 to 0.99) | 0.82° (1.88%) | 2.27° |
| KF | 138.73° (−7.93°) | 0.98 (0.96 to 0.99) | 1.13° (0.81%) | 3.13° |
| ADF | 20.17° (−2.79°) | 0.88 (0.76 to 0.94) | 0.96° (4.76%) | 2.65° |
| APF | 41.71° (−4.17°) | 0.95 (0.91 to 0.98) | 0.91° (2.18%) | 2.52° |
© 2019 by the authors. Licensee MDPI, Basel, Switzerland. This article is an open access article distributed under the terms and conditions of the Creative Commons Attribution (CC BY) license (http://creativecommons.org/licenses/by/4.0/).
Share and Cite
Medina-Mirapeix, F.; Martín-San Agustín, R.; Cánovas-Ambit, G.; García-Vidal, J.A.; Gacto-Sánchez, M.; Escolar-Reina, P. An Optoelectronic System for Measuring the Range of Motion in Healthy Volunteers: A Cross-Sectional Study. Medicina 2019, 55, 516. https://0-doi-org.brum.beds.ac.uk/10.3390/medicina55090516
Medina-Mirapeix F, Martín-San Agustín R, Cánovas-Ambit G, García-Vidal JA, Gacto-Sánchez M, Escolar-Reina P. An Optoelectronic System for Measuring the Range of Motion in Healthy Volunteers: A Cross-Sectional Study. Medicina. 2019; 55(9):516. https://0-doi-org.brum.beds.ac.uk/10.3390/medicina55090516
Chicago/Turabian StyleMedina-Mirapeix, Francesc, Rodrigo Martín-San Agustín, Germán Cánovas-Ambit, José A. García-Vidal, Mariano Gacto-Sánchez, and Pilar Escolar-Reina. 2019. "An Optoelectronic System for Measuring the Range of Motion in Healthy Volunteers: A Cross-Sectional Study" Medicina 55, no. 9: 516. https://0-doi-org.brum.beds.ac.uk/10.3390/medicina55090516