1. Introduction
Obstructive sleep apnea (OSA) is a disorder that is characterized by recurrent episodes of interrupted breathing lasting more than 10 s (apnea), or by a reduction in airflow (hypopnea) during sleep associated with sleep fragmentation, awakenings, and decreased oxygen saturation. Since respiratory control is considered to be imperfect, up to five respiratory episodes during 60 min of sleep are considered normal [
1]. There are several ways to show the severity of desaturation during sleep as a consequence of OSA. The oxygen desaturation index (ODI) is the most commonly used metric for evaluation and is characterized by the number of desaturations (saturation (SatO2) reduction ≥ 3%) per hour of sleep, the mean blood oxygen saturation, the minimal saturation, and the proportion of sleep hours expressed as a percentage with hemoglobin oxygen saturation below 90% (Sat < 90%). It is assumed that the cyclical occurrence of hypoxia-reoxygenation (intermittent hypoxia) that characterizes OSA is one of the prime mechanisms that generate the formation of free radicals, similar to ischemia-reperfusion-related injuries in coronary disease. It is believed that intermittent hypoxia leads to mitochondrial dysfunction, the activation of enzymes that use oxygen, such as xanthine oxidase or nicotinamide adenine dinucleotide phosphate (NADPH), the activation of leukocytes, and endothelial cell dysfunction, which in turn leads to the synthesis of free radicals [
2]. Intermittent hypoxia can, as a consequence, have an increased expression of systemic inflammatory mediators [
3]. Fragmented sleep and sleep deprivation induce an increase in cytokine levels, which may give way to the inflammatory response. Several studies show that patients with OSA have increased levels of systemic inflammatory mediators, including intercellular adhesion molecules (ICAM), coagulation factors (F VIII, tissue factor), and C-reactive proteins (CRPs) [
4,
5,
6,
7,
8]. Elevated levels of tumor necrosis factor-α (TNF-α), interleukin-1β (IL-1β), and interleukin-6 (IL-6) have been found in patients with OSA [
9,
10]. On the other hand, data from medical publications show that aside from mechanical factors, local inflammation can contribute to the development of OSA as well. Evidence of this can be seen in the histological biopsy of the uvula in patients with OSA, which showed histopathological abnormalities, including subepithelial edema and inflammatory cell infiltration [
3].
Adipose tissue, especially visceral fat, is where a vigorous synthesis of IL-6 occurs, which further leads to elevated levels of CRP in obese individuals. Visceral adipocytes synthesize several cytokines and are metabolically more active than subcutaneous fat. It is still not fully understood whether elevated inflammatory mediator levels in OSA are independent of obesity.
This paper aims to show whether OSA severity increases the level of systemic inflammation markers regardless of body mass index (BMI) and body composition.
2. Materials and Methods
The Ethics Committee approval to conduct this trial was requested and received on 19.06.2018, approval No 01/18-2488. Before the patients were included in this examination, the purpose of the examination and details of their participation were explained to them, and they were asked to sign the informed consent form. One copy of this document was given to the examinee/patient and the other was retained on site with study documentation.
The study included 128 patients with OSA. Patients with concomitant diseases, characterized by the existence of systemic inflammation, were excluded, except for those with obesity. All examinees underwent the sleep study nocturnal respiratory polygraphy using the Philips Alice PDx sleep recorder. The apnea–hypopnea index (AHI), desaturation index (ODI), minimum saturation (min SatO2), average saturation (mean SatO2), and the percentage of time with saturation below 90% (SatO2 < 90%) were determined. In line with the results of the sleep study based on the AHI, the examinees were divided into two groups: one with mild OSA (AHI < 15) and one with moderate and severe OSA (AHI ≥ 15). All examinees underwent nutritional status assessment using BMI = body mass (BM)/body height
2 (kg/m
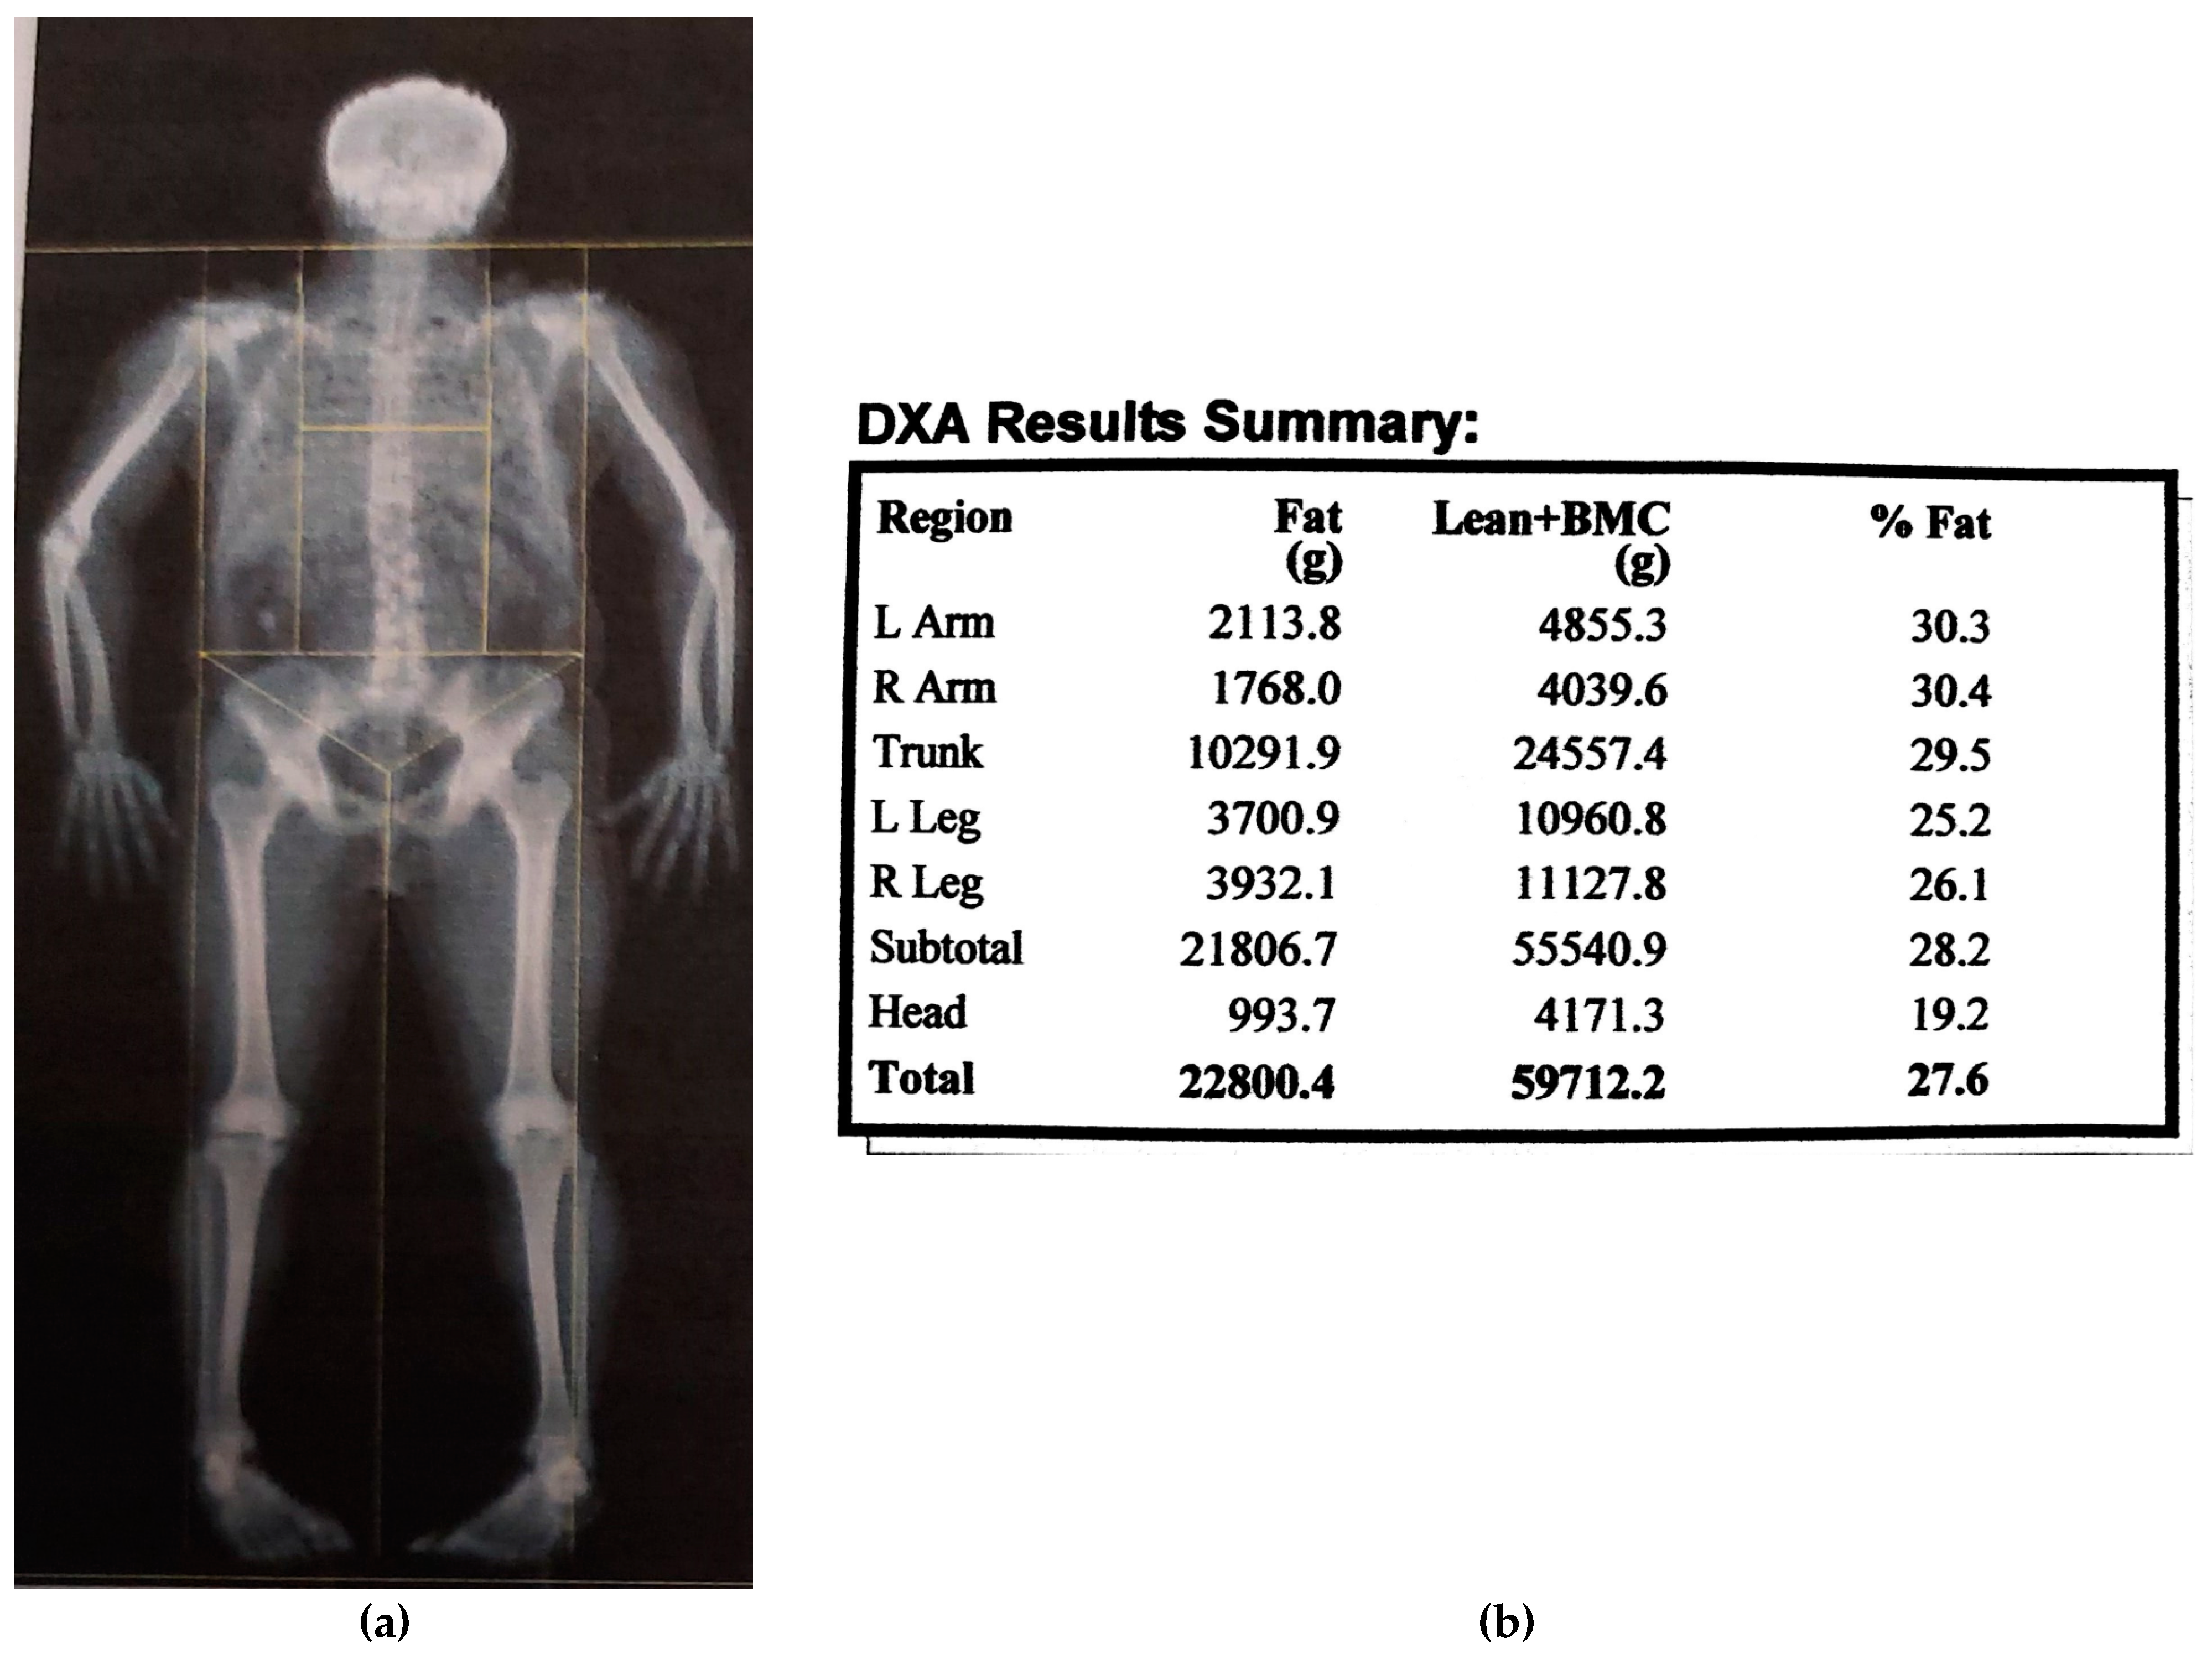
2). Body compositions were determined by a dual X-ray absorptiometry (DXA) whole-body scan (Hologic QDR-4000). The absolute value of body fat mass (FM) in kg, body fat percentage (FM%), fat mass index (FMI = FFM/ body height
2 (kg/m
2)), lean body mass (FFM) in kg, lean body mass index (FFMI = FFM/body height
2 (kg/m
2)) and central FM (kg) were examined (
Figure 1). Data from the National Health and Nutrition Examination Survey (NHANES) for FM% reference values using DXA measuring was used (13).
Systemic inflammation was assessed on the basis of the plasma concentrations of TNF-α, determined by the AviBion Human Leptin ELISA kit (Orgenium, Helsinki, Finland); plasma concentrations of IL-6, determined by the AviBion Human Leptin ELISA kit (Orgenium, Helsinki, Finland); and serum CRP concentrations (Olympus AU 400, immunoturbidimetric method for the quantitative determination of C-reactive protein).
The descriptive statistics method was used to identify the general characteristics of the groups of examinees, as well as the results obtained from the completed test. An independent t-test was used to compare the arithmetic mean of the measured characteristics of the two populations. The correlation was used to test the relationship between the parameters, and its presentation and the interpretation of the significance were performed using linear correlation. The influence of individual variables as independent predictors for the observed parameters was examined by using the multivariate regression analysis.
3. Results
Patients were divided into two groups according to AHI (cut-off = 15). There were 56 (43.8%) patients (44 males) in the group with AHI < 15 and 72 (52.2%) patients (48 males) in the group with AHI ≥ 15.
The mean values of the parameters for the sleep study, nutritional status assessment, body composition, and systemic inflammation in test groups (t-test) are presented in
Table 1. We did not detect any statistical significance for the mean levels of the plasma TNF-α and IL-6 concentrations as markers of systemic inflammation between these two groups of examinees (
Table 1).
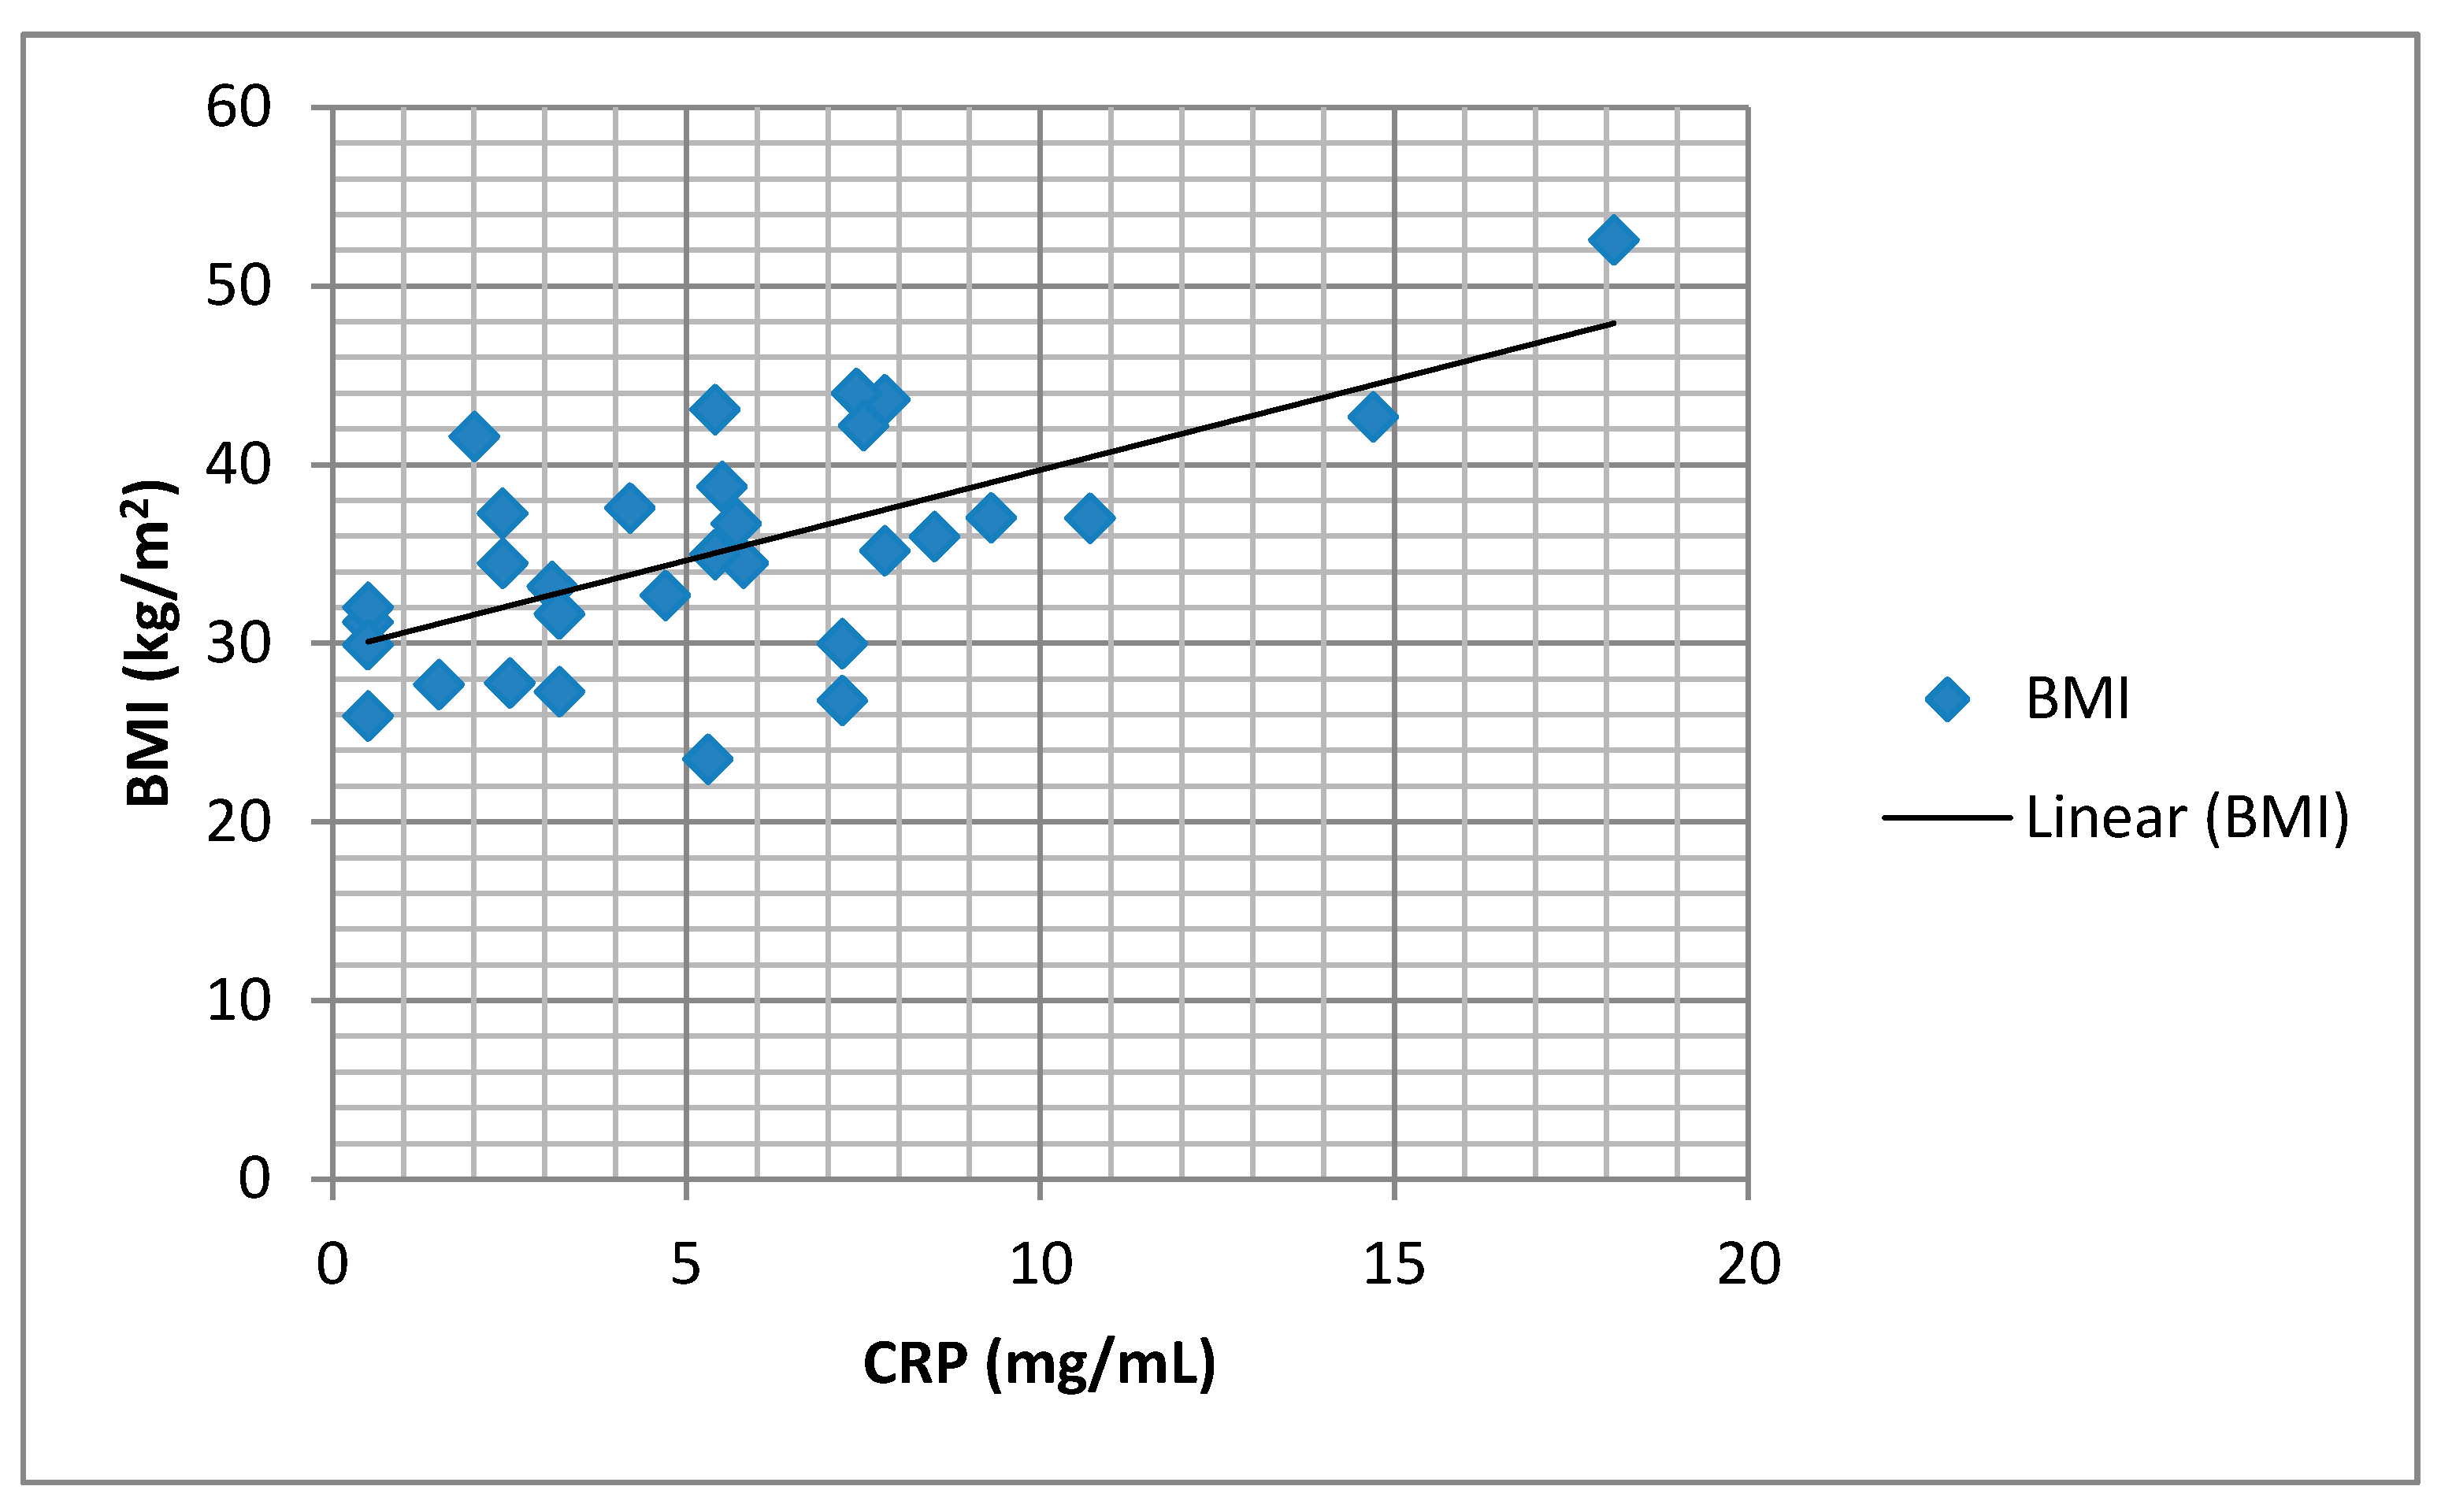
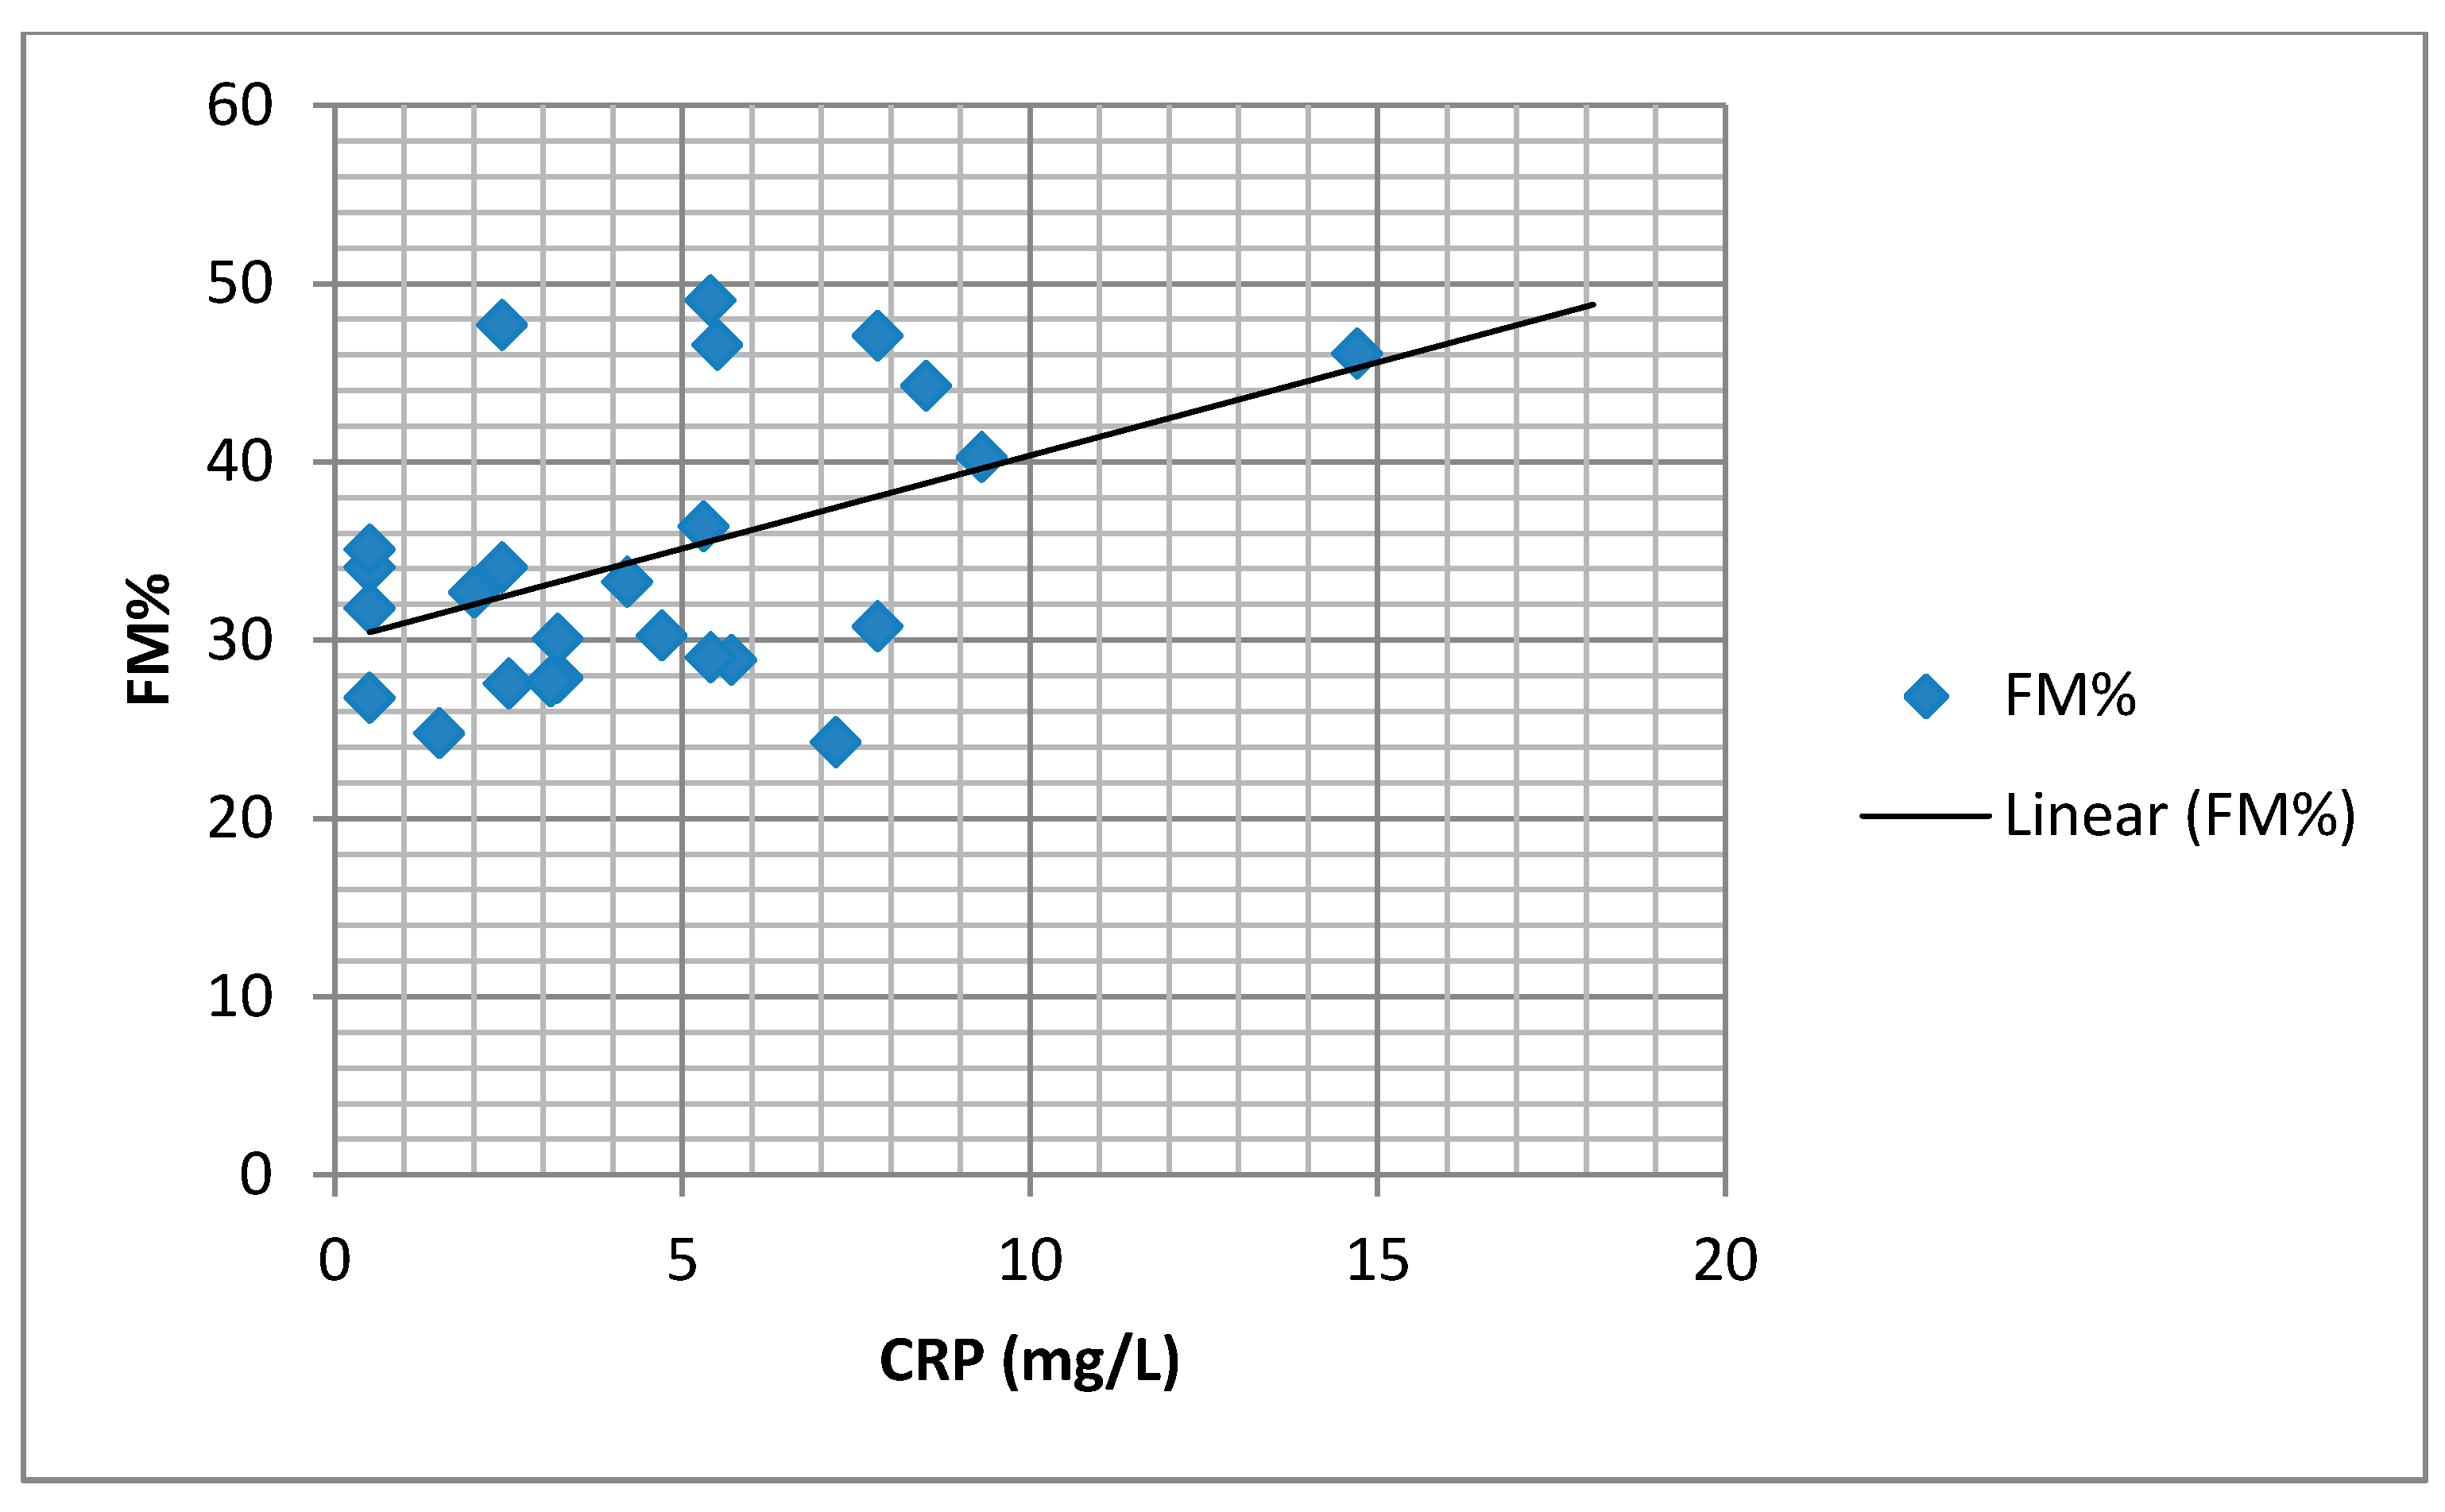
We found a significant positive correlation between the BMI and body fat percentage (FM%) and the serum CRP values (
Figure 2 and
Figure 3).
A univariate regression analysis determined the following parameters as predictors of serum CRP values: min SatO2, BMI, FM%, and FMI (
Table 2).
Using a multivariate regression analysis, none of the parameters for assessing the state of nutrition, body composition, and sleep study parameters were identified as predictors of serum CRP (
Table 3).
Using univariate regression analysis, none of the parameters for assessing the state of nutrition, body composition, and sleep study parameters were identified as predictors of the plasma concentrations of IL-6 and TNF-α.
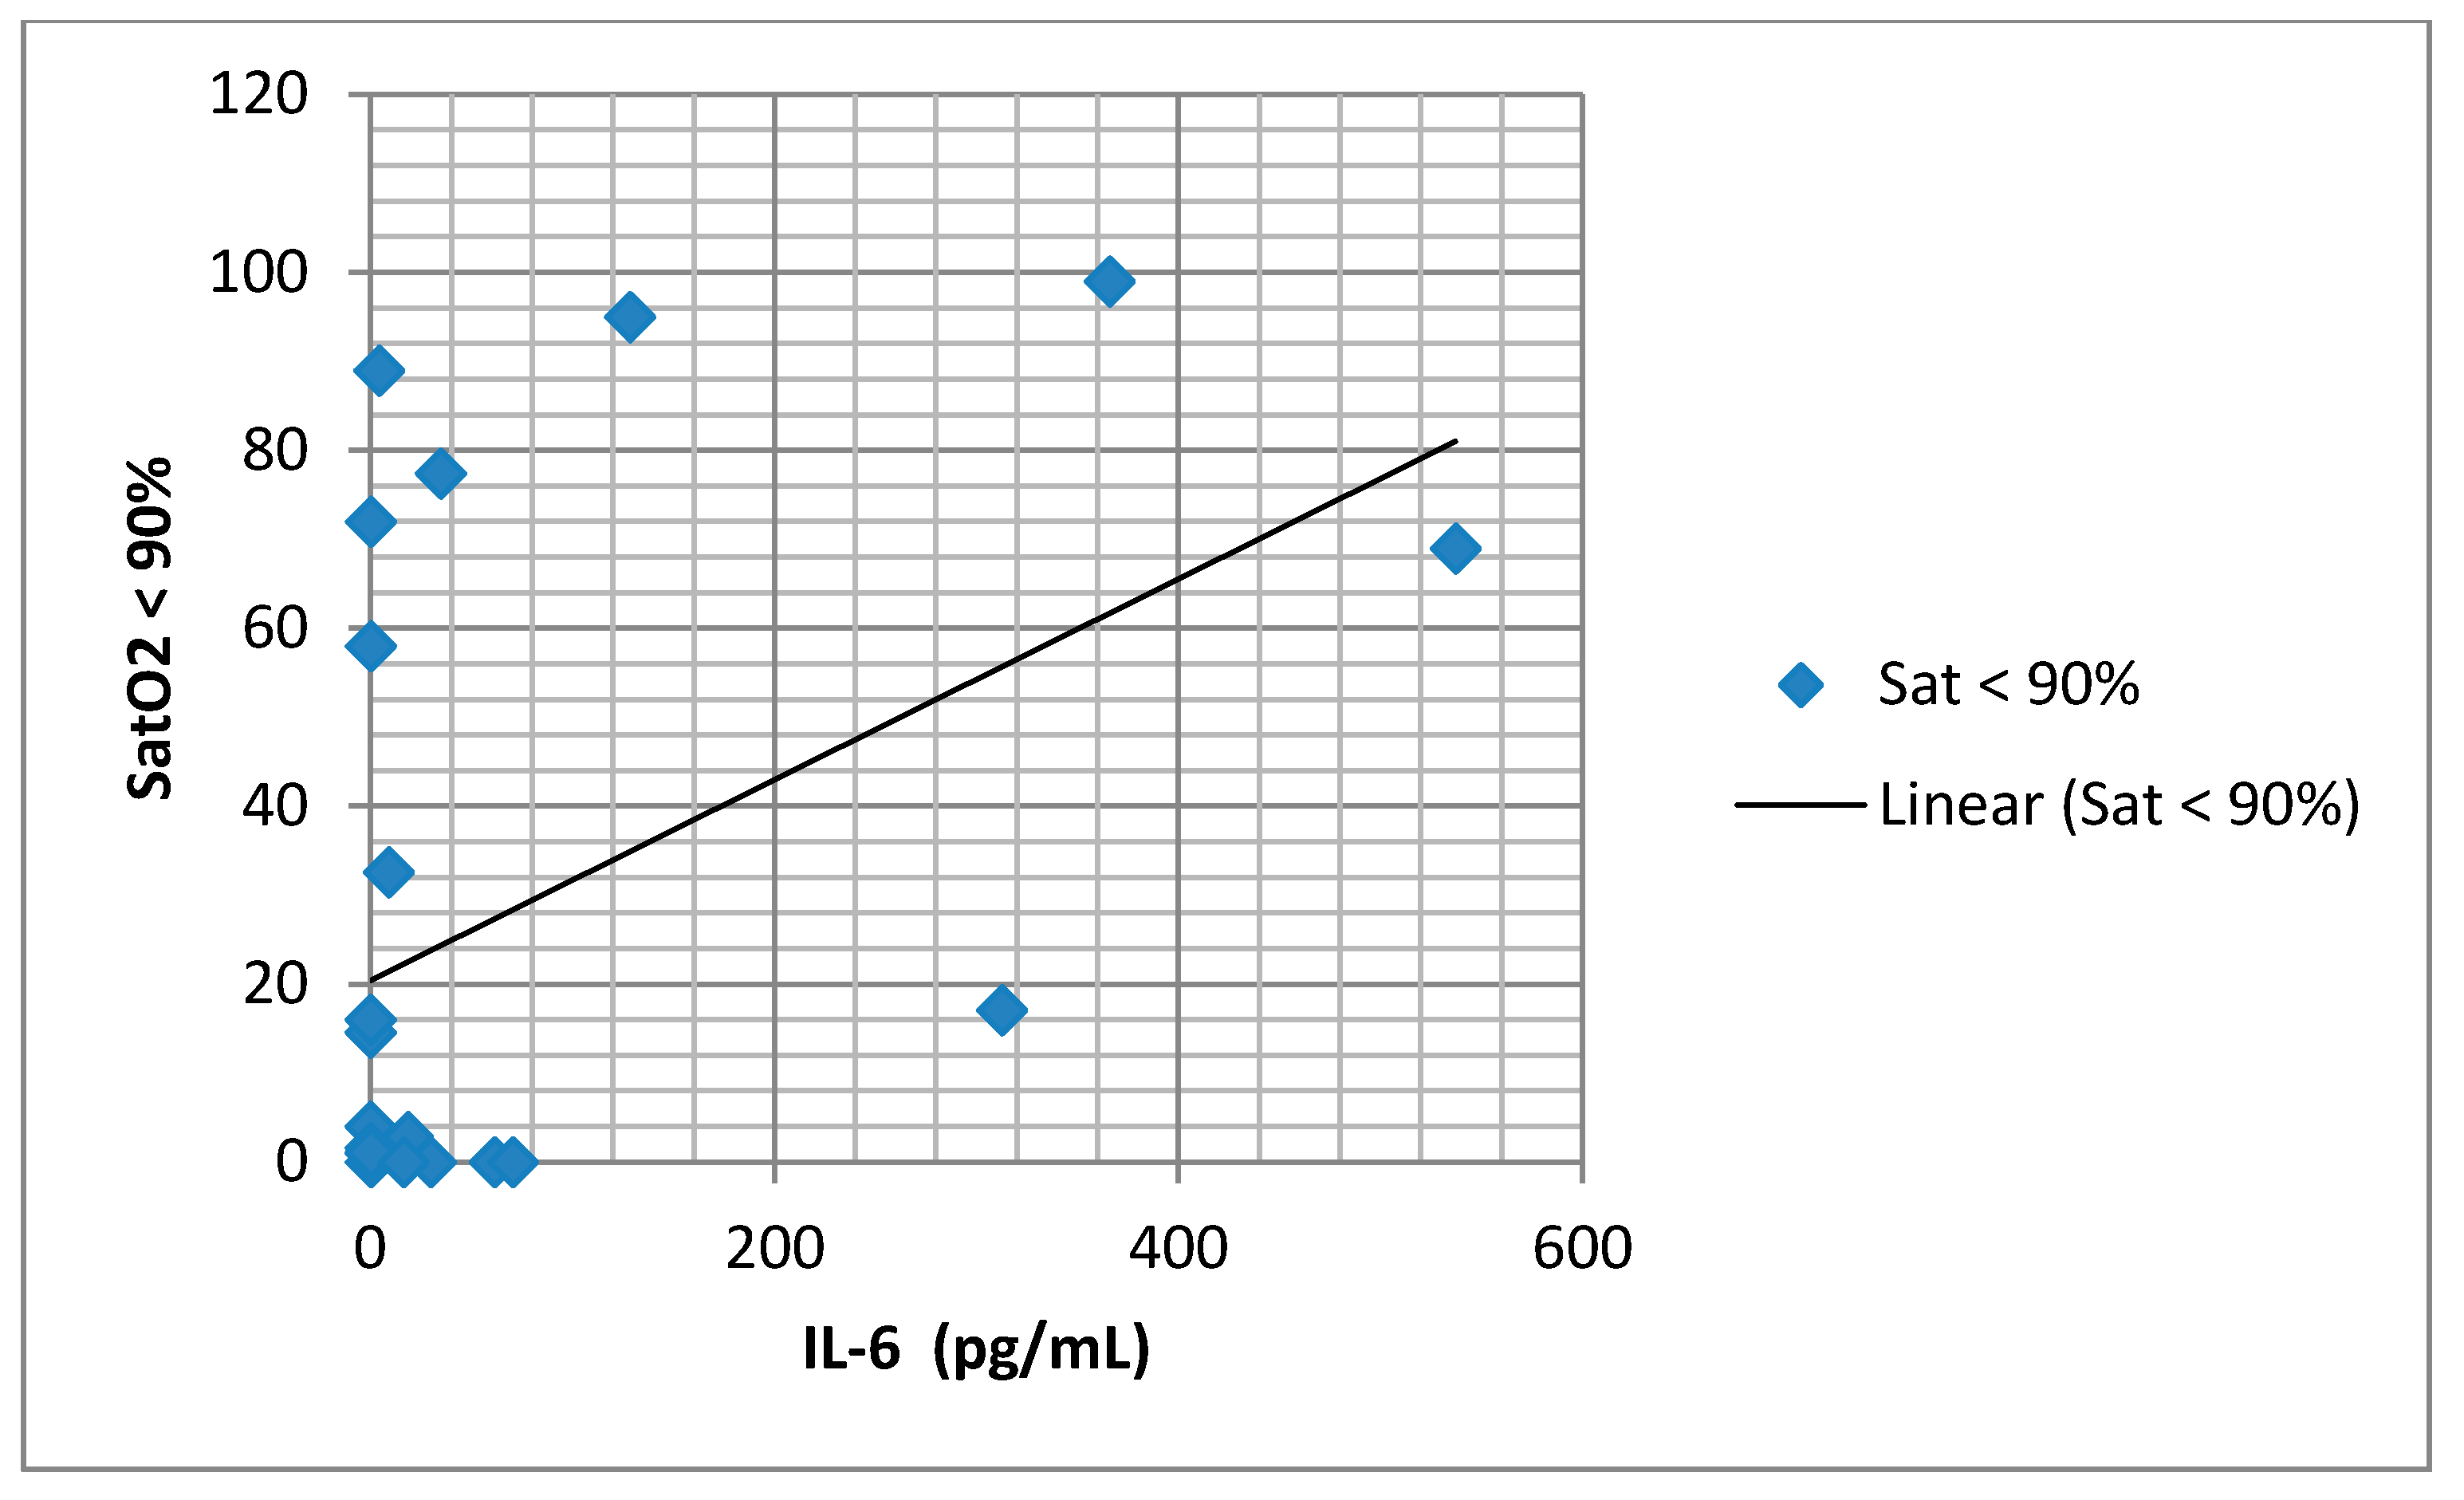
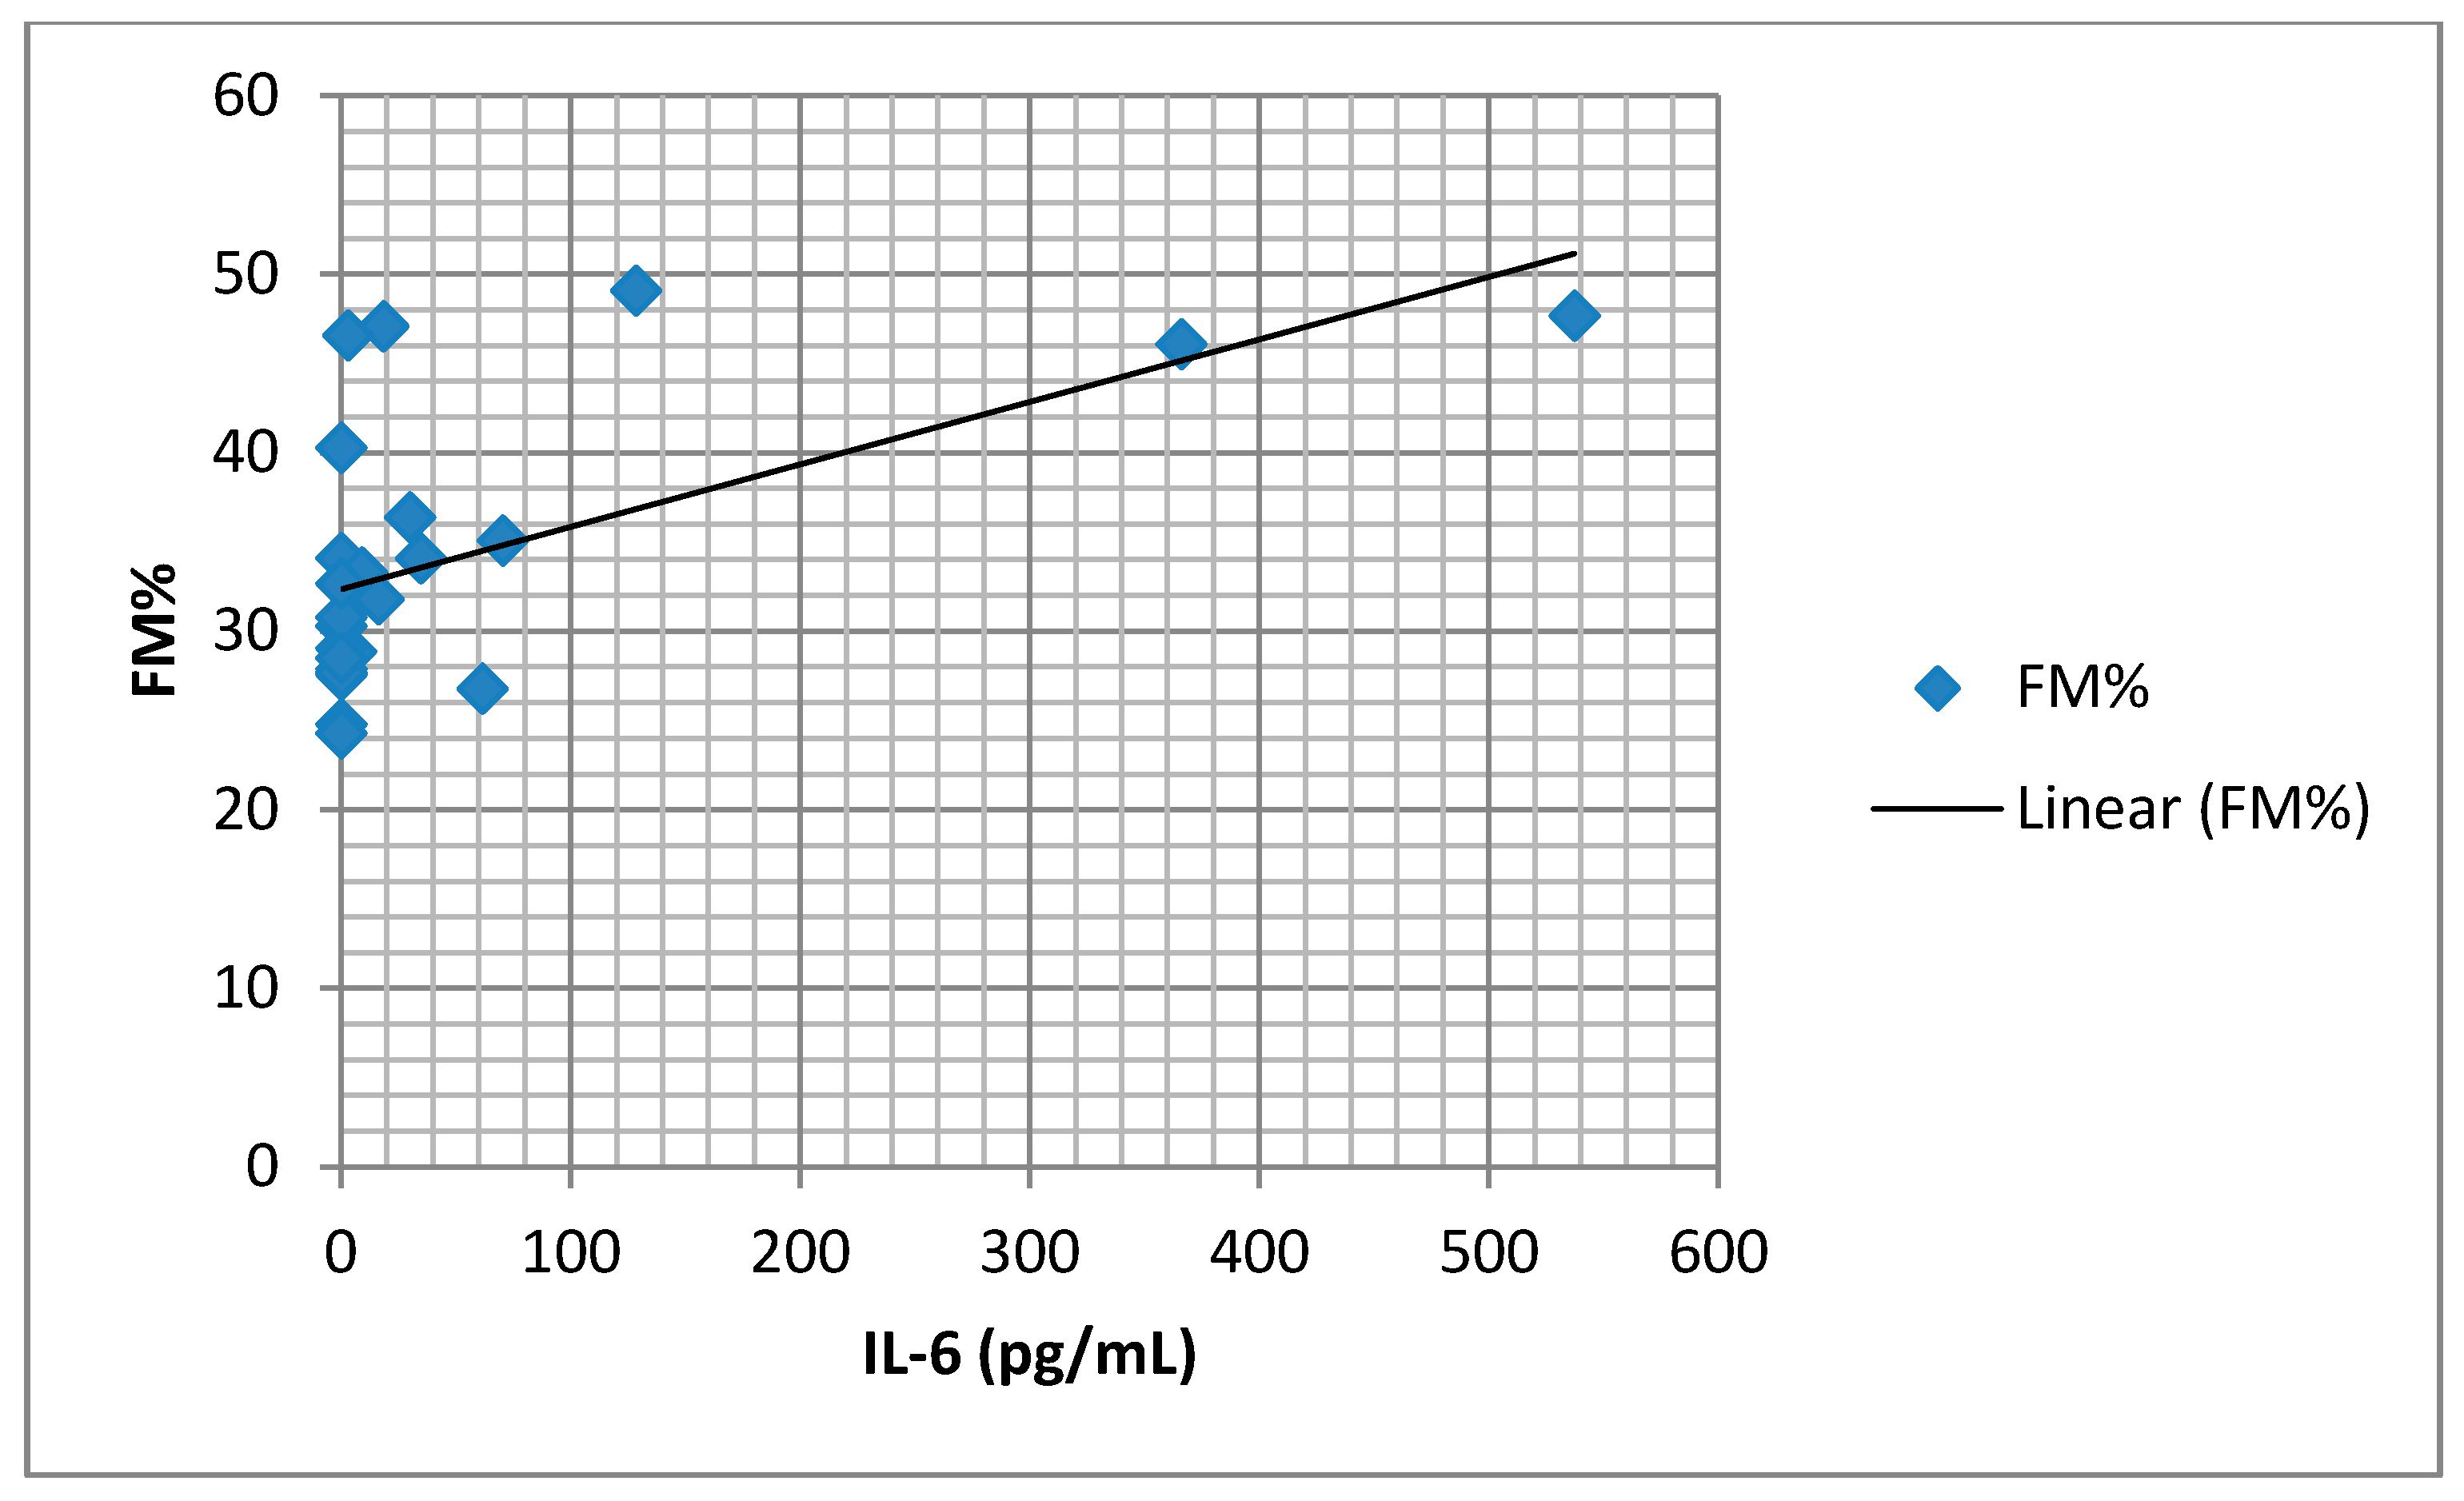
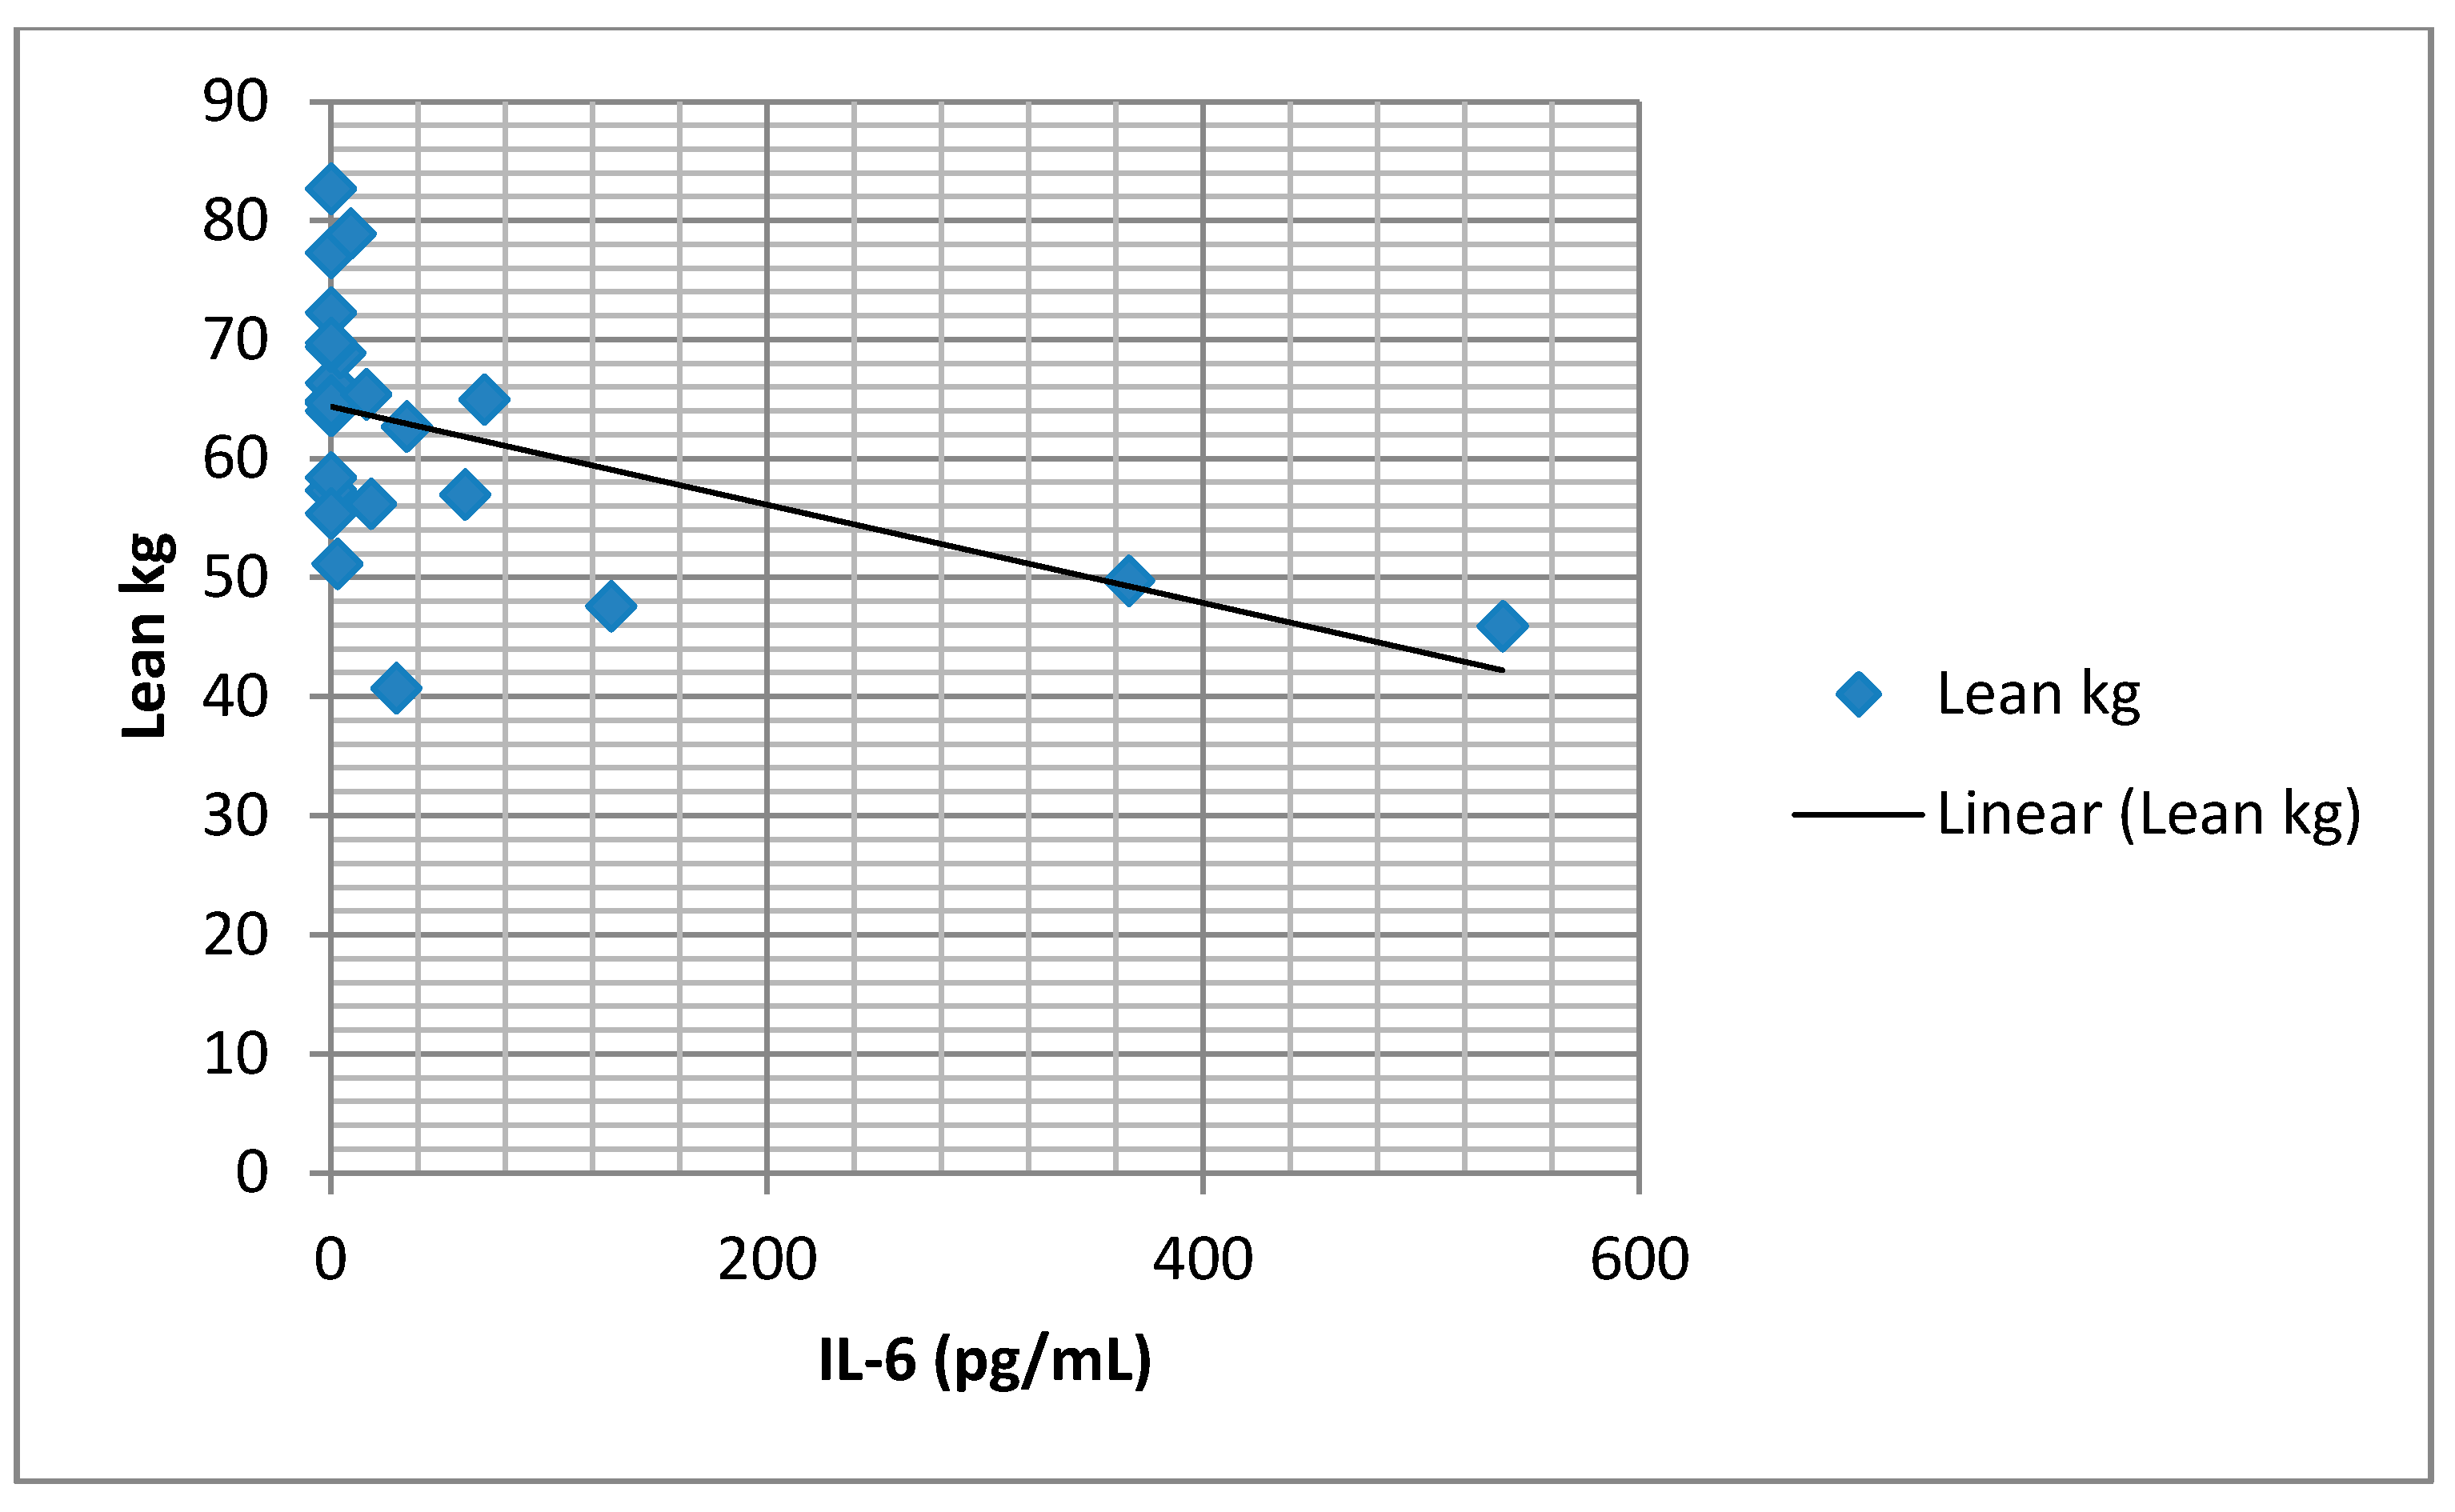
We found a significant positive association between serum IL-6 concentration and SatO2 of less than 90% (
Figure 4), as well as an association between IL-6 and FM% (
Figure 5). There was a significant negative association between IL-6 and lean body mass (FFM) (
Figure 6).
4. Discussion
We analyzed systemic inflammation in groups with different severities of OSA. We found elevated mean values of the evaluated systemic inflammation markers (CRP, TNF-α, and IL-6), although there was no statistical significance in a group with AHI ≥ 15 in comparison to the group with AHI < 15. Our research found a significant positive correlation with BMI, as well as with body fat mass (FM%, FMI), and serum CRP values. Multiple regression analysis; however, did not show any independent predictor of the serum CRP value. A meta-analysis of Nadeem et al. analyzed 51 studies that evaluated the association of systemic inflammation markers and OSA (30 studies about CRP, 19 about TNF-α, and 18 about IL-6) [
11,
12]. The level of inflammatory markers was higher in the group with OSA in comparison to the control group. The standardized mean difference was 1.77 for CRP, 1.03 for TNF-α, and 2.16 for IL-6. This meta-analysis showed that patients with OSA had a significantly higher level of CRP in comparison to the control group. Age, together with BMI and AHI, was found to have an important influence on all inflammation markers. Guven et al. showed an elevated level of serum high sensitivity CRP (hs-CRP) in patients with OSA in comparison to the control group without OSA [
13]. A significant positive correlation of hs-CRP with BMI and AHI was found, but multiple regression analysis showed that hs-CRP was only associated with AHI, irrespective of BMI. Lee et al. showed that in patients with OSA, the increase of hs-CRP positively correlated with BMI, AHI, and tonsil size. However, only AHI could predict significantly elevated hs-CRP after multiple linear regression analysis [
14].
Various other studies did not show the association between AHI and CRP concentrations. They reported that obesity, rather than OSA or nocturnal hypoxemia, is the key predictor of the elevated level of CRP in patients with OSA. Barcelo et al. showed that CRP levels are significantly higher in obese patients with OSA when compared to non-obese patients with OSA [
15]. In the study, Sharma et al. examined the level of hs-CRP in newly diagnosed patients with OSA [
16]. These patients were divided into three groups: OSA (AHI > 5), obese without OSA (BMI > 25, AHI < 5), and non-obese without OSA (BMI < 25, AHI < 5). The highest mean value of hs-CRP was found in the group of obese without OSA. There was a significant positive correlation between hs-CRP and BMI, whereas there was none with AHI. Moreover, there was a significant association of hs-CRP with BMI and AHI, even after age adjustment, whereas there was no significant association of hs-CRP with the severity of OSA (based on AHI), even after BMI and age adjustment. Multiple regression analysis identified only BMI as significantly associated with the serum hs-CRP levels [
16]. The Guilleminault et al. study showed that CRP levels in patients with OSA significantly correlated with BMI, and that BMI is the only value to correlate independently with an elevated level of CRP in patients with OSA [
17]. Ryan et al. showed a similar level of CRP in male patients without OSA, patients with mild to moderately severe OSA, and patients with severe OSA. However, the level was markedly elevated in obese patients with severe OSA. It was concluded that the level of CRP does not correlate with the severity of OSA in male patients with OSA, but rather correlates independently with obesity [
18].
We found elevated mean values of the serum TNF-α in the group with AHI ≥ 15, although there was no statistical significance. Several studies showed that patients with OSA have higher levels of TNF-α [
8,
19], with levels of TNF-α correlating significantly with the severity of OSA and nocturnal hypoxemia [
20]. In contrast, Fornadi et al. did not find any significant correlation between concentrations of TNF-α and AHI [
21]. A slightly elevated, but not negligible level of IL-6 was found in patients in this study. Our study supports the claim that in patients with OSA, a Th1 (T helper-1) type of cytokine response is activated. Analyzing the association of IL-6 concentrations in blood plasma with the parameters of the sleep study, we did not find any significant correlation with AHI. The only important positive correlation was between IL-6 and SatO2 < 90% (as a percentage of the time). Many cross-sectional studies showed a higher level of IL-6 in patients with OSA and a significant correlation between IL-6 and AHI [
22,
23]. Mehra et al. found that subjects with moderate to severe OSA had markedly higher morning and evening values of IL-6 when compared with subjects without OSA, but these differences were not statistically significant after adjustments for subject characteristics [
24]. Inflammatory cytokine IL-6 is responsible for the synthesis of CRP in the liver. Likewise, IL-6 is produced in visceral adipose tissue in obese individuals. Evidence of this can be found in our study results, as we found a significant positive association between IL-6 concentration and fat mass (adipose tissue percentage). However, multiple regression analysis did not identify a single parameter as an independent predictor of IL-6 concentration. Our study found a significant negative association between IL-6 concentrations in blood plasma and lean body mass, which can bring attention to the role of systemic inflammation in body composition changes in patients with OSA. Kosacka et al. found a significant decrease in muscle mass in patients with OSA when compared to the control group [
25]. The reason behind these discrepancies could be found in the methodology of previous studies and the small number of patients included.
A possible limitation of our study is the inclusion of patients who had already been diagnosed with cardiovascular or metabolic diseases.
5. Conclusions
OSA severity does not increase the level of systemic inflammation markers regardless of body mass index (BMI) and body composition. Neither the severity of OSA, the nutritional status, or the body composition were identified as independent prognostic factors for the severity of systemic inflammation in patients with OSA.
Author Contributions
R.S.—research, data preparation and analysis, manuscript preparation and submission; V.Ć.—research, data preparation and analysis, manuscript preparation and submission; L.N.—manuscript preparation; M.R.—manuscript preparation and submission; S.J.—study design, research, data analysis, D.Đ.—data preparation and analysis; J.J.—research, data analysis; K.P.—research, data analysis; S.S.—data analysis, manuscript preparation; D.B.-S.—manuscript preparation; I.Č.—study design, research, data preparation and analysis, manuscript preparation. All authors have read and agreed to the published version of the manuscript.
Funding
This research received no external funding.
Institutional Review Board Statement
The study was conducted according to the guidelines of the Declaration of Helsinki, and approved by the Ethics Committee of University Clinical Center Kragujevac in Kragujevac, Serbia on 19.06.2018, approval No 01/18-2488.
Informed Consent Statement
Before the patients were included in this examination, the purpose of the examination and details of their participation were explained to them, and they were asked to sign the informed consent form. One copy of this document was given to the examinee/patient and the other was retained on site with study documentation.
Data Availability Statement
The data presented in this study are available on request from the corresponding author.
Conflicts of Interest
The authors declare no conflict of interest.
References
- Stradling, J.R.; Chadwick, G.A.; Frew, A.J. Changes in ventilation and its components in normal subjects during sleep. Thorax 1985, 40, 364–370. [Google Scholar] [CrossRef] [Green Version]
- Feng, J.; Zhang, D.; Chen, B. Endothelial mechanisms of endothelial dysfunction in patients with obstructive sleep apnea. Sleep Breath. 2011, 16, 283–294. [Google Scholar] [CrossRef]
- Ryan, S.; Taylor, C.; McNicholas, W.T. Selective activation of inflammatory pathways by intermittent hypoxia in obstructive sleep apnea syndrome. Circulation 2005, 112, 2660–2667. [Google Scholar] [CrossRef] [Green Version]
- Kokturk, O.; Ciftci, T.U.; Mollarecep, E.; Ciftci, B. Elevated C-reactive protein levels and increased cardiovascular risk in pa-tients with obstructive sleep apnea syndrome. Int. Heart J. 2005, 46, 801–809. [Google Scholar] [CrossRef] [PubMed] [Green Version]
- Ursavaş, A.; Karadağ, M.; Rodoplu, E.; Yilmaztepe, A.; Oral, H.B.; Gözü, R.O. Circulating ICAM-1 and VCAM-1 levels in pa-tients with obstructive sleep apnea syndrome. Respiration 2007, 74, 525–532. [Google Scholar] [CrossRef] [PubMed]
- Von Känel, R.; Loredo, J.; Ancoli-Israel, S.; Mills, P.; Natarajan, L.; Dimsdale, J. Association between polysomnographic measures of disrupted sleep and prothrombotic factors. Chest 2007, 131, 733–739. [Google Scholar] [CrossRef]
- Punjabi, N.M.; Beamer, B.A. C-reactive protein is associated with sleep disordered breathing independent of adiposity. Sleep 2007, 30, 29–34. [Google Scholar] [CrossRef] [PubMed] [Green Version]
- De la Pena Bravo, M.; Serpero, L.D.; Barcelo, A. Inflammatory proteins in patients with obstructive sleep apnea with and without daytime sleepiness. Sleep Breath. 2007, 11, 177–185. [Google Scholar] [CrossRef] [PubMed]
- Minoguchi, K.; Tazaki, T.; Yokoe, T. Elevated production of tumor necrosis factor-α by monocytes in patients with obstructive sleep apnea syndrome. Chest 2004, 126, 1473–1479. [Google Scholar] [CrossRef] [PubMed]
- Roytblat, L.; Rachinsky, M.; Fisher, A.; Greemberg, L.; Shapira, Y.; Douvdevani, A. Raised interleukin-6 levels in obese patients. Obes. Res. 2000, 8, 673–675. [Google Scholar] [CrossRef] [PubMed]
- Borrud, L.G.; Everhart, J.E.; Flegal, K.M.; Harris, T.; Looker, A.C.; Shepherd, J.A. Body compostion data for individuals eight years of age and older: US population, 1999–2004. National center for health statistics. Vital Health Stat. 2010, 11, 1–87. [Google Scholar]
- Nadeem, R.; Molnar, J.; Madbouly, E.; Nida, M.; Aggarwal, S.; Sajid, H.; Naseem, J.; Loomba, R. Serum inflammatory markers in obstructive sleep apnea: A meta-analysis. J. Clin. Sleep Med. 2013, 9, 1003–1012. [Google Scholar] [CrossRef]
- Guven, S.F.; Turkkani, M.H.; Ciftci, B.; Ciftci, T.U.; Erdogan, Y. The relationship between high-sensitivity C-reactive protein levels and the severity of obstructive sleep apnea. Sleep Breath. 2012, 16, 217–221. [Google Scholar] [CrossRef]
- Lee, L.-A.; Chen, N.-H.; Huang, C.-G.; Lin, S.-W.; Fang, T.-J.; Li, H.-Y. Patients with severe obstructive sleep apnea syndrome and elevated high-sensitivity C-reactive protein need priority treatment. Otolaryngol. Neck Surg. 2010, 143, 72–77. [Google Scholar] [CrossRef]
- Barceló, A.; Miralles, C.; Barbe, F.; Vila, M.; Pons, S.; Agustı, A.G.N. Abnormal lipid peroxidation in patients with sleep apnoea. Eur. Respir. J. 2000, 16, 644–647. [Google Scholar] [CrossRef] [Green Version]
- Sharma, S.; Mishra, H.K.; Sharma, H.; Goel, A.; Sreenivas, V.; Gulati, V.; Tahir, M. Obesity, and not obstructive sleep apnea, is responsible for increased serum hs-CRP levels in patients with sleep-disordered breathing in Delhi. Sleep Med. 2008, 9, 149–156. [Google Scholar] [CrossRef] [PubMed]
- Guilleminault, C.; Kirisoglu, C.; Ohayon, M.M. C-Reactive Protein and Sleep-Disordered Breathing. Sleep 2004, 27, 1507–1517. [Google Scholar] [CrossRef] [PubMed]
- Ryan, S.; Nolan, G.M.; Hannigan, E.; Cunningham, S.; Taylor, C.; McNicholas, W.T. Cardiovascular risk markers in obstructive sleep apnoea syndrome and correlation with obesity. Thorax 2007, 62, 509–514. [Google Scholar] [CrossRef] [PubMed] [Green Version]
- Imagawa, S.; Yamaguchi, Y.; Ogawa, K.; Obara, N.; Suzuki, N.; Yamamoto, M.; Nagasawa, T. Interleukin-6 and Tumor Necrosis Factor-α in Patients with Obstructive Sleep Apnea-Hypopnea Syndrome. Respiration 2004, 71, 24–29. [Google Scholar] [CrossRef]
- Alberti, A.; Sarchielli, P.; Gallinella, E.; Floridi, A.; Floridi, A.; Mazzotta, G.; Gallai, V. Plasma cytokine levels in patients with obstructive sleep apnea syndrome: A preliminary study. J. Sleep Res. 2003, 12, 305–311. [Google Scholar] [CrossRef] [Green Version]
- Fornadi, K.; Lindner, A.; Czira, M.E.; Szentkiralyi, A.; Lazar, A.S.; Zoller, R.; Turanyi, C.Z.; Veber, O.; Novak, M.; Mucsi, I.; et al. Lack of association between objectively assessed sleep disorders and inflammatory markers among kidney transplant recipients. Int. Urol. Nephrol. 2011, 44, 607–617. [Google Scholar] [CrossRef] [PubMed]
- Sahlman, J.; Miettinen, K.; Peuhkurinen, K.; Seppä, J.; Peltonen, M.; Herder, C.; Punnonen, K.; Vanninen, E.; Gylling, H.; Partinen, M.; et al. The activation of the inflammatory cytokines in overweight patients with mild obstructive sleep apnoea. J. Sleep Res. 2009, 19, 341–348. [Google Scholar] [CrossRef]
- Vgontzas, A.N.; Papanicolaou, D.A.; Bixler, E.O.; Kales, A.; Tyson, K.; Chrousos, G.P. Elevation of Plasma Cytokines in Disorders of Excessive Daytime Sleepiness: Role of Sleep Disturbance and Obesity. J. Clin. Endocrinol. Metab. 1997, 82, 1313–1316. [Google Scholar] [CrossRef] [PubMed]
- Mehra, R.; Storfer-Isser, A.; Kirchner, H.L.; Johnson, N.; Jenny, N.; Tracy, R.P.; Redline, S. Soluble Interleukin 6 Receptor. Arch. Intern. Med. 2006, 166, 1725–1731. [Google Scholar] [CrossRef] [PubMed] [Green Version]
- Kosacka, M.; Piesiak, P.; Jankowska, R. Differences Between Overlap Syndrome and Severe Sleep Apnea Syndrome In BIA/ BIvA, Adiponectin Serum Levels and in Pro-Atherogenic Indices. Paripex Indian J. Res. 2012, 3, 175–179. [Google Scholar] [CrossRef]
| Publisher’s Note: MDPI stays neutral with regard to jurisdictional claims in published maps and institutional affiliations. |
© 2021 by the authors. Licensee MDPI, Basel, Switzerland. This article is an open access article distributed under the terms and conditions of the Creative Commons Attribution (CC BY) license (http://creativecommons.org/licenses/by/4.0/).


 ,
, 


