Article

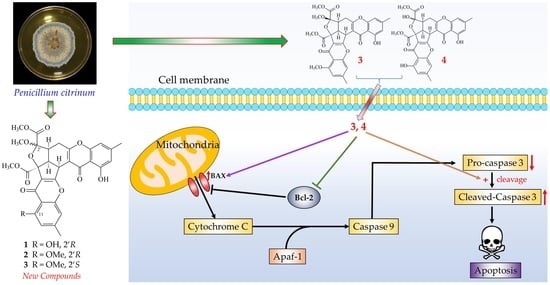
Rare Chromone Derivatives from the Marine-Derived Penicillium citrinum with Anti-Cancer and Anti-Inflammatory Activities

1
Institute of Traditional Medicine, School of Medicine, National Yang-Ming University, Taipei 112, Taiwan
2
Institute of Biopharmaceutical Sciences, Pharmaceutical Sciences, National Yang-Ming University, Taipei 112, Taiwan
3
Graduate Institute of Natural Products, College of Medicine, Chang Gung University, Taoyuan 333, Taiwan
4
Bioresource Collection and Research Center (BCRC), Food Industry Research and Development Institute (FIRDI), Hsinchu 300, Taiwan
5
Faculty of Pharmacy, School of Pharmaceutical Sciences, National Yang-Ming University, Taipei 112, Taiwan
6
Department of Medical Research, China Medical University Hospital, China Medical University, Taichung 404, Taiwan
*
Authors to whom correspondence should be addressed.
Submission received: 17 November 2020 / Revised: 1 January 2021 / Accepted: 5 January 2021 / Published: 8 January 2021
(This article belongs to the Special Issue Bioactive Molecules from Marine Microorganisms)

Abstract

:
Three new and rare chromone derivatives, epiremisporine C (1), epiremisporine D (2), and epiremisporine E (3), were isolated from marine-derived Penicillium citrinum, together with four known compounds, epiremisporine B (4), penicitrinone A (5), 8-hydroxy-1-methoxycarbonyl-6-methylxanthone (6), and isoconiochaetone C (7). Among the isolated compounds, compounds 25 significantly decreased fMLP-induced superoxide anion generation by human neutrophils, with IC50 values of 6.39 ± 0.40, 8.28 ± 0.29, 3.62 ± 0.61, and 2.67 ± 0.10 μM, respectively. Compounds 3 and 4 exhibited cytotoxic activities with IC50 values of 43.82 ± 6.33 and 32.29 ± 4.83 μM, respectively, against non-small lung cancer cell (A549), and Western blot assay confirmed that compounds 3 and 4 markedly induced apoptosis of A549 cells, through Bcl-2, Bax, and caspase 3 signaling cascades.

Graphical Abstract

1. Introduction

There are many natural products isolated from marine-derived fungi. These compounds are important source of biologically effective secondary metabolites, which are very interesting and important for drug discovery. In particular, a large number of natural products with biological activities are found in the genus Penicillium, which has diverse biological activities such as antibacterial, antifungal, antitumor, and antiviral activities [1,2,3,4,5,6,7,8,9,10,11,12,13,14,15,16,17,18]. Diverse dihydroisocoumarins [4], citrinin [15], benzopyrans [17], benzophenones [18] and their derivatives were isolated from Penicillium citrinum in the past studies. Many of these isolated compounds showed anti-bacterial [4,17,18], anti-fungal [15], and anti-cancer [18] activities.
Human neutrophils are known to play a critical role in the pathogenesis of various inflammatory diseases [19,20]. In response to different stimuli, activated neutrophils secrete a series of cytotoxins, such as superoxide anion (O2•–), granule proteases, and bioactive lipids [19,21,22]. Suppression of inappropriate activation of neutrophils by drugs was proposed as a way to combat inflammatory diseases [23].
According to statistics from Taiwan’s Ministry of Health and Welfare, cancer remained the top killer in Taiwan for many years [24]. The apoptosis-related proteins, such as Bcl-2, Bax, and caspase-3, regulate cancer cell apoptosis or survival, which was confirmed to be related to many cancers and diseases [25,26,27]. In a preliminary screening, the methanolic extract of P. citrinum showed anti-inflammatory and anti-cancer activities in vitro. The current chemical investigation of this fungus led to the isolation of three new chromone derivatives, epiremisporine C (1), epiremisporine D (2), and epiremisporine E (3), along with four known compounds. The structural elucidation of 13 and anti-inflammatory and anti-cancer properties of 1–7 are described herein.

2. Results and Discussion

2.1. Fermentation, Extraction, and Isolation

In this study, the marine-derived fungal strain Penicillium citrinum (BCRC 09F0458) was cultured in solid-state culturing conditions, in order to enrich the diversity of the fungal secondary metabolites. Chromatographic isolation and purification of the n-BuOH-soluble fraction of an EtOH extract of Penicillium citrinum on a silica gel column and preparative thin-layer chromatography (TLC) obtained three new (13) and four known compounds (47) (Figure 1).

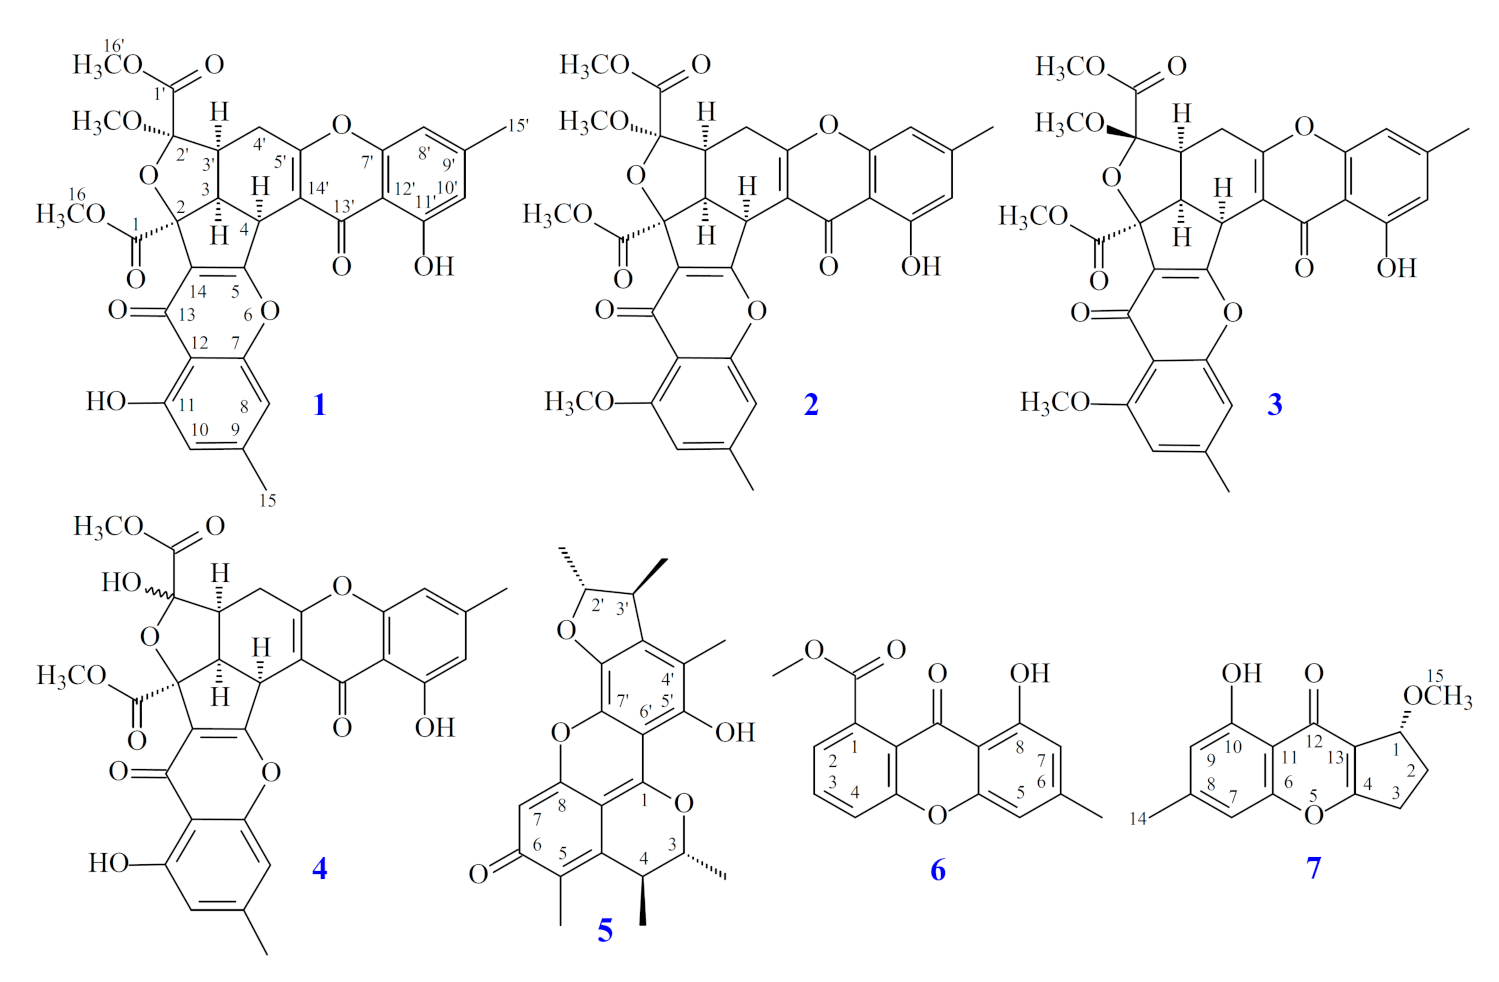
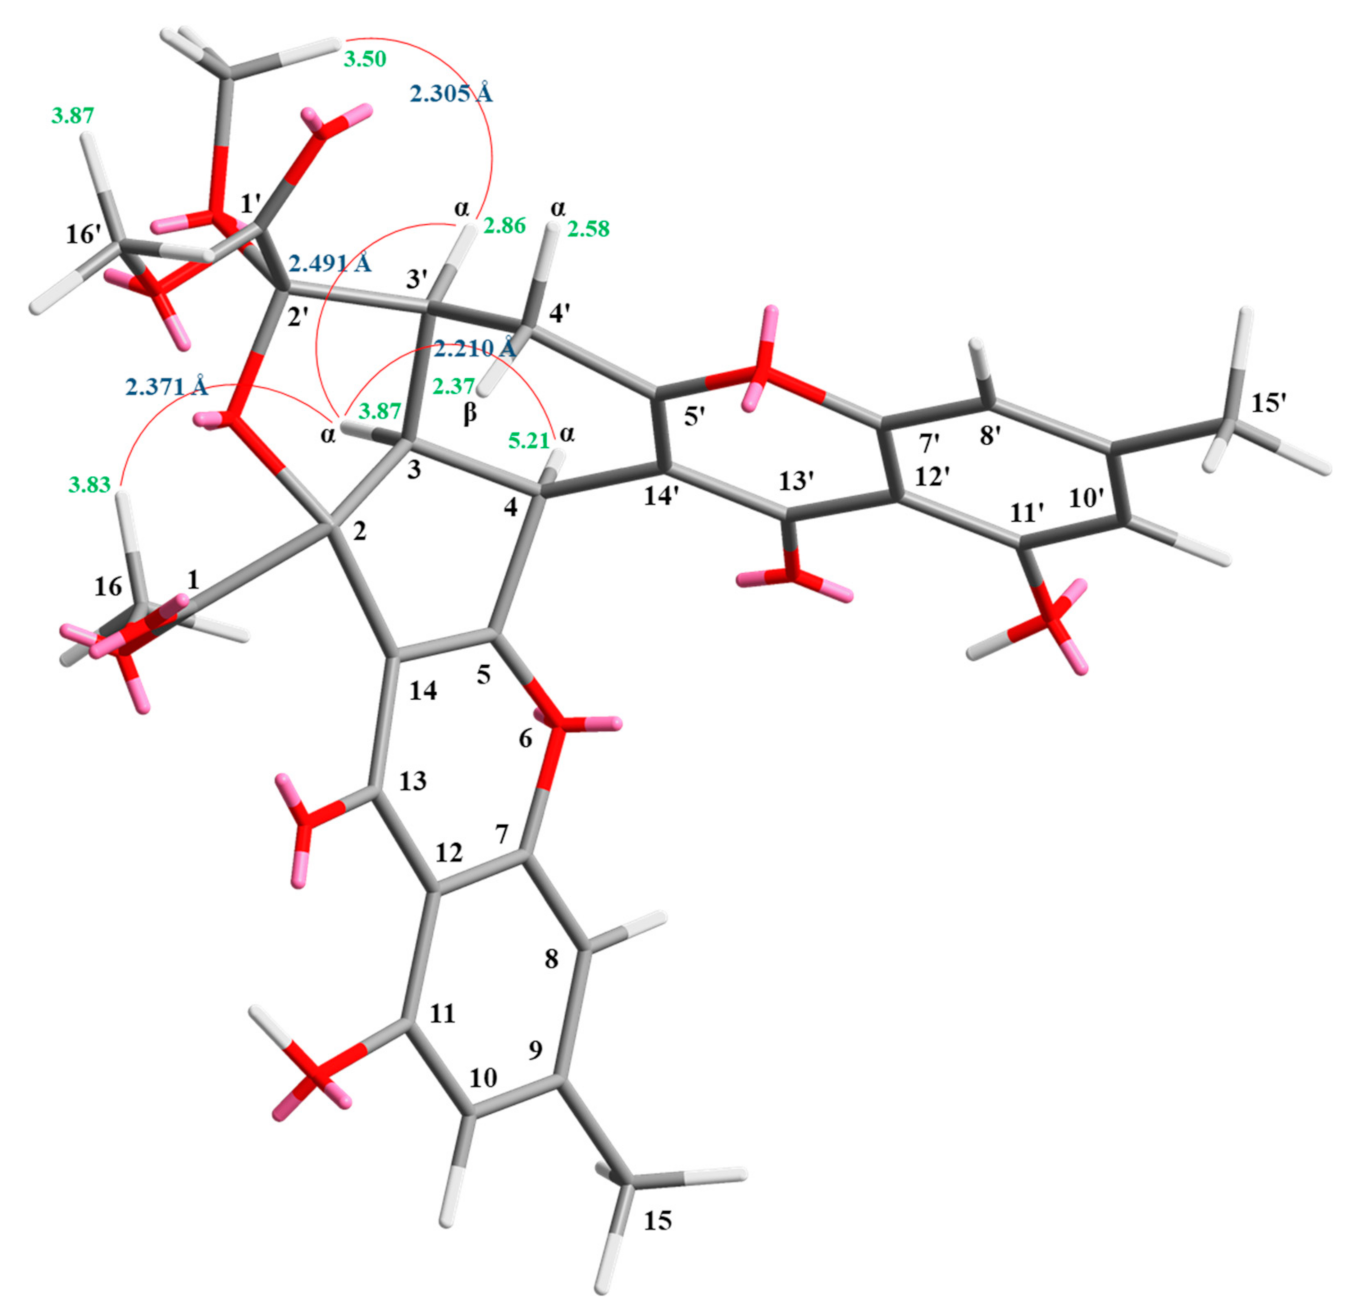
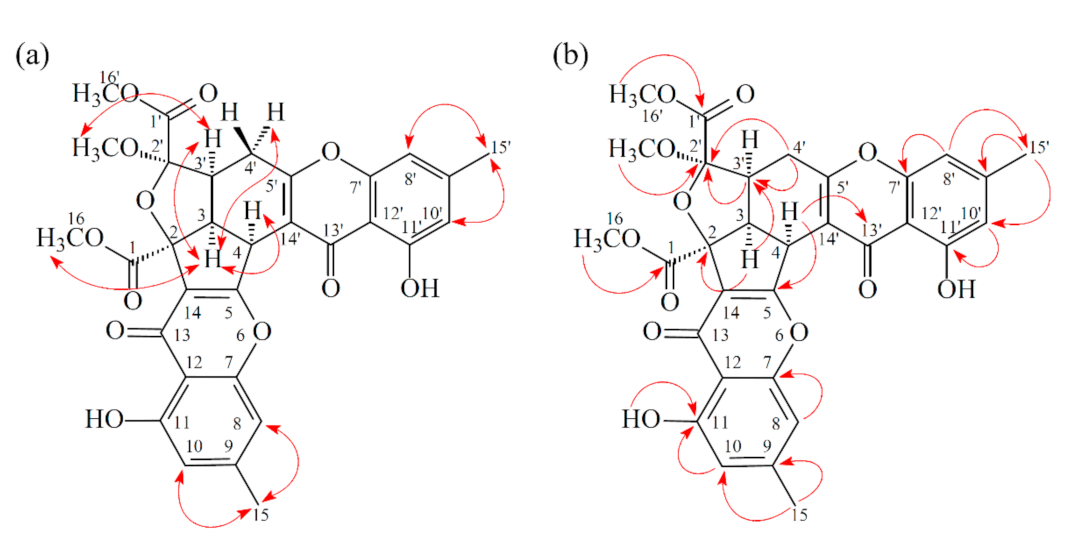
2.2. Structural Elucidation

Compound 1 was isolated as a yellowish amorphous powder. Its molecular formula, C31H26O12, was determined on the basis of the positive HR-ESI-MS ion at m/z 613.13200 [M + Na]+ (calcd. 613.13219) and supported by the 1H- and 13C- NMR data. The IR spectrum showed the presence of hydroxyl (3428 cm−1), ester carbonyl (1744 cm−1), and conjugated carbonyl (1655 cm−1) groups. The 1H- and 13C-NMR data of 1 showed the presence of two hydroxy groups, two methyl groups, three methoxy groups, two pairs of meta-coupling aromatic protons, two methylene protons, and three methine protons. The signals at δ 12.11 and 12.30 exhibited two chelated hydroxyl groups with the carbonyl group. Comparison of the 1H and 13C NMR data of 1 with those of epiremisporine B [16] suggested that their structures were closely related, except that the 2′-methoxyl group of 1 replaced the 2′-hydroxy group of epiremisporine B [16]. This was supported by both HMBC correlations between OMe-2′ (δH 3.50) and C-2′ (δC 111.1) and ROESY correlations between OMe-2′ (δH 3.50) and H-3′ (δH 2.86). The relative configuration of 1 was elucidated on the basis of ROESY experiments. The ROESY cross-peaks between H-3/H-4, H-3/H-3′, H-3/Hα-4′, OMe-2′/H-3′, and H-3/H-16 suggested that H-3, H-4, H-3′, OMe-2′, and COOMe-2 are α-oriented, and COOMe-2′ is β-oriented. To further confirm the relative configuration of 1, a computer-assisted 3D structure was obtained by using the molecular-modeling program CS CHEM 3D Ultra 16.0, with MM2 force-field calculations for energy minimization. The calculated distances between H-3/H-4 (2.210 Å), H-3/H-3′ (2.491 Å), OMe-2′/H-3′ (2.305 Å), and H-3/H-16 (2.371 Å) were all less than 4 Å (Figure 2). This was consistent with the well-defined ROESY observed for each of these H-atom pairs. The absolute configuration of 1 was evidenced by the CD Cotton effects at 332.5 (Δε +8.81), 293.0 (Δε −1.23), 258.5 (Δε +15.60), 239.5 (Δε −4.12), and 206.5 (Δε +4.09) nm, in analogy with those of epiremisporine B [16]. The 1H- and 13C-NMR resonances were fully assigned by the 1H–1H COSY, HSQC, ROESY, and HMBC experiments (Figure 3). On the basis of the above data, the structure of 1 was elucidated, as shown in Figure 1, and named epiremisporine C.
Compound 2 was obtained as an amorphous powder. The ESI–MS demonstrated the quasi-molecular ion [M + Na]+ at m/z 627, implying a molecular formula of C32H28O12, which was confirmed by the HR-ESI-MS (m/z 627.12902 [M + Na]+, calcd. 627.14784) and by the 1H- and 13C-NMR data. The IR spectrum showed the presence of hydroxyl (3480 cm−1), ester carbonyl (1763 cm−1), and conjugated carbonyl (1657 cm−1) groups. The signal at δ 12.36 exhibited a chelated hydroxyl group with the carbonyl group. Comparison of the 1H and 13C NMR data of 2 with those of epiremisporine C (1), suggested that their structures were closely related, except that the 11-methoxyl group of 2 replaced the 11-hydroxy group of 1. This was supported by both HMBC correlations between OMe-11 (δH 3.91) and C-11 (δC 160.0) and ROESY correlations between OMe-11 (δH 3.91) and H-10 (δH 6.58). The relative configuration of 2 was elucidated on the basis of ROESY experiments. The ROESY cross-peaks between H-3/H-4, H-3/H-3′, H-3/Hα-4′, OMe-2′/H-3′, and H-3/H-16 suggested that H-3, H-4, H-3′, OMe-2′, and COOMe-2 were α-oriented, and COOMe-2′ was β-oriented. To further confirm the relative configuration of 2, a computer-assisted 3D structure was obtained by using the molecular-modeling program CS CHEM 3D Ultra 16.0, with MM2 force-field calculations for energy minimization. The calculated distances between H-3/H-4 (2.200 Å), H-3/H-3′ (2.484 Å), OMe-2′/H-3′ (2.306 Å), and H-3/H-16 (2.329 Å) were all less than 4 Å (Figure 4). This was consistent with the well-defined ROESY observed for each of these H-atom pairs. Compound 2 showed similar CD Cotton effects [330.5 (Δε +5.39), 290.5 (Δε –6.24), 262.5 (Δε +19.72), 238.5 (Δε –2.06), and 207.0 (Δε +13.72) nm] compared with 1 and epiremisporine B [16]. Thus, 2 possessed a 2S,3R,2′R,3′S-configuration. On the basis of the above data, the structure of 2 was elucidated, as shown in Figure 1, and named epiremisporine D, which was further confirmed by the 1H-1H COSY, ROESY (Figure 5a), DEPT, HSQC, and HMBC (Figure 5b) experiments.
Compound 3 was isolated as an amorphous powder. The ESI–MS demonstrated the quasi-molecular ion [M + Na]+ at m/z 627, implying a molecular formula of C32H28O12, which was confirmed by the HR–ESI–MS (m/z 627.12919 [M + Na]+, calcd. 627.14784) and by the 1H- and 13C-NMR data. The IR spectrum showed the presence of hydroxyl (3466 cm−1), ester carbonyl (1761 and 1740 cm−1), and the conjugated carbonyl (1657 cm−1) groups. The signal at δ 12.50 exhibited a chelated hydroxyl group with the carbonyl group. Comparison of the 1H and 13C NMR data of 3 with those of epiremisporine D (2) suggested that their structures were closely related, except that the 2′β-methoxyl group of 3 replaced the 2′α-methoxyl group of 2. This was supported by both HMBC correlations between OMe-2′ (δH 3.11) and C-2′ (δC 107.6), and the ROESY correlations between OMe-2′ (δH 3.11) and Hβ-4′ (δH 2.85). The relative configuration of 3 was elucidated on the basis of ROESY experiments. The ROESY cross-peaks between H-3/H-4, H-3/H-3′, H-3/Hα-4′, OMe-2′/H-4′, and H-3/H-16 suggested that H-3, H-4, H-3′, COOMe-2, and COOMe-2′ were α-oriented, and OMe-2′ was β-oriented. To further confirm the relative configuration of 3, a computer-assisted 3D structure was obtained by using the molecular-modeling program CS CHEM 3D Ultra 16.0, with MM2 force-field calculations for energy minimization. The calculated distances between H-3/H-4 (2.169 Å), H-3/H-16 (2.285Å), H-3/H-3′ (2.445 Å), and OMe-2′/Hβ-4′ (3.682Å) were all less than 4 Å (Figure 6). This was consistent with the well-defined ROESY observed for each of these H-atom pairs. Compound 3 showed similar CD Cotton effects [331.0 (Δε +4.01), 286.5 (Δε −7.51), 261.5 (Δε +19.77), 230.5 (Δε −4.98), and 207.5 (Δε +12.68) nm], compared to the literature data [16]. Thus, 3 possessed a 2S,3R,2′S,3′S-configuration. The 1H- and 13C-NMR resonances were fully assigned by 1H–1H COSY, ROESY (Figure 7a), HSQC, and HMBC (Figure 7b) experiments. On the basis of the above data, the structure of 3 was elucidated, as shown in Figure 1, and named epiremisporine E.
The correlations between the dihedral angles (H3′-C3′-C4′-H4′α and H3′-C3′-C4′-H4′β) and the vicinal coupling constants (J3′, 4′α and J3′, 4′β) of compounds 13 and related analogues [16] are summarized in Table 1. The dihedral angles were calculated by using the molecular-modeling program CS CHEM 3D Ultra 16.0, with the MM2 force-field calculations for energy minimization. The correlations between dihedral angles (H3′-C3′-C4′-H4′α and H3′-C3′-C4′-H4′β) and vicinal coupling constants (J3′, 4′α and J3′, 4′β) of compounds 13 were consistent with the Karplus relationship. The 2′S,3′S-configuration slightly decreased the J3′, 4′β value from 11.3~12.8 to 8.3~10.3 compared to the 2′R,3′S-configuration. These data could also support the structural confirmation of the new compounds 13.

2.3. Structure Identification of the Known Isolated Compounds

The known isolated compounds were readily identified by a comparison of physical and spectroscopic data (UV, IR, 1H-NMR, [α]D, and MS) with corresponding authentic samples or literature values. They included epiremisporine B (4) [16] (Figures S31–S34; Tables S1 and S2), penicitrinone A (5) [15,28] (Figures S35 and S36), 8-hydroxy-1-methoxycarbonyl-6-methylxanthone (6) [10] (Figures S37 and S38), and isoconiochaetone C (7) [16] (Figures S39 and S40).

2.4. Biological Studies

2.4.1. Inhibitory Activities on Neutrophil Pro-Inflammatory Responses

The anti-inflammatory effects of the isolated compounds from Penicillium citrinum were evaluated by their ability to suppress formyl-L-methionyl-L-leucyl-L-phenylalanine (fMLP)-induced O2•– generation by human neutrophils. The anti-inflammatory activity data are shown in Table 2. The clinically used anti-inflammatory agent, ibuprofen, was used as the positive control. From the results of our anti-inflammatory tests, epiremisporine D (2), epiremisporine E (3), epiremisporine B (4), and penicitrinone A (5) exhibited inhibition (IC50 values ≤ 8.28 μM) of superoxide anion generation by human neutrophils, in response to fMLP. Thus, our study suggests Penicillium citrinum and its isolated compounds (especially 2, 3, 4, and 5) could be further developed as potential candidates for the treatment or prevention of various inflammatory diseases.

2.4.2. Cytotoxic Effects and Selectivity of Compounds 17

In this study, the cytotoxic activities of seven compounds (17) against A549 (human lung carcinoma) and HT-29 (human colon carcinoma) cells were studied; shown in Table 3. Among the isolated compounds, compounds 3, 4, and 5 exhibited potent cytotoxic activities with IC50 values of 43.82 ± 6.33, 32.29 ± 4.83, and 49.15 ± 6.47 μM against A549 cells, respectively. In addition, compound 4 exhibited cytotoxic activities with an IC50 value of 50.88 ± 2.29 μM against HT-29 cells. According to the data in Table 2, compounds 3 and 5 showed selective cytotoxicity against A549 cancer cells. Among the chromone derivatives (14), epiremisporine B (4) (with 2′-hydroxy group) exhibited a more effective cytotoxic activity than its analogue, epiremisporines C–E (13) (without 2′-hydroxy group) against the A549 and HT-29 cells. New compound, epiremisporines E (3) (with 2′β-methoxyl group) exhibited a stronger anticancer activity than its analogues, epiremisporines C and D (1 and 2) (with 2′α-methoxyl group) against A549 cells.

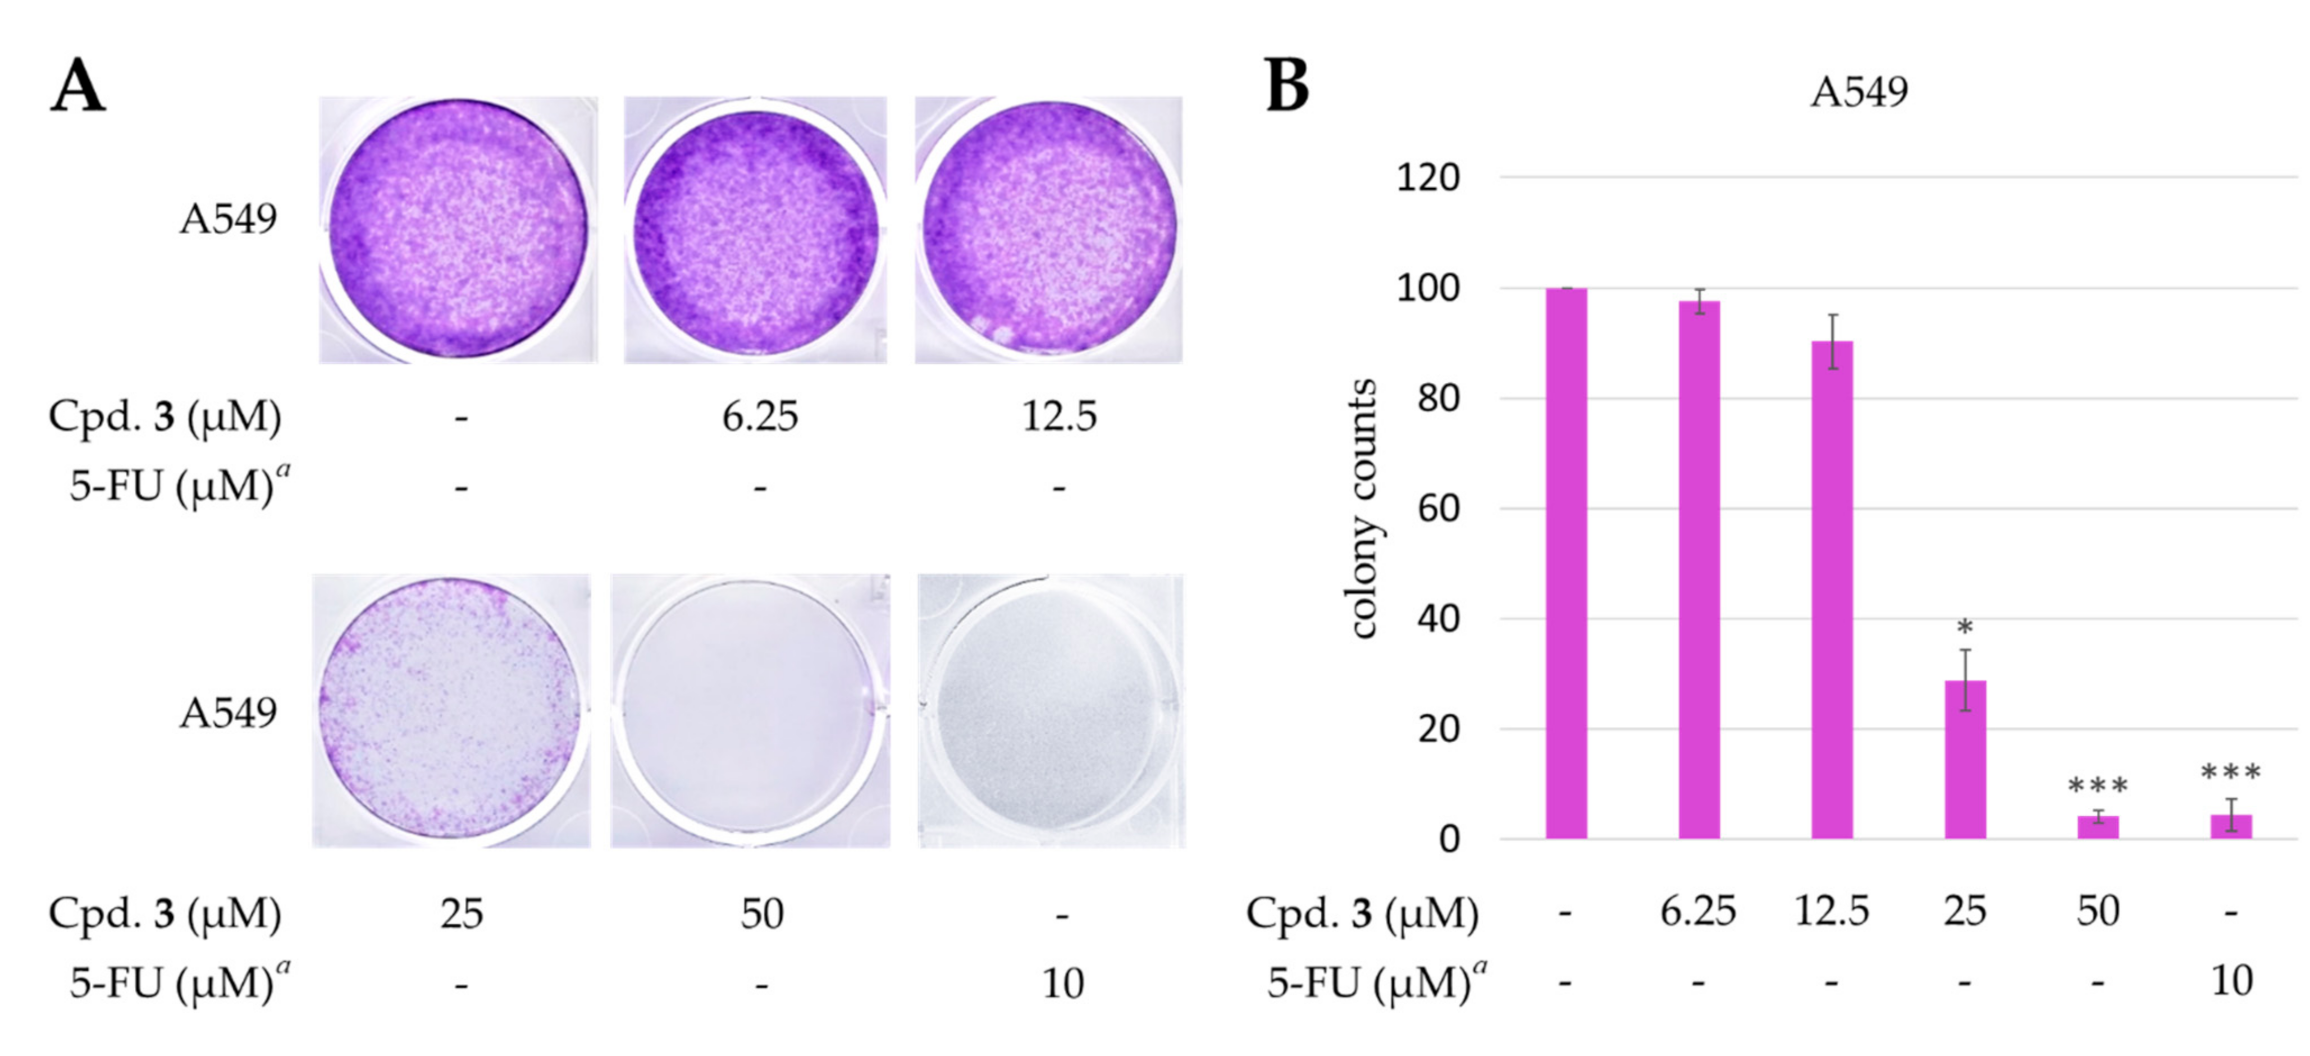
2.4.3. New Compound 3 Inhibited Proliferation of A549 Cells

The known compounds, epiremisporine B (4) [16] and penicitrinone A (5) [28], were reported to exhibit anticancer activities in previous studies. Epiremisporine E (3) was selectively tested for clonogenic assay as it is a new compound and possesses cytotoxic activity against A549. The effect of compound 3 on colony formation of A549 cells was examined using the clonogenic assay (Figure 8). The A549 cell colonies were visualized as blue discs, through crystal violet staining. It was clearly observed that compound 3 (25 μM) significantly reduced the colony formation of A549 cells. Moreover, compound 3 almost completely inhibited the colony formation at 50 μM.

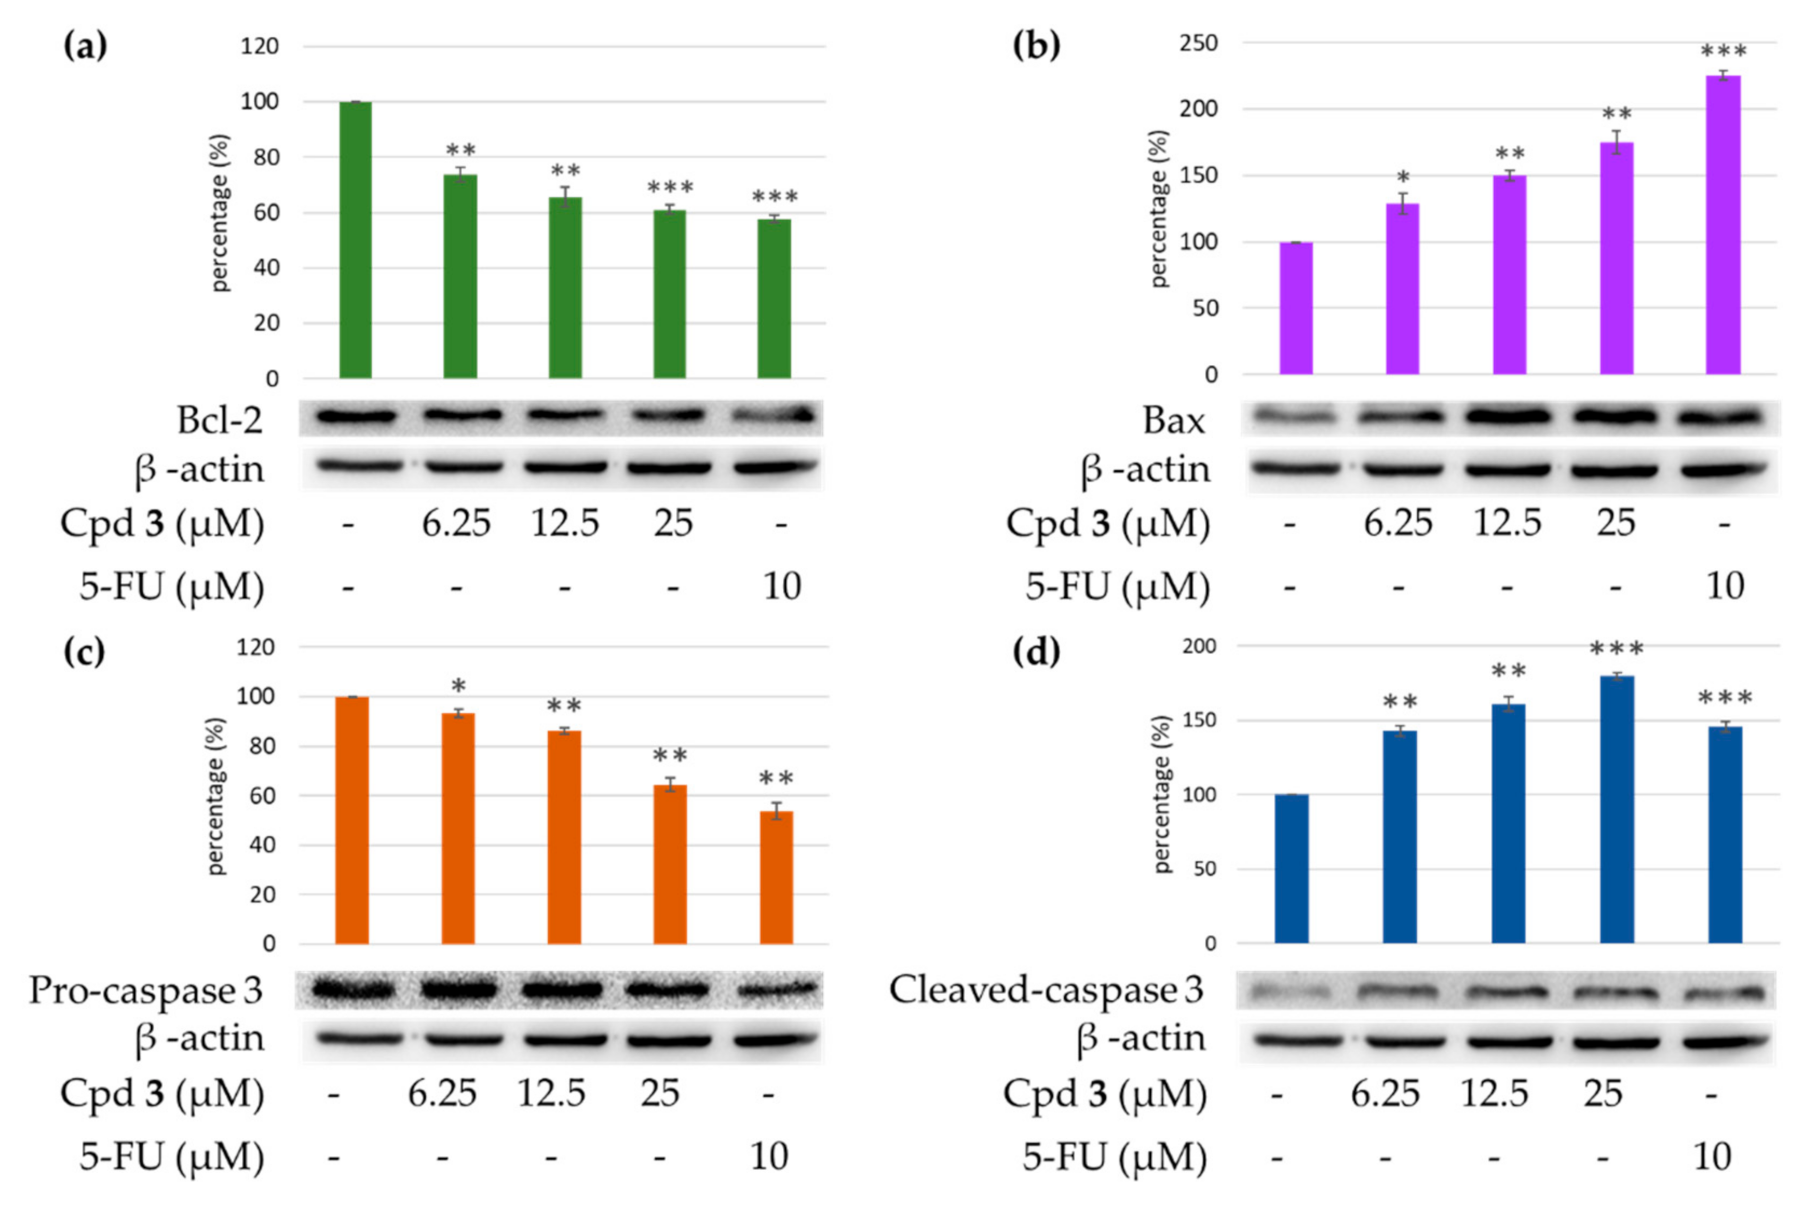
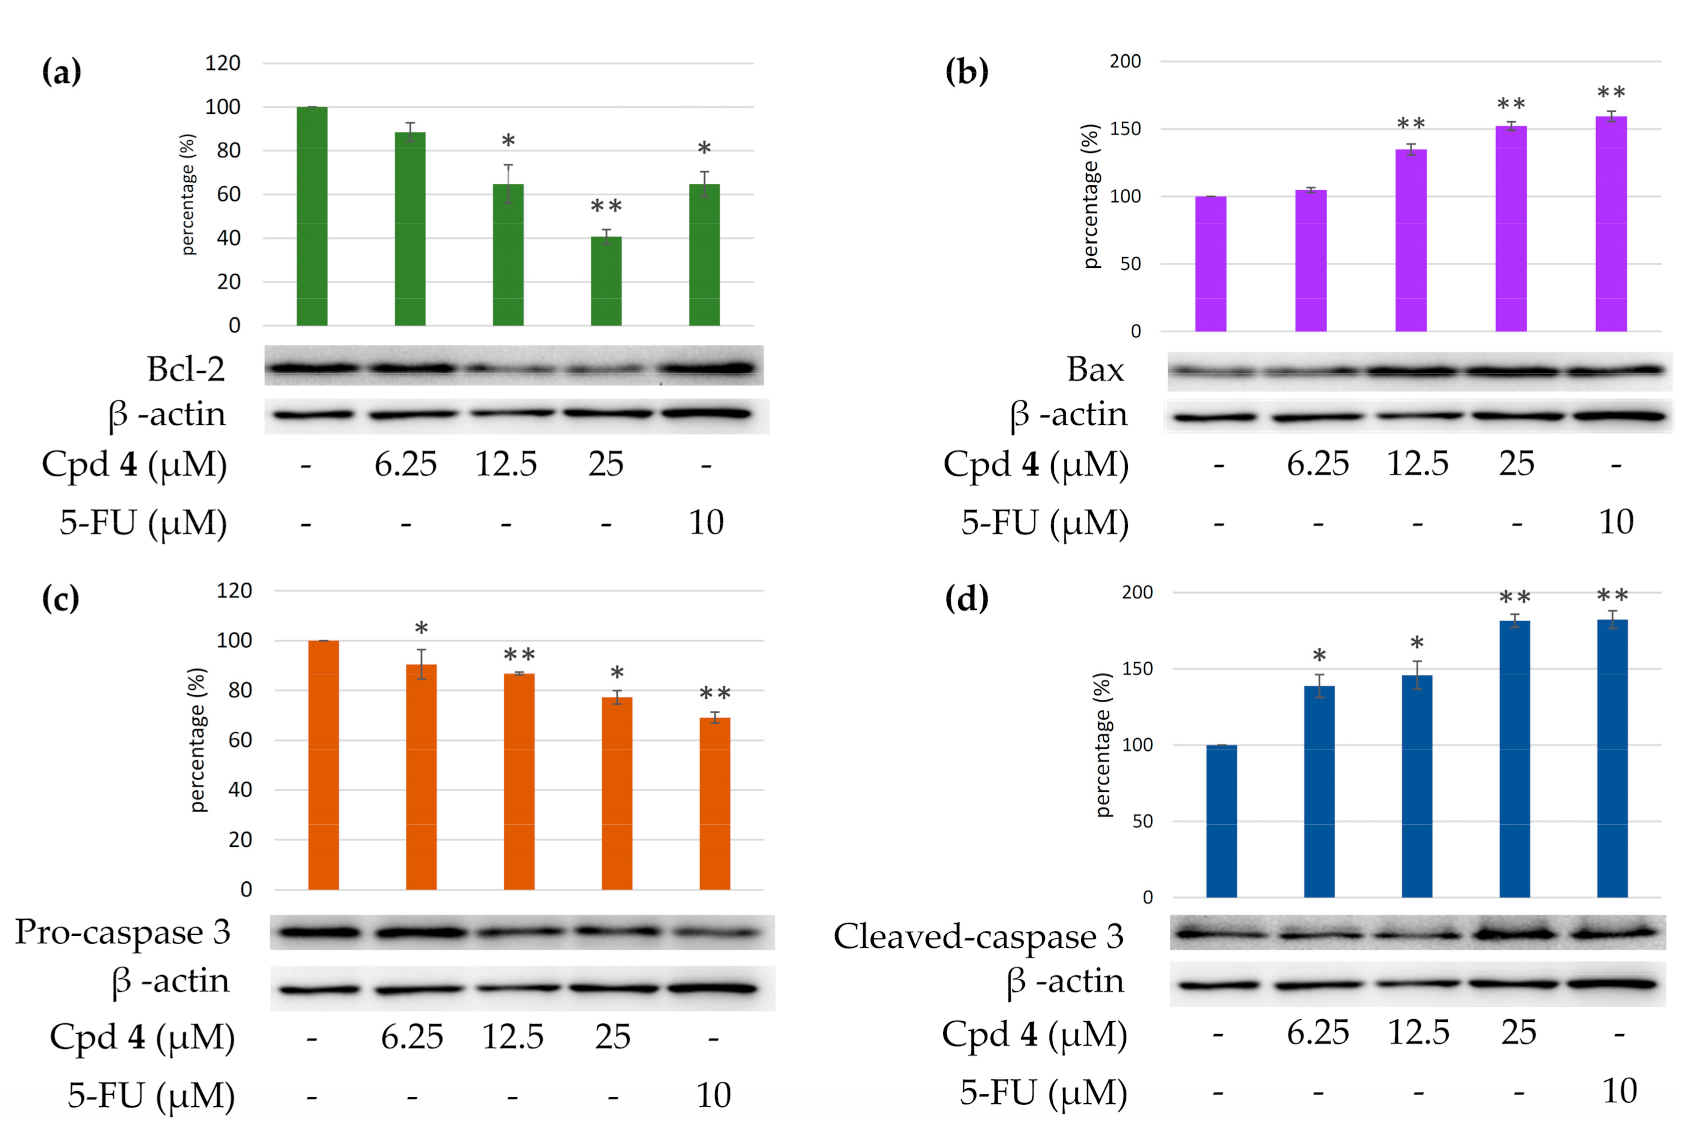
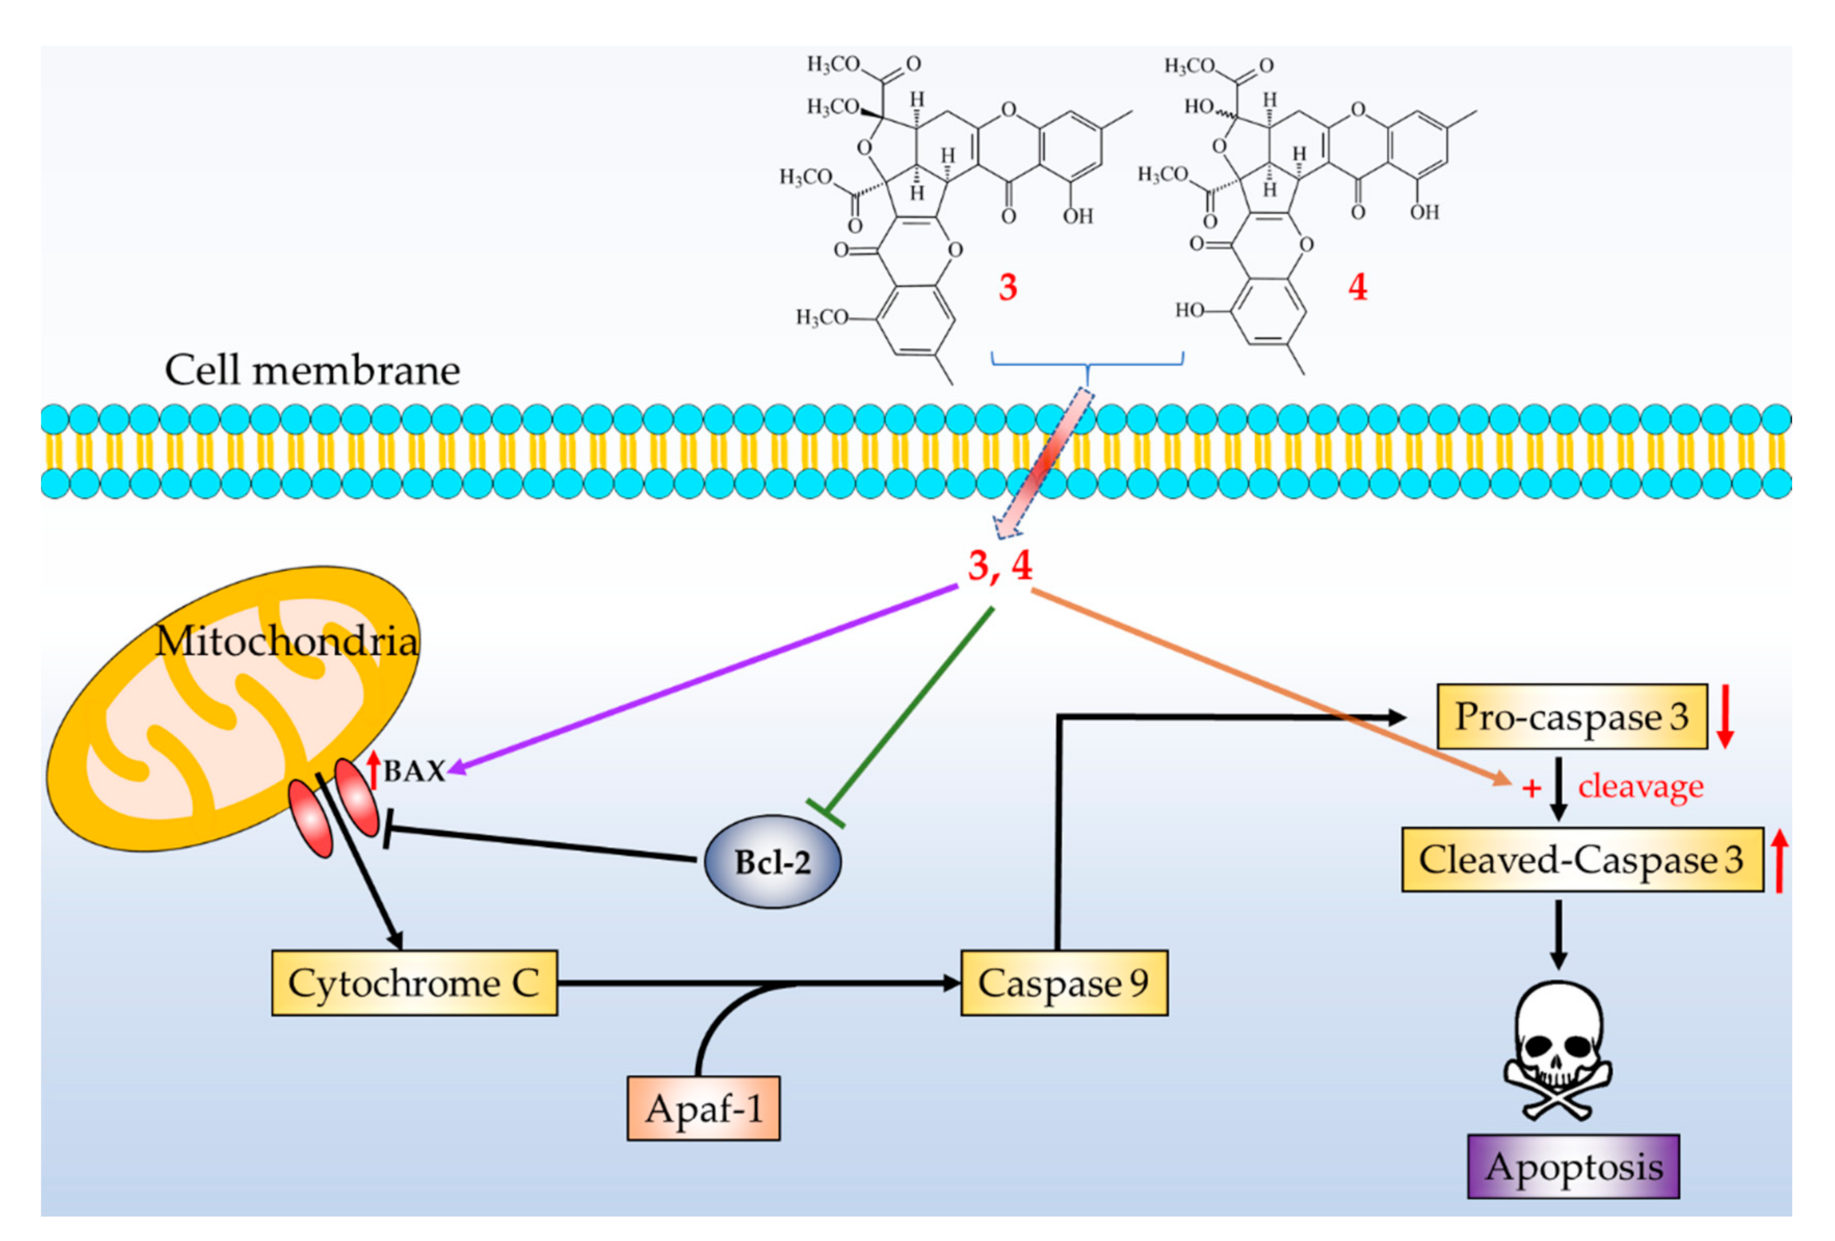
2.4.4. Effects of Epiremisporine E (3) and Epiremisporine B (4) on Protein Expressions of Pro-caspase 3 and Cleaved-caspase 3 in A549 Cells

Caspase 3 activation is a hallmark of apoptosis. Caspase 3 activation involves the cleavage of pro-caspase 3 (the inactive precursor form of caspase 3), leading to the formation of cleaved-caspase 3 (which is the active caspase 3). Upon apoptosis, the pro-caspase 3 would decrease and the cleaved-caspase 3 would increase accordingly. We further investigated whether epiremisporine E (3) and epiremisporine B (4) were able to influence these enzymatic activities of caspase 3. The results showed that compounds 3 and 4 suppressed pro-caspase 3 and increased the cleaved-caspase 3 (Figure 9 and Figure 10). Furthermore, compounds 3 and 4 markedly induced apoptosis of A549 cells through caspase 3-dependent pathways.

2.4.5. Effects of Compounds 3 and 4 on Protein Expressions of Bax and Bcl-2 in A549 Cells

To determine whether compounds 3 and 4 could influence the expression of proteins related to A549 cells apoptosis, compounds 3 and 4 (6.25, 12.5, and 25 μM) were added to A549 cells. Figure 9 and Figure 10 showed that the expression level of pro-apoptotic protein, bax was obviously higher with 25 μM treatment of compound 3 or 4 than with 12.5 or 6.25 μM treatment. On the contrary, the cells treated with 25 μM of compound 3 or 4 showed higher Bcl-2 (anti-apoptotic protein) expression than that treated with 12.5 or 6.25 μM. The results showed that compounds 3 and 4 suppressed the expression of Bcl-2 and increased bax expression.

3. Experimental Section

3.1. General Procedures

Optical rotations were measured using a Jasco P-2000 polarimeter (Japan Spectroscopic Corporation, Tokyo, Japan) in CHCl3. Circular dichroism (CD) spectra were obtained on a J-715 spectropolarimeter (Jasco, Easton, MD, USA). Ultraviolet (UV) spectra were obtained on a Hitachi U-2800 Double Beam Spectrophotometer (Hitachi High-Technologies Corporation, Tokyo, Japan). Infrared (IR) spectra (neat or KBr) were recorded on a Shimadzu IRAffinity-1S FT-IR Spectrophotometer (Shimadzu Corporation, Kyoto, Japan). Nuclear magnetic resonance (NMR) spectra, including correlation spectroscopy (COSY), rotating frame nuclear Overhauser effect spectroscopy (ROESY), heteronuclear multiple-bond correlation (HMBC), and heteronuclear single-quantum coherence (HSQC) experiments, were acquired using a BRUKER AVIII-500 or a BRUKER AVIII-600 spectrometer (Bruker, Bremen, Germany), operating at 500 or 600 MHz (1H) and 125 or 150 MHz (13C), respectively, with chemical shifts given in the ppm (δ), using CDCl3 as an internal standard (peak at 7.263 ppm in 1H NMR and 77.0 ppm in 13C NMR spectrum). Electrospray ionization (ESI) and high-resolution electrospray ionization (HRESI)-mass spectra were recorded on a Bruker APEX II Mass Spectrometer (Bruker, Bremen, Germany). Silica gel [70–230 mesh (63–200 μm) and 230–400 mesh (40–63 μm), Merck] was used for column chromatography (CC). Silica gel 60 F-254 (Merck, Darmstadt, Germany) was used for thin-layer chromatography (TLC) and preparative thin-layer chromatography (PTLC).

3.2. Fungal Material

The fungal strain Penicillium citrinum BCRC 09F458 was isolated from waste water, which was collected from Hazailiao, Dongshi, Chiayi, Taiwan, in 2009. The fungal strain was identified as Penicillium citrinum (family Trichocomaceae) by the BCRC center, based on cultural and anamorphic data. The rDNA-ITS (internal transcribed spacer) region was used for further identification. After searching the GenBank database through BLAST (nucleotide sequence comparison program), it was found to have a 100% similarity to P. citrinum. P. citrinum BCRC 09F458 was stored in the Biological Resources Collection and Research Center (BCRC) of the Food Industry Research and Development Institute (FIRDI).

Cultivation and Preparation of the Fungal Strain

We kept P. citrinum BCRC 09F0458 on potato dextrose agar (PDA), and cultivated the strain on PDA at 25 °C for one week, and finally harvested the spores with sterile water. The spores (5 × 10⁵) were seeded into 300 mL shake flasks containing 50 mL RGY medium (3% rice starch, 7% glycerol, 1.1% polypeptone, 3% soybean powder, 0.1% MgSO4, and 0.2% NaNO3), and cultivated with shaking (150 rpm) at 25 °C, for 3 days. After the mycelium enrichment step, an inoculum mixing 100 mL mycelium broth and 100 mL RGY medium was inoculated into plastic boxes (25 cm × 30 cm) containing 1.5 kg sterile rice and cultivated at 25 °C for producing rice, and the above mentioned RGY medium was added for maintaining the growth. After 21 days of cultivation, the rice was harvested, and used as a sample for further extraction.

3.3. Extraction and Isolation

The rice of the P. citrinum BCRC 09F0458 (1.5 kg) was extracted with 95% EtOH (3 × 10 L, 3 d each) at room temperature. The ethanol extract was concentrated under reduced pressure, and was partitioned with n-BuOH/H2O (1:1, v/v) to afford n-BuOH soluble fraction (36.2 g), H2O soluble fraction (13.0 g), and insoluble fraction (500 mg). The n-BuOH fraction (fraction A, 36.2 g) was purified by column chromatography (CC) (1.6 kg of silica gel, 70–230 mesh ((63–200 μm); n-hexane/EtOAc 25:1–0:1, 1500 mL) to afford 13 fractions: A1–A13. Fraction A2 (1.54 g) was subjected to medium pressure liquid chromatography (MPLC) (69 g of silica gel, 230–400 mesh (40–63 μm)); n-hexane/acetone 1:0–0:1, 700 mL-fractions) to give 11 subfractions: A2-1–A2-11. Fraction A2-6 (126 mg) was further purified by semipreparative normal-phase high performance liquid chromatography (HPLC) (silica gel; n-hexane/dichloromethane/EtOAc, 6:3:1) to obtain 8-hydroxy-1-methoxycarbonyl-6-methylxanthone (6) (14.9 mg). Fraction A6 (1.18 g) was subjected to MPLC (53 g of silica gel, 230–400 mesh (40–63 μm); n-hexane/acetone 1:0–0:1, 500 mL-fractions) to give 13 subfractions: A6-1–A6-13. Fraction A6-9 (150 mg) was further purified by preparative TLC (silica gel; n-hexane/EtOAc, 1:9) to afford penicitrinone A (5) (18.3 mg). Fraction A9 (1.44 g) was subjected to MPLC (65 g of silica gel, 230–400 mesh (40–63 μm)); dichloromethane/EtOAc 1:0–2:3, 650 mL-fractions) to give 12 subfractions: A9-1–A9-12. Fraction A9-6 (128 mg) was further purified by preparative TLC (silica gel; n-hexane/acetone, 3:2) to afford epiremisporine C (1) (12.2 mg). Fraction A10 (0.98 g) was subjected to MPLC (44 g of silica gel, 230–400 mesh (40–63 μm); n-hexane/acetone 1:0–0:1, 450 mL-fractions) to give 10 subfractions: A10-1–A10-10. Fraction A10-4 (120 mg) was further purified by preparative TLC (silica gel; n-hexane/EtOAc, 7:3) to afford isoconiochaetone C (7) (11.2 mg). Fraction A11 (2.38 g) was subjected to MPLC (107 g of silica gel, 230–400 mesh (40–63 μm); n-hexane/acetone 1:0–0:1, 1000 mL-fractions) to give 14 subfractions: A11-1–A11-14. Fraction A11-2 (138 mg) was further purified by semipreparative normal-phase HPLC (silica gel; n-hexane/EtOAc, 1:1) to afford epiremisporine D (2) (14.6 mg). Fraction A11-4 (168 mg) was further purified by preparative TLC (silica gel; dichloromethane/methanol, 19:1) to afford epiremisporine B (4) (23.8 mg). Fraction A12 (1.28 g) was subjected to MPLC (58 g of silica gel, 230–400 mesh (40–63 μm); n-hexane/EtOAc 1:0–0:1, 600 mL-fractions) to give 10 subfractions: A12-1–A12-10. Fraction A12-1 (122 mg) was further purified by preparative TLC (silica gel; n-hexane/dichloromethane/acetone, 5:3:2) to afford epiremisporine E (3) (13.7 mg).
Epiremisporine C (1): [α ] D 25 = +527.6° (c 0.22, CHCl3); UV (MeOH) λmax nm (log ε): 241 (4.35), 326 (3.50) nm; 1H NMR data, see Table 4; 13C NMR data, see Table 5.
Epiremisporine D (2): [α ] D 25 = +526.8° (c 0.10, CHCl3); UV (MeOH) λmax nm (log ε): 237 (4.25), 317 (3.52) nm; 1H NMR data, see Table 4; 13C NMR data, see Table 5.
Epiremisporine E (3): [α ] D 25 = +561.3° (c 0.09, CHCl3); UV (MeOH) λmax nm (log ε): 235 (4.30), 315 (3.54) nm; 1H NMR data, see Table 4; 13C NMR data, see Table 5.
Epiremisporine B (4): Yellow amorphous powder; [α ] D 25 = +523.6° (c 0.16, CHCl3); 1H NMR data, see Table S1; 13C NMR data, see Table S2; HRESIMS: m/z 599.11558 [M + Na]+ (calcd. for C30H24O12 + Na, 599.11654).
Penicitrinone A (5): Orange crystalline powder; [α ] D 25 = +102.6° (c 0.12, MeOH); 1H NMR (600 MHz, CDCl3) δ 1.32 (3H, d, J = 7.2 Hz, Me-4), 1.33 (3H, d, J = 7.0 Hz, Me-3′), 1.42 (3H, d, J = 6.4 Hz, Me-2′), 1.44 (3H, d, J = 6.7 Hz, Me-3), 2.11 (3H, s, Me-5), 2.21 (3H, s, Me-4′), 3.12 (1H, qd, J = 7.2, 0.9 Hz, H-4), 3.16 (1H, qd, J = 7.0, 4.1 Hz, H-3′), 4.61 (1H, qd, J = 6.4, 4.1 Hz, H-2′), 4.96 (1H, qd, J = 6.7, 0.9 Hz, H-3), 6.37 (1H, s, H-7), 8.33 (1H, br s, OH-5′); HRESIMS: m/z 381.17094 [M + H]+ (calcd. for C23H24O5 + H, 381.17020).
8-Hydroxy-1-methoxycarbonyl-6-methylxanthone (6): Yellow amorphous solid; 1H NMR (600 MHz, CDCl3) δ 2.44 (3H, s, Me-6), 4.03 (3H, s, COOMe-1), 6.64 (1H, br d, J = 1.4 Hz, H-5), 6.76 (1H, br d, J = 1.4 Hz, H-7), 7.31 (1H, dd, J = 7.3, 1.1 Hz, H-2), 7.53 (1H, dd, J = 8.5, 1.1 Hz, H-4), 7.74 (1H, dd, J = 8.5, 7.3 Hz, H-3), 12.15 (1H, s, OH-8); HRESIMS: m/z 285.07730 [M + H]+ (calcd. for C16H12O5 + H, 285.07630).
Isoconiochaetone C (7): Colorless needles (MeOH), m.p. 99–100.5 °C; [α ] D 25 = +79.3° (c 0.18, MeOH); 1H NMR (600 MHz, CDCl3) δ 2.15 (1H, dddd, J = 14.0, 8.5, 2.5, 1.4 Hz, Hβ-2), 2.32 (1H, dddd, J = 14.0, 9.4, 7.4, 6.8 Hz, Hα-2), 2.40 (3H, s, Me-8), 2.77 (1H, ddd, J = 18.0, 9.4, 2.5 Hz, Hβ-3), 3.17 (1H, dddd, J = 18.0, 8.5, 7.4, 1.4 Hz, Hα-3), 3.50 (3H, s, OMe-1), 4.94 (1H, dt, J = 6.8, 1.4 Hz, H-1), 6.63 (1H, br s, H-9), 6.71 (1H, br s, H-7), 12.55 (1H, s, OH-10); HRESIMS: m/z 247.09688 [M + H]+ (calcd. for C14H14O4 + H, 247.09703).

3.4. Biological Assay

The anti-inflammatory effects of the isolated compounds from Penicillium citrinum were evaluated by suppressing fMLP-induced O2•– generation by human neutrophils. In addition, anti-cancer activity was evaluated by cytotoxicity assay and Western blot analysis.

3.4.1. Preparation of Human Neutrophils

Human neutrophils from the venous blood [21] of healthy, adult volunteers (20–35 years old) were isolated using a standard method of dextran sedimentation, prior to centrifugation in a Ficoll Hypaque gradient and hypotonic lysis of erythrocytes, as previously described [29]. Purified neutrophils containing >98% viable cells, as determined by the trypan blue exclusion method, were resuspended in HBSS buffer at pH 7.4 and were maintained at 4 °C, prior to use [30].

3.4.2. Measurement of O2•– Generation

The assay for measurement of O2•– generation was based on the SOD-inhibitable reduction of ferricytochrome c [31]. In brief, neutrophils (1 × 10⁶ cells/mL) pretreated with the various test agents at 37 °C for 5 min were stimulated with fMLP (1 μmol/L) in the presence of ferricytochrome c (0.5 mg/mL). Extracellular O2•– production was assessed with a UV spectrophotometer at 550 nm (Hitachi U-3010, Tokyo, Japan). The percentage of superoxide inhibition of the test compound was calculated as the percentage of inhibition = {(control − resting) − (compound − resting)}/(control − resting) × 100. The software SigmaPlot was used for determining the IC50 values [30].

3.4.3. Chemicals and Antibodies

Fluorouracil (5-FU) and bovine serum albumin (BSA) were purchased from Sigma-Aldrich (St. Louis, MO, USA). The antibodies against Bcl-2, Bax, and β-actin were purchased from Cell Signaling Technology (Danvers, MA, USA). Caspase-3 was obtained from GeneTex International Corporation (Hsinchu, Taiwan).

3.4.4. Cells and Culture Medium

A549 (human lung carcinoma) and HT-29 (human colon carcinoma) cells were kindly provided by Prof. T. M. Hu and Prof. Y. Su, respectively, of National Yang-Ming University, Taipei, Taiwan.
All cell lines were cultured in Dulbecco’s modified Eagle’s medium supplemented with 10% fetal bovine serum (FBS), 100 U/mL penicillin, 100 μg/mL streptomycin, 2 μM L-glutamine, and 1 mM sodium pyruvate. The cells were incubated in an atmosphere of 37 °C and 5% CO2 and passaged twice a week. Cells were stored in liquid nitrogen at −155 °C. After the cells were thawed, the experiment was completed before 30 generations. The purpose was to minimize experimental errors. The compound stock solution was stored in DMSO at a concentration of 10 mM and stored at −20 °C, and finally melted immediately before use.

3.4.5. Cytotoxicity Assay

A MTT colorimetric assay was used to determine cell viability. The assay was modified from that of Mosmann [32]. MTT reagent (0.5 mg/mL) was added onto the attached cells mentioned above (100 μL per 100 μL culture) and incubated at 37 °C for 3 h. Then, DMSO was added and the amount of colored formazan metabolite formed was measured by absorbance at 570 nm, using an ELISA plate reader (μ Quant). The optical density of formazan formed in control (untreated) cells was taken as 100% viability.

3.4.6. Clonogenic Assay

The clonogenic assay followed as previously described with slight changes [33]. For the clonogenic assay, cells at a density of 3000 cells/well were seeded in 6-well plates for 24 h. Next, the cells were treated with compound 3 or vehicle (DMSO) and allowed to form colonies for 14 days. Colonies were washed with PBS, and the cells attached to the plastic surface were fixed in 99% MeOH for 30 min and stained with 0.2% crystal violet for 15 min. The stained cells were quantified using the ImageJ software (BioTechniques, NY, USA).

3.4.7. Western Blotting Analysis

Western blot analysis was performed according to the method previously reported [34]. In brief, A549 (1 × 10⁵ cells) was seeded into 6 wells plate and grown until 85–90% confluent. Then, different concentrations (3.125, 6.25, 12.5, 25, and 50 μM) of compounds 3 and 4 were added. Cells were collected and lysed by radioimmunoprecipitation assay (RIPA) buffer. Lysates of total protein were separated by 12.5% sodium dodecyl sulfate-polyacrylamide gels and transferred to polyvinylidene difluoride (PVDF) membranes. After blocking, the membranes were incubated with anti-Bax, anti-Bcl-2 (Cell Signaling Inc., Danvers, MA, USA), anti-caspase-3, and anti-β-actin (GeneTex Inc., Irvine, CA, USA) primary antibodies at 4 °C overnight. Then, each membrane was washed with Tris-buffered saline containing 0.1% Tween 20 (TBST) and incubated with horseradish peroxidase (HRP)-conjugated secondary antibodies at room temperature, for 1 h, while shaking. Finally, each membrane was developed using an enhanced chemiluminescence (ECL) detection kit, and the images were visualized by ImageQuant LAS 4000 Mini biomolecular imager (GE Healthcare, MA, USA). The band densities were quantified using the ImageJ software (BioTechniques, NY, USA).

3.4.8. Statistical Analysis

All data are expressed as mean ± SEM. Statistical analysis was carried out using Student’s t-test. A probability of 0.05 or less was considered to be statistically significant. Microsoft Excel 2019 was used for the statistical and graphical evaluation. All experiments were performed at least 3 times.

4. Conclusions

Three novel (13) and four known compounds were isolated and identified from Penicillium citrinum. Among the isolated compounds, compounds 25 could significantly inhibit fMLP-induced O2•− generation, with IC50 values ≤ 8.28 μM. These isolated compounds are worth further research, as promising new leads for developing anti-inflammatory agents. Furthermore, compounds 3 and 4 markedly induced apoptosis of A549 cells through the mitochondrial- and caspase 3-dependent pathways (Figure 11). This suggests that compounds 3 and 4 are worth further investigation and might be expectantly developed as the candidates for the treatment or prevention of non-small cell lung cancer and liver cancer.

Supplementary Materials

The following are available online at https://0-www-mdpi-com.brum.beds.ac.uk/1660-3397/19/1/25/s1, Figures S1–S10: HRESIMS, CD, 1D, and 2D NMR spectra for epiremisporine C (1). Figures S11–S20: HRESIMS, CD, 1D, and 2D NMR spectra for epiremisporine D (2). Figures S21–S30: HRESIMS, CD, 1D, and 2D NMR spectra for epiremisporine E (3). Figures S31–S34: HRESIMS, CD, 1H and 13C NMR spectra for (4). Figures S35 and S36: HRESIMS, 1H NMR spectra for penicitrinone A (5). Figures S37 and S38: HRESIMS, 1H NMR spectra for 8-hydroxy-1-methoxycarbonyl-6-methylxanthone (6). Figures S39 and S40: HRESIMS, 1H NMR spectra for isoconiochaetone C (7). Figure S41: CD and ECD spectra of epiremisporine B. Tables S1 and S2: 1H and 13C NMR spectrum for 4 and epiremisporine B. Table S3: The ROESY correlations for compounds 13.

Author Contributions

Y.-C.C. performed the isolation and structure elucidation of the constituents, and prepared the manuscript. C.-H.C. and H.-R.L. conducted the bioassay and analyzed the data. M.-J.C. and M.-D.W. performed the cultivation and preparation of the fungal strain. S.-L.F. analyzed bioassay data. J.-J.C. planned, designed, and organized all of the research of this study and reviewed the manuscript. All authors read and approved the final version of the manuscript.

Funding

This research received no external funding.

Institutional Review Board Statement

Not applicable.

Informed Consent Statement

Not applicable.

Data Availability Statement

The data presented in this study are available in the main text and the supplementary materials of this article.

Acknowledgments

This research was supported by grants from the Ministry of Science and Technology (MOST), Taiwan (No. MOST 109-2320-B-010-029-MY3 and MOST 106-2320-B-010-033-MY3), awarded to J.-J. Chen. We gratefully thank Shou-Ling Huang and Iren Wang for the assistance in NMR experiments of the Instrumentation Center at NTU which is supported by the Ministry of Science and Technology, Taiwan.

Conflicts of Interest

The authors declare no conflict of interest.

References

  1. Blunt, J.W.; Copp, B.R.; Keyzers, R.A.; Munro, M.H.G.; Prinsep, M.R. Marine natural products. Nat. Prod. Rep. 2015, 32, 116–211. [Google Scholar] [CrossRef] [PubMed] [Green Version]
  2. Kiuru, P.; D’Auria, M.V.; Muller, C.D.; Tammela, P.; Vuorela, H.; Yli-Kauhaluoma, J. Exploring marine resources for bioactive compounds. Planta Med. 2014, 80, 1234–1246. [Google Scholar] [CrossRef] [PubMed]
  3. Bao, J.; Wang, J.; Zhang, X.Y.; Nong, X.H.; Qi, S.H. New furanone derivatives and alkaloids from the co-culture of marine-derived fungi Aspergillus sclerotiorum and Penicillium citrinum. Chem. Biodivers. 2016, 14, 327–335. [Google Scholar]
  4. Huang, G.L.; Zhou, X.M.; Bai, M.; Liu, Y.X.; Zhao, Y.L.; Luo, Y.P.; Niu, Y.Y.; Zheng, C.J.; Chen, G.Y. Dihydroisocoumarins from the mangrove-derived fungus Penicillium citrinum. Mar. Drugs 2016, 14, 177–185. [Google Scholar] [CrossRef] [Green Version]
  5. Ibrar, M.; Ullah, M.W.; Manan, S.; Farooq, U.; Rafiq, M.; Hasan, F. Fungi from the extremes of life: An untapped treasure for bioactive compounds. Appl. Microbiol. Biotechnol. 2020, 104, 2777–2801. [Google Scholar] [CrossRef]
  6. Khan, S.A.; Hamayun, M.; Yoon, H.; Kim, H.Y.; Suh, S.J.; Hwang, S.K.; Kim, J.M.; Lee, I.J.; Choo, Y.S.; Yoon, U.H.; et al. Plant growth promotion and Penicillium citrinum. BMC Microbiol. 2008, 8, 231–241. [Google Scholar] [CrossRef] [Green Version]
  7. Kong, F.; Carter, G.T. Remisporine B, a novel dimeric chromenone derived from spontaneous Diels-Alder reaction of remisporine A. Tetrahedron Lett. 2003, 44, 3119–3122. [Google Scholar] [CrossRef]
  8. Liu, Q.Y.; Zhou, T.; Zhao, Y.Y.; Chen, L.; Gong, M.W.; Xia, Q.W.; Ying, M.G.; Zheng, Q.H.; Zhang, Q.Q. Antitumor effects and related mechanisms of penicitrinine A, a novel alkaloid with a unique spiro skeleton from the marine fungus Penicillium citrinum. Mar. Drugs 2015, 13, 4733–4753. [Google Scholar] [CrossRef]
  9. Liu, F.A.; Lin, X.; Zhou, X.; Chen, M.; Huang, X.; Yang, B.; Tao, H. Xanthones and quinolones derivatives produced by the deep-sea-derived fungus Penicillium sp. SCSIO Ind16F01. Molecules 2017, 22, 1999. [Google Scholar] [CrossRef] [Green Version]
  10. Lösgen, S.; Magull, J.; Schulz, B.; Draeger, S.; Zeeck, A. Isofusidienols: Novel chromone-3-oxepines produced by the endophytic fungus Chalara sp. Eur. J. Org. Chem. 2008, 698–703. [Google Scholar] [CrossRef]
  11. Meng, L.H.; Liu, Y.; Li, X.M.; Xu, G.M.; Ji, N.Y.; Wang, B.G. Citrifelins A and B, citrinin adducts with a tetracyclic framework from cocultures of marine-derived isolates of Penicillium citrinum and Beauveria felina. J. Nat. Prod. 2015, 78, 2301–2305. [Google Scholar] [CrossRef] [PubMed]
  12. Mossini, S.A.; Kemmelmeier, C. Inhibition of citrinin production in Penicillium citrinum cultures by neem [Azadirachta indica A. Juss (meliaceae)]. Int. J. Mol. Sci. 2008, 9, 1676–1684. [Google Scholar] [CrossRef] [PubMed]
  13. Sabdaningsih, A.; Liu, Y.; Mettal, U.; Heep, J.; Riyanti; Wang, L.; Cristianawati, O.; Nuryadi, H.; Sibero, M.T.; Marner, M.; et al. A new citrinin derivative from the Indonesian marine sponge-associated fungus Penicillium citrinum. Mar. Drugs 2020, 18, 227–239. [Google Scholar] [CrossRef]
  14. Shen, H.D.; Wang, C.W.; Chou, H.; Lin, W.L.; Tam, M.F.; Huang, M.H.; Kuo, M.L.; Wang, S.R.; Han, S.H. Complementary DNA cloning and immunologic characterization of a new Penicillium citrinum allergen (Pen c 3). J. Allergy Clin. Immunol. 2000, 105, 827–833. [Google Scholar] [CrossRef]
  15. Wakana, D.; Hosoe, T.; Itabashi, T.; Okada, K.; de Campos Takaki, G.M.; Yaguchi, T.; Fukushima, K.; Kawai, K.I. New citrinin derivatives isolated from Penicillium citrinum. J. Nat. Med. 2006, 60, 279–284. [Google Scholar] [CrossRef]
  16. Xia, M.W.; Cui, C.B.; Li, C.W.; Wu, C.J.; Peng, J.X.; Li, D.H. Rare chromones from a fungal mutant of the marine-derived Penicillium purpurogenum G59. Mar. Drugs 2015, 13, 5219–5236. [Google Scholar] [CrossRef] [PubMed]
  17. Zheng, C.J.; Huang, G.L.; Xu, Y.; Song, X.M.; Yao, J.; Liu, H.; Wang, R.P.; Sun, X.P. A new benzopyrans derivatives from a mangrove-derived fungus Penicillium citrinum from the South China Sea. Nat. Prod. Res. 2016, 30, 821–825. [Google Scholar] [CrossRef] [PubMed]
  18. Zheng, C.J.; Liao, H.X.; Mei, R.Q.; Huang, G.L.; Yang, L.J.; Zhou, X.M.; Shao, T.M.; Chen, G.Y.; Wang, C.Y. Two new benzophenones and one new natural amide alkaloid isolated from a mangrove-derived fungus Penicillium citrinum. Nat. Prod. Res. 2019, 33, 1127–1134. [Google Scholar] [CrossRef]
  19. Witko-Sarsat, V.; Rieu, P.; Descamps-Latscha, B.; Lesavre, P.; Halbwachs-Mecarelli, L. Neutrophils: Molecules, functions and pathophysiological aspects. Lab. Invest. 2000, 80, 617–653. [Google Scholar] [CrossRef] [Green Version]
  20. Ennis, M. Neutrophils in asthma pathophysiology. Curr. Allergy Asthma Rep. 2003, 3, 159–165. [Google Scholar] [CrossRef]
  21. Borregaard, N. The human neutrophil. Function and dysfunction. Eur. J. Haematol. Suppl. 1988, 41, 401–413. [Google Scholar] [CrossRef] [PubMed]
  22. Roos, D.; van Bruggen, R.; Meischl, C. Oxidative killing of microbes by neutrophils. Microbes Infect. 2003, 5, 1307–1315. [Google Scholar] [CrossRef] [PubMed]
  23. Vane, J.R.; Mitchell, J.A.; Appleton, I.; Tomlinson, A.; Bishop-Bailey, D.; Croxtall, J.; Willoughby, D.A. Inducible isoforms of cyclooxygenase and nitric-oxide synthase in inflammation. Proc. Natl. Acad. Sci. USA 1994, 91, 2046–2050. [Google Scholar] [CrossRef] [Green Version]
  24. Hsiao, A.J.; Chen, L.H.; Lu, T.H. Ten leading causes of death in Taiwan: A comparison of two grouping lists. J. Formos. Med. Assoc. 2015, 114, 679–680. [Google Scholar] [CrossRef] [PubMed]
  25. Yip, K.W.; Reed, J.C. Bcl-2 family proteins and cancer. Oncogene 2008, 27, 6398–6406. [Google Scholar] [CrossRef] [PubMed] [Green Version]
  26. Mohan, S.; Abdelwahab, S.I.; Kamalidehghan, B.; Syam, S.; May, K.S.; Harmal, N.S.; Shafifiyaz, N.; Hadi, A.H.; Hashim, N.M.; Rahmani, M.; et al. Involvement of NF-κB and Bcl2/Bax signaling pathways in the apoptosis of MCF7 cells induced by a xanthone compound pyranocycloartobiloxanthone A. Phytomedicine 2012, 19, 1007–1015. [Google Scholar] [CrossRef] [PubMed]
  27. Vucicevic, K.; Jakovljevic, V.; Colovic, N.; Tosic, N.; Kostic, T.; Glumac, I.; Pavlovic, S.; Karan-Djurasevic, T.; Colovic, M. Association of Bax expression and Bcl2/Bax ratio with clinical and molecular prognostic markers in chronic lymphocytic leukemia. J. Med. Biochem. 2016, 35, 150–157. [Google Scholar] [CrossRef] [PubMed] [Green Version]
  28. Wu, C.J.; Yi, L.; Cui, C.B.; Li, C.W.; Wang, N.; Han, X. Activation of the silent secondary metabolite production by introducing neomycin-resistance in a marine-derived Penicillium purpurogenum G59. Mar. Drugs 2015, 13, 2465–2487. [Google Scholar] [CrossRef] [PubMed] [Green Version]
  29. English, D.; Andersen, B.R. Single-step separation of red blood cells. Granulocytes and mononuclear leukocytes on discontinuous density gradients of Ficoll-Hypaque. J. Immunol. Methods 1974, 5, 249–252. [Google Scholar] [CrossRef]
  30. Chen, L.C.; Liao, H.R.; Chen, P.Y.; Kuo, W.L.; Chang, T.H.; Sung, P.J.; Wen, Z.H.; Chen, J.J. Limonoids from the seeds of Swietenia macrophylla and their anti-inflammatory activities. Molecules 2015, 20, 18551. [Google Scholar] [CrossRef] [Green Version]
  31. Babior, B.M.; Kipnes, R.S.; Curnutte, J.T. Biological defense mechanisms. The production by leukocytes of superoxide, a potential bactericidal agent. J. Clin. Invest. 1973, 52, 741–744. [Google Scholar] [CrossRef] [PubMed]
  32. Mosmann, T. Rapid colorimetric assay for cellular growth and survival: Application to proliferation and cytotoxicity assays. J. Immunol. Methods 1983, 65, 55–63. [Google Scholar] [CrossRef]
  33. Su, M.; Zhao, C.; Li, D.; Cao, J.; Ju, Z.; Kim, E.L.; Young-Suk, J.; Jung, J.H. Viriditoxin stabilizes microtubule polymers in SK-OV-3 cells and exhibits antimitotic and antimetastatic potential. Mar. Drugs 2020, 18, 445. [Google Scholar] [CrossRef] [PubMed]
  34. Huang, C.Y.; Chang, T.C.; Wu, Y.J.; Chen, Y.; Chen, J.J. Benzophenone and benzoylphloroglucinol derivatives from Hypericum sampsonii with anti-inflammatory mechanism of otogirinin A. Molecules 2020, 25, 4463. [Google Scholar] [CrossRef] [PubMed]
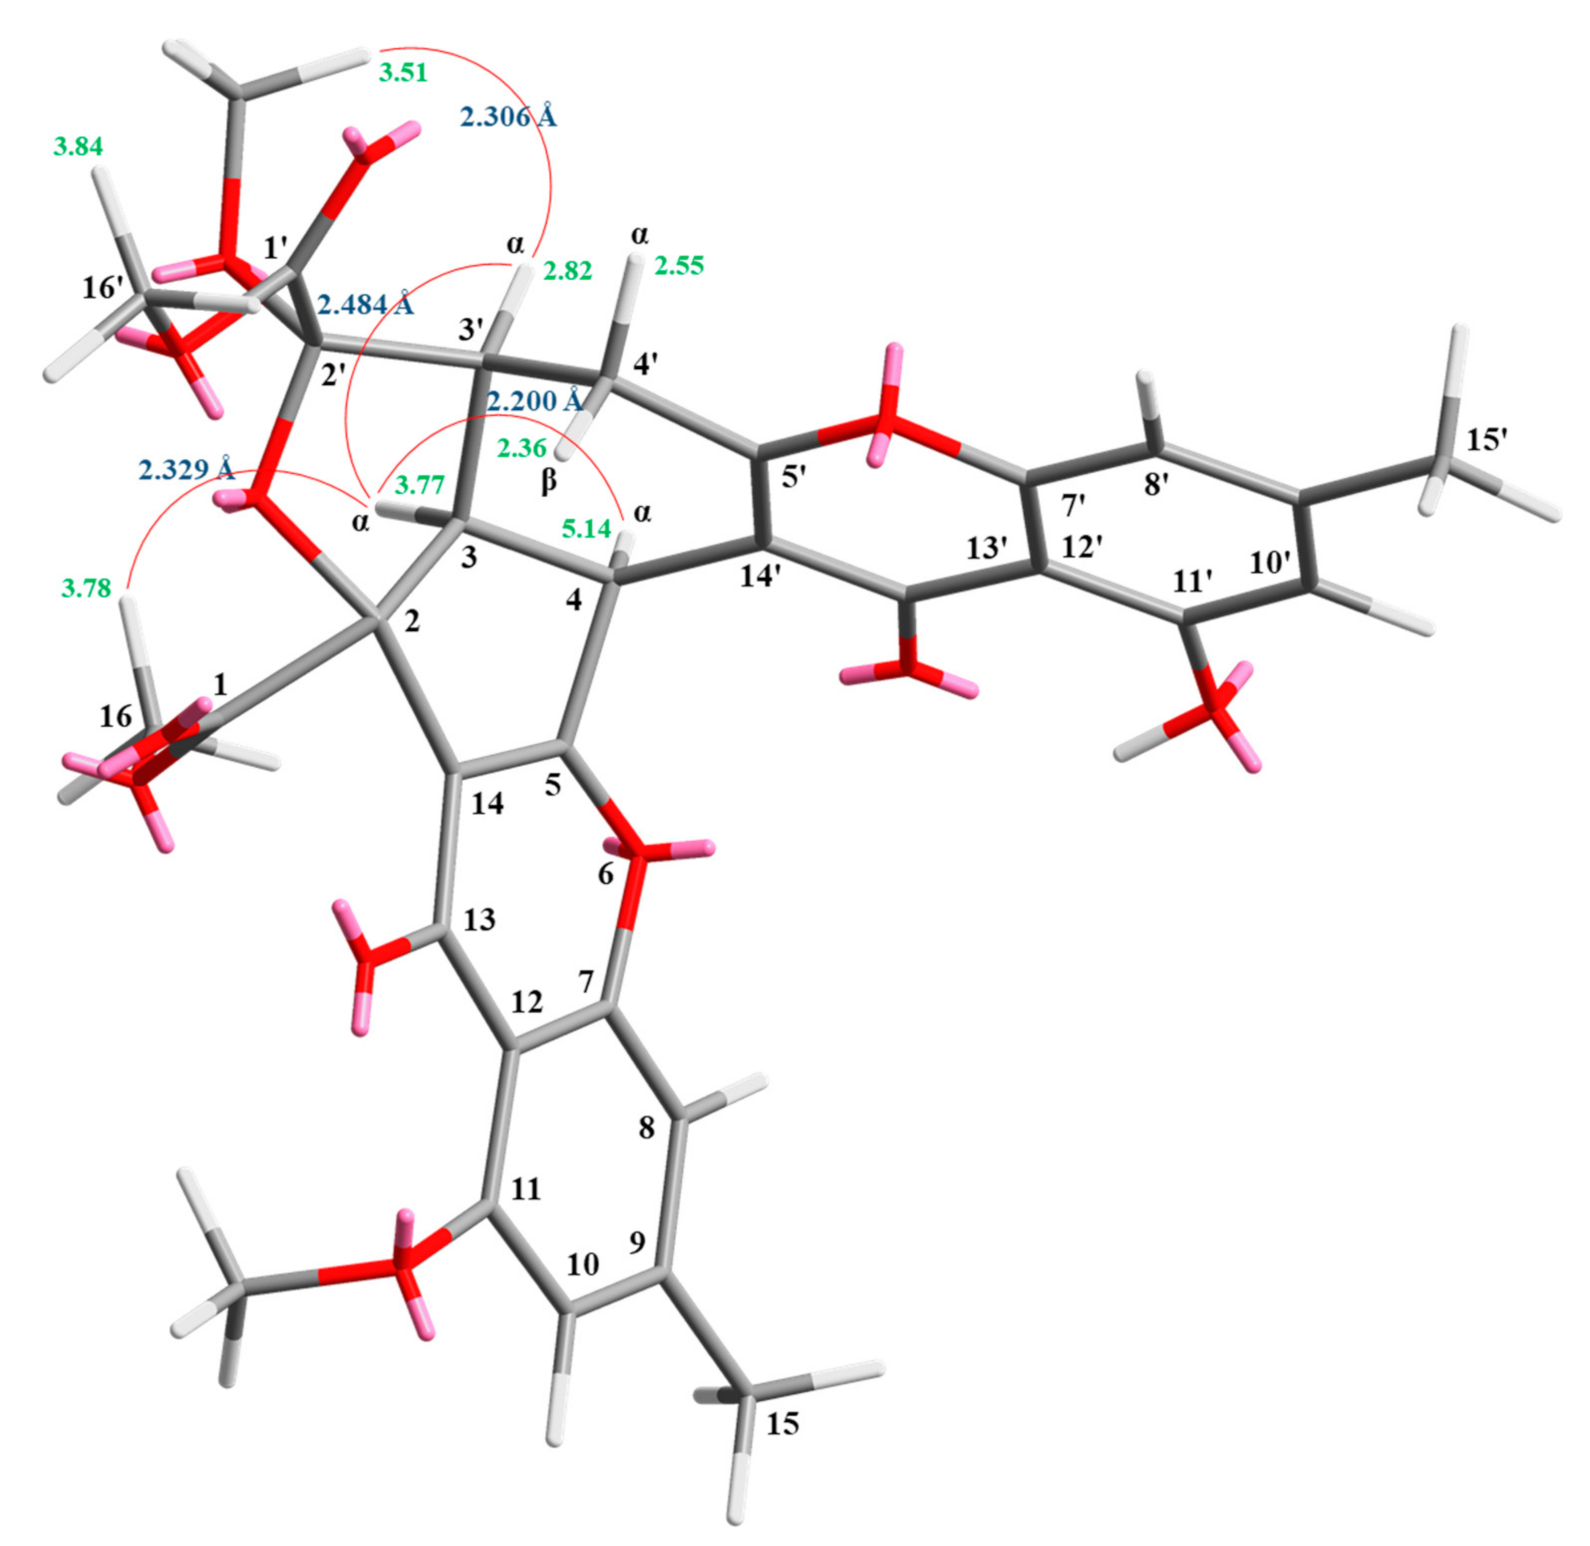
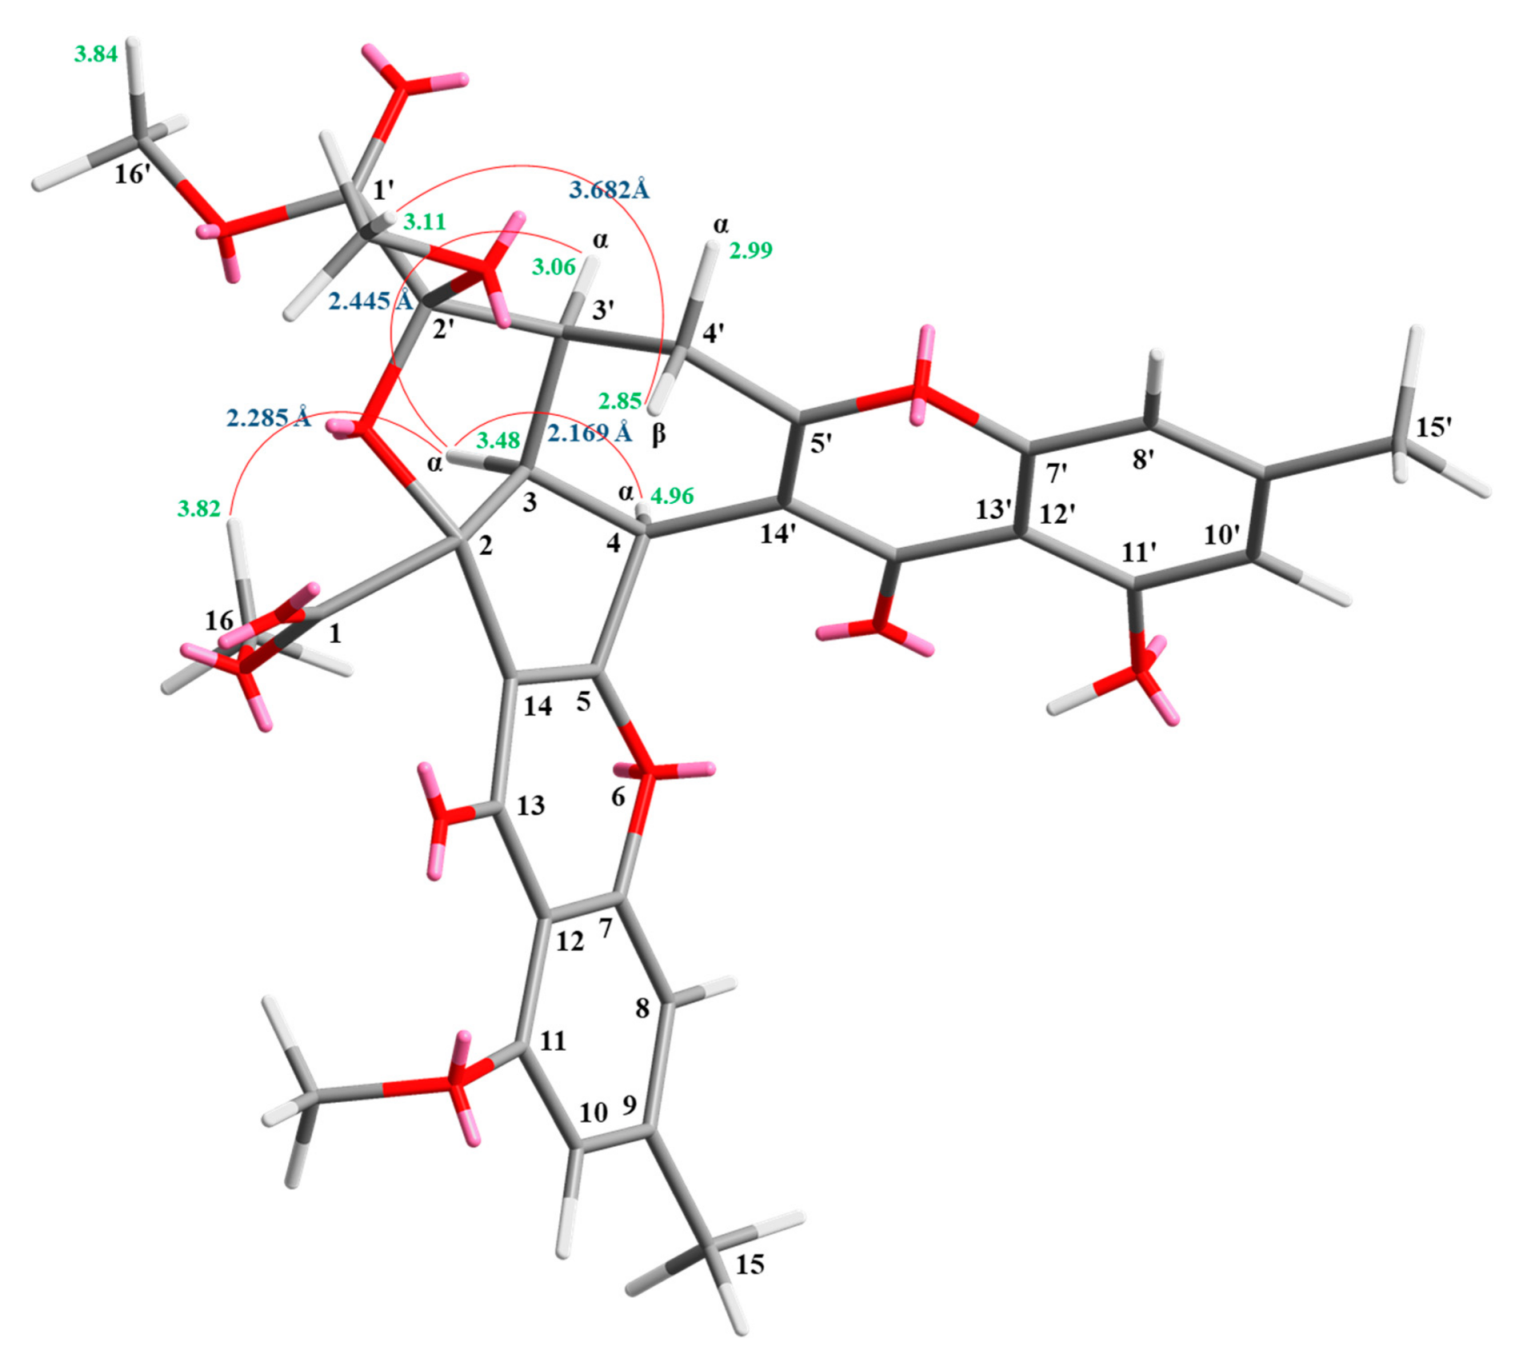
Figure 1. The chemical structures of compounds 17 isolated from Penicillium citrinum.
Marinedrugs 19 00025 g001
Figure 2. Selected ROESY correlations and relative configuration of 1.
Marinedrugs 19 00025 g002
Figure 3. Key ROESY (a) and HMBC (b) correlations of 1.
Marinedrugs 19 00025 g003
Figure 4. Selected ROESY correlations and relative configuration of 2.
Marinedrugs 19 00025 g004
Figure 5. Key ROESY (a) and HMBC (b) correlations of 2.
Marinedrugs 19 00025 g005
Figure 6. Selected ROESY correlations and the relative configuration of 3.
Marinedrugs 19 00025 g006
Figure 7. Key ROESY (a) and HMBC (b) correlations of 3.
Marinedrugs 19 00025 g007
Figure 8. Effect of epiremisporine E (3) on the colony formation of A549 cells. (A) The effect of 3 against A549 cell colony formation. Clonogenicity was evaluated by the monolayer colony formation assay. Representative images show the blue colonies of A549 cells stained with crystal violet. (B) Histogram presentation of A549 cell colony quantification. * p < 0.05; *** p < 0.001 compared with the control. a 5-Fluorouracil (5-FU) was used as a positive control.
Marinedrugs 19 00025 g008
Figure 9. Western blot analysis for Bcl-2 (a), Bax (b), pro-caspase 3 (c), and cleaved-caspase 3 (d) in each group. Treatment with epiremisporine C (3) significantly reduced the expression levels of Bcl-2 and pro-caspase 3, and increased the expression levels of Bax and cleaved-caspase 3. As-terisks indicate significant differences (* p < 0.05, ** p < 0.01, and *** p < 0.001) compared with the control group.
Marinedrugs 19 00025 g009
Figure 10. Western blot analysis for Bcl-2 (a), Bax (b), pro-caspase 3 (c), and cleaved-caspase 3 (d) in each group. Treatment with epiremisporine B (4) significantly reduced the expression levels of Bcl-2 and pro-caspase 3, and increased the expression levels of Bax and cleaved-caspase 3. As-terisks indicate significant differences (* p < 0.05 and ** p < 0.01) compared with the control group.
Marinedrugs 19 00025 g010
Figure 11. Schematic diagram for cancer cell apoptosis mechanism of compounds 3 and 4 in A549 cells.
Marinedrugs 19 00025 g011
Table 1. The correlations between dihedral angles and vicinal coupling constants of compounds 13 and related analogues [16].
CompoundsDihedral AnglesJ3′, 4′α (Hz)Dihedral AnglesJ3′, 4′β (Hz)
(H3′-C3′-C4′-H4′α) (H3′-C3′-C4′-H4′β)
1 (2′R,3′S)50.7°5.3169.8°12.8
2 (2′R,3′S)51.1°5.4170.2°12.7
3 (2′S,3′S)54.8°4.7173.9°8.3
Epiremisporine B (2′R,3′S)53.9°5.9173.5°12.5
Epiremisporine B (2′S,3′S)54.7°6.4173.8°10.1
Epiremisporine B1 (2′R,3′S)54.2°6.6173.8°11.3
Epiremisporine B1 (2′S,3′S)56.0°6.5175.2°10.3
Remisporine B (2′S,3′R)178.8°12.261.0°4.3
Table 2. Inhibitory effects of compounds 17 from Penicillium citrinum on superoxide anion generation by human neutrophils, in response to fMLP.
CompoundsIC50 (μM) a
Epiremisporine C (1)>50
Epiremisporine D (2)6.39 ± 0.40 e
Epiremisporine E (3) 8.28 ± 0.29 d
Epiremisporine B (4)3.62 ± 0.61 e
Penicitrinone A (5)2.67 ± 0.10 e
8-Hydroxy-1-methoxycarbonyl-6-methylxanthone (6)>50
Isoconiochaetone C (7)38.35 ± 0.21 c
Ibuprofen b27.85 ± 3.56 c
a Concentration necessary for 50% inhibition (IC50). b Ibuprofen (a fMLP receptor antagonist) was used as a positive control. Results are presented as average ± SEM (n = 3). Values are expressed as average ± SEM (n = 3). c p < 0.05; d p < 0.01; e p < 0.001 compared with the control.
Table 3. Cytotoxic effects of compounds 17 against A549 and HT-29 cells.
CompoundsIC50 (μM) a
A549 HT-29
Epiremisporine C (1)>100>100
Epiremisporine D (2)>100>100
Epiremisporine E (3)43.82 ± 6.33 c>100
Epiremisporine B (4)32.29 ± 4.83 c 50.88 ± 2.29 c
Penicitrinone A (5) 49.15 ± 6.47>100
8-Hydroxy-1-methoxycarbonyl-6-methylxanthone (6)>100>100
Isoconiochaetone C (7)>100>100
5-FU b12.52 ± 2.02 d 40.92 ± 3.93 d
a The IC50 values were calculated from the slope of dose-response curves (SigmaPlot). Values are expressed as mean ± SEM (n = 3). c p < 0.05; d p < 0.01 compared with the control. b 5-Fluorouracil (5-FU) was used as a positive control.
Table 4. 1H NMR data (500 MHz, CDCl3) for 13.
Position123
δH (J in Hz)
33.87 (dd, 8.9, 8.6)3.77 (dd, 8.7, 8.6)3.48 (dd, 10.5, 8.9)
45.21 (d, 8.9)5.14 (d, 8.9)4.96 (d, 8.9)
86.67 (br s)6.76 (br s)6.81 (br s)
106.62 (br s)6.58 (br s)6.59 (br s)
152.33 (s)2.36 (s)2.38 (s)
163.83 (s)3.78 (s)3.82 (s)
3′2.86 (ddd, 12.8, 8.6, 5.3)2.82 (ddd, 12.7, 8.6, 5.4)3.06 (ddd, 10.5, 8.3, 4.7)
4′α2.58 (dd, 15.6, 5.3)2.55 (dd, 15.5, 5.4)2.99 (dd, 18.6, 4.7)
4′β2.37 (dd, 15.6, 12.8)2.36 (dd, 15.5, 12.7)2.85 (dd, 18.6, 8.3)
8′6.69 (br s)6.69 (br s)6.69 (br s)
10′6.70 (br s)6.69 (br s)6.68 (br s)
15′2.42 (s)2.41 (s)2.42 (s)
16′3.87 (s)3.84 (s)3.84 (s)
11-OH12.11 (br s)--
11-OMe-3.91 (s)3.91 (s)
2′-OMe3.50 (s)3.51 (s)3.11 (s)
11′-OH12.30 (br s)12.36 (s)12.50 (s)
Table 5. 13C NMR data (125 MHz, CDCl3) for 13.
Position123
δC, Type
1170.8, C171.2, C170.5, C
291.2, C91.7, C91.6, C
346.9, CH46.8, CH44.0, CH
436.6, CH36.1, CH37.3, CH
5168.3, C164.7, C166.4, C
7157.2, C159.1, C159.2, C
8108.3, CH110.7, CH110.9, CH
9147.4, C145.2, C145.1, C
10113.1, CH108.4, CH108.3, CH
11160.9, C160.0, C159.9, C
12109.0, C112.9, C112.6, C
13179.0, C173.7, C173.9, C
14118.8, C121.7, C121.2, C
1522.2, CH322.1, CH322.1, CH3
1653.1, CH352.9, CH353.1, CH3
1′166.7, C167.1, C168.5, C
2′111.1, C111.0, C107.6, C
3′48.4, CH48.4, CH43.3, CH
4′27.1, CH227.1, CH225.5, CH2
5′165.5, C165.5, C165.4, C
7′156.0, C156.1, C155.9, C
8′107.6, CH107.5, CH107.3, CH
9′147.7, C147.5, C147.3, C
10′112.7, CH112.6, CH112.2, CH
11′160.5, C160.5, C160.4, C
12′108.5, C108.5, C108.3, C
13′179.7, C179.8, C180.6, C
14′112.8, C113.0, C111.7, C
15′22.4, CH322.4, CH322.4, CH3
16′52.8, CH352.6, CH352.8, CH3
11-OMe-56.3, CH356.4, CH3
2′-OMe52.7, CH352.7, CH352.2, CH3
Sample Availability: Samples of the compounds are available from the authors.
Publisher’s Note: MDPI stays neutral with regard to jurisdictional claims in published maps and institutional affiliations.

