1. introduction
Mental health is an essential state of wellbeing [
1]. In transitional China, which has been undergoing rapid socioeconomic development, the prevalence rate of mental disorders had rapidly increased by approximately 17% in a recent study conducted in four provinces in China [
2,
3]. Many persons with mental disorders also experience disability, which causes long term impairments in personal and social functioning. In 2006, approximately 5.8 million Chinese lived with mental disability, and the national prevalence of mental disability has tripled from 0.2% to 0.6% in 20 years [
4].
Among many determinants of disability, socioeconomic status could be measured by income, education, and employment [
5,
6,
7,
8]. Previous studies reported that income, education and employment had strong correlations with disability [
9]. Poverty, a crucial measurement of socioeconomic status, was also reported having a positive correlation with disability [
9,
10,
11]. However, little evidence has been reported considering the association between scarcity of comprehensive economic possessions and disabilities. In this study, we estimated a diverse range of elements including household assets, income, rurality of residence, and provincial GDP to derive an index of wealth as an indication of wealth status. We aim to investigate the association between wealth index and various types of mental disability, using data from a nationally representative survey [
12].
2. Methods
2.1. Data Source
The second China National Sample Survey on Disability employed a multistage, stratified random cluster sampling scheme, with probability proportional to size, to derive a nationally representative sample. The survey protocol and questions were reviewed by leading national and international experts, and the sampling plan was reviewed by experts from the Division of Statistics of the United Nations [
12]. This survey was conducted from 1 April to 31 May 2006. This national survey aimed to describe the prevalence and causes of different types of disabilities, and to explore the socioeconomic and demographic characteristics of people with disabilities in China. The survey covered all provincial administrative areas in mainland China, excluding Hong Kong, Macau and Chinese Taipei. The final sample size represented 1.9 per 1000 non-institutionalized inhabitants of China in 2006. Survey respondents provided consent to participate to the Chinese government. The survey captured visual disability, hearing disability, physical disability, speech disability, intellectual disability and mental disability [
12]. The total sample size of the second China National Sample Survey on Disability was 2,526,145, including 23,840 visual disability only; 38,370 hearing disability only; 2510 speech disability only; 48,045 physical disability only; 10,844 intellectual disability only; 11,790 mental disability only; 26,080 multiple disability; and 2,364,666 healthy people. The final analysis examined the population aged 15–64 years including 10,095 with mental disability only and 1,714,303 healthy people.
2.2. Ethics
The surveys were approved by the State Council (Guo Ban Fa No. 73 [2004]) and conducted in all province-level administrative regions of mainland China and carried out by the Leading Group of China National Sample Survey on Disability and the National Bureau of Statistics. All survey respondents provided consent to participate in these surveys and clinical diagnosis.
2.3. Data Collection Procedures and Data Quality
Pilot studies were conducted in different provinces before the survey period [
12]. More than 20,000 interviewers and 6000 doctors of various specialties as well as 50,000 survey assistants participated in this survey. Trained field interviewers used a structured interview questionnaire during data collection to inquire about mental disabilities. Subjects, who responded “yes” to any of the corresponding questions, and all children aged 6 years and under, were assigned to different designated physicians for further disability screening and confirmation. Following the guidelines of diagnostic manuals, designated physicians performed the medical examinations, made a final diagnosis of the disability, if any, then assessed its severity and confirmed the primary cause [
12]. Respondents with multiple positive answers were examined by multiple specialists (a separate doctor for each disability). Strict quality control measures were implemented at every step during the survey, from drafting the sample frame to field sampling, from completing the questionnaires to checking the returned forms, and from the data input to checking data quality [
12].
2.4. Identification of People with Mental Disability
Mental disability was defined and classified by the expert committee of the Second China National Sample Survey on Disability, based on the WHO International Classification of Functioning, Disability and Health (WHO-ICF) [
13]. Mental disability was diagnosed by professional psychiatrists according to the International Statistical Classification of Diseases, 10th Revision (ICD-10) and WHO-ICF [
13,
14]. We defined types of mental disability as organic mental disorders; mental disorders due to psychoactive substance use; schizophrenia, schizotypal and delusional disorders; mood disorders; neurotic stress-related and somatoform disorders; behavior syndromes; disorder of adult personality and behavior; epilepsy; others
i.e., undetected types of mental disability. Psychiatrists used the WHODAS II as a scoring tool to assess the severity of the mental disability. Severity of the disability was classified into four categories (mild, moderate, severe and extremely severe) in this study [
15]. All the classifications and grading standards, screening methods, diagnosing methods, and relevant scales of disabilities were pretested in pilot studies, and had good reliability and validity.
2.5. Study Variable Definition
Mental disability was categorized as binary, i.e., yes or no; survey age and age of mental disability onset, duration of mental disability (i.e., difference between age of mental disability onset and survey age), household size (i.e., number of persons per household), house area (i.e., number of house area in meter square), electricity expenditure (i.e., average number of electricity expenditure per month in kilowatt hours) were set as continuous variables. We categorized marital status as never married, divorced/widowed, or married; ethnicity as Han or others; education level as never attended school, primary school, or junior high school and above; current employment status as employed or unemployed; house type as concrete, masonry/timber and mixed, or bamboo, straw, and other; homeownership as owned or other; residential area as urban or rural; gender as male or female; living arrangement as living with others or living alone.
2.6. Wealth Index
We used the principal component analysis to calculate an index of wealth based on an inventory of 10 household assets (
i.e., house area (continuous), house type (bamboo, straw, and other: 2; masonry/timber and mixed: 1; concrete: 0), house ownership (other: 1; owned: 0), household income (continuous), television (yes: 1; no: 0), refrigerator (yes: 1; no: 0), telephone (yes: 1; no: 0), washing machine (yes: 1; no: 0), computer (yes: 1; no: 0), electricity expenditure (continuous), current employment status (employed: 1; unemployed: 0), residential area (urban: 1; rural: 0), gender (male: 1; female:0) and China Statistical Year Book derived
per capita gross regional product (continuous)) [
16]. In the principal component analysis, the factors were rotated by orthogonal transformation (varimax rotation) to maintain uncorrelated factors and greater interpretability. Factor-loading matrix for wealth index is presented in
Table 1.
Table 1.
Factor-loading matrix for e wealth index patterns by principal component analysis.
Table 1.
Factor-loading matrix for e wealth index patterns by principal component analysis.
| Variables | Factor 1 | Factor 2 | Factor 3 |
|---|
| House area | 0.12 | 0.75 | −0.03 |
| House type | −0.57 | −0.08 | 0.10 |
| House ownership | 0.14 | −0.64 | 0.06 |
| Household income | 0.72 | 0.06 | 0.26 |
| Television | 0.49 | 0.29 | −0.22 |
| Refrigerator | 0.79 | −0.004 | −0.007 |
| Washing machine | 0.68 | 0.13 | −0.09 |
| Telephone | 0.56 | 0.28 | −0.16 |
| Computer | 0.66 | −0.13 | 0.26 |
| Electricity expenditure | 0.74 | 0.08 | 0.12 |
| Current employment status | −0.22 | 0.27 | 0.64 |
| Residential area | 0.66 | −0.39 | −0.08 |
| Gender | −0.04 | 0.06 | 0.67 |
| Per capita gross regional product | 0.51 | −0.24 | 0.18 |
| Variance explain (%) | 30.2 | 10.5 | 8.2 |
The first three components have the first eigenvalue of 4.23 capturing fully 30.2% of the variance, the second eigenvalue of 1.47 capturing fully 10.5% of the variance, the third eigenvalue of 1.15 capturing fully 8.2% of the variance, respectively. Therefore, the first component is used since it is the one that captures the largest amount of information common to all the items. Weights are determined by factor scores derived from the first principal component. We further categorized the derived wealth index into quintile categories. In this study, the lowest quintile of wealth index presented the poorest status of wealth and the highest quintile of wealth index presented the richest status of wealth.
2.7. Statistical Analysis
The trend of the association was assessed with ordinal scores assigned to the quintile categories of the wealth index. Linear regression analysis was used for continuous variables and the Mantel-Haenszel chi-square test was used for categorical variables. The logistic regression analysis was used to estimate the odds ratio (OR) and 95% confidence interval (CI) of wealth index category in association with mental disability. Confounding variables were included as covariates, including survey age, gender, residential area, marital status, ethnicity, education level, current employment status, household size, house type, homeownership and living arrangement. Statistical significance was set at a two-tailed p value of <0.05. The statistical analyses were performed using SAS v. 9.2 (SAS Institute, Inc., Cary, NC, USA).
3. Results
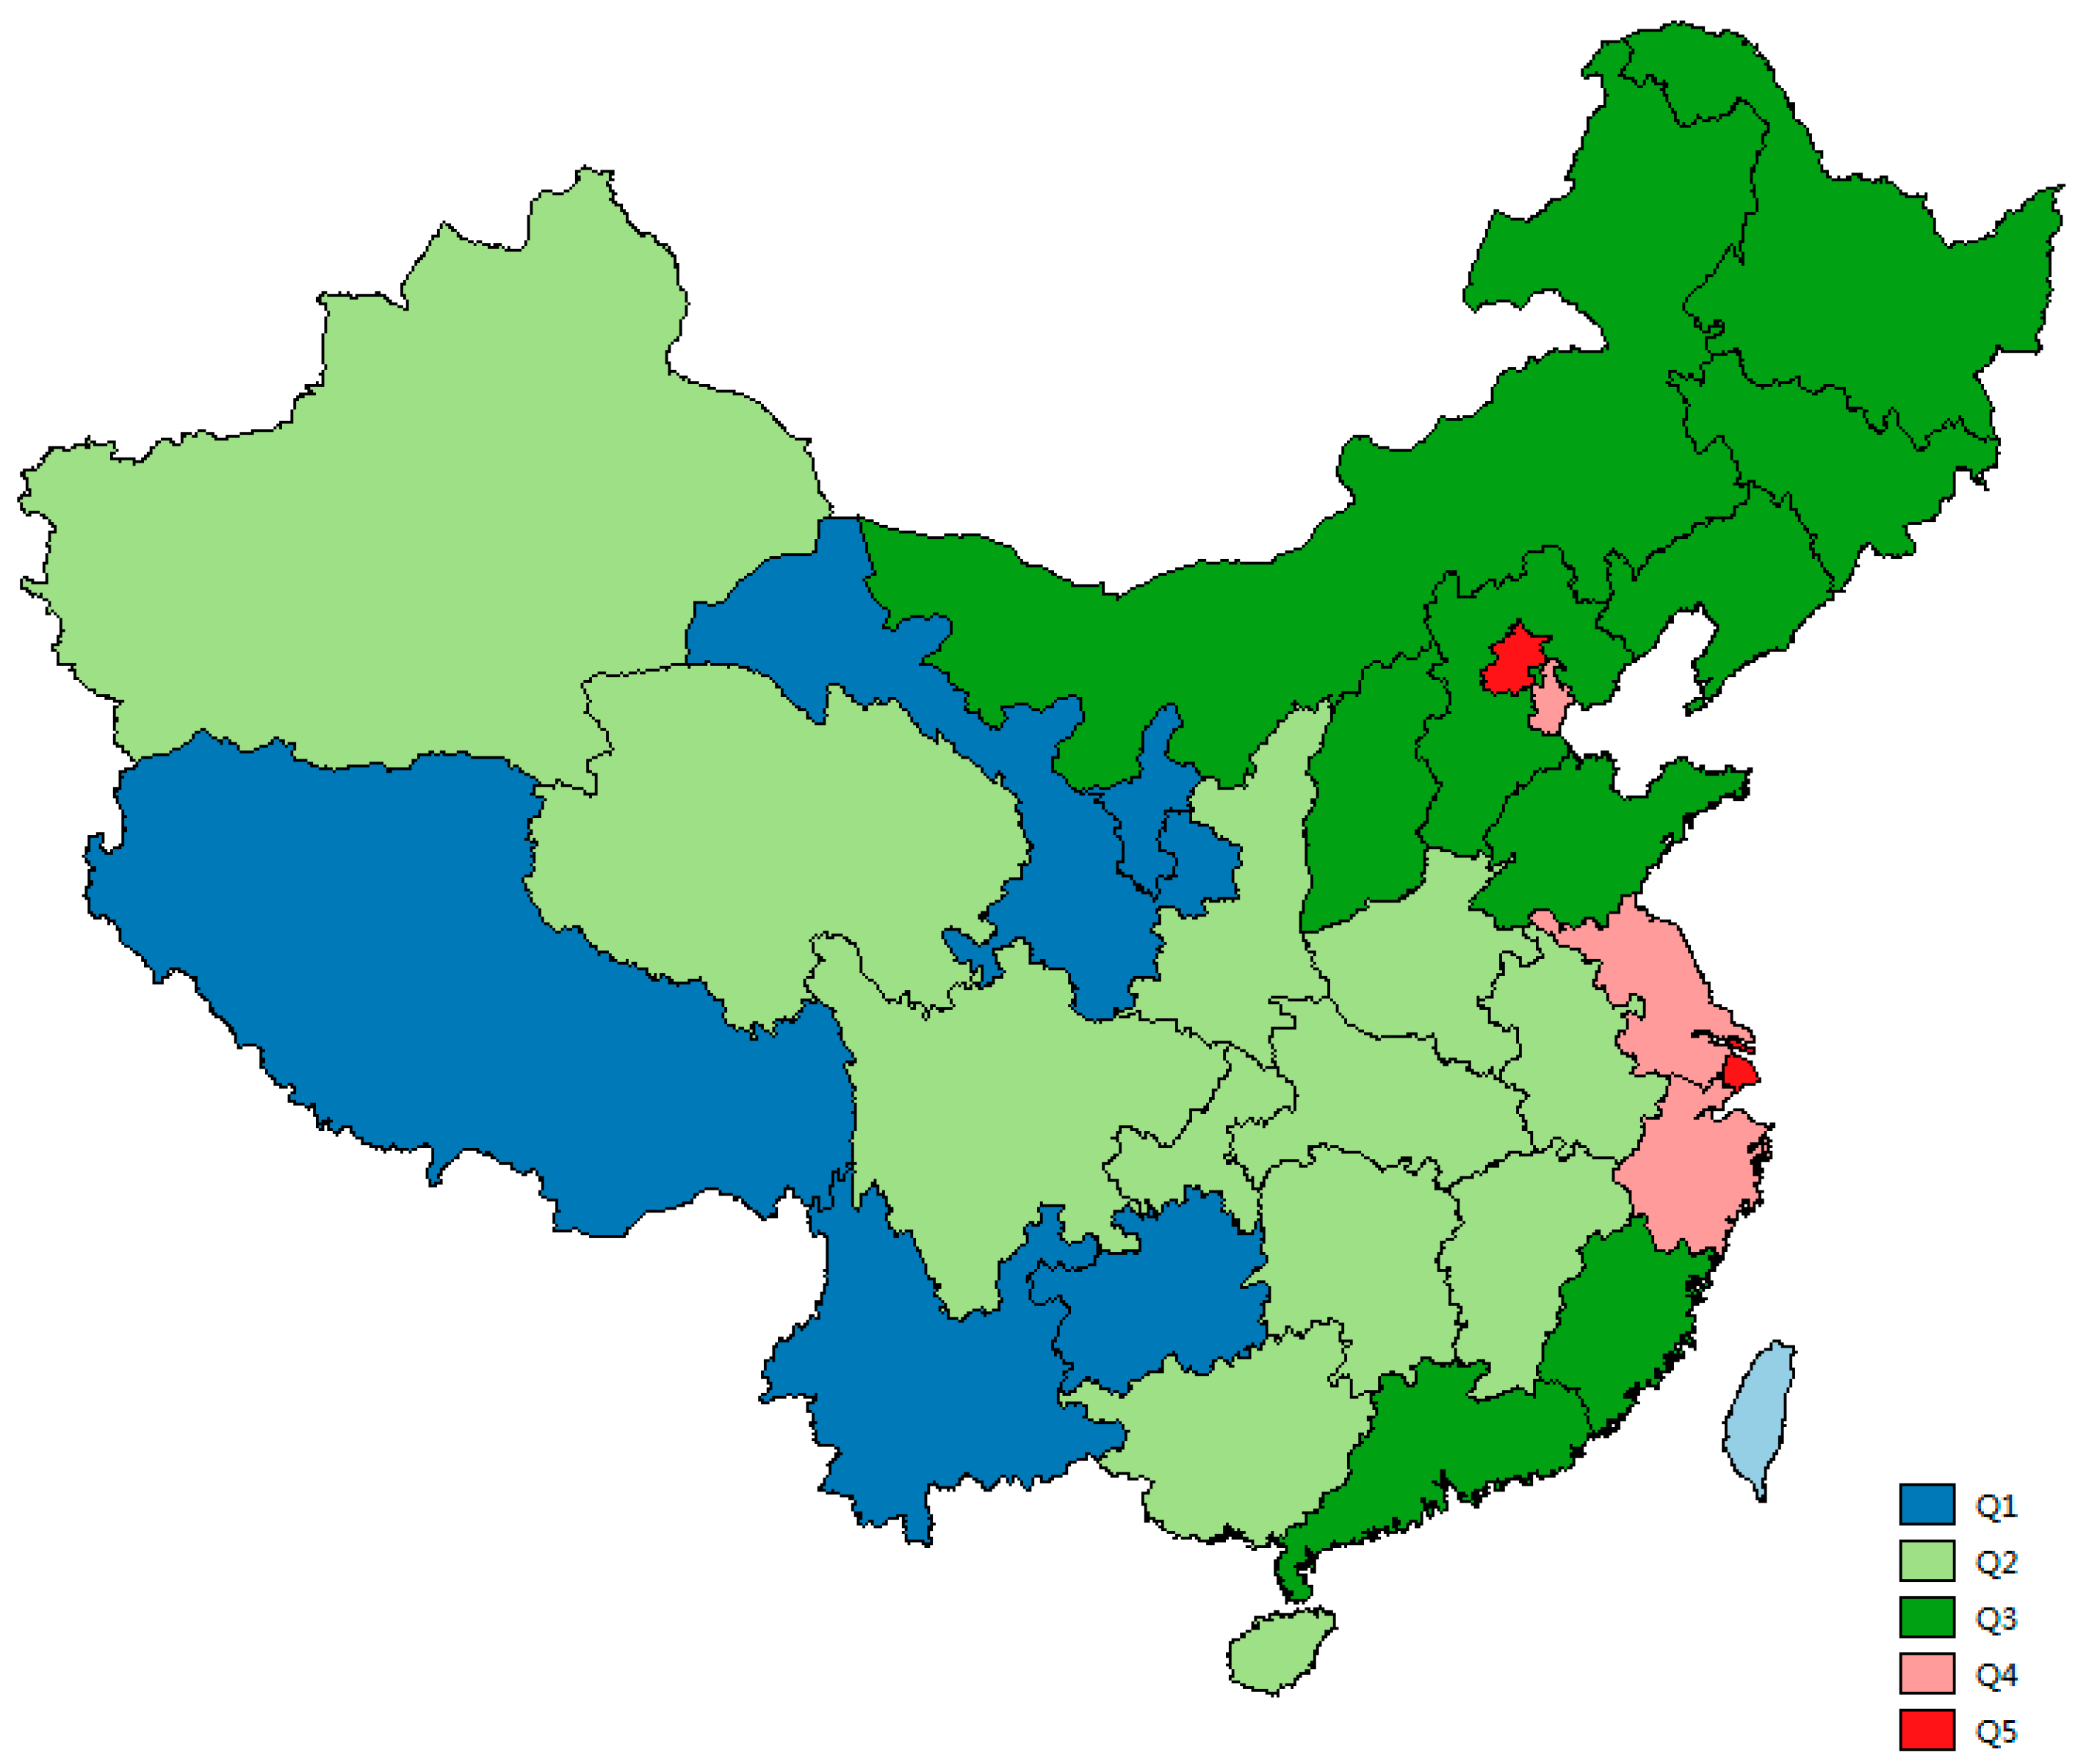
Wealth and mental disability are unequally distributed in China (
Figure 1 and
Figure 2). Selected characteristics of the study population are summarized in
Table 2 and
Table 3.
Figure 1.
Distribution of wealth index quintiles in China (60% of population live in or above).
Figure 1.
Distribution of wealth index quintiles in China (60% of population live in or above).
Figure 2.
Quartile prevalence of mental disability in China (per 100 persons).
Figure 2.
Quartile prevalence of mental disability in China (per 100 persons).
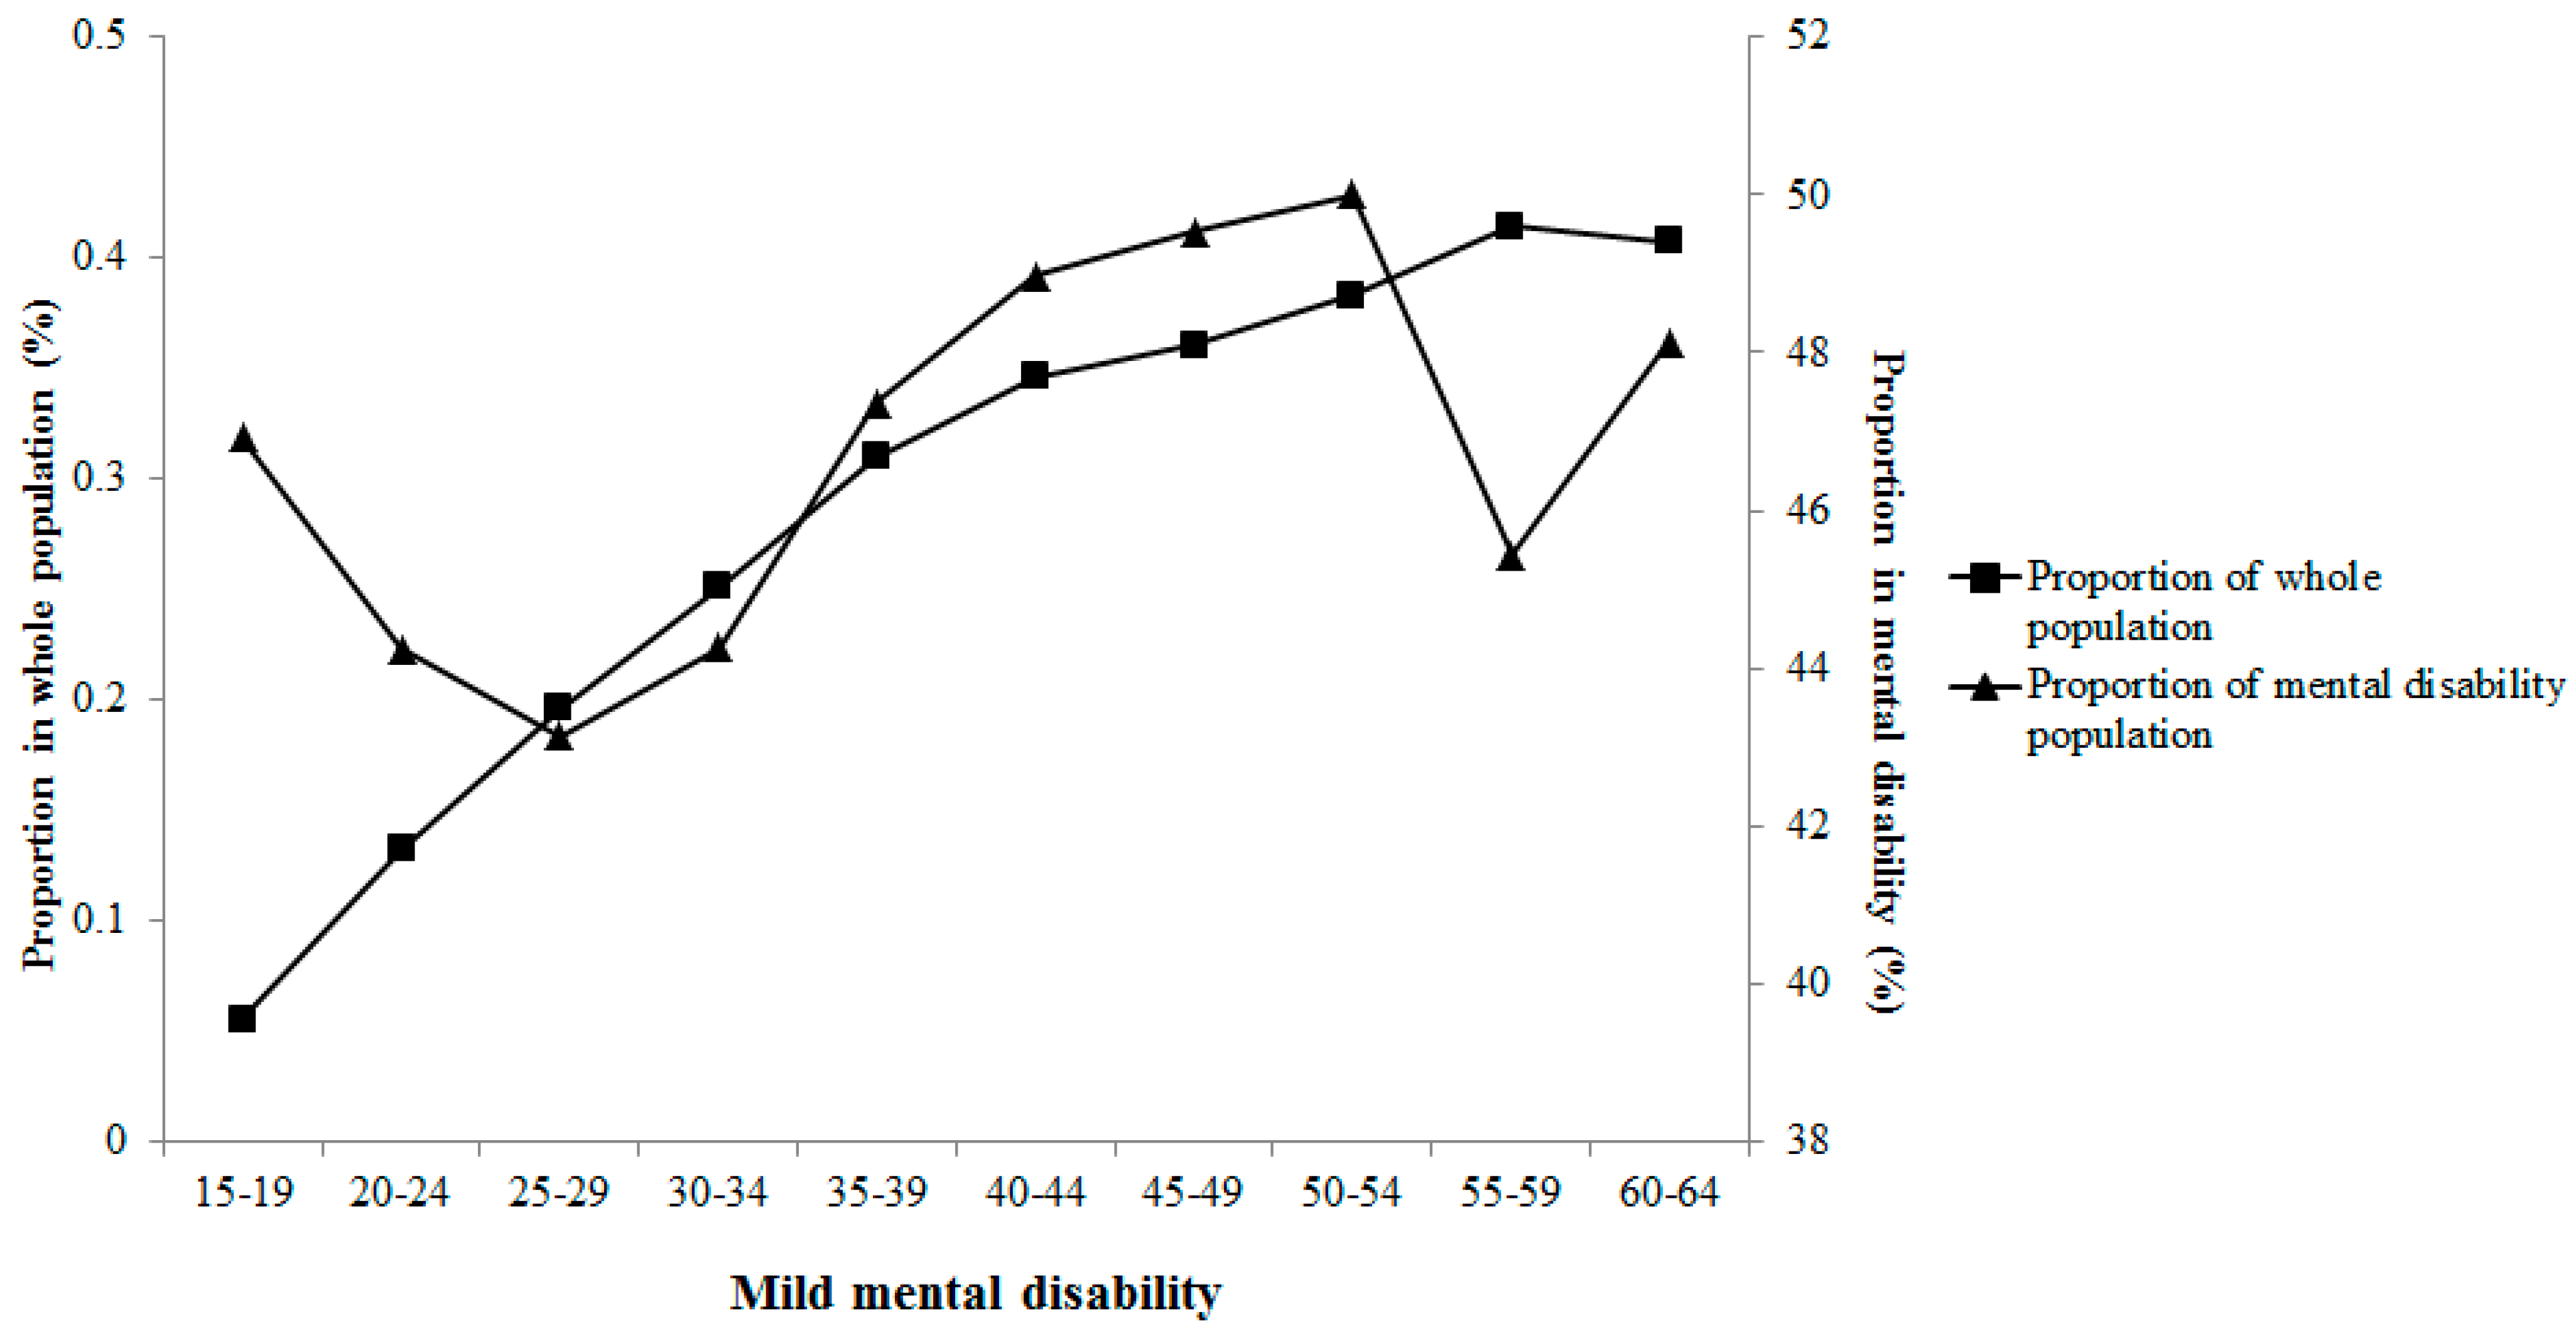
The main mental disability (approximately 60%) was caused by schizophrenia. Moreover, mild mental disability accounted for 47% among persons with mental disability. In the current study, the average survey age of the subjects, onset age of mental disability and education years positively increased with wealth index category, whereas duration of mental disabilities was inversely associated with wealth index category. Severities of mental disability presents varied correlations with survey age in
Figure 3,
Figure 4,
Figure 5 and
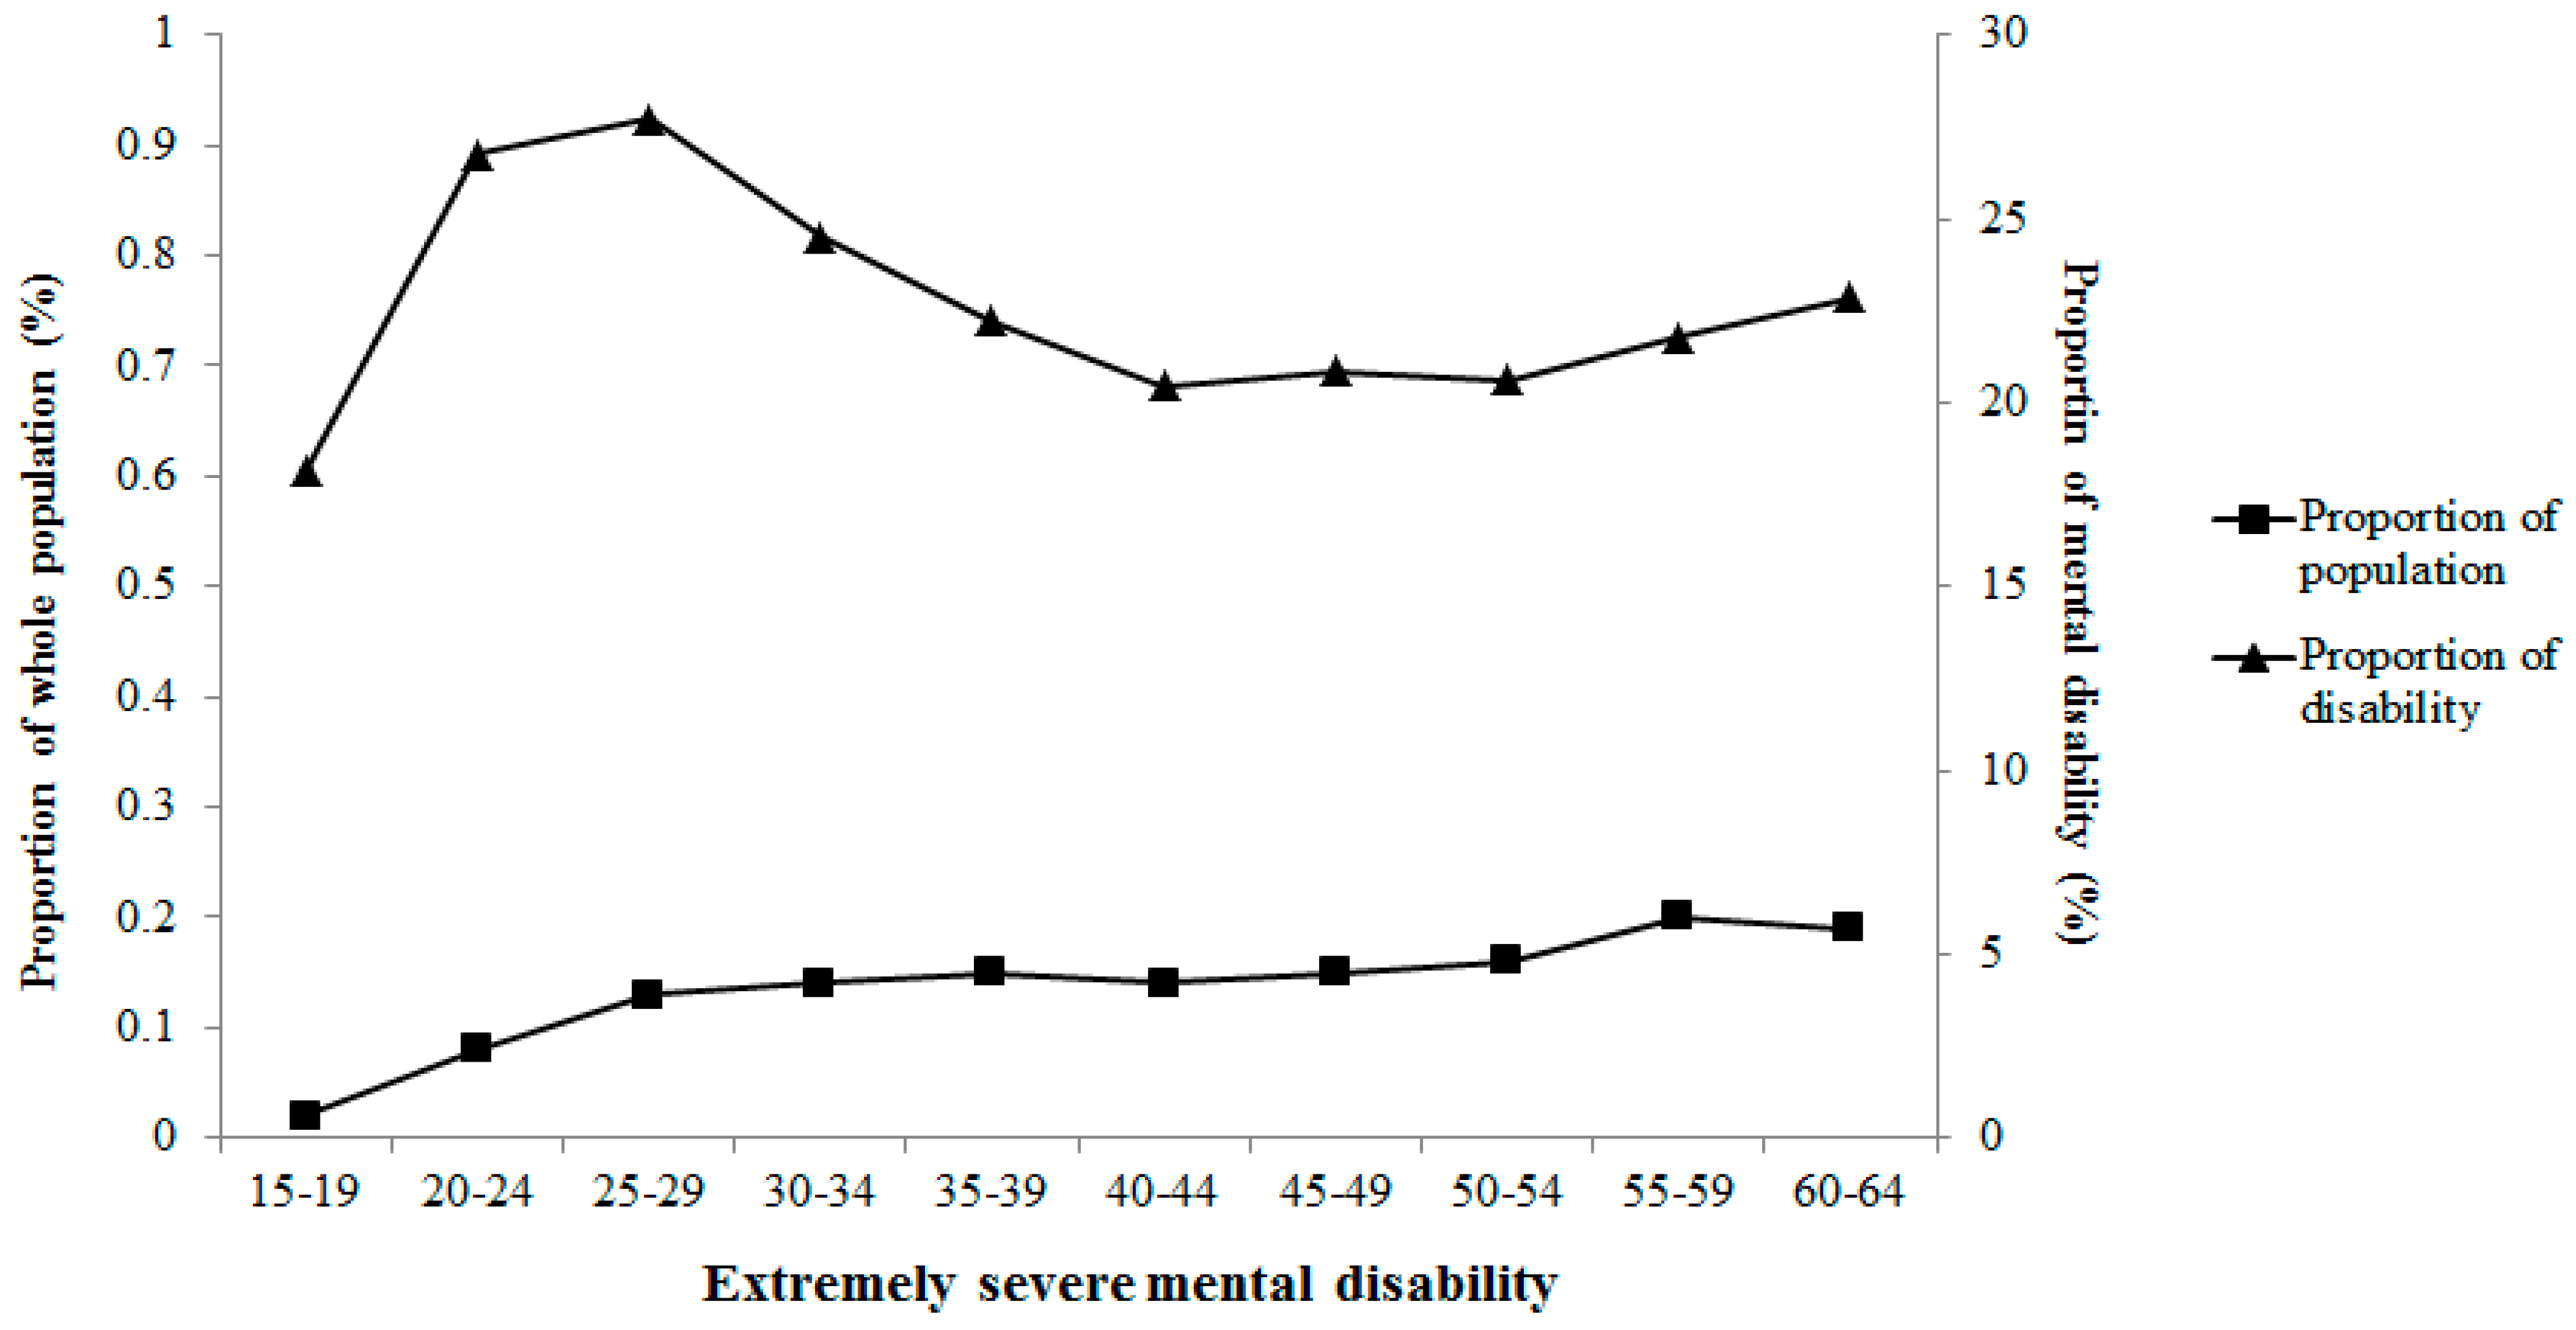
Figure 6. Severe and extremely severe mental disability presented positive association with survey age, but other severities of mental disability did not show similar associations with survey age.
Table 2.
Sample size of study population by age groups.
Table 2.
Sample size of study population by age groups.
| Mental Disability Severities, n | Total Population, n |
|---|
| Mild | Moderate | Severe | Extremely Severe | Total, n |
|---|
| 15–19 | 114 | 51 | 34 | 44 | 243 | 206,371 |
| 20–24 | 192 | 75 | 51 | 116 | 434 | 145,163 |
| 25–29 | 302 | 106 | 98 | 194 | 700 | 154,211 |
| 30–34 | 502 | 196 | 158 | 278 | 1134 | 200,582 |
| 35–39 | 716 | 258 | 202 | 336 | 1512 | 231,740 |
| 40–44 | 759 | 263 | 211 | 317 | 1550 | 219,952 |
| 45–49 | 585 | 194 | 156 | 246 | 1181 | 162,815 |
| 50–54 | 691 | 220 | 186 | 285 | 1382 | 181,013 |
| 55–59 | 538 | 216 | 172 | 258 | 1184 | 130,528 |
| 60–64 | 373 | 120 | 105 | 177 | 775 | 92,023 |
| Total | 4772 | 1699 | 1373 | 2251 | 10,095 | 1,724,398 |
Table 3.
Socioeconomic characteristics of the Chinese population by wealth index quintiles a.
Table 3.
Socioeconomic characteristics of the Chinese population by wealth index quintiles a.
| Variable | Wealth Index | p trend |
|---|
| Q1 (Lowest) | Q2 | Q3 | Q4 | Q5 (Highest) |
|---|
| Sample size of total population, n | 344,880 | 344,880 | 344,879 | 344,880 | 344,879 | |
| Sample size of mental disability, n | 4017 | 2208 | 1618 | 1274 | 978 | |
| Age of mental disability onset, mean (years) | 27.9 | 28.4 | 29.1 | 30.0 | 32.0 | <0.01 |
| Duration of mental disability, mean (years) | 14.9 | 13.8 | 13.6 | 13.4 | 12.7 | <0.01 |
| Male, % | 53.8 | 50.7 | 49.3 | 48.9 | 47.4 | <0.01 |
| Marital status, % | | | | | | |
| Never married | 22.3 | 20.6 | 20.5 | 17.7 | 19.3 | <0.01 |
| Divorced/widowed | 5.2 | 3.1 | 2.7 | 3.1 | 2.8 | <0.01 |
| Married | 72.5 | 76.3 | 76.8 | 79.2 | 77.9 | <0.01 |
| Urban, % | 2.6 | 9.0 | 23.0 | 53.8 | 88.4 | <0.01 |
| Han ethnicity, % | 75.4 | 88.6 | 92.4 | 93.4 | 94.5 | <0.01 |
| Education, % | | | | | | |
| Never attended school | 19.8 | 10.8 | 7.4 | 4.5 | 1.6 | <0.01 |
| Primary school | 41.8 | 34.6 | 27.5 | 19.1 | 8.3 | <0.01 |
| High school and above | 38.4 | 54.7 | 65.1 | 76.5 | 90.1 | <0.01 |
| House type | | | | | | |
| Bamboo, straw, and other | 44.2 | 17.4 | 6.5 | 2.1 | 0.3 | <0.01 |
| Masonry/timber and mixed | 54.9 | 79.4 | 85.7 | 85.9 | 74.7 | <0.01 |
| concrete | 0.8 | 3.2 | 7.9 | 12.0 | 25.1 | <0.01 |
| Homeownership owned, % | 97.3 | 94.1 | 89.7 | 85.5 | 82.1 | <0.01 |
| Living with others, % | 96.8 | 98.3 | 98.5 | 98.3 | 98.5 | <0.01 |
| Employed, % | 88.1 | 84.2 | 78.5 | 70.2 | 61.1 | <0.01 |
| Last year income, mean (Yuan) | 6092 | 9488 | 12753 | 17256 | 34373 | <0.01 |
Figure 3.
Proportion of mild mental disability in different age groups.
Figure 3.
Proportion of mild mental disability in different age groups.
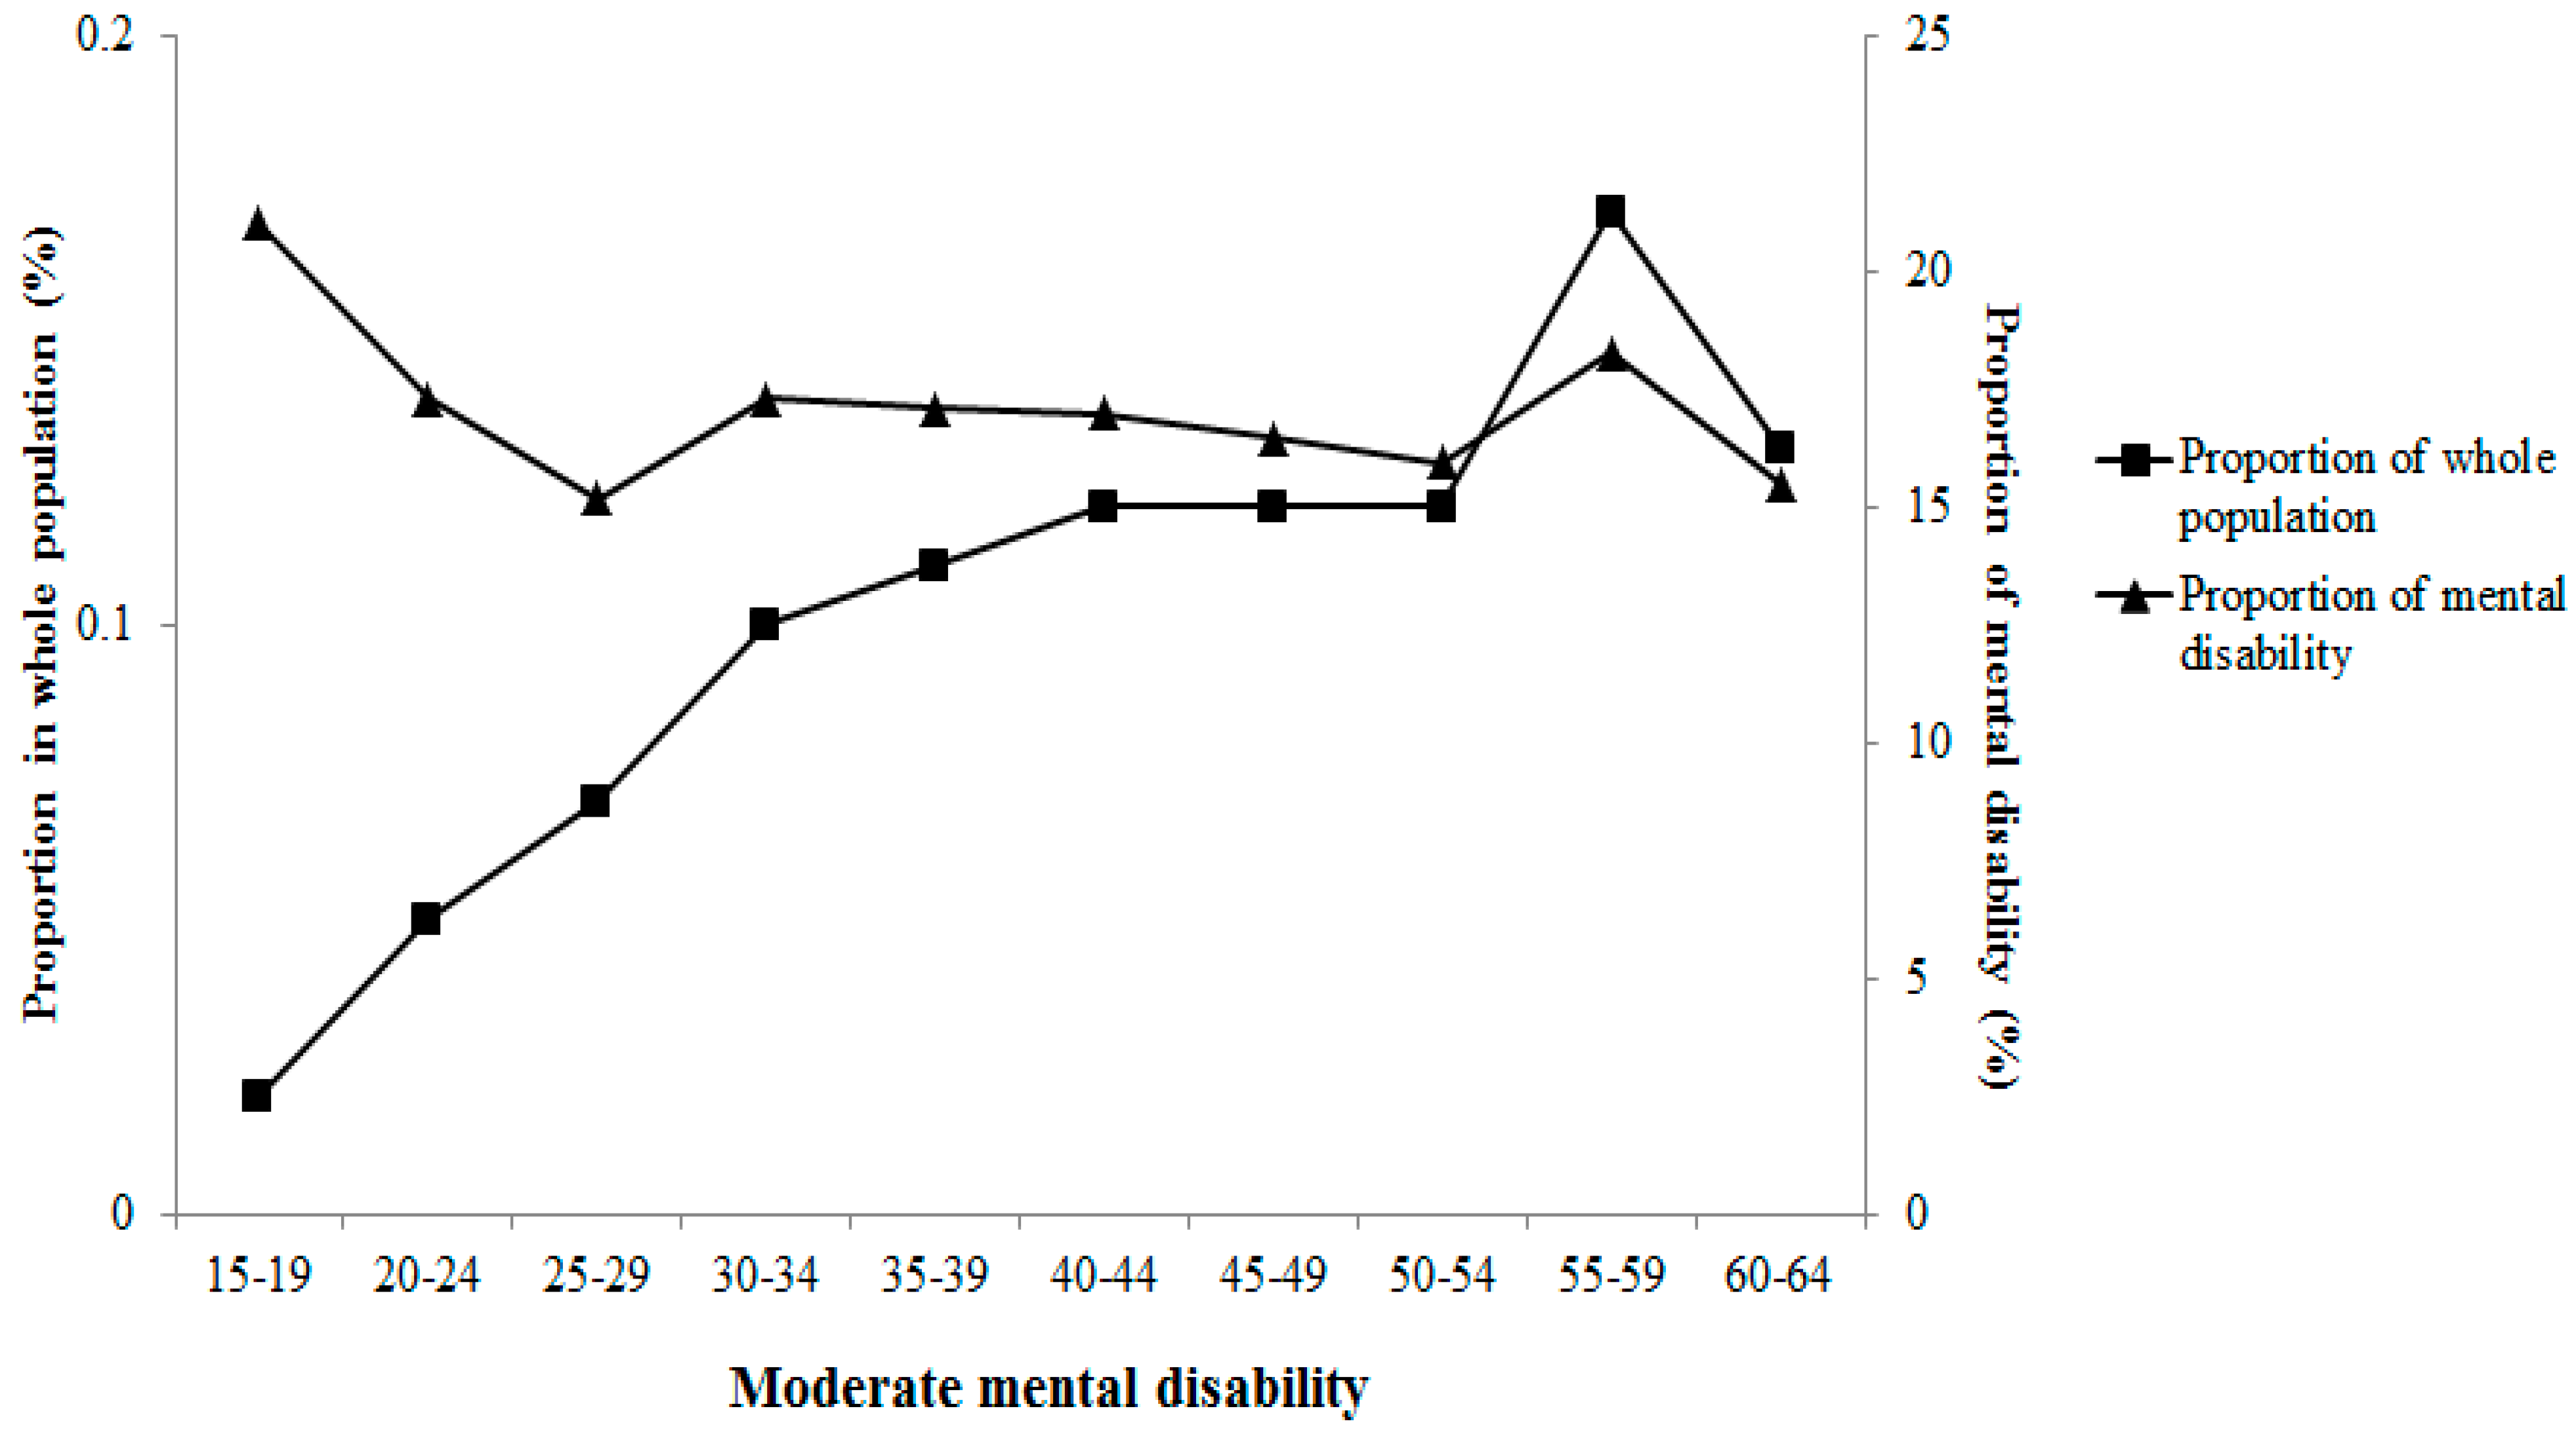
Figure 4.
Proportion of moderate mental disability in different age groups.
Figure 4.
Proportion of moderate mental disability in different age groups.
Figure 5.
Proportion of severe mental disability in different age groups.
Figure 5.
Proportion of severe mental disability in different age groups.
Figure 6.
Proportion of extremely severe mental disability in different age groups.
Figure 6.
Proportion of extremely severe mental disability in different age groups.
The characteristics of the mental disability population in this study are summarized by different types and severities across wealth index category in
Table 4 and
Table 5. Various types of mental disability presented different associations with wealth index. For example, schizophrenia, schizotypal and delusional disorders, and epilepsy were negatively associated with wealth index, but other types of mental disability were positively associated with the wealth index category. Although disorders of adult personality and behavior also exhibited a positive association with wealth index category, this association was not statistically significant. Moreover, mild mental disability was positively associated with the wealth index category, whereas extremely severe mental disability exhibited an inverse association.
Table 4.
Characteristics of different types of mental disability by wealth index quintiles a.
Table 4.
Characteristics of different types of mental disability by wealth index quintiles a.
| Variable | Wealth Index | p trend |
|---|
| Q1 (Lowest) | Q2 | Q3 | Q4 | Q5 (Highest) |
|---|
| Types of mental disability | | | | | | |
| Organic mental disorders, n | 227 | 121 | 98 | 90 | 48 | |
| Age of mental disability onset, mean (years) | 25.8 | 28.8 | 31.1 | 34.8 | 35.0 | <0.01 |
| Duration of mental disability, mean (years) | 16.4 | 14.7 | 13.6 | 12.7 | 12.9 | 0.01 |
| Mental disorders due to psychoactive substance use, n | 96 | 63 | 54 | 46 | 33 | |
| Age of mental disability onset, mean (years) | 35.8 | 37.8 | 33.9 | 35.4 | 40.2 | 0.42 |
| Duration of mental disability, mean (years) | 12.7 | 12.1 | 12.9 | 12.9 | 9.5 | 0.36 |
| Schizophrenia, schizotypal and delusional disorders, n | 2731 | 1460 | 1016 | 796 | 660 | |
| Age of mental disability onset, mean (years) | 28.2 | 28.1 | 28.3 | 29.0 | 30.6 | <0.01 |
| Duration of mental disability, mean (years) | 14.5 | 13.5 | 14.0 | 13.9 | 13.4 | 0.01 |
| Mood disorders, n | 187 | 153 | 124 | 101 | 107 | |
| Age of mental disability onset, mean (years) | 32.1 | 34.1 | 35.3 | 37.3 | 38.4 | <0.01 |
| Duration of mental disability, mean (years) | 12.3 | 11.4 | 9.6 | 8.5 | 8.7 | <0.01 |
| Neurotic stress-related and somatoform disorders, n | 194 | 128 | 107 | 91 | 65 | |
| Age of mental disability onset, mean (years) | 34.5 | 36.3 | 36.9 | 36.9 | 38.4 | 0.01 |
| Duration of mental disability, mean (years) | 11.9 | 11.3 | 9.6 | 9.9 | 9.3 | 0.01 |
| Behavior syndromes, n | 20 | 12 | 14 | 9 | 8 | |
| Age of mental disability onset, mean (years) | 29.4 | 29.6 | 41.4 | 43.9 | 33.3 | 0.04 |
| Duration of mental disability, mean (years) | 13.5 | 16.5 | 6.3 | 8.7 | 10.1 | 0.08 |
| Disorder of adult personality and behavior, n | 48 | 15 | 5 | 12 | 11 | |
| Age of mental disability onset, mean (years) | 24.9 | 21.5 | 19.4 | 19.3 | 23.1 | 0.34 |
| Duration of mental disability, mean (years) | 17.9 | 19.8 | 16.2 | 12.9 | 13.1 | 0.12 |
| Epilepsy, n | 371 | 194 | 150 | 101 | 41 | |
| Age of mental disability onset, mean (years) | 20.0 | 19.3 | 20.5 | 19.5 | 19.3 | 0.88 |
| Duration of mental disability, mean (years) | 19.6 | 17.8 | 17.9 | 18.0 | 19.7 | 0.27 |
| Others, n | 143 | 62 | 50 | 28 | 5 | |
| Age of mental disability onset, mean (years) | 28.6 | 23.9 | 28.2 | 22.2 | 36.2 | 0.33 |
| Duration of mental disability, mean (years) | 15.5 | 19.0 | 14.5 | 15.2 | 5.6 | 0.39 |
Table 5.
Characteristics of different severities of mental disability by wealth index quintiles a.
Table 5.
Characteristics of different severities of mental disability by wealth index quintiles a.
| Variable | Wealth Index | p trend |
|---|
| Q1 (Lowest) | Q2 | Q3 | Q4 | Q5 (Highest) |
|---|
| Mild, n | 1782 | 1033 | 816 | 630 | 511 | |
| Age of mental disability onset, mean (years) | 29.4 | 30.0 | 30.5 | 31.7 | 33.4 | <0.01 |
| Duration of mental disability, mean (years) | 12.8 | 12.8 | 12.3 | 11.8 | 11.4 | <0.01 |
| Moderate, n | 652 | 383 | 272 | 199 | 193 | |
| Age of mental disability onset, mean (years) | 27.7 | 28.4 | 27.7 | 29.2 | 31.1 | 0.002 |
| Duration of mental disability, mean (years) | 14.8 | 14.1 | 13.9 | 13.8 | 14.6 | 0.37 |
| Severe, n | 582 | 259 | 215 | 186 | 131 | |
| Age of mental disability onset, mean (years) | 27.4 | 28.1 | 29.8 | 28.3 | 30.1 | 0.01 |
| Duration of mental disability, mean (years) | 15.7 | 14.2 | 14.1 | 14.9 | 13.1 | 0.02 |
| Extremely severe, n | 1001 | 533 | 315 | 259 | 143 | |
| Age of mental disability onset, mean (years) | 25.8 | 25.5 | 26.1 | 27.7 | 30.0 | <0.01 |
| Duration of mental disability, mean (years) | 16.4 | 16.1 | 16.3 | 15.9 | 14.2 | 0.08 |
Table 6.
Associations of wealth index and mental disability among the Chinese population.
Table 6.
Associations of wealth index and mental disability among the Chinese population.
| Regression Models | Wealth Index | OR (95% CI) |
|---|
| Model 1 a | Q1 (lowest) | 1.00 (reference) |
| Q2 | 0.53 (0.51–0.56) |
| Q3 | 0.36 (0.34–0.39) |
| Q4 | 0.23 (0.22–0.25) |
| Q5 (highest) | 0.15 (0.13–0.16) |
| p trend | <0.01 |
| Model 2 b | Q1 (lowest) | 1.00 (reference) |
| Q2 | 0.53 (0.50–0.56) |
| Q3 | 0.34 (0.31–0.36) |
| Q4 | 0.21 (0.19–0.22) |
| Q5 (highest) | 0.13 (0.12–0.14) |
| p trend | <0.01 |
The association between mental disability and wealth index category is presented in
Table 6. Wealth index was negatively associated with the odds ratio of mental disability. Although it showed a significant trend of an inverse association with mental disability, it more obviously decreased the OR of mental disability in the highest quintile of wealth index compared with those at the lowest quintile.
4. Discussion
In the present study, the average household income was approximately $2-per-day in the lowest wealth index quintile of the whole study population. Although it was slightly higher than $1.25-per-day line or $1.50-per-day line [
17,
18], it could represent the poorest people in China. As several epidemiological studies have suggested, there was an increasing risk of mental disability associated with poverty [
10,
11]. We observed that disadvantaged wealth status was associated with an increased odds ratio of living with mental disability among the Chinese population. Our results also indicated that there was a decreasing trend in mental disability, which suggested that high wealth status was a protective factor for mental disability. Therefore, wealth appeared in this study as a socioeconomic determinant of mental disability among the Chinese population.
Moreover, living in low socioeconomic position could elevate the risk of disability, whereas having a disability could elevate the risk of living in low wealth status [
10]. Our study found that extremely severe mental disability was inversely associated with wealth. This result may be due, in part, to the mutually causal nature of low wealth status and mental disability, which is consistent with previous studies [
10,
11]. Because people who were economically disadvantaged suffered from malnutrition and a lack of adequate access to health services, including maternal care and trauma services [
19], they were more likely to suffer from disabilities, which further enhanced their exclusion and marginalization by reducing their opportunities to contribute productively to their households and communities, which in turn increased their risk of the lowest income [
19]. Interestingly, we also observed that mild mental disability was positively associated with wealth. This interesting and unique result may be due, in part, to the fact that China is one of the most populous and dynamic societies in the world, the accompanying pressure contributing to more mental health problems in healthy people.
Additionally, schizophrenia accounted for the majority of mental disability cases in the current study. The lowest income and lower social class have long been linked to higher rates of schizophrenia [
20]. We observed consistent associations between wealth and schizophrenia-caused disability. However, we also observed that wealth was positively associated with mental disability caused by various conditions such as organic mental disorders, mental disorders due to psychoactive substance use,
etc, other than schizophrenia and epilepsy. These findings imply that wealth might have differentiated effects on mental disability caused by different conditions.
Considering wealth is a complex economical factor, there are multiple measures of wealth based on income or socioeconomic factors. In the study reported here, we tried to combine all collected economic information to evaluate wealth by using principal components analysis, because principal components analysis provided plausible and defensible weights for an index of assets to serve as a proxy for wealth as a previous study suggested [
16]. Furthermore, the current wealth index was developed by using household asset variables, income, expenditure data, and other possible or determining variables related with wealth income disparities in China [
21,
22], unlike previous studies which only used household asset variables without income or expenditure data to estimate wealth [
16]. Therefore, the current wealth index could sufficiently and accurately present the economic status in China. Moreover, the current lowest wealth index category was slightly different from poverty, but it was much more useful and valuable than poverty because it included comprehensive economic information, unlike poverty, which only depends on income.
A limitation of this study is its cross-sectional study design, which cannot provide indisputable information on the relationships between wealth and mental disability. Additionally, the wealth index’s variables were selected based on unique Chinese characteristics and previous researches that should be noted for further studies. Major strengths of the current study are the large sample size and the representativeness of the sample, which covered all the provincial administrative areas in mainland China. In addition, every subject in the selected households was interviewed face to face at data collection. Although the present study has some weaknesses, standardized quality control schemes were in place during the field implementation, such as training of the interviewers and crosschecking returned surveys by contacting survey participants, which resulted in little response bias.


