Article

Prevalence of Antimicrobial Resistant and Virulent Salmonella spp. in Treated Effluent and Receiving Aquatic Milieu of Wastewater Treatment Plants in Durban, South Africa

by
Ejovwokoghene C. Odjadjare
and
Ademola O. Olaniran
*
Discipline of Microbiology, School of Life Sciences, College of Agriculture, Engineering and Science, University of KwaZulu-Natal, Westville Campus, Private Bag X54001, Durban 4000, South Africa
*
Author to whom correspondence should be addressed.
Int. J. Environ. Res. Public Health 2015, 12(8), 9692-9713; https://0-doi-org.brum.beds.ac.uk/10.3390/ijerph120809692
Submission received: 12 June 2015 / Revised: 17 July 2015 / Accepted: 12 August 2015 / Published: 18 August 2015

Abstract

:
In this study, we evaluated the impact of treated wastewater effluent from two wastewater treatment plants on the physicochemical parameters and Salmonella spp. load of receiving rivers. Presumptive Salmonella spp. were obtained at all sampled points including the discharge points, with counts ranging from 0 to 4.14 log cfu/mL at both plants. Turbidity, chemical and biological oxygen demand were found to be high and mostly above the required limit for treated wastewater discharge. However, recorded nitrate and phosphate values were very low. Of the 200 confirmed Salmonella spp. isolates recovered from the treated effluent and receiving surface waters, 93% harbored the spiC gene, 84% harbored the misL gene, and 87.5% harbored the orfL gene while 87% harbored the pipD gene. The antibiotic resistance profile revealed that the isolates were resistant to sulfamethoxazole, nalidixic acid and streptomycin, but susceptible to quinolones and third generation β-lactams. These results indicate that in South Africa treated effluents are still a major source of contamination of rivers with pathogens such as Salmonella. Appropriate steps by the regulatory authorities and workers at the treatment plants are needed to enforce stipulated guidelines in order to prevent pollution of surface water resources due to the discharge of poorly treated effluents.

1. Introduction

South Africa is a water stressed country due to the low average received rainfall (465 mm), which is below the global average of 860 mm [1]. Demand for this important scarce resource is expected to increase due to rapid industrial development, increasing human population, per capita consumption increases and the resulting impact of human activities on the environment [2,3]. High water demand and consumption also leads to increases in the volume of wastewater generated [4]. The availability of good quality water is of paramount importance bringing to the fore the consequence of contamination of water bodies with pathogenic microorganisms [5]. Water bodies such as rivers are subject to dramatic changes in microbial and physicochemical qualities as a result of a variety of anthropogenic activities in the watershed. These changes are caused by discharges of municipal raw waters or treated effluent at a specific point source into the receiving surface waters [6,7]. Point-source pollution problems will not only increase treatment costs considerably, but may also introduce a wide range of pathogens and harmful chemicals into surface waters that may be supplied to many rural and urban communities, thus resulting in incidences of waterborne diseases with far reaching socio-economic implications [8,9]. Although a vast majority of microorganisms present in wastewater are not pathogenic [10], some pathogenic bacteria possibly originating from discharge of inadequately treated wastewater effluent have been implicated in the outbreak of waterborne diseases over the years [11].
Salmonella spp. are important Gram-negative bacilli, which infect both humans and animals causing a wide range of diseases such as gastroenteritis, typhoid fever, osteomyelitis, septicemia and meningitis. This genus comprises of over 2000 recognized serotypes and is divided into two species namely S. bongori and S. enterica. Salmonella enterica consist of six subspecies, namely enterica, arizonae, salamae, diarizonae, houtenae and indica [12,13]. It is estimated that 93.8 million cases of gastroenteritis due to Salmonella spp. occur globally each year, with some 155,000 deaths [14]. This high number of infections emphasizes the importance of this intracellular pathogen and indicates a considerable worldwide disease burden. Mortality rate of Salmonella infections is a health problem mainly in developing countries [15], while morbidity due to acute Salmonella infection can also have socio-economic impacts in developed countries [16]. Added to this disease burden are the complications arising from the inefficacy and failures of antimicrobial chemotherapies applied in clinical practice to remedy these diseases. Bacterial resistance to antibiotics has increased globally in recent years and poses threats to human health [17]. Antimicrobial resistance in Salmonella has been associated with an increase in the number of adverse events following infection such as higher levels of hospitalization, longer illness, and higher risk of invasive illness as well as treatment failures [18]. The World Health Organization (WHO), the European Commission and the United States Centre for Disease Control and prevention (CDC) have recognized the importance of studying the emergence of resistance genes as well as the need for control strategies [19]. In most countries, the microbial quality of final treated effluent is estimated based on the level of indicator organisms present [20,21]. However, several studies have shown that the presence of indicator organisms does not always correlate with the presence of pathogens [22,23]. This study therefore aimed to determine the prevalence of antibiotic resistant and virulent Salmonella spp. in treated effluents and receiving surface water of two wastewater treatment plants located in Durban, South Africa.

2. Materials and Methods

2.1. Description of Sampling Site and Sample Collection

Two wastewater treatment plants, namely the Northern Wastewater Treatment Works (NWWTW) and the New Germany Wastewater Treatment Plant (NGWTP) located in Durban, South Africa were sampled and studied. Details of these treatment plants can be found elsewhere [24]. The NWWTW and NGWTP discharge their final effluents into the Umgeni and Aller rivers, respectively. Water samples were collected monthly from both wastewater treatment plants at the clarifier before chlorination (B.C), discharge point after chlorination (D.P), 500 meters upstream (U.S) and 500 meters downstream (D.S) of the discharge point between March 2012 and February 2013. Samples were collected in 5 L plastic containers disinfected 24 h prior to collection by rinsing with deionized water and soaking in 70% ethanol. During collection of samples, the containers were rinsed with the sampled water before filling (at a depth of approximately one metre at each sampling point) to three-quarter of the container leaving space to allow for proper mixing. The collected samples were placed in ice packs, transported to the laboratory at the Department of Microbiology, University of KwaZulu-Natal (Westville) and processed within 24 h of collection.

2.2. Physico-Chemical Analysis of Water Samples

Temperature of the water samples was measured on site with a mercury thermometer; the pH was determined using a pH meter (Beckman, CA, USA) while turbidity was measured with a turbidimeter (21000P, HACH, CO, USA). Biochemical oxygen demand (BOD5) was determined using the LDC 101 probe with an HQ40d multimeter (HACH) after incubation for a period of 5 days according to the manufacturer’s instructions. Chemical oxygen demand (COD) was measured with a Nova 60 spectroquant (Merck, Darmstadt, Germany) according to the manufacturer’s instructions. Conductivity and total dissolved solids (TDS) were measured using the CDC 401 probe and HQ40d multimeter (HACH Colorado, USA). Nitrate (NO3) and Phosphate (PO4) concentrations were determined at Aquatico Laboratories (Pretoria, South Africa) using 50 mL of water samples.

2.3. Microbial Profile of Treated Wastewater Effluent and Receiving River

In order to avoid overestimation, Salmonella present in the water samples was quantified via a standard membrane filtration technique as previously described [3]. Ten-fold serial dilutions of the water samples were made and membrane filter (Pall Corporation, MI, USA) of 0.45 µm pore size and 47 mm diameter was used to concentrate 50 mL of appropriately diluted water sample. The membrane filter was then placed on the surface of Salmonella-Shigella (SS) agar and incubated aerobically at 37 °C for 18 to 24 h to enumerate Salmonella spp. Colourless colonies with or without black center depending on the production of hydrogen sulphide were enumerated as presumptive Salmonella spp. [25]. The organisms are referred to as presumptive Salmonella because certain bacteria also exhibit the same characteristics as Salmonella on SS agar.

2.4. Enrichment and Isolation of Salmonella spp. from Water Samples

Isolation of Salmonella spp. from the water samples was done by a previously described enrichment method [26] with modifications. Thoroughly mixed water samples (25 mL) were added to 250 mL of sterile buffered peptone water and incubated at 37 °C for 18 to 24 h with shaking at 230 rpm. Thereafter, 1 mL of the pre-enrichment solution was appropriately diluted in 9 mL of sterile Rappaport-Vassiliadis soy broth (RVS) (Oxoid, Basingstoke, UK) depending on the turbidity of the water sample used in the pre-enrichment and incubated at 42 °C for 24 to 48 h with shaking at 230 rpm. One hundred microliters (100 µL) of the appropriately diluted RVS broth was spread-plated on Salmonella chromogenic agar (Oxoid) in duplicate and incubated aerobically at 37 °C for 18 to 24 h. Colonies with purple color were isolated and purified on fresh nutrient agar plates and subjected to further identification using biochemical tests and molecular method.

2.4.1. Biochemical Screening of Presumptive Salmonella spp.

Triple sugar iron (TSI), Simmons citrate, lysine iron agar (LIA) and urea agar (Oxoid) slants were prepared according to the manufacturer’s instructions and inoculated with a 24 h nutrient agar-grown culture of the isolates incubated at 37 °C. The surface of the agar slant was inoculated using a sterile inoculating loop while a stab was made at the center of the slant using a sterile inoculating needle. The tubes were then incubated under aerobic conditions at 37 °C for 24 to 48 h. Tubes exhibiting alkaline slant and acidic butt with H2S production on TSI slants, purple color in butt of LIA tube, blue color development on slant of citrate agar and no color change on urea indicated positive results for Salmonella spp. Isolates showing biochemical reaction consistent with Salmonella spp. were further confirmed using molecular based method.

2.4.2. Molecular Confirmation of Presumptive Salmonella spp.

Template DNA was prepared from 24 h freshly grown cultures of the isolates on nutrient agar using the boiling method as previously described [27] with modifications. Well isolated colonies (3 to 5) were suspended in 70 µL of sterile deionized water, boiled in a water bath at 100 °C for 10 min and cooled on ice for a further 5 min. Thereafter, the suspension was centrifuged at 13,000 rpm in a micro-centrifuge (Eppendorf 5415D, Hamburg, Germany) for 5 min. The supernatant (50 µl) was carefully transferred to a sterile eppendorf tube and used as a template in the PCR assay. Salmonella spp. was confirmed by the amplification of the invA gene using the primers F-5′-TGC-CTA-CAA-GCA-TGA-AAT-GG-3′ and R-5′-AAA-CTG-GAC-CAC-GGT-TGA-CAA-3′ [28]. The PCR mixture contained: 1 × PCR reaction buffer, 1 mM of MgCl2, 200 µM of each dNTPs, 0.5 µM of each primer, 2 U of Taq polymerase (Supertherm, Inqaba, Pretoria, South Africa) and 2 µL of template DNA in a final volume of 25 μL. Amplification was performed in a thermocycler (Bio-Rad T100, Singapore) with a temperature regime of 2 min at 94 °C for initial denaturation followed by 35 cycles of 94 °C for 1 min, annealing at 58 °C for 1 min, extension at 72 °C for 1 min with a final extension step at 72 °C for 5 min. PCR mixture with 2 µL of molecular grade water was used as negative control while S. typhimurium ATCC 13317 was used as a positive control. The PCR products were examined by electrophoresis in a 1.5% (w/v) agarose gel at 60 V for 90 min in 1% TAE buffer and visualized via UV illumination (Syngene Cambridge, UK) after staining in 1 mg/mL ethidium bromide for 15 min.

2.4.3. Virulence Gene Detection

The isolates were evaluated for the presence of virulence genes in Salmonella pathogenicity island (SPI) 2 through 5 using the primers shown in Table 1 [29,30]. The presence of misL and orfL virulence genes was confirmed using duplex PCR method developed in this study, while spiC and pipD were detected in separate single PCR assay. The reaction was done in a 25 μL reaction volume consisting of 1 × buffer, 1 mM MgCl2, 0.2 mM dNTPs, 0.5 μM of each primer, 2 μL of template DNA and 2.5 U of Taq polymerase (Supertherm). Amplification was carried out in a thermocycler (Bio-Rad T100) using a temperature program consisting of initial denaturation of 94 °C for 2 min, followed by 35 cycles of 94 °C for 1 min, 1 min at the respective annealing temperature of various primers (Table 1), 72 °C for 1 min with a final extension at 72 °C for 5 min. PCR mixture with 2 µL of molecular grade water was used as negative control while S. typhimurium ATCC 13317 was used as a positive control. The amplicons were examined by electrophoresis in a 1.5% agarose gel at 60 V for 90 min, stained in 1 mg/mL ethidium bromide for 5 min and viewed under UV light (Syngene Cambridge, UK).

2.4.4. Antibiotic Resistance Determination

Antibiotic susceptibility of the isolates was determined using the Kirby-Bauer disk diffusion method. The isolates were screened against a predetermined and commercially available panel of 20 antibiotics (Oxoid), belonging to six classes. Fresh culture were grown overnight in Mueller-Hinton broth and standardized to 0.5 McFarland by diluting with sterile Mueller-Hinton broth until an optical density of 0.08 to 0.1 was obtained on a spectrophotometer (Shimadzu UV-1800, Kyoto, Japan) at 625 nm. The standardized culture of the isolates were inoculated onto Mueller-Hinton agar using sterile swabs for confluence growth and allowed to dry for 10 min. Thereafter, appropriate antibiotic disks were placed at equidistance on the surface of the agar plates with a sterile forceps and incubated at 37 °C for 24 h. The diameter of the zone of inhibition was measured to the nearest millimeter and interpreted using charts recommended by the CLSI [31].

2.5. Statistical Analysis

Mean values of results and standard deviation were calculated using Microsoft Excel 2010 edition. Pearson’s correlation was determined using the SPSS 21.0 for windows program (SPSS, Inc. WA, USA) after normalization of skewed datasets. Correlations were considered statistically significant at p values of <0.05.
Table 1. Primer used for the detection of virulence genes in Salmonella spp. recovered from treated wastewater effluent and receiving surface waters.
Gene TargetOligonucleotide Sequence (5ʹ-3ʹ)Amplicon Size (bp)Annealing Temperatures (°C)
spiCf-CCTGGATAATGACTATTGAT30954
r-AGTTTATGGTGATTGCGTAT
pipDf-CGGCGATTCATGACTTTGAT40056
r-CGTTATCATTCGGATCGTAA
misLf-GTCGGCGAATGCCGCGAATA55060
r-GCGCTGTTAACGCTAATAGT
orfLf-GGAGTATCGATAAAGATGTT35060
r-CGTTATCATTCGGATCGTAA

3. Results

3.1. Physicochemical Profile of Water Samples

The physicochemical parameters of treated effluent at the NWWTP and NGWTP and the receiving surface waters are shown in Table 2 and Table 3. Temperature was stable across all sampled points in each month but seasonal variations were observed. The lowest temperature recorded was 12 °C, while the highest temperature of 27 °C. The pH was stable at all sampled points in each month but varied throughout the duration of the study. It ranged from 6.41 (at the U.S in September) to 7.88 (at the D.P in February) at the NWWTW while at the NGWTP, the pH ranged from 6.30 (at the U.S in July) to 8.00 (at the D.S in February). Turbidity values recorded varied across all sampled point and month with no significant decrease in turbidity obtained at the D.P compared to B.C point (Table 2). At the NGWTP, recorded values ranged from 1.42 NTU at D.P in April to 40.40 NTU at U.S in August. The COD values varied highly throughout the study period ranging from 22.33 to 313 mg/L at U.S at the NGWTP. Some levels of decrease at the D.P was observed only in the months of April (36.5%), May (21.11%) and June (55.6%) but increased in the other months. Recorded COD values also varied highly at the NWWTW and ranged from <10 mg/L in March and May (at the D.P) to 312.44 mg/L in July (at the D.S). Some level of decrease in COD was recorded at the D.P in May, August, October and December but increased in other months especially in March and May from <10 mg/L to 309 mg/L. Stable BOD5 values were observed across each sampled point in each month ranging from 1.03 mg/L to 9.42 mg/L at the NWWTW. The values of BOD5 at the D.S were higher than values recorded at other sampled points and ranged from 3.58 mg/L to 7.74 mg/L. At the NGWTP, the BOD5 was stable across all sampled points in each month but varied throughout the study period ranging from 2.20 mg/L to 11.04 mg/L.
Table 2. Physicochemical parameters of wastewater effluent from Northern wastewater treatment works and the receiving river from March 2012 to February 2013.
MONTHSampled PointParameter (Mean ± SD)
T (°C)pHT (ntu)COD (mg/L)BOD (mg/L)NO3 (mg/L)PO4 (mg/L)
U.S26.00 ± 0.007.25 ± 0.0916.67 ± 0.38161.33 ± 4.375.62 ± 1.011.060.05
MARB.C26.00 ± 0.007.11 ± 0.057.91 ± 0.33104.78 ± 13.732.23 ± 0.360.063.51
D.P25.00 ± 0.007.36 ± 0.0723.40 ± 12.13<10 ± 0.005.13 ± 0.180.063.47
D.S26.00 ± 0.007.24 ± 0.0615.27 ± 0.12309.33 ± 0.585.62 ± 0.240.060.16
U.S21.00 ± 0.007.43 ± 0.1219.7 ± 0.00304.33 ± 2.088.49 ± 0.470.860.23
B.C22.00 ± 0.007.67 ± 0.0656.53 ± 0.12229.33 ± 9.713.30 ± 0.970.052.11
APRD.P22.00 ± 0.007.40 ± 0.1076.43 ± 0.29311.11 ± 2.013.44 ± 0.670.052.10
D.S21.00 ± 0.007.63 ± 0.0614.80 ± 0.00151.00 ± 0.006.33 ± 0.210.320.38
U.S21.00 ± 0.006.91 ± 0.0412.80 ± 0.0020.22 ± 1.714.29 ± 0.791.031.08
B.C22.00 ± 0.007.08 ± 0.0319.60 ± 0.0038.22 ± 11.551.03 ± 0.190.162.72
MAYD.P21.00 ± 0.007.28 ± 0.0213.80 ± 0.17<10 ± 0.003.25 ± 0.170.202.34
D.S22.00 ± 0.007.13 ± 0.0312.90 ± 0.00309.11 ± 1.715.68 ± 0.301.720.82
U.S13.00 ± 0.007.65 ± 0.019.57 ± 0.01112.89 ± 3.029.42 ± 0.152.402.17
B.C13.00 ± 0.007.37 ± 0.0011.27 ± 0.31300.00 ± 8.654.36 ± 0.165.9812.38
JUND.P12.00 ± 0.007.35 ± 0.018.92 ± 0.06110.00 ± 3.064.54 ± 0.123.929.02
D.S14.00 ± 0.007.84 ± 0.0114.37 ± 0.2188.78 ± 2.417.74 ± 0.311.781.44
U.S15.00 ± 0.007.54 ± 0.0113.27 ± 0.15311.00 ± 1.005.76 ± 1.030.790.03
B.C16.00 ± 0.007.48 ± 0.0119.33 ± 0.06114.78 ± 11.652.56 ± 0.581.001.83
JULD.P15.00 ± 0.007.70 ± 0.0023.07 ± 0.38290.67 ± 0.883.12 ± 0.620.890.75
D.S15.00 ± 0.007.87 ± 0.0222.87 ± 0.12312.44 ± 0.384.69 ± 0.231.350.09
U.S20.00 ± 0.007.12 ± 0.0328.73 ± 0.06105.89 ± 3.862.80 ± 0.570.060.12
B.C21.00 ± 0.006.85 ± 0.1156.37 ± 0.35310.11 ± 0.691.51 ± 1.090.000.00
AUGD.P19.00 ± 0.007.09 ± 0.465.53 ± 0.57182.78 ± 2.271.59 ± 0.840.061.99
D.S20.00 ± 0.007.26 ± 0.0220.77 ± 0.06309.56 ± 2.143.98 ± 0.650.000.00
U.S20.00 ± 0.006.41 ± 0.0510.67 ± 0.0655.56 ± 0.513.73 ± 0.530.170.10
B.C22.00 ± 0.006.76 ± 0.0220.73 ± 0.06308.67 ± 0.881.51 ± 0.760.151.70
SEPTD.P20.00 ± 0.006.82 ± 0.0419.27 ± 0.21308.44 ± 1.262.38 ± 1.100.081.90
D.S20.00 ± 0.006.52 ± 0.0211.50 ± 0.10139.67 ± 1.733.92 ± 0.781.470.16
U.S24.00 ± 0.007.02 ± 0.0117.07 ± 0.12195.22 ± 3.983.32 ± 0.781.020.37
B.C22.00 ± 0.006.60 ± 0.0630.53 ± 0.23306.89 ± 1.843.23 ± 1.400.881.88
OCTD.P23.00 ± 0.006.75 ± 0.0528.50 ± 0.00109.89 ± 2.803.88 ± 0.750.821.57
D.S24.00 ± 0.006.91 ± 0.0129.03 ± 0.06148.00 ± 0.333.58 ± 0.981.300.42
U.S21.00 ± 0.006.86 ± 0.0121.33 ± 0.76241.78 ± 21.564.24 ± 0.980.970.64
NOVB.C22.00 ± 0.006.79 ± 0.0139.13 ± 0.40123.78 ± 6.913.56 ± 0.920.283.53
D.P23.00 ± 0.006.68 ± 0.0348.53 ± 0.55287.22 ± 14.253.26 ± 0.880.313.69
D.S23.00 ± 0.006.72 ± 0.0514.10 ± 0.46246.11 ± 14.843.87 ± 0.813.380.45
U.S22.00 ± 0.006.85 ± 0.0112.20 ± 0.26274.33 ± 4.413.65 ± 0.780.390.03
B.C25.00 ± 0.006.78 ± 0.0336.13 ± 0.40170.78 ± 3.793.29 ± 0.960.241.82
DECD.P21.00 ± 0.006.69 ± 0.0131.77 ± 0.23153.89 ± 0.193.52 ± 0.770.771.37
D.S22.00 ± 0.006.64 ± 0.0210.33 ± 0.41205.33 ± 4.984.01 ± 0.791.950.35
U.S24.00 ± 0.007.04 ± 0.0111.40 ± 0.26299.22 ± 1.073.76 ± 0.670.580.23
JANB.C24.00 ± 0.006.84 ± 0.0112.67 ± 0.15<10 ± 0.003.68 ± 0.940.024.70
D.P23.00 ± 0.006.87 ± 0.0332.67 ± 0.81303.67 ± 0.333.72 ± 0.950.024.69
D.S24.00 ± 0.006.92 ± 0.028.72 ± 0.04150.11 ± 3.563.74 ± 0.661.220.12
U.S25.00 ± 0.007.41 ± 0.016.37 ± 0.02308.89 ± 1.023.26 ± 0.390.220.03
FEBB.C25.00 ± 0.007.80 ± 0.0140.37 ± 0.21295.67 ± 4.731.82 ± 1.120.013.51
D.P25.00 ± 0.007.88 ± 0.0144.07 ± 0.25309.33 ± 0.582.81 ± 0.860.022.71
D.S27.00 ± 0.007.77 ± 0.015.94 ± 0.10254.78 ± 5.394.01 ± 0.800.160.53
Table 3. Physicochemical parameters of wastewater effluent from New Germany wastewater treatment works and the receiving river from March 2012 to February 2013.
MONTHSampled PointParameter (Mean ± SD)
T (°C)pHT (ntu)COD (mg/L)BOD (mg/L)NO3 (mg/L)PO4 (mg/L)
U.S26.00 ± 0.007.52 ± 0.095.15 ± 0.05313.89 ± 0.197.79 ± 0.831.060.05
MARB.C26.00 ± 0.007.12 ± 0.216.65 ± 0.23153.67 ± 11.462.20 ± 0.131.810.90
D.P26.00 ± 0.007.18 ± 0.125.71 ± 0.59239.00 ± 10.003.12 ± 0.271.400.80
D.S26.00 ± 0.007.51 ± 0.097.32 ± 0.33141.33 ± 11.064.97 ± 0.592.140.05
U.S18.00 ± 0.007.08 ± 0.028.23 ± 0.00104.22 ± 2.838.49 ± 0.471.290.17
B.C20.00 ± 0.007.04 ± 0.041.52 ± 0.00202.78 ± 9.103.30 ± 0.972.811.09
APRD.P19.00 ± 0.006.82 ± 0.011.42 ± 0.02179.67 ± 1.203.44 ± 0.672.350.86
D.S20.00 ± 0.007.05 ± 0.0417.00 ± 0.00114.00 ± 1.736.33 ± 0.210.820.28
U.S16.00 ± 0.006.42 ± 0.053.18 ± 0.00298.67 ± 0.3311.04 ± 0.970.84<0.025
B.C19.00 ± 0.006.91 ± 0.0928.70 ± .00312.22 ± 0.693.15 ± 0.25<0.0570.05
MAYD.P14.00 ± 0.007.02 ± 0.0130.30 ± 0.00246.33 ± 3.064.72 ± 0.16<0.057<0.025
D.S19.00 ± 0.007.10 ± 0.0017.80 ± 0.00311.89 ± 2.229.67 ± 0.550.51<0.025
U.S16.00 ± 0.007.93 ± 0.019.02 ± 0.1222.33 ± 3.7910.80 ± 0.412.380.66
B.C18.00 ± 0.007.62 ± 0.019.63 ± 0.03310.00 ± 1.734.19 ± 0.113.761.05
JUND.P14.00 ± 0.007.55 ± 0.0110.63 ± 0.51137.67 ± 9.875.03 ± 0.071.990.88
D.S18.00 ± 0.007.83 ± 0.0014.07 ± 0.1273.33 ± 4.167.16 ± 1.572.150.33
U.S14.00 ± 0.006.30 ± 0.012.44 ± 0.01309.67 ± 2.195.27 ± 0.411.030.03
B.C17.00 ± 0.006.53 ± 0.1020.07 ± 0.12193.67 ± 3.672.12 ± 0.170.470.03
JULD.P15.00 ± 0.006.89 ± 0.0120.73 ± 0.15308.67 ± 0.583.95 ± 0.340.570.09
D.S17.00 ± 0.006.98 ± 0.0216.10 ± 0.00299.56 ± 4.629.42 ± 0.550.710.07
U.S15.00 ± 0.007.12 ± 0.0340.40 ± 0.36207.56 ± 1.073.27 ± 1.022.290.59
B.C17.00 ± 0.006.85 ± 0.1119.73 ± 0.15139.56 ± 1.023.62 ± 1.021.420.93
AUGD.P12.00 ± 0.007.26 ± 0.0216.80 ± 0.17309.00 ± 1.334.68 ± 0.801.961.47
D.S17.00 ± 0.007.09 ± 0.0414.10 ± 0.10311.78 ± 0.845.86 ± 1.570.801.89
U.S20.00 ± 0.006.48 ± 0.0215.83 ± 0.15310.33 ± 0.584.06 ± 0.912.650.54
B.C22.00 ± 0.006.75 ± 0.085.84 ± 0.0198.22 ± 2.414.66 ± 0.848.220.58
SEPTD.P20.00 ± 0.006.37 ± 0.0316.33 ± 0.06310.44 ± 1.174.49 ± 1.080.230.14
D.S20.00 ± 0.006.59 ± 0.006.98 ± 0.02189.89 ± 2.593.42 ± 0.470.720.17
U.S17.00 ± 0.006.97 ± 0.023.68 ± 0.01311.89 ± 0.844.46 ± 0.672.320.05
B.C20.00 ± 0.006.91 ± 0.0920.00 ± 0.1035.67 ± 3.614.51 ± 0.841.231.12
OCTD.P19.00 ± 0.006.85 ± 0.146.48 ± 0.0454.11 ± 3.154.42 ± 0.721.641.26
D.S20.00 ± 0.006.98 ± 0.035.10 ± 0.01239.22 ± 4.814.79 ± 0.792.470.49
U.S17.00 ± 0.007.12 ± 0.018.11 ± 0.06306.78 ± 2.464.31 ± 0.782.110.02
NOVB.C20.00 ± 0.006.82 ± 0.035.51 ± 0.0869.11 ± 1.394.14 ± 0.610.503.22
D.P18.00 ± 0.007.14 ± 0.0429.43 ± 0.06108.56 ± 3.244.22 ± 0.710.333.99
D.S20.00 ± 0.007.16 ± 0.0116.53 ± 0.23257.56 ± 14.554.49 ± 0.811.271.70
U.S20.00 ± 0.006.47 ± 0.0132.10 ± 0.1024.33 ± 2.083.38 ± 1.46<0.0170.04
B.C22.00 ± 0.006.55 ± 0.284.41 ± 0.3093.33 ± 5.932.87 ± 0.810.110.13
DECD.P20.00 ± 0.006.45 ± 0.0129.43 ± 0.06300.44 ± 4.223.36 ± 0.92<0.0170.14
D.S22.00 ± 0.006.51 ± 0.0428.10 ± 0.1035.33 ± 3.844.17 ± 0.830.510.06
U.S22.00 ± 0.006.71 ± 0.0110.80 ± 0.0080.33 ± 5.133.92 ± 0.691.21<0.08
JANB.C23.00 ± 0.006.59 ± 0.029.43 ± 0.04111.11 ± 0.843.43 ± 1.09<0.0170.01
D.P22.00 ± 0.006.61 ± 0.029.29 ± 0.04240.78 ± 3.753.75 ± 0.79<0.0170.15
D.S23.00 ± 0.006.73 ± 0.0010.60 ± 0.0044.56 ± 3.424.50 ± 1.270.840.13
U.S21.00 ± 0.007.50 ± 0.058.83 ± 0.04305.33 ± 0.583.04 ± 0.800.440.01
FEBB.C24.00 ± 0.007.72 ± 0.033.93 ± 0.01158.89 ± 4.723.97 ± 1.10<0.0170.76
D.P23.00 ± 0.007.87 ± 0.024.02 ± 0.03283.44 ± 3.794.08 ± 1.04<0.0171.16
D.S24.00 ± 0.008.08 ± 0.005.80 ± 0.02272.89 ± 14.824.85 ± 0.850.390.64
Values are averages of three replicates ± standard deviation.
BOD values increased at the D.P during most of the study period but some level of decrease was recorded in September (17%) and October (9%). At the NWWTW, nitrate (NO3) values ranged from 0.00 mg/L at the B.C and D.S in August to 5.98 mg/L at the B.C in June, while phosphates (PO4) values ranged from 0 mg/L at the B.C and D.S in August to 12.38 mg/L. At the NGWTP, NO3 values ranged from <0.06 mg/L (D.P, May) to 8.22 mg/L (B.C, September) while recorded PO4 values ranged from <0.03 mg/L in May to 3.99 mg/L in November at the D.P (Table 3).

3.2. Enumeration of Presumptive Salmonella in Treated Wastewater Effluent and Receiving River

The monthly variation of presumptive Salmonella spp. population in NWWTW and receiving Umgeni River are shown in Figure 1a. At U.S, counts for presumptive Salmonella spp. ranged from 0.70 log·cfu/mL in October to 2.99 log·cfu/mL in March, while at the BC point, counts ranged from 1.05 to 3.51 log·cfu/mL in June and May, respectively. At the D.P there was no presumptive Salmonella recorded in October while the highest count of 3.29 log·cfu/mL was recorded in April. At the D.S, the counts ranged from 0.61 log·cfu/mL in February to 2.98 log·cfu/mL in April. The monthly variation of presumptive Salmonella spp. population in NGWTP is given in Figure 1b. At the U.S, recorded values ranged from 1.04 log·cfu/mL in May to 3.02 log·cfu/mL in September. At the B.C point, the lowest count was recorded in August (0.98 log·cfu/mL) while the highest count was recorded in November (3.18 log·cfu/ml). No presumptive Salmonella was recorded at the D.P between June and August as well as December to February while the highest values was recorded in September (3.22 log·cfu/ml). At the D.S, the highest recorded value was obtained in the month of December (4.14 log·cfu/ml) while no Salmonella count was recorded in July, August, January and February.
Figure 1. (a) Monthly variation of presumptive Salmonella spp. at (a) NWWTP and (b) NGWTP and their receiving surface waters during the study period.
Ijerph 12 09692 g001aIjerph 12 09692 g001b

3.3. Statistical Analysis

Table 4 and Table 5 show the correlation matrices of selected physicochemical parameters with microbial counts. At the NWWTW (Table 4), there was a strong positive correlation between Presumptive Salmonella counts and turbidity (r = 0.501) as well as with PO4 (r = 0.431). NO3 also strongly correlated positively with temperature (0.430) and BOD5 (r = 0.462). However, a strong inverse correlation was seen between Turbidity and BOD5 (r = −0.378) as well as NO3 (r = 0.408). Presumptive Salmonella counts strongly correlated negatively with both BOD5 (r = −0.325) and NO3 (r = −0.349). At the NGWTP (Table 5), PO4 correlated significantly (p > 0.05) with pH (r =0.302) but correlated strongly but negatively (p < 0.01) with temperature (r = −0.430).
Table 4. Correlation matrices of the physicochemical parameters at the NWWTW.
TemppHTCODBOD5NO3PO4Sal. a
Temp (°C)1
pH0.1401
T (ntu)0.065−0.0281
COD (mg/L)−0.031−0.225−0.2051
BOD5 (mg/L)0.1290.253−0.378 **0.0361
NO3 (mg/L)0.430 **0.011−0.408 **0.1390.462 **1
PO4 (mg/L)0.1300.0800.1660.171−0.1690.1181
Sal. (cfu/mL)−0.0020.2250.501 **−0.078−0.325 *−0.349 *0.431 **1
aSalmonella spp.; ** Correlation is significant at the 0.01 level (2-tailed); * Correlation is significant at the 0.05 level (2-tailed).
Table 5. Correlation matrices of physicochemical parameters at the NGWTP.
TemppHTCODBOD5NO3PO4Sal. a
Temp (°C)1
pH0.0941
T (ntu)−0.265−0.1481
COD (mg/L)0.262−0.010−0.0241
BOD5 (mg/L)−0.419 **0.264−0.044−0.1951
NO3 (mg/L)−0.1670.187−0.2400.0460.1511
PO4 (mg/L)−0.0050.302 *−0.1580.213−0.0890.2071
Sal. (cfu/mL)−0.002−0.2290.2150.066−0.246−0.090−0.1611
aSalmonella spp.; ** Correlation is significant at the 0.01 level (2-tailed); * Correlation is significant at the 0.05 level (2-tailed).

3.4. Distribution of Confirmed Salmonella spp. Recovered from Treated Wastewater and Receiving Surface Waters

After enrichment and confirmation, a total of 200 of the recovered isolates were confirmed as Salmonella spp. The NGWTP and receiving surface water has the highest prevalence (93.5%) of Salmonella spp.. while only 6.5% of the isolates were recovered in treated effluent before chlorination at the NWWTW. At the NGWTP, 53 (26.5%) of the isolates were recovered in effluent sample before chlorination. Also, 55 (27.5%) isolates were recovered at the discharge point of the NGWTP with additional 27% and 12.5% recovered upstream and downstream of the receiving river of the treated final effluent from the NGTWP, respectively.

3.5. Virulence Gene Distribution and Antibiotic Resistance Profiles of the Positively Identified Salmonella spp.

A representative gel of four virulence genes detected in Salmonella spp. is shown in Figure 2. Analysis of the virulence gene signatures in recovered Salmonella spp. revealed that 93% harbored the spiC gene, 84% harbored the misL gene, and 87.5% harbored the orfL gene while 87% harbored pipD gene. Antibiotic resistance profile of the 200 confirmed isolates is shown in Table 5.
Figure 2. Representative agarose gel showing the invA and virulence genes detected in the positively confirmed Salmonella spp. Lane M contains the 100 bp plus marker (Thermo Scientific), Lane 1 contains invA gene (450bp), lane 2 contains spiC gene (309 bp), lane 3 contains pipD gene (400 bp), lane 4 contains the misL (550 bp) and orfL (350 bp).
Ijerph 12 09692 g002
The isolates were highly susceptible to β-lactams, chloramphenicol, tetracycline, norfloxacin and trimethoprim-sulfamethoxazole (99% to 100%). Resistance was observed against sulfamethoxazole (100%), nalidixic acid (27%) and streptomycin (14%). Resistance to third generation β-lactams was also observed in 0.5% of the isolates. Intermediate resistance was observed against streptomycin (74%), nalidixic acid (44%) and fosfomycin (8.5%). Though some of the isolates recovered were susceptible to nalidixic acid (54%), high resistance to third generation quinolones such as ciprofloxacin, norflorxacin and nitrofurantoin were not recorded (Table 6).
Table 6. Antibiotic resistance profile of Salmonella spp. recovered from wastewater treatment plants and receiving surface waters (n = 200).
ClassAntibioticsContentResistant (%)Intermediate (%)Susceptible (%)
β-lactamsCephalothin30 μg0 (0)0 (0)200 (100)
Imipenem10 μg1 (0.5)1 (0.5)198 (99)
Cefoxitin30 μg0 (0)0 (0)200 (100)
Cefuroxime30 μg0 (0)2 (1)198 (99)
Piperacillin100 μg1 (0.5)3 (1.5)196 (98)
Ampicillin10 μg1 (0.5)2 (1)197 (98.5)
Cefixime5 μg1 (0.5)0 (0)199 (99.5)
Ceftazidime30 μg1 (0.5)0 (0)198 (99)
Aztreonam30 μg0 (0)0 (0)200 (100)
AminoglycosidesGentamycin(10 μg)0 (0)0 (0)200 (100)
Amikacin30 μg0 (0)1 (0.5)199 (99.5)
Streptomycin10 μg28 (14)148 (74)24 (12)
PhenicolsChloramphenicol30 μg0 (0)0 (0)200 (100)
TetracyclinesTetracycline30 μg0 (0)0 (0)200 (100)
QuinolonesCiprofloxacin5 μg0 (0)1 (0.5)199 (99.5)
Norflaoxacin10 μg0 (0)0 (0)200 (100)
Nalidixic acid30 μg54 (27)89 (44.5)57 (28.5)
Nitrofurantoin30 μg0 (0)17 (8.5)183 (91.5)
SulfonamidesTrimethorprim/Sulfamethoxazole1.25/23.75 μg0 (0)0 (0)200 (100)
Sulfamethoxazole5 μg200 (100)0 (0)0 (0)

4. Discussion and Conclusions

The impact of substandard quality effluent or untreated wastewater discharged into receiving water bodies can be detrimental to water availability and security. Wastewater management is the first barrier in a multi-barrier system to ensure safe drinking water, public health and environmental sustainability [32]. Physicochemical analysis of the wastewater gives an indication of the quality of effluents being discharge into the environment. The temperature regime varied depending on the season but was still within the acceptable limit of 25 °C [33] and did not pose any threat to the receiving watershed. The temperature is a very important parameter because of its effect on the chemical reaction and reaction rates, aquatic life and suitability of the water for beneficial uses. Increase in temperature can lead to the disruption of the ecosystem in the receiving watershed resulting in high mortality of aquatic life and encouraged growth of undesirable algae and wastewater fungi [34]. At both plants, the pH ranged between 6.41–8.08 and 6.37–7.88. The neutral to alkaline pH values recorded in this study are similar to previous reports [7]. Very low or high pH is known to be toxic to aquatic life and alters the solubility of chemicals in water [35]. The pH of most natural waters is in the range of 4−9 and the target limit set by the South African Department of Water Affairs is between 5.5 and 9.5 [33]. The pH of water can provide important information about many chemical and biological processes and provides indirect correlations to a number of different impairments in the wastewater treatment processes [36]. Changes in pH can also be indicative of industrial pollution, photosynthesis or the decomposition of organic matter by microorganisms [37]. Hence, the pH values recorded in this study fell within the acceptable range indicating that discharge of the treated wastewater may have no negative impact on the river water with respect to pH.
The turbidity of the water samples in this study ranged between 1.42 NTU to 76.43 NTU and varied seasonally (Table 2 and Table 3). Higher turbidity values recorded in some months at the D.P could be the result of storm runoff and inadequate treatment leading to the high variation in turbidity. This high variation has been reported in previous studies in the Eastern Cape province of South Africa [7]. The turbidity values recorded in this study was higher than the <5 NTU set by the World Health Organization (WHO) for effluent discharge into the environment [7]. Turbidity is caused by small particles that may be organic or inorganic and can provide food and shelter for pathogens providing a possible explanation of its strong positive correlation with Salmonella count at the NWWTW (Table 4). If not removed, turbidity can promote the regrowth of pathogens in the final effluent of receiving water body into which the effluent is discharged [38]. Turbidity also limits the bactericidal effect of chlorine in the wastewater during disinfection [35] and may react with organic compounds in the water to form micro-contaminants such as trihalomethane (THM). THMs are carcinogenic and render the water unfit for recreational activities to consumers who may depend on the receiving water shed for such [9,39].
Although the BOD5 values recorded was stable across each sampling point in each month, the values varied significantly in the course of the study ranging from 1.03 mg/L to 11.04 mg/L. There is no South African guideline for BOD5 levels in the final effluent of wastewater; however, the EU recommends a discharge limit of 3 to 6 mg/L for aquatic ecosystems [6]. Discharge of effluent high in BOD into water bodies would result in rapid depletion of dissolved oxygen leading to anoxic conditions, and consequent disruption of balance in the aquatic ecosystem [6]. On most occasions the recorded BOD5 values at the D.P were within the recommended EU limit. The COD of the water samples varied remarkably throughout the study period. High COD values were recorded at U.S while, the average recorded values (212 mg/L) at the D.P greatly exceeded the South African limit of 30 mg/L [33]. High levels of COD observed U.S could be attributed to runoff, agricultural activities and anthropogenic activities. Igbinosa and Okoh [7] reported a similar observation and attributed the increased COD to addition of organic and inorganic substances from the environment as well as organic contaminants entering the system from municipal sewage treatment plants or non-point sources of pollution. Higher average COD values varying from 512 to 698.11 mg/L were reported in a study on river quality in India and was attributed to the presence of inorganic chemicals in the wastewater of a nearby chemical industry [40].
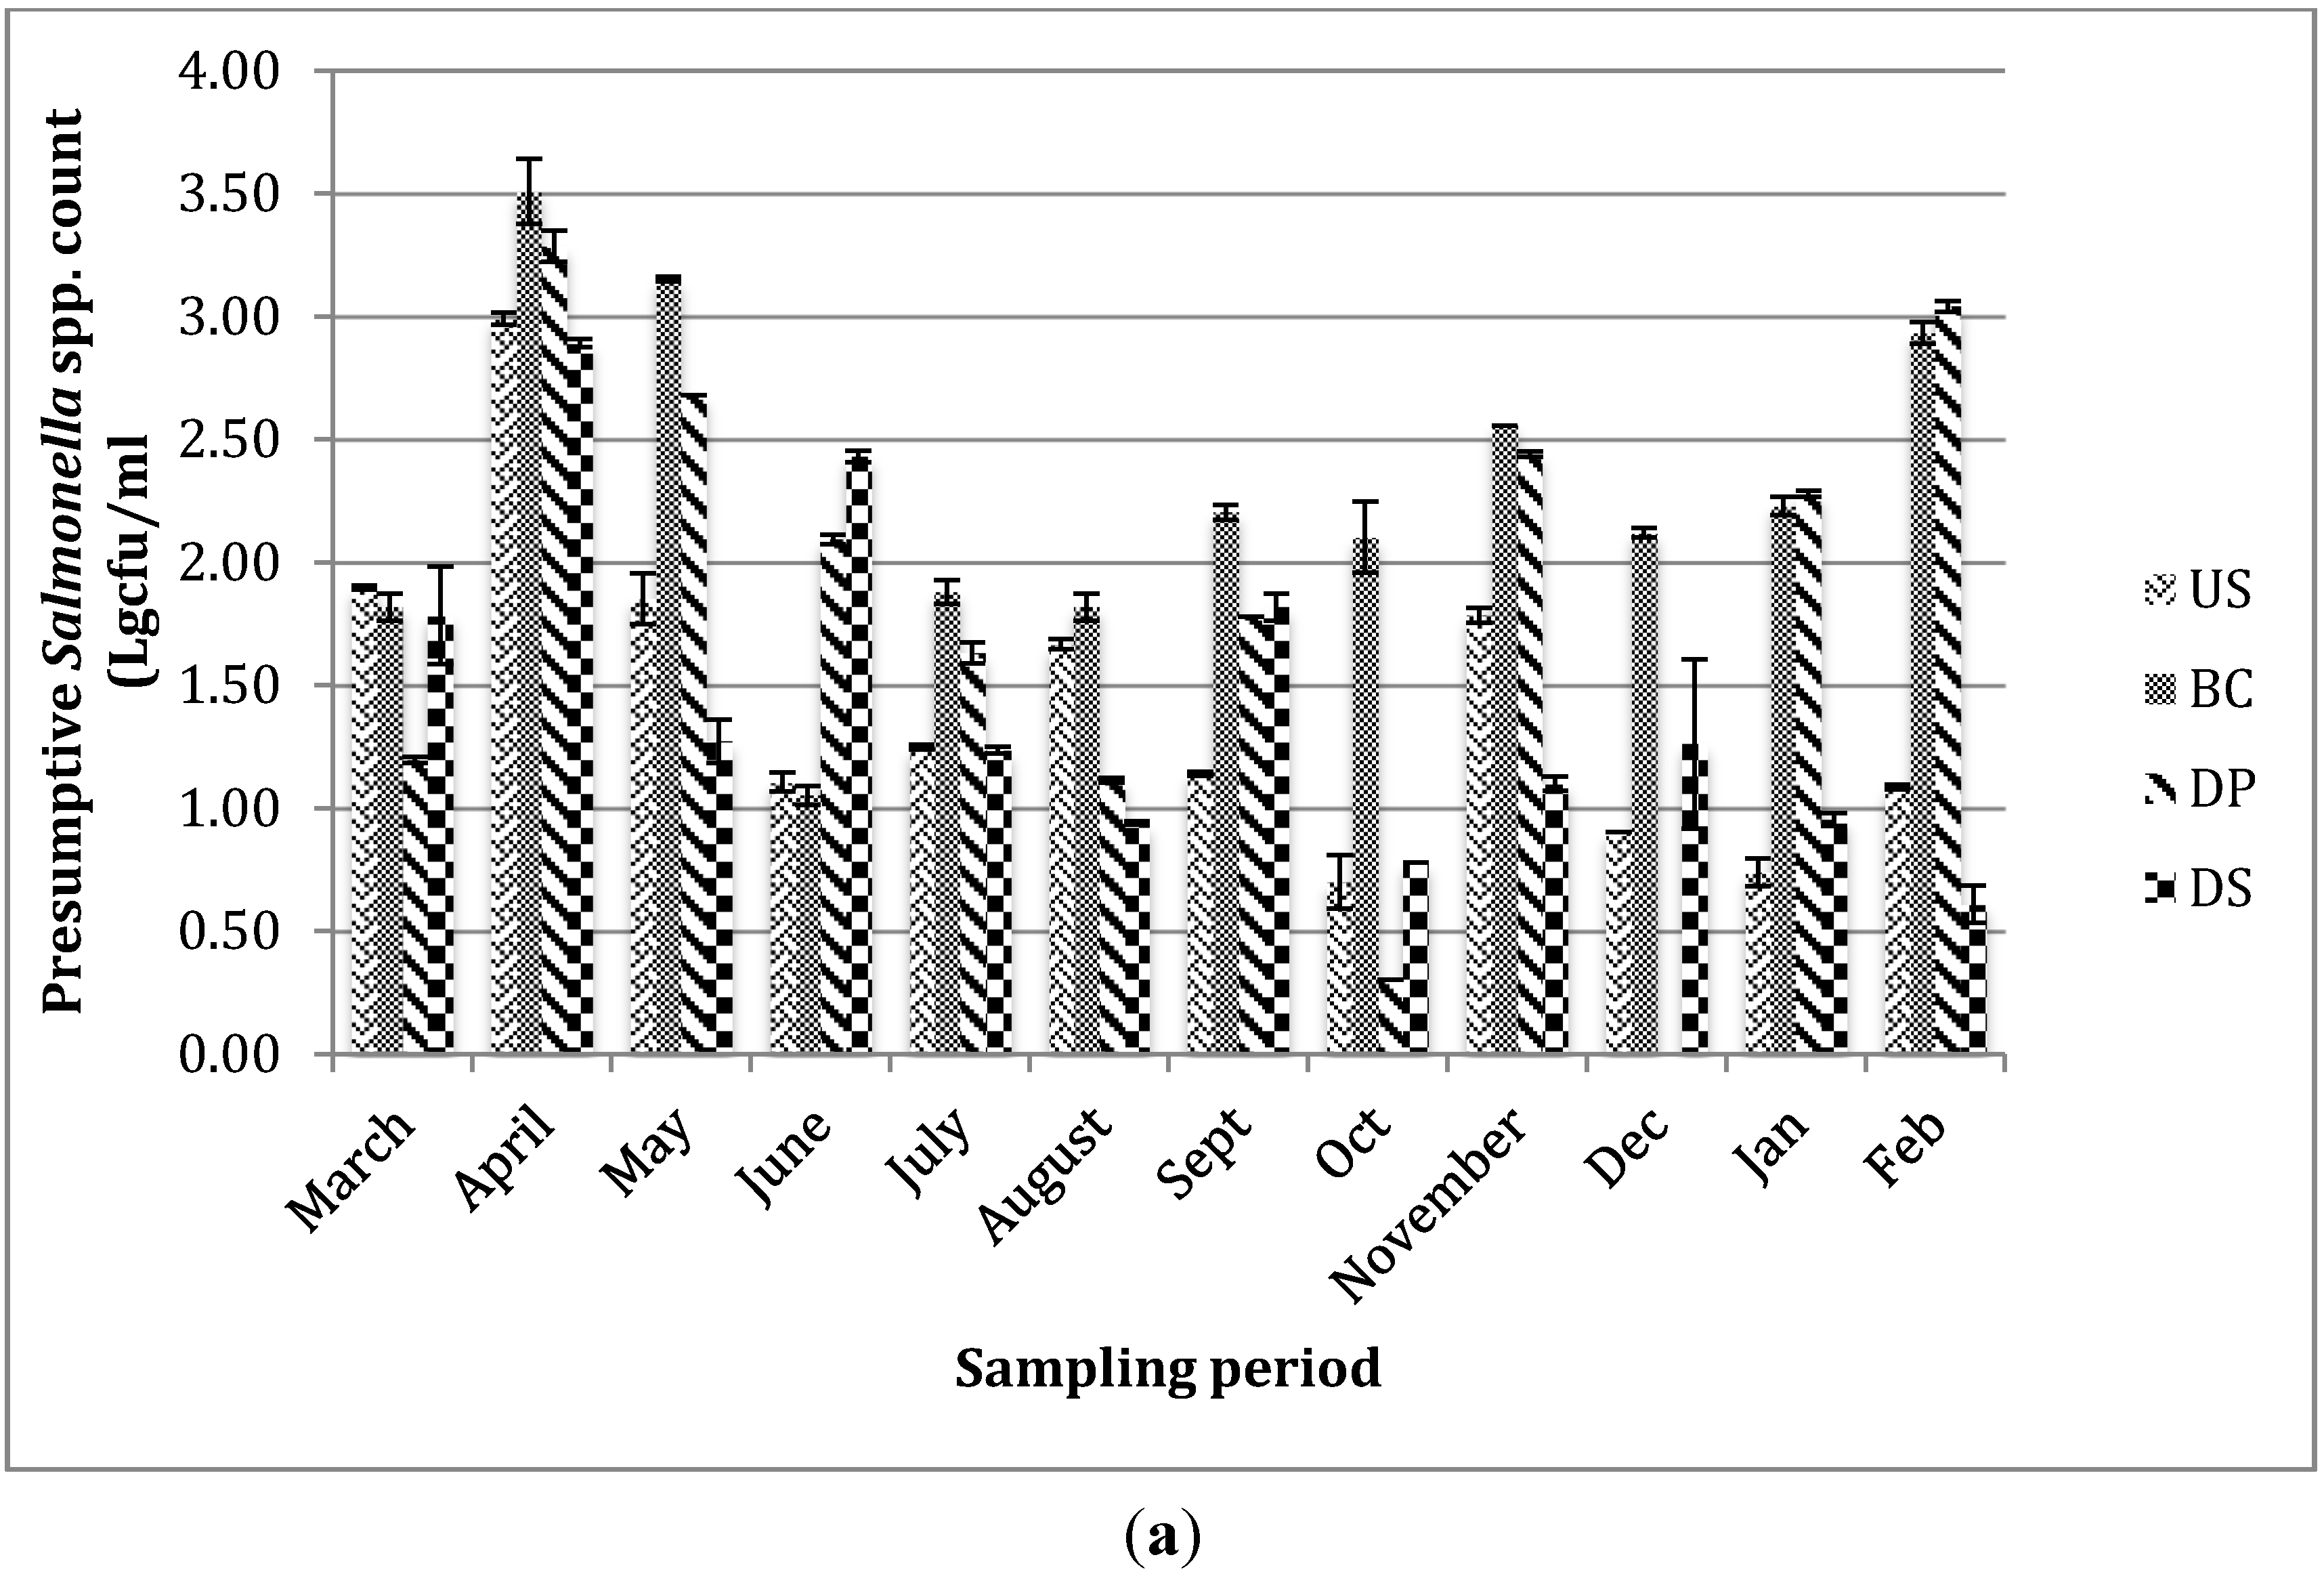
Tertiary treatment of final sewage effluent with chlorine at the wastewater treatment plants (WWTPs) under investigation reduced the number of viable presumptive Salmonella spp. at the discharge point during the sampling period but failed to totally eliminate them (Figure 1). Presumptive Salmonella spp. were also recovered downstream of the receiving rivers indicating the negative impact of the wastewater treatment plants on the microbial quality of the river. This indicates that treated wastewater effluents discharged from these treatment plants are a source of contamination of receiving surface waters with this potential pathogen. Upstream of the river at the NGWTP is an informal settlement with poor sanitation and inadequate sewage disposal system, which contaminates the river with human and animal wastes while the bank of the Umgeni River downstream, is littered with feces. Storm runoff from this informal settlement and riverbanks explains the high count of presumptive Salmonella spp. observed upstream. In contrast to findings from this study, Olaniran, Naidoo and Pillay [24] reported lower counts of Salmonella spp. from treated wastewater of same plants under investigation, which may be due to the short duration of the study or an improvement in the operational conditions of the treatment plants. Elsewhere, Momba, Osode and Sibewu [6] reported recovery of pathogenic microorganisms including Salmonella spp. in the final effluents of four WWTPs in the Eastern Cape province of South Africa and concluded that WWTPs serve as a point source of microbial pollution of water bodies. Recent reports have also suggested that WWTPs plants in South Africa are either dysfunctional or non-functional [41], inefficient in removing microbial pathogens from wastewater and produce wastewater effluent of unacceptable standard that does not meet discharge guidelines set by the department of water affairs, South Africa [42,43,44,45]. The issue of treatment efficiency is of major importance if the reclaimed water is intended for recreational or potable reuse or is to be discharged into water bodies because disposal of inadequately treated wastewater into surface water recipient is one of the major sources of pathogens in the environment [42,46]. Though Salmonella is isolated from water in lower numbers than indicator bacteria such as fecal coliform, fecal streptococci and enterococci; counts in the range of 15−1000 cfu/mL may pose public health risks [47]. Thus, the presence of this organism in the final effluent of wastewater and receiving surface water is a serious cause for concern especially where the contaminated water is depended on for irrigation and rural socio-economic activities.
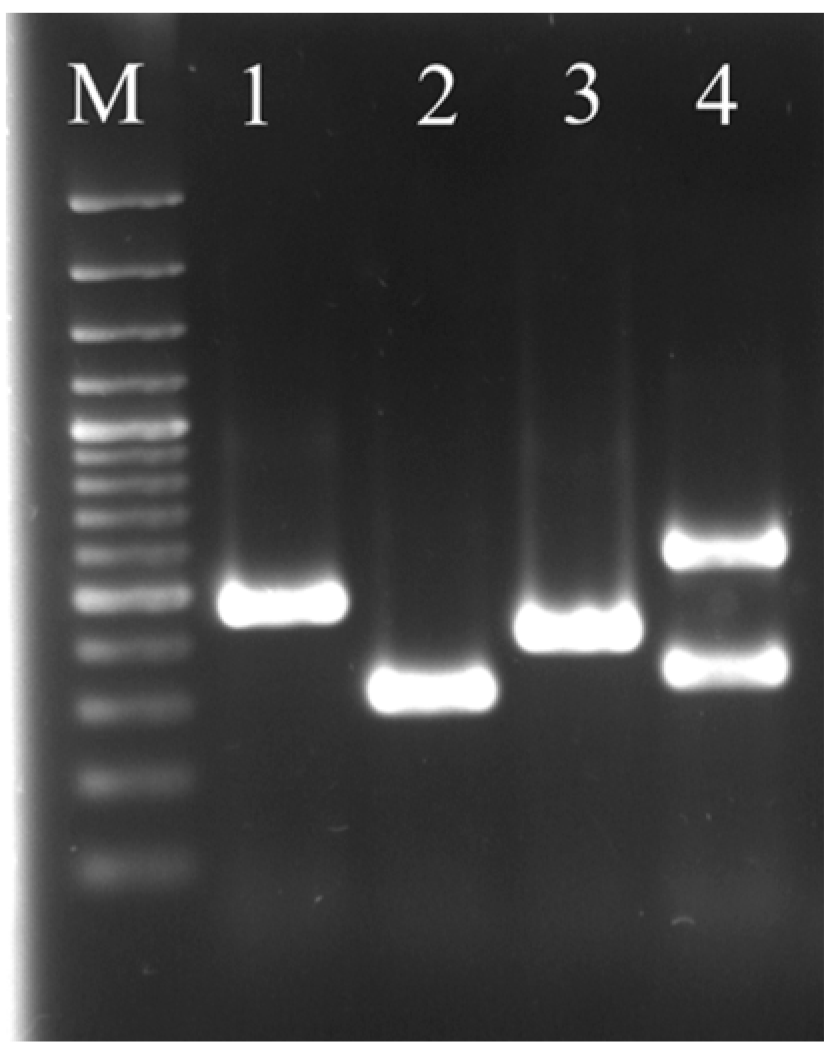
In this study, 200 Salmonella spp. were recovered and found to contain the invA gene (Figure 2), which led to their confirmation as Salmonella spp. in agreement with previous studies [48,49]. The invA gene is conserved in all Salmonella spp. and encodes for a protein in the inner and outer membrane which is essential for virulence and is thought to trigger the internalization required for invasion into deeper tissues [29,30]. At the NWWTW, confirmed Salmonella spp. were only recovered at the B.C point (6.5%) but not at the D.P indicating the plant was efficient at removing Salmonella spp. from the wastewater during the sampling period. This is also corroborated by the fact that the NWWTW has a high Greendrop status rating [50]. The Greendrop is an index developed by the Department of Water Affairs in South Africa to rate wastewater treatment plants in the country based on the quality of their final effluent. In the Eastern Cape province of South Africa, Momba, Osode and Sibewu [6] observed the presence of Salmonella spp. in 50% of final wastewater effluent and 35% in the receiving river samples. Poor sanitation, lack of access to proper sewage disposal systems, malnutrition and poverty have been described as some of the leading factors contributing to the high prevalence of salmonellosis and other diarrheal diseases in developing countries [51,52,53].
Amplification of virulence genes (Figure 2) revealed that the isolates contained one or more virulence genes present in the Salmonella pathogenicity island (SPI). This can pose serious health threats to consumers who depend on the river water for daily and recreational activities. Pathogenicity islands are found on genomes of pathogenic bacteria but are absent in non-pathogenic strains of the same or related species [54]. The presence of all four virulence genes were reported to be present in 87.2% of Salmonella isolated from patients with systemic infection [55] while 12.8% of Salmonella spp. isolated from stool samples lacked the misL and orfL gene. The spiC gene is found in the SPI-2 and is essential for systemic pathogenesis because it encodes a type III secretion system (T3SS) that is activated after invasion [56,57]. The T3SS system is used by the pathogen to deliver virulence factors to the host cell and interfere with or subvert normal host cell signaling pathways [58]. The misL gene located on SPI-3 encodes an autotransporter protein involved in intestinal colonization and essential for survival in macrophages [55,59]. The SPI-4 is a 25 kb pathogenicity island containing the orfL gene thought to encode a type 1 secretion system (an autotransporter protein) that mediate the secretion of toxins and is necessary for macrophage survival [55,59], while the pipD gene encodes effector proteins for the T3SS transport protein [29,30] and is mainly associated with enteropathogenesis [58]. The presence of these virulence genes in Salmonella spp. isolated from treated wastewater effluent and receiving surface water indicate the capabilities of these isolates in causing infections in susceptible hosts. Recently, there was report of an outbreak of acute gastroenteritis in KwaZulu-Natal, which was linked to food, contaminated with Salmonella enterica serovar Enteritidis resulting in the hospitalization of 216 people [60]. The report suggested a point source outbreak with a possibility of continued transmission. The true burden of Salmonella disease in Africa is unclear thus a comprehensive epidemiological study is needed to elucidate it. The Salmonella serotypes that most commonly cause invasive non-typhoidal Salmonella in Africa are S. typhimurium and S. enteritidis, which are usually associated with a broad host range and with enteric diseases [11].
Resistance against sulfamethoxazole (100%), nalidixic acid (27%) and streptomycin (14%) was observed among these isolates. Intermediate resistance was observed against streptomycin (74%), nalidixic acid (44%) and fosfomycin (8.5%). Resistance to nalidixic acid suggests possible resistance to third generation quinolones CLSI [31]. However, this was not observed in this study, as isolates resistant to nalidixic acid were also susceptible to the third generation quinolones tested. Previous studies have suggested that quinolones should not be used in the treatment of invasive Salmonellosis due to strains with decreased sensitivity to fluoroquinolones and possible risk of treatment failure [29,61]. The results obtained in this study further emphasize the need for prudent use of fluoroquinolones and other commonly used antibiotics to prevent the emergence of resistant phenotypes [62]. Consistent with this study, Salmonella spp. were reported to be highly sensitive to third generation β-lactams [29,59] but resistant to sulfamethoxazole, nalidixic acid and streptomycin. Data from the National Antimicrobial Resistance Monitoring Systems (NARMS) in the US from 1996 to 2004 showed increase in resistance of clinical isolates of Salmonella against antibiotics [63]. The upsurge in multidrug resistant strains of Salmonella over the past decade is threatening successful treatment of diseases caused by this organism especially in developing countries where disease burden is high [64].
In conclusion, this study revealed that treated effluents from WWTPs investigated are reservoirs of antibiotic resistant and virulent Salmonella spp. The isolates were susceptible to most third generation β lactams tested whilst exhibiting resistance to other antibiotics. The presence of virulence genes is indicative of their capabilities to cause infection in susceptible hosts. Though certain physicochemical parameters were within the stipulated guidelines, the overall quality of the treated effluent is still low. Thus, in order to protect the valuable surface water resources, urgent intervention is required by the regulatory authorities and workers in these treatment plants to optimize treatment efficiency. Constant surveillance of the treatment processes and final effluent, infrastructural upgrade of the wastewater treatment works and provision of adequate sanitation and sewage disposal systems to rural communities on the banks of rivers is recommended.

Acknowledgments

This study was supported by the Medical Research Council and the National Research Foundation of South Africa. Financial support from the College of Agriculture, Engineering and Science, University of KwaZulu-Natal in the form of a bursary to the first author is also acknowledged.

Author Contributions

Ejovwokoghene C. Odjadjare was involved in the acquisition and analysis of data, statistical analysis and manuscript draft. Ademola O. Olaniran conceptualized and designed the research, was involved in the research coordination, interpretation of data and critically reviewed the draft manuscript. Both authors read and approved the final manuscript.

Conflicts of Interest

The authors declare no conflict of interest.

References

  1. Pitman, W. Overview of water resource assessment in South Africa: Current state and future challenges. Water SA 2011, 37, 659–664. [Google Scholar] [CrossRef]
  2. Adewumi, J.R.; Ilemobade, A.A.; van Zyl, J.E. Treated wastewater reuse in South Africa: Overview, potential and challenges. Resour. Conserv. Recycl. 2010, 55, 221–231. [Google Scholar] [CrossRef]
  3. Ngwa, G.A.; Schop, R.; Weir, S.; León-Velarde, C.G.; Odumeru, J.A. Detection and enumeration of E. Coli O157:H7 in water samples by culture and molecular methods. J. Microbiol. Methods 2013, 92, 164–172. [Google Scholar] [CrossRef] [PubMed]
  4. Agrafioti, E.; Diamadopoulos, E. A strategic plan for reuse of treated municipal wastewater for crop irrigation on the island of crete. Agric. Water Manag. 2012, 105, 57–64. [Google Scholar] [CrossRef]
  5. Levantesi, C.; Bonadonna, L.; Briancesco, R.; Grohmann, E.; Toze, S.; Tandoi, V. Salmonella in surface and drinking water: Occurrence and water-mediated transmission. Food Res. Int. 2012, 45, 587–602. [Google Scholar] [CrossRef]
  6. Momba, M.N.B.; Osode, A.N.; Sibewu, M. The impact of inadequate wastewater treatment on the receiving water bodies—Case study: Buffalo City and Nkokonbe Municipalities of the Eastern Cape Province. Water SA 2006, 32, 687. [Google Scholar] [CrossRef]
  7. Igbinosa, E.O.; Okoh, A.I. Impact of discharge wastewater effluents on the physico-chemical qualities of a receiving watershed in a typical rural community. Int. J. Environ. Sci. Technol. 2009, 6, 175–182. [Google Scholar] [CrossRef]
  8. Petala, M.; Kokokiris, L.; Samaras, P.; Papadopoulos, A.; Zouboulis, A. Toxicological and ecotoxic impact of secondary and tertiary treated sewage effluents. Water Res. 2009, 43, 5063–5074. [Google Scholar] [CrossRef] [PubMed]
  9. Ratola, N.; Cincinelli, A.; Alves, A.; Katsoyiannis, A. Occurrence of organic microcontaminants in the wastewater treatment process. A mini review. J. Hazard. Mater. 2012, 239–240. [Google Scholar] [CrossRef] [PubMed]
  10. George, I.; Crop, P.; Servais, P. Fecal coliform removal in wastewater treatment plants studied by plate counts and enzymatic methods. Water Res. 2002, 36, 2607–2617. [Google Scholar] [CrossRef]
  11. Bertuzzo, E.; Azaele, S.; Maritan, A.; Gatto, M.; Rodriguez-Iturbe, I.; Rinaldo, A. On the space-time evolution of a cholera epidemic. Water Resour. Res. 2008, 44, W01424. [Google Scholar] [CrossRef]
  12. Soyer, Y.; Orsi, R.H.; Rodriguez-Rivera, L.D.; Sun, Q.; Wiedmann, M. Genome wide evolutionary analyses reveal serotype specific patterns of positive selection in selected Salmonella serotypes. BMC Evol. Biol. 2009, 9. [Google Scholar] [CrossRef] [PubMed]
  13. Fookes, M.; Schroeder, G.N.; Langridge, G.C.; Blondel, C.J.; Mammina, C.; Connor, T.R.; Seth-Smith, H.; Vernikos, G.S.; Robinson, K.S.; Sanders, M.; et al. Salmonella bongori provides insights into the evolution of the Salmonellae. PLoS Pathog. 2011, 7, 1–16. [Google Scholar]
  14. Majowicz, S.E.; Musto, J.; Scallan, E.; Angulo, F.J.; Kirk, M.; O’Brien, S.J.; Jones, T.F.; Fazil, A.; Hoekstra, R.M.; International Collaboration on Enteric Disease “Burden of Illness” Studies. The global burden of nontyphoidal Salmonella gastroenteritis. Clin. Infect. Dis. 2010, 50, 882–889. [Google Scholar] [CrossRef] [PubMed]
  15. Kotloff, K.L.; Blackwelder, W.C.; Nasrin, D.; Nataro, J.P.; Farag, T.H.; van Eijk, A.; Adegbola, R.A.; Alonso, P.L.; Breiman, R.F.; Golam Faruque, A.S.; et al. The Global Enteric Multicenter Study (GEMS) of diarrheal disease in infants and young children in developing countries: Epidemiologic and clinical methods of the case/control study. Clin. Infect. Dis. 2012, 55, S232–S245. [Google Scholar] [CrossRef] [PubMed]
  16. O’Brien, S.J. The “decline and fall” of nontyphoidal Salmonella in the United Kingdom. Clin. Infect. Dis. 2013, 56, 705–710. [Google Scholar] [CrossRef] [PubMed]
  17. Oluyege, J.O.; Dada, A.C.; Odeyemi, A.T. Incidence of multiple antibiotic resistant gram-negative bacteria isolated from surface and ground water sources in south western region of Nigeria. Water Sci. Technol. 2009, 59, 1929–1936. [Google Scholar] [CrossRef] [PubMed]
  18. Duffy, L.L.; Dykes, G.A.; Fegan, N. A review of the ecology, colonization and genetic characterization of Salmonella enterica serovar Sofia, a prolific but avirulent poultry serovar in Australia. Food Res. Int. 2012, 45, 770–779. [Google Scholar] [CrossRef]
  19. Oteo, J.; Lázaro, E.; de Abajo, F.J.; Baquero, F.; Campos, J.; Spanish Members of EARSS. Antimicrobial-resistant invasive Escherichia coli, Spain. Emerg. Infect. Dis. 2005, 11, 546–553. [Google Scholar] [CrossRef] [PubMed]
  20. Hendricks, R.; Pool, E.J. The effectiveness of sewage treatment processes to remove faecal pathogens and antibiotic residues. J. Environ. Sci. Health Pt. A Toxic. 2012, 47, 289–297. [Google Scholar] [CrossRef] [PubMed]
  21. Wani, D.; Pandit, A.K.; Kamili, A.N. Microbial assessment and effect of seasonal change on the removal efficiency of FAB based sewage treatment plant. J. Environ. Eng. Ecol. Sci. 2013, 2. [Google Scholar] [CrossRef]
  22. Godinho, V.; Nascimento, F.; Silva, S.; von Sperling, M. Characterisation of pathogenic bacteria in a UASB-polishing pond system using molecular techniques. Water Sci. Technol. 2010, 61, 813–819. [Google Scholar] [CrossRef] [PubMed]
  23. Levantesi, C.; la Mantia, R.; Masciopinto, C.; Böckelmann, U.; Ayuso-Gabella, M.N.; Salgot, M.; Tandoi, V.; van Houtte, E.; Wintgens, T.; Grohmann, E. Quantification of pathogenic microorganisms and microbial indicators in three wastewater reclamation and managed aquifer recharge facilities in Europe. Sci. Total Environ. 2010, 408, 4923–4930. [Google Scholar] [CrossRef] [PubMed]
  24. Olaniran, A.O.; Naidoo, S.; Pillay, B. Surveillance of invasive bacterial pathogens and human enteric viruses in wastewater final effluents and receiving water bodies—A case study from Durban, South Africa. CLEAN—Soil Air Water 2012, 40, 681–691. [Google Scholar] [CrossRef]
  25. Brichta-Harhay, D.M.; Arthur, T.M.; Bosilevac, J.M.; Guerini, M.N.; Kalchayanand, N.; Koohmaraie, M. Enumeration of Salmonella and Escherichia coli O157:H7 in ground beef, cattle carcass, hide and faecal samples using direct plating methods. J. Appl. Microbiol. 2007, 103, 1657–1668. [Google Scholar] [CrossRef] [PubMed]
  26. Espigares, E.; Bueno, A.; Espigares, M.; Gálvez, R. Isolation of Salmonella serotypes in wastewater and effluent: Effect of treatment and potential risk. Int. J. Hyg. Environ. Health 2006, 209, 103–107. [Google Scholar] [CrossRef] [PubMed]
  27. Akinbowale, O.L.; Peng, H.; Grant, P.; Barton, M.D. Antibiotic and heavy metal resistance in motile aeromonads and pseudomonads from rainbow trout (Oncorhynchus mykiss) farms in Australia. Int. J. Antimicrob. Agents 2007, 30, 177–182. [Google Scholar] [CrossRef] [PubMed]
  28. Gassama-Sow, A.; Wane, A.A.; Canu, N.A.; Uzzau, S.; Kane, A.A.; Rubino, S. Characterization of virulence factors in the newly described Salmonella enterica serotype keurmassar emerging in Senegal (sub-Saharan Africa). Epidemiol. Infect. 2006, 134, 741–743. [Google Scholar] [CrossRef] [PubMed]
  29. Lee, Y.J.; Kim, H.J.; Park, C.K.; Kim, K.S.; Bae, D.H.; Kang, M.S.; Cho, J.K.; Kim, A.R.; Kim, J.W.; Kim, B.H. Characterization of Salmonella spp. Isolated from an integrated broiler chicken operation in Korea. J. Vet. Med. Sci. 2007, 69, 399–404. [Google Scholar] [CrossRef] [PubMed]
  30. Dione, M.M.; Ikumapayi, U.; Saha, D.; Mohammed, N.I.; Adegbola, R.A.; Geerts, S.; Ieven, M.; Antonio, M. Antimicrobial resistance and virulence genes of non-typhoidal Salmonella isolates in the gambia and senegal. J. Infect. Dev. Ctries 2011, 5, 765–775. [Google Scholar] [PubMed]
  31. Performance Standards for Antimicrobial Susceptibility Testing; Seventeenth Informational Supplement. CLSI M100-S17. Clinical and Laboratory Standard Institute document. 2007. Available online: http://microbiolab-bg.com/wp-content/uploads/2015/05/CLSI.pdf (accessed on 13 August 2015).
  32. Wastewater Risk Abatement Plan: A Guideline to Plan and Manage Towards Safe and Compliant Wastewater Collection and Treatment in South Africa; Department of Water Affairs: Pretoria, South Africa, 2010.
  33. General and special standards. In Government Gazette; Department of Water Affairs: Pretoria, South Africa, 1984.
  34. Ntengwe, F.W. The cost benefit and efficiency of waste water treatment using domestic ponds—The ultimate solution in southern Africa. Phys. Chem. Earth Pt. A/B/C 2005, 30, 735–743. [Google Scholar] [CrossRef]
  35. Odjadjare, E.O.; Okoh, A. Physicochemical quality of an urban municipal wastewater effluent and its impact on the receiving environment. Environ. Monit. Assess. 2010, 170, 383–394. [Google Scholar] [CrossRef] [PubMed]
  36. Annalakshmi, G.; Amsath, A. An assessment of water quality of river cauvery and its tributaries arasalar with reference to physico-chemical parameters at Tanjore DT, Tamilnadu, India. Int. J. Appl. Biol. Pharm. Technol. 2012, 3, 269–279. [Google Scholar]
  37. Oyhakilome, G.I.; Aiyesanmi, A.F.; Coolborn, A.F. Water quality assessment of the Owena multi-purpose Dam, Ondo State, southwestern Nigeria. J. Environ. Prot. 2012, 3, 14–25. [Google Scholar]
  38. Altaher, H.; Alghamdi, A. Enhancement of quality of secondary industrial wastewater effluent by coagulation process: A case study. J. Environ. Prot. 2011, 2, 1250–1256. [Google Scholar] [CrossRef]
  39. Baršienė, J.; Andreikėnaitė, L.; Vosylienė, M.Z.; Milukaitė, A. Genotoxicity and immunotoxicity of wastewater effluents discharged from vilnius wastewater treatment plant. Acta Zool. Litu. 2009, 19, 188–196. [Google Scholar] [CrossRef]
  40. Singh, N.S.; Srivastava, G.; Bhatt, A. Physicochemical determination of pollutants in wastewater in Dheradun. Curr. World Environ. 2012, 7, 133–138. [Google Scholar]
  41. Bateman, C. Second report slams crippling neglect of water/sanitation systems. South Afr. Med. J. 2010, 100, 342–344. [Google Scholar]
  42. Odjadjare, E.E.; Igbinosa, E.O.; Mordi, R.; Igere, B.; Igeleke, C.L.; Okoh, A.I. Prevalence of multiple antibiotics resistant [MAR] pseudomonas species in the final effluents of three municipal wastewater treatment facilities in South Africa. Int. J. Environ. Res. Public Health 2012, 9, 2092–2107. [Google Scholar] [CrossRef] [PubMed]
  43. Igbinosa, E.O.; Obi, L.C.; Okoh, A.I. Occurrence of potentially pathogenic vibrios in final effluents of a wastewater treatment facility in a rural community of the Eastern Cape Province of South Africa. Res. Microbiol. 2009, 160, 531–537. [Google Scholar] [CrossRef] [PubMed]
  44. Samie, A.; Obi, C.L.; Igumbor, J.O.; Momba, M.N.B. Focus on 14 sewage treatment plants in the Mpumalanga province, South Africa in order to gauge the efficiency of wastewater treatment. Afr. J. Biotechnol. 2009, 8, 3276–3285. [Google Scholar]
  45. Dungeni, M.; Momba, M.N.B. The Efficiency of Waste Water Treatment Systems in Rural and Urban Areas in the Removal of Cryptosporidium and Giardia Species. Water SA 2010, 36, 425–432. [Google Scholar]
  46. Naidoo, S.; Olaniran, A.O. Treated wastewater effluent as a source of microbial pollution of surface water resources. Int. J. Environ. Res. Public Health 2014, 11, 249–270. [Google Scholar] [CrossRef] [PubMed]
  47. Girones, R.; Ferrús, M.A.; Alonso, J.L.; Rodriguez-Manzano, J.; Calgua, B.; de Abreu Corrêa, A.; Hundesa, A.; Carratala, A.; Bofill-Mas, S. Molecular detection of pathogens in water—The pros and cons of molecular techniques. Water Res. 2010, 44, 4325–4339. [Google Scholar] [CrossRef] [PubMed]
  48. Deekshit, V.K.; Kumar, B.K.; Rai, P.; Rohit, A.; Karunasagar, I. Simultaneous detection of Salmonella pathogenicity island 2 and its antibiotic resistance genes from seafood. J. Microbiol. Methods 2013, 93, 233–238. [Google Scholar] [CrossRef] [PubMed]
  49. Turki, Y.; Ouzari, H.; Mehri, I.; Ben Aissa, R.; Hassen, A. Biofilm formation, virulence gene and multi-drug resistance in Salmonella kentucky isolated in Tunisia. Food Res. Int. 2012, 45, 940–946. [Google Scholar] [CrossRef]
  50. Green Drop Report South Africa Wastewater Quality Performance; Department of Water Affairs: Pretoria, South Africa, 2009.
  51. Woldemicael, G. Diarrhoeal morbidity among young children in Eritrea: Environmental and socioeconomic determinants. J. Health Popul. Nutr. 2011, 19, 83–90. [Google Scholar]
  52. Wake, M.; Tolessa, C. Reducing diarrhoeal diseases: Lessons on sanitation from Ethiopia and Haiti. Int. Nurs. Rev. 2012, 59, 34–39. [Google Scholar] [CrossRef]
  53. Ijaz, M.K.; Rubino, J.R. Impact of infectious diseases on cognitive development in childhood and beyond: Potential mitigational role of hygiene. Open Infect. Dis. J. 2012, 6, 65–70. [Google Scholar] [CrossRef]
  54. Dobrindt, U.; Reidl, J. Pathogenicity islands and phage conversion: Evolutionary aspects of bacterial pathogenesis. Int. J. Med. Microbiol. 2000, 290, 519–527. [Google Scholar] [CrossRef]
  55. Sánchez-Jiménez, M.M.; Cardona-Castro, N.M.; Canu, N.; Uzzau, S.; Rubino, S. Distribution of pathogenicity islands among colombian isolates of Salmonella. J. Infect. Dev. Ctries 2010, 4, 555–559. [Google Scholar] [CrossRef] [PubMed]
  56. Hensel, M. Evolution of pathogenicity islands of Salmonella enterica. Int. J. Med. Microbiol. 2004, 294, 95–102. [Google Scholar] [CrossRef] [PubMed]
  57. Miki, T.; Okada, N.; Shimada, Y.; Danbara, H. Characterization of Salmonella pathogenicity island 1 type III secretion-dependent hemolytic activity in Salmonella enterica serovar typhimurium. Microb. Pathog. 2004, 37, 65–72. [Google Scholar] [CrossRef] [PubMed]
  58. Marcus, S.L.; Brumell, J.H.; Pfeifer, C.G.; Finlay, B.B. Salmonella pathogenicity islands: Big virulence in small packages. Microb. Infect. 2000, 2, 145–156. [Google Scholar] [CrossRef]
  59. Xia, X.; Zhao, S.; Smith, A.; McEvoy, J.; Meng, J.; Bhagwat, A.A. Characterization of Salmonella isolates from retail foods based on serotyping, pulse field gel electrophoresis, antibiotic resistance and other phenotypic properties. Int. J. Food Microbiol. 2009, 129, 93–98. [Google Scholar] [CrossRef] [PubMed]
  60. Niehaus, A.J.; Apalata, T.; Coovadia, Y.M.; Smith, A.M.; Moodley, P. An outbreak of foodborne Salmonellosis in rural Kwazulu-Natal, South Africa. Foodborne Pathog. Dis. 2011, 8, 693–697. [Google Scholar] [CrossRef] [PubMed]
  61. Tajbakhsh, M.; Hendriksen, R.; Nochi, Z.; Zali, M.; Aarestrup, F.; Garcia-Migura, L. Antimicrobial resistance in Salmonella spp. Recovered from patients admitted to six different hospitals in Tehran, Iran from 2007 to 2008. Folia Microbiol. 2012, 57, 91–97. [Google Scholar] [CrossRef] [PubMed]
  62. Hur, J.; Jawale, C.; Lee, J.H. Antimicrobial resistance of Salmonella isolated from food animals: A review. Food Res. Int. 2012, 45, 819–830. [Google Scholar] [CrossRef]
  63. Bacterial Foodborne and Diarrheal Disease National Case Surveillance; Centers for disease control and prevention, U.S. Department of health and human services: Atlanta, GA, USA, 2007.
  64. Wellington, E.M.H.; Boxall, A.B.A.; Cross, P.; Feil, E.J.; Gaze, W.H.; Hawkey, P.M.; Johnson-Rollings, A.S.; Jones, D.L.; Lee, N.M.; Otten, W.; et al. The role of the natural environment in the emergence of antibiotic resistance in gram-negative bacteria. Lancet Infect. Dis. 2013, 13, 155–165. [Google Scholar] [CrossRef]

