
Inpatient Hospitalization Costs: A Comparative Study of Micronesians, Native Hawaiians, Japanese, and Whites in Hawai‘i

Abstract
:1. Introduction
2. Experimental Section
2.1. Data
2.2. Sample
2.3. Costs
2.4. APR-DRGs
2.5. Analyses Samples
2.6. Race/Ethnicity
2.7. Insurance Status
2.8. Control Variables
2.9. Statistical Analysis
3. Results and Discussion
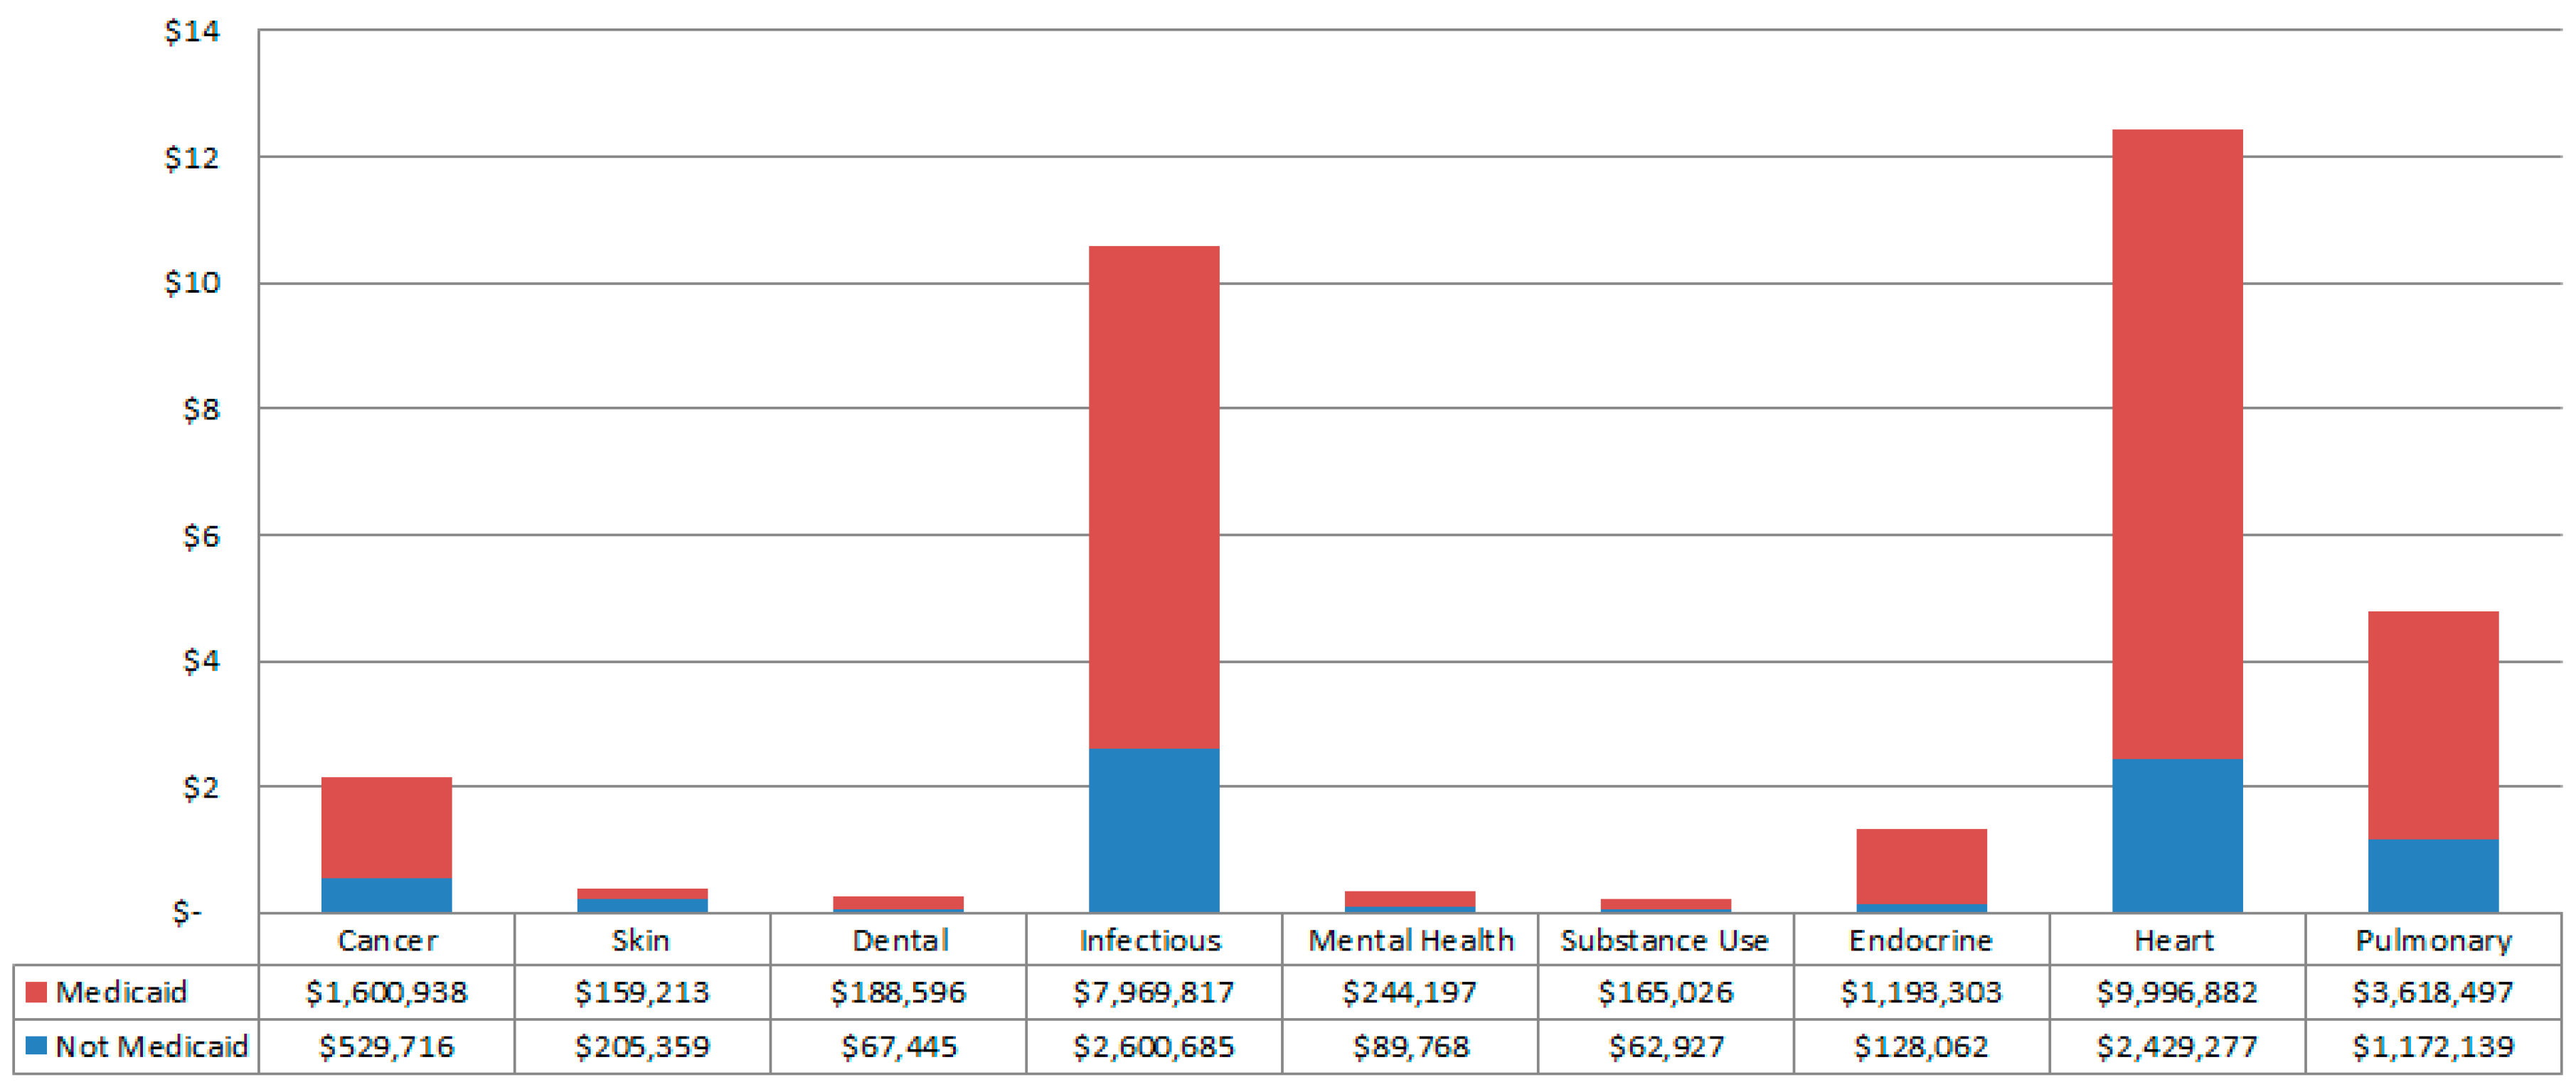
3.1. Total Costs

| Micronesian | Native Hawaiian | Japanese | White | |
|---|---|---|---|---|
| Total n | 3486 | 37,734 | 49,105 | 71,827 |
| % of sample | 2.2% | 23.3% | 30.3% | 44.3% |
| Costs | ||||
| Total Costs | $58.1 million | $571.0 million | $725.1 million | $1051.0 million |
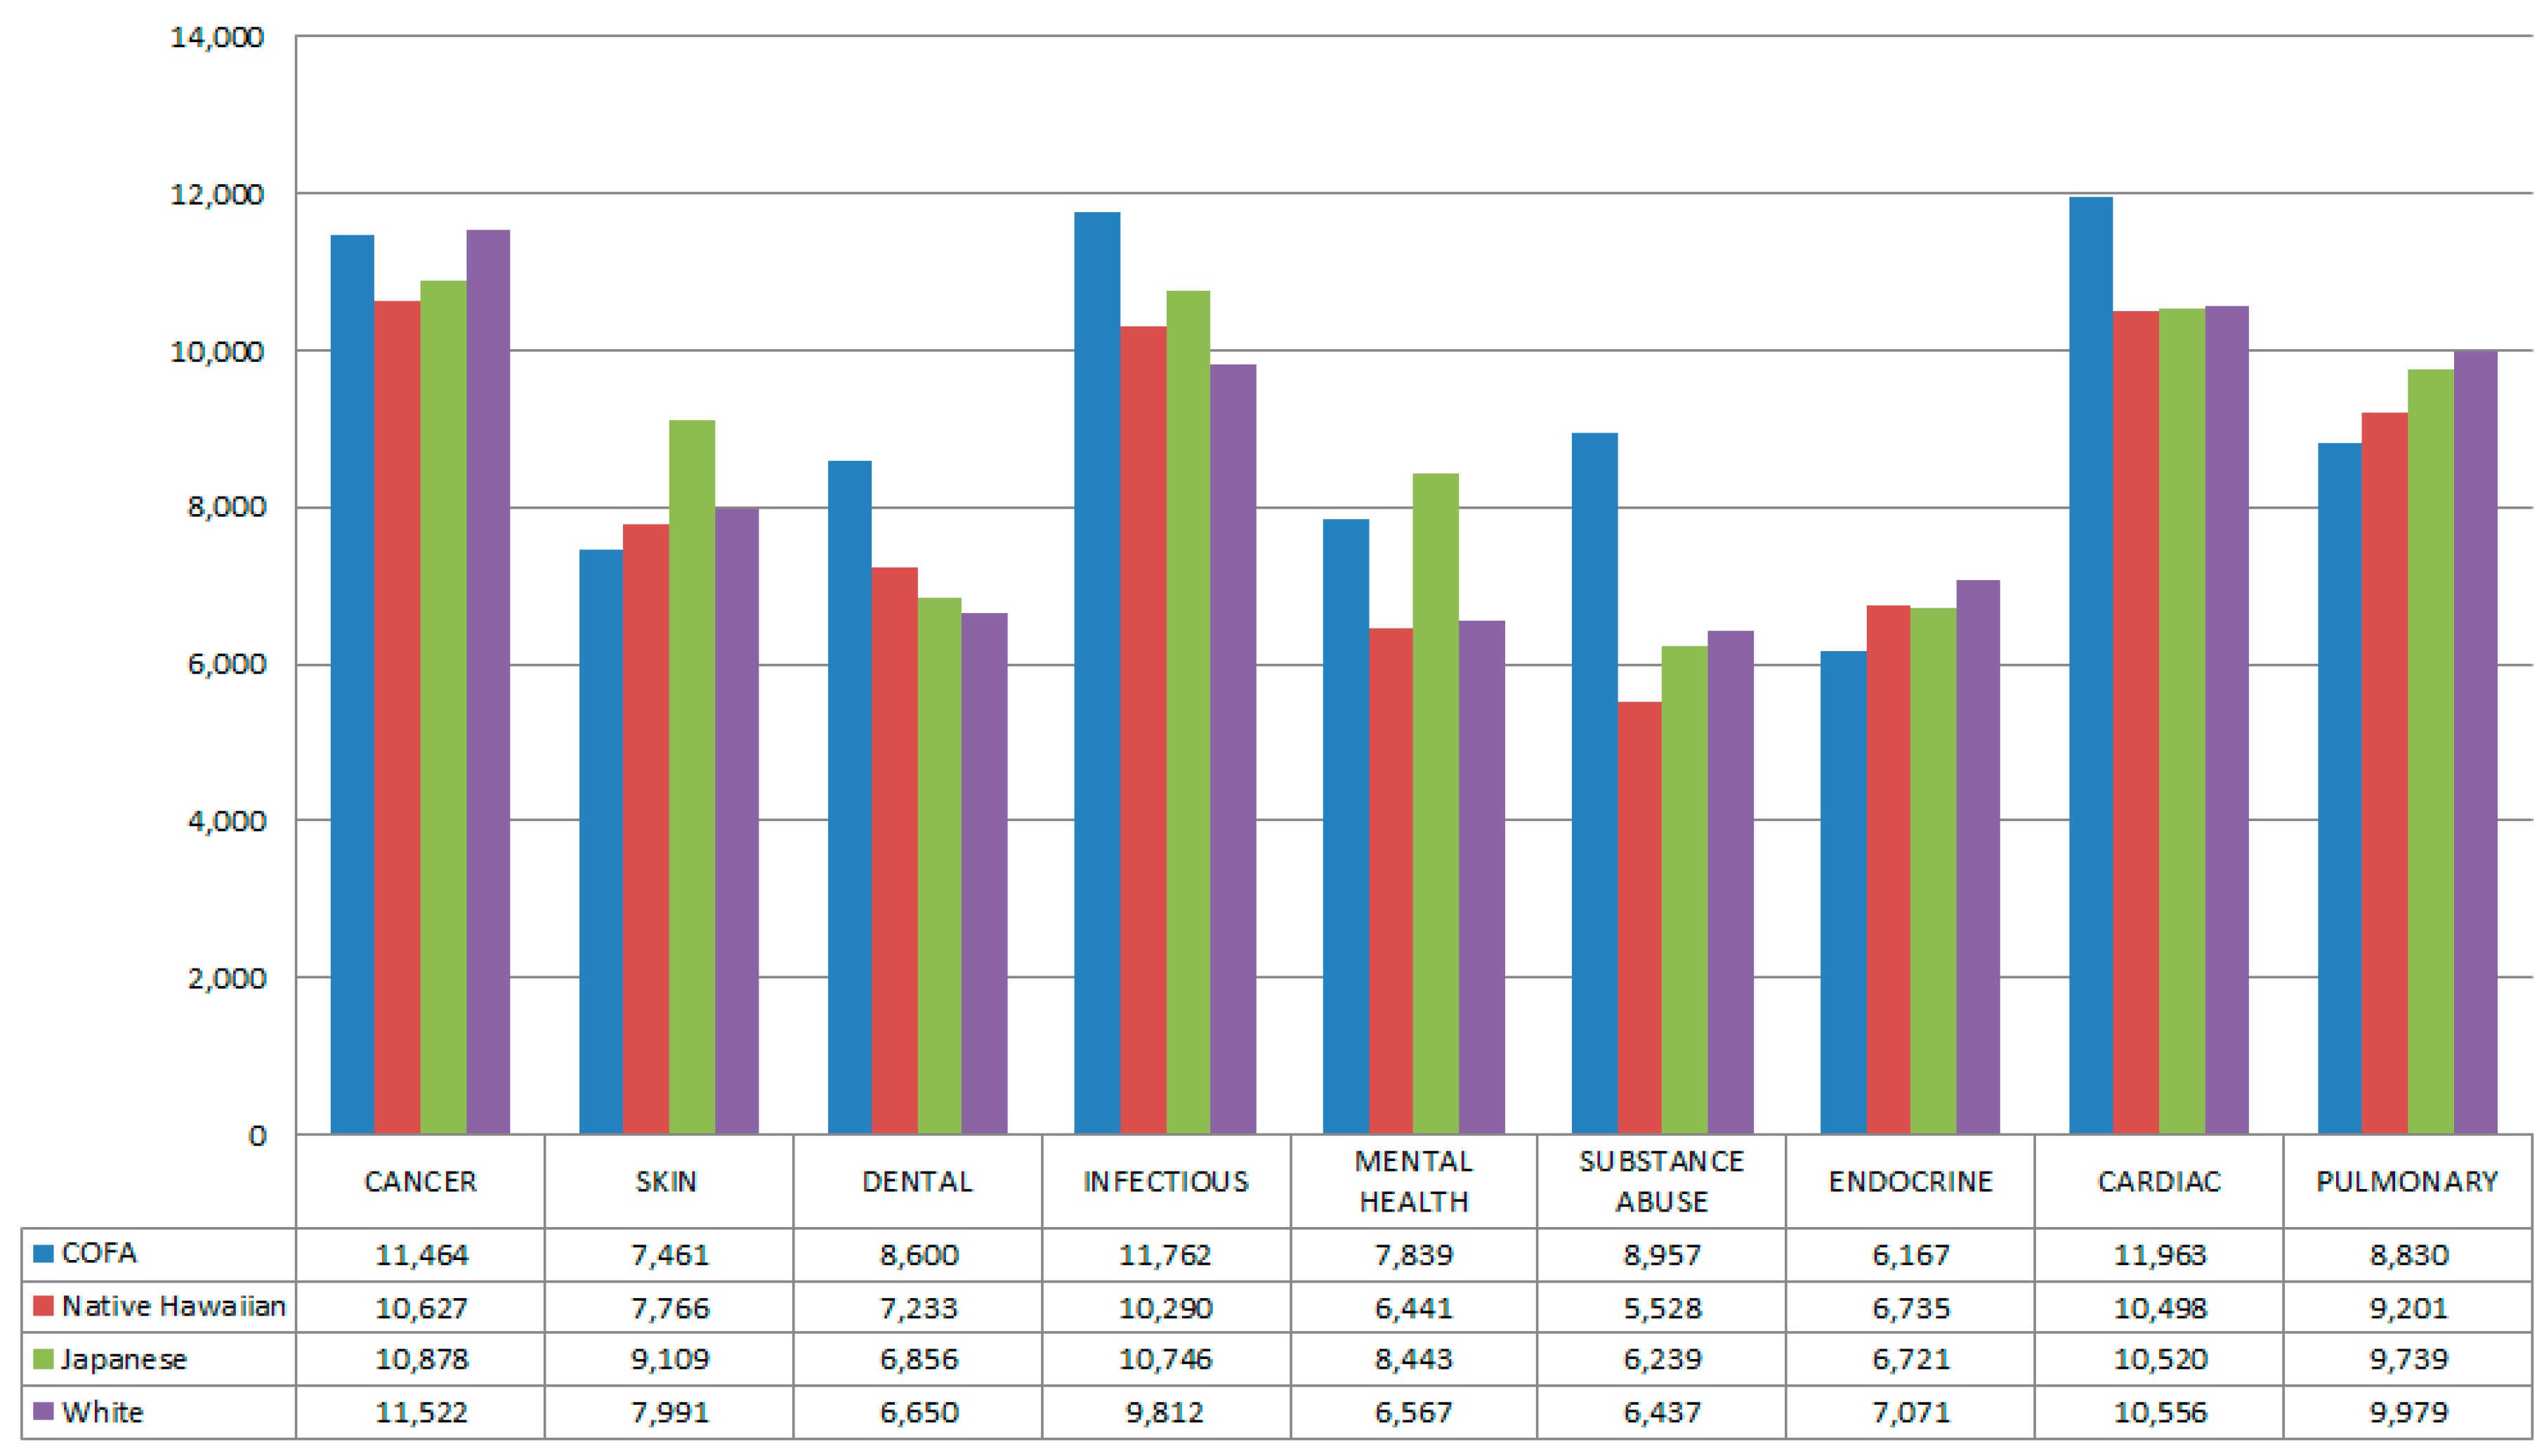
| Median Cost/hospitalization 1 | $9833 | $9349 | $9752 | $9595 |
| Medicaid 1 | ||||
| % Not Medicaid | 25% | 77% | 97% | 85% |
| % Medicaid | 75% | 23% | 3% | 15% |

3.2. Unadjusted Costs

3.3. Multivariable Models
3.3.1. Without SOI
3.3.2. With SOI
| Costs (Not Including SOI) | Costs (Including SOI) | ||||||
|---|---|---|---|---|---|---|---|
| Native Hawaiian | Japanese | White | Native Hawaiian | Japanese | White | ||
| n | Relative Risk (95% CI) | Relative Risk (95% CI) | Relative Risk (95% CI) | Relative Risk (95% CI) | Relative Risk (95% CI) | Relative Risk (95% CI) | |
| Overall hospitalizations | 162,152 | 0.88 (0.84–0.93) | 0.82 (0.77–0.86) | 0.83 (0.79–0.87) | 0.95 (0.92–0.99) | 0.97 (0.93–1.00) | 0.99 (0.96–1.03) |
| Cancer | 4172 | 1.16 (0.86–1.32) | 1.07 (0.86–1.33) | 1.11 (0.89–1.37) | 1.04 (0.87–1.23) | 1.12 (0.94–1.33) | 1.15 (0.97–1.37) |
| Skin | 997 | 0.95 (0.63–1.46) | 0.94 (0.61–1.47) | 0.92 (0.60–1.40) | 1.11 (0.82–1.53) | 1.12 (0.81–1.55) | 1.12 (0.82–1.53) |
| Dental | 694 | 0.88 (0.62–1.27) | 0.84 (0.58–1.22) | 0.81 (0.57–1.16) | 0.85 (0.65–1.11) | 0.81 (0.61–1.07) | 0.84 (0.64–1.10) |
| Infectious | 13,171 | 0.85 (0.74–0.98) | 0.80 (0.69–0.93) | 0.78 (0.67–0.90) | 0.97 (0.88–1.06) | 0.97 (0.88–1.07) | 1.00 (0.91–1.10) |
| Mental Health | 4993 | 0.89 (0.46–1.71) | 1.06 (0.54–2.08) | 0.81 (0.41–1.55) | 0.86 (0.46–1.60) | 1.01 (0.54–1.91) | 0.81 (0.44–1.50) |
| Substance Abuse | 1764 | 0.62 (0.39–0.999) | 0.59 (0.36–0.97) | 0.68 (0.43–1.08) | 0.83 (0.59–1.18) | 0.79 (0.55–1.14) | 0.88 (0.62–1.23) |
| Endocrine | 4055 | 1.05 (0.82–1.35) | 1.00 (0.77–1.28) | 0.99 (0.77–1.27) | 1.10 (0.91–1.32) | 1.11 (0.92–1.34) | 1.11 (0.92–1.34) |
| Cardiac | 26,127 | 0.86 (0.78–0.95) | 0.85 (0.77–0.94) | 0.83 (0.75–0.91) | 0.88 (0.82–0.97) | 0.94 (0.87–1.01) | 0.93 (0.86–1.003) |
| Pulmonary | 13,476 | 1.02 (0.88–1.17) | 0.99 (0.86–1.14) | 1.08 (0.94–1.24) | 0.97 (.88–1.08) | 1.03 (0.92–1.14) | 1.08 (0.97–1.20) |

3.4. Discussion
3.5. Limitations
4. Conclusions
Acknowledgments
Author Contributions
Conflicts of Interest
Appendix
| Disease Category | Sub-Category | Specific APR-DRG Codes Included |
|---|---|---|
| Cancer | Cancer | 003, 041, 110, 136, 240, 281, 343, 362, 382, 442, 461, 500, 511, 512, 530, 690, 691, 693, 694 |
| Chronic Disease | Endocrine | 420, 421, 422, 423, 424, 425 |
| Heart | 022, 045, 047, 160, 161, 162, 163, 165, 166, 167, 170, 171, 173, 174, 175, 176, 177, 180, 190, 191, 192, 193, 194, 196, 197, 198, 199, 200, 201, 203, 204, 205, 206, 207 | |
| Pulmonary | 113, 120, 121, 130, 131, 132, 133, 134, 135, 137, 138, 139, 140, 141, 142, 143, 144 | |
| Infectious | Infectious | 049, 051, 050, 344, 383, 710, 720, 723, 724, 890, 892, 893, 894 |
| Behavioral | Mental Health | 740, 750, 751, 752, 753, 754, 755, 756, 757, 758, 759, 760 |
| Substance Abuse | 280, 770, 772, 773, 774, 775, 776 | |
| Other | Skin | 380, 381, 384, 385 |
| Dental | 098, 114, 115 |
| Cancer | Skin | Dental | Infectious | Mental Health | Substance Abuse | Endocrine | Cardiac | Pulmonary | Overall | |
|---|---|---|---|---|---|---|---|---|---|---|
| Coefficient (95% CI) | Coefficient (95% CI) | Coefficient (95% CI) | Coefficient (95% CI) | Coefficient (95% CI) | Coefficient (95% CI) | Coefficient (95% CI) | Coefficient (95% CI) | Coefficient (95% CI) | Coefficient (95% CI) | |
| Age | 0.999 (0.996–1.002) | 1.001 (1.00–1.01) | 1.01 (1.004–1.01) | 1.001 (1.000–1.003) | 1.01 (1.01–1.02) | 1.018 (1.015–1.022) | 1.001 (0.998–1.004) | 0.997 (0.996–0.998) | 1.000 (0.998–1.001) | 1.003 (1.0028–1.004) |
| Female | 0.85 (0.80–0.91) | 1.02 (0.88–1.18) | 0.99 (0.87–1.12) | 1.91 (0.87–0.96) | 1.04 (0.94–1.15) | 0.93 (0.84–1.02) | 0.97 (0.90–1.05) | 0.89 (0.86–0.91) | 0.94 (0.90–0.97) | 0.89 (0.87–0.90) |
| Location | ||||||||||
| Hawai‘i, not Oahu | 1.04 (0.97–1.11) | 1.02 (0.87–1.19) | 1.09 (0.95–1.24) | 1.04 (0.98–1.10) | 1.40 (1.26–1.54) | 1.21 (1.09–1.33) | 1.14 (1.04–1.25) | 1.09 (1.06–1.13) | 1.06 (1.02–1.11) | 1.05 (1.03–1.07) |
| Oahu | - | - | - | - | - | - | - | - | - | - |
| Not from Hawai‘i | 0.90 (0.75–1.07) | 0.71 (0.51–0.99) | 0.89 (0.68–1.15) | 0.98 (0.88–1.11) | 1.17 (0.90–1.51) | 1.42 (1.14–1.78) | 1.04 (0.85–1.27) | 1.08 (1.02–1.14) | 0.96 (0.89–1.04) | 1.02 (0.98–1.05) |
| Payer | ||||||||||
| DOD | 0.92 (0.69–1.22) | 1.14 (0.67–1.95) | 1.23 (0.83–1.84) | 1.09 (0.90–1.33) | 0.92 (0.69–1.21) | 1.62 (1.20–2.20) | 1.42 (0.99–2.03) | 1.03 (0.93–1.13) | 1.05 (0.91–1.20) | 1.07 (1.02–1.13) |
| Medicaid | 1.17 (1.04–1.30) | 1.17 (0.92–1.49) | 1.10 (0.90–1.32) | 1.01 (0.93–1.09) | 1.02 (0.90–1.15) | 1.05 (0.93–1.18) | 1.08 (0.93–1.25) | 1.04 (0.99–1.10) | 1.02 (0.95–1.10) | 1.03 (1.00–1.05) |
| Medicare | 1.15 (1.06–1.26) | 1.02 (0.88–1.36) | 0.89 (0.75–1.07) | 1.10 (1.03–1.18) | 1.34 (1.15–1.56) | 1.00 (0.86–1.17) | 1.05 (0.93–1.18) | 1.09 (1.05–1.13) | 1.11 (1.05–1.18) | 1.07 (1.05–1.10) |
| Private | - | - | - | - | - | - | - | - | - | - |
| Self-Pay | 1.41 (1.08–1.85) | 1.02 (0.76–1.37) | 1.26 (0.98–1.61) | 0.92 (0.81–1.06) | 0.88 (0.72–1.08) | 0.93 (0.79–1.10) | 0.92 (0.69–1.23) | 1.03 (0.94–1.12) | 0.91 (0.81–1.03) | 1.14 (1.10–1.19) |
| Cancer | Skin | Dental | Infectious | Mental Health | Substance Abuse | Endocrine | Cardiac | Pulmonary | Overall | |
|---|---|---|---|---|---|---|---|---|---|---|
| Coefficient (95% CI) | Coefficient (95% CI) | Coefficient (95% CI) | Coefficient (95% CI) | Coefficient (95% CI) | Coefficient (95% CI) | Coefficient (95% CI) | Coefficient (95% CI) | Coefficient (95% CI) | Coefficient (95% CI) | |
| Severity of Illness | 1.50 (1.46–1.54) | 1.60 (1.50–1.71) | 1.46 (1.38–1.54) | 1.87 (1.84–1.90) | 1.38 (1.28–1.49) | 1.68 (1.61–1.75) | 1.51 (1.46–1.56) | 1.46 (1.45–1.48) | 1.58 (1.55–1.60) | 1.56 (1.55–1.56) |
| Age | 0.99 (0.992–0.991) | 1.004 (0.999–1.007) | 1.00 (1.00–1.01) | 0.995 (0.993–0.996 | 1.01 (1.004–1.01) | 1.01 (1.0003–1.009) | 1.00 (0.998–1.003) | 0.99 (0.99–0.995) | 0.9967 (0.9956–0.998) | 0.9995 (0.998–0.9999) |
| Female | 0.98 (0.93–1.03) | 1.05 (0.95–1.53) | 1.02 (0.93–1.12) | 0.96 (0.93–0.99) | 1.03 (0.94–1.13) | 0.98 (0.91–1.06) | 1.01 (0.95–1.07) | 0.88 (0.86–0.90) | 0.99 (0.96–1.02) | 0.95 (0.94–0.95) |
| Location | ||||||||||
| Hawai‘i, not Oahu | 1.04 (0.98–1.09) | 1.10 (0.98–1.23) | 1.11 (1.01–1.23) | 1.16 (1.12–1.21) | 1.41 (1.28–1.55) | 1.20 (1.12–1.29) | 1.17 (1.10–1.25) | 1.12 (1.10–1.15) | 1.13 (1.09–1.17) | 1.12 (1.10–1.13) |
| Oahu | - | - | - | - | - | - | - | - | - | - |
| Not from Hawai‘i | 0.80 (0.70–0.93) | 0.91 (0.82–1.53) | 0.93 (0.76–1.14) | 1.05 (0.96–1.13) | 1.18 (0.93–1.51) | 1.31 (1.12–1.54) | 1.12 (0.97–1.30) | 1.09 (1.05–1.14) | 1.00 (0.94–1.07) | 1.03 (1.01–1.06) |
| Payer | ||||||||||
| DOD | 0.86 (0.69–1.07) | 1.12 (0.95–1.17) | 1.19 (0.88–1.62) | 1.09 (0.96–1.24) | 0.91 (0.70–1.18) | 1.33 (1.06–1.66) | 1.24 (0.95–1.14) | 0.92 (0.85–1.00) | 1.02 (0.92–1.12) | 0.97 (0.93–1.00) |
| Medicaid | 1.00 (0.91–1.09) | 1.17 (0.98–1.40) | 1.02 (0.88–1.18) | 1.07 (1.01–1.12) | 1.01 (0.89–1.13) | 1.06 (0.97–1.15) | 1.03 (0.92–1.14) | 0.95 (0.91–0.99) | 0.99 (0.93–1.04) | 0.93 (0.92–0.95) |
| Medicare | 1.05 (0.97–1.12) | 0.96 (0.81–1.13) | 0.89 (0.77–1.01) | 1.04 (0.99–1.09) | 1.27 (1.10–1.46) | 1.07 (0.96–1.20) | 0.98 (0.90–1.08) | 1.00 (0.97–1.03) | 1.04 (0.99–1.08) | 0.97 (0.95–0.98) |
| Private | - | - | - | - | - | - | - | - | - | - |
| Self-Pay | 1.12 (0.91–1.39) | 1.17 (0.94–1.46) | 1.17 (0.98–1.41) | 1.08 (0.99–1.19) | 0.90 (0.74–1.09) | 0.97 (0.86–1.10) | 0.92 (0.74–1.14) | 0.92 (0.86–0.99) | 0.95 (0.87–1.04) | 1.05 (1.02–1.08) |
References
- Empowering Pacific Islander Communities (EPIC). Available online: http://empoweredpi.org/wp-content/uploads/2014/06/A_Community_of_Contrasts_NHPI_US_2014-1.pdf (accessed on 5 August 2015).
- MacNaughton, N.; Jones, M. Health concerns of Micronesian peoples. J. Transcult. Nurs. 2013, 24, 305–312. [Google Scholar] [PubMed]
- Yamada, S.; Pobutsky, A. Micronesian migrant health issues in Hawaii: Part 1: Background, home island data, and clinical evidence. Calif. J. Health Promot. 2009, 7, 16–31. [Google Scholar]
- Riklon, S.; Alik, W.; Hixon, A.; Palafox, N. The compact impact in hawai‘i: Focus on health care. Hawaii Med. J. 2010, 69, 7–12. [Google Scholar] [PubMed]
- Shek, D.; Yamada, S. Health care for Micronesians and constitutional rights. Hawaii Med. J. 2011, 70, 4–8. [Google Scholar] [PubMed]
- Beck, H.L.; Bouville, A.; Moroz, B.E.; Simon, S.L. Fallout deposition in the Marshall Islands from Bikini and Enewetak nuclear weapons tests. Health Phys. 2010, 99, 124–142. [Google Scholar] [PubMed]
- Yamada, S.; Akiyama, M. “For the good of mankind”—The legacy of nuclear testing in Micronesia. Soc. Med. 2014, 8, 83–92. [Google Scholar]
- Honolulu Civil Beat. Available online: http://www.civilbeat.com/topics/compact-of-free-association/ (accessed on 5 August 2015).
- Micronesian Seminar. Available online: http://www.micsem.org/pubs/counselor/frames/microsabroadfr.htm (accessed on 5 August 2015).
- Pobutsky, A.; Krupitsky, D.; Yamada, S. Micronesian migrant health issues in Hawaii: Part 2: An assessment of health, language and key social determinants of health. Calif. J. Health Promot. 2009, 7, 32–55. [Google Scholar]
- Hagiwara, M.K.I.; Yamada, S.; Tanaka, W.; Ostrowski, D. Litigation and community advocacy to ensure health access for Micronesian migrants in Hawai‘i. J. Health Care Poor Underserved 2015, 26, 137–145. [Google Scholar] [PubMed]
- McElfish, P.A.; Hallgren, E.; Yamada, S. Effect of US health policies on health care access for Marshallese migrants. Am. J. Public Health 2015, 105, 637–643. [Google Scholar] [PubMed]
- Hawaii State Legislature. House Concurrent Resolution: H.C.R. 158. Available online: http://www.capitol.hawaii.gov/session2009/Bills/HCR158_.HTM (accessed on 5 August 2015).
- State of Hawaii Department of Human Services Med-QUEST Division. Update from the Med- QUEST Division, November 19–20, 2014. Available online: http://www.capitol.hawaii.gov/session2014/testimony/Info_Testimony_HMS-HLT_11-19-14_MQD.pdf (accessed on 5 August 2015).
- Hawaii State Legislature. H.C.R 203/H.R.139—Requesting The Auditor to Conduct a Review on the Effect of the Transfer from Medicaid to Plans on the Hawaii health Connector for Non-eligible Medicaid Compact of Free Association Residents. Available online: http://www.capitol.hawaii.gov/Session2015/Testimony/HCR203_TESTIMONY_HUS-HLT_03-19-15_.PDF (accessed on 5 August 2015).
- Braun, K.L.; Yang, H.; Onalka, A.T.; Horiuch, B.Y. Life and death in Hawaii: Ethnic variations in life expectancy and mortality, 1980 and 1990. Hawaii Med. J. 1996, 55, 278–283. [Google Scholar] [PubMed]
- Park, C.B.; Braun, K.L.; Horiuchi, B.Y.; Tottori, C.; Onaka, A.T. Longevity disparities in multiethnic Hawaii: An analysis of 2000 life tables. Public Health Rep. 2009, 124, 579–584. [Google Scholar] [PubMed]
- Sentell, T.; Miyamura, J.; Ahn, H.J.; Chen, J.J.; Seto, T.; Juarez, D. Potentially preventable hospitalizations for congestive heart failure among Asian Americans and Pacific Islanders in Hawai‘i. J. Immigr. Minor Health 2015, 17, 1289–1297. [Google Scholar] [PubMed]
- Mau, M.K.; Sinclair, K.; Saito, E.P.; Baumhofer, K.N.; Kaholokula, J.K. Cardiometabolic health disparities in native Hawaiians and other pacific islanders. Epidemiol. Rev. 2009, 31, 113–129. [Google Scholar] [PubMed]
- Hawai’i Health Information Corporation. Hawaii Inpatient Data User Dictionary. Available online: http://hhic.org/files/IP_User_Dictionary-090214_(2).pdf (accessed on 5 August 2015).
- Agency for Health Care Research and Quality (AHRQ); Healthcare Cost and Utilization Project (HCUP). Cost To Charge Ratio Files. Rockville, MD, USA, August 2013. Available online: http://www.hcup-us.ahrq.gov/db/state/costtocharge.jsp (accessed on 5 August 2015). [Google Scholar]
- Lipscomb, J.; Weinstein, M.C.; Torrance, G.W. Time preference. In Cost-Effectiveness in Health and Medicine; Gold, M., Siegel, J., Russell, L.B., Weinstein, M.C., Eds.; Oxford University Press: New York, NY, USA, 1996. [Google Scholar]
- Healthcare Cost and Utilization Project. All Patient Refined Diagnosis Related Groups (APR-DRGs). Methodology Overview. Available online: https://www.hcup-us.ahrq.gov/db/nation/nis/APR-DRGsV20MethodologyOverviewandBibliography.pdf (accessed on 5 August 2015).
- Healthcare Economist: Unbiased Analysis of Today’s Healthcare Issues. Available online: http://healthcare-economist.com/2012/06/19/what-is-the-difference-between-drgs-ap-drgs-and-apr-drgs/ (accessed on 15 September 2015).
- Hagiwara, M.K.I.; Yamada, S.; Miyamura, J.; Sentell, T. Micronesians are hospitalized younger and often sicker than other racial/ethnic groups in Hawai‘i. Am. J. Public Health. (under review).
- West Hawaii Today. Available online: http://westhawaiitoday.com/sections/news/local-news/access-health-care-top-issue-facing-hawaii-island-assessment-finds.html (accessed on 5 August 2015).
- StataCorp. Stata Statistical Software: Release 12; StataCorp LP: College Station, TX, USA, 2011. [Google Scholar]
- Basu, A.; Manning, W.G.; Mullahy, J. Comparing alternative models: Log versus Cox proportional hazard? Health Econ. 2004, 13, 749–765. [Google Scholar] [PubMed]
- Dodd, S.; Bassi, A.; Bodger, K.; Williamson, P. A comparison of multivariable regression models to analyses cost data. J. Eval. Clin. Pract. 2006, 12, 76–86. [Google Scholar] [PubMed]
- Health Care Costs Institute. Health Care Costs and Utilization Report: 2011. Available online: http://www.healthcostinstitute.org/files/HCCI_HCCUR2011.pdf (accessed on 5 August 2015).
- USA Today. Dilemma Over Deductibles: Costs Crippling Middle Class. Available online: http://www.usatoday.com/story/news/nation/2015/01/01/middle-class-workers-struggle-to-pay-for-care-despite-insurance/19841235/ (accessed on 5 August 2015).
- Keshavjee, S. Blind Spot: How Neoliberalism Infiltrated Global Health; University of California Press: Oakland, CA, USA, 2014; p. 131. [Google Scholar]
- Stephens, J.; Artiga, S. Kaiser Family Foundation’s Commission on Medicaid and the Uninsured. Available online: https://kaiserfamilyfoundation.files.wordpress.com/2013/03/8279-02.pdf (accessed on 29 September 2015).
- Abbas, D.; Person, D.A. The Pacific Island Health Care Project (PIHCP): Experience with rheumatic heart disease (RHD) from 1998 to 2006. Hawaii Med. J. 2008, 12, 326–329. [Google Scholar]
© 2015 by the authors; licensee MDPI, Basel, Switzerland. This article is an open access article distributed under the terms and conditions of the Creative Commons by Attribution (CC-BY) license (http://creativecommons.org/licenses/by/4.0/).
Share and Cite
Hagiwara, M.; Juarez, D.T.; Yamada, S.; Miyamura, J.; Sentell, T. Inpatient Hospitalization Costs: A Comparative Study of Micronesians, Native Hawaiians, Japanese, and Whites in Hawai‘i. Int. J. Environ. Res. Public Health 2016, 13, 29. https://0-doi-org.brum.beds.ac.uk/10.3390/ijerph13010029
Hagiwara M, Juarez DT, Yamada S, Miyamura J, Sentell T. Inpatient Hospitalization Costs: A Comparative Study of Micronesians, Native Hawaiians, Japanese, and Whites in Hawai‘i. International Journal of Environmental Research and Public Health. 2016; 13(1):29. https://0-doi-org.brum.beds.ac.uk/10.3390/ijerph13010029
Chicago/Turabian StyleHagiwara, Megan, Deborah Taira Juarez, Seiji Yamada, Jill Miyamura, and Tetine Sentell. 2016. "Inpatient Hospitalization Costs: A Comparative Study of Micronesians, Native Hawaiians, Japanese, and Whites in Hawai‘i" International Journal of Environmental Research and Public Health 13, no. 1: 29. https://0-doi-org.brum.beds.ac.uk/10.3390/ijerph13010029