Article

The Relation of Moderate Alcohol Consumption to Hyperuricemia in a Rural General Population

1
Department of Cardiology, the First Hospital of China Medical University, Shenyang 110001, China
2
Department of Pharmacy, Zhongda Hospital, Southeast University, Nanjing 210009, China
3
Department of Cardiology, Johns Hopkins University, Baltimore, MD 21205, USA
*
Author to whom correspondence should be addressed.
Int. J. Environ. Res. Public Health 2016, 13(7), 732; https://0-doi-org.brum.beds.ac.uk/10.3390/ijerph13070732
Submission received: 4 June 2016 / Revised: 12 July 2016 / Accepted: 13 July 2016 / Published: 20 July 2016

Abstract

:
Background: although alcohol abuse is known to increase serum uric acid, the relation between moderate drinking and uric acid have remained poorly understood. We performed this study to evaluate whether different alcohol consumption level has different effects on the risk of hyperuricemia based on a rural general population. Method: multi-stage cluster sampling method was used to select a representative sample of individuals aged 35 years or older. Participants were asked to provide information about their alcohol consumption. Data regarding the demographic and lifestyle characteristics and the blood biochemical indexes of these participants were collected by well-trained personnel. Results: in total, 11,039 participants aged 35 years or older were included (4997 men and 6042 women). The prevalence of hyperuricemia in the different male alcohol consumption groups was 11.9% in non-drinkers, 12.6% in moderate drinkers, and 16.3% in heavy drinkers (p < 0.001). In females, the rates were 6.3% in non-drinkers, 8.1% in moderate drinkers, and 6.6% for heavy drinkers (p = 0.818). In males, multivariate logistic regression analyses shows heavy drinkers had an approximately 1.7-fold higher risk of hyperuricemia (OR: 1.657, 95% CI: 1.368 to 2.007, p < 0.001) than non-drinkers; moderate drinkers did not experience a significant increase in risk (OR: 1.232, 95% CI: 0.951 to 1.596, p = 0.114)). Multivariate logistic regression analyses of females showed that, compared with non-drinkers, neither moderate nor heavy drinkers had a significantly increased risk of hyperuricemia (OR: 1.565, 95% CI: 0.521 to 4.695, p = 0.425 for heavy drinkers; OR: 0.897, 95% CI: 0.117 to 6.855, p = 0.916 for moderate drinkers). Conclusions: heavy alcohol consumption increased the risk of hyperuricemia for males but not for females. Among both males and females, moderate alcohol consumption did not increase the risk of hyperuricemia.

1. Introduction

Data has shown the incidence of hyperuricemia is increasing worldwide [1,2,3]. Such an epidemic has deleterious consequences on quality of life and may increase cardiovascular mortality [4,5,6,7,8]. Recent studies suggest that moderate alcohol consumption is associated with a low risk of cancer and coronary heart disease [9,10,11]. However, there is a lack of studies which evaluate the effect of moderate alcohol consumption on serum uric acid. Among 2062 healthy volunteers, Alatalo et al. reported the serum uric acid concentrations in male moderate drinkers were significantly higher, and in females they were lower, than in the corresponding groups of abstainers [12]. The report which is based on the Third National Health and Nutrition Examination Survey in America suggested that the effect of individual alcoholic beverages on serum uric acid levels varied substantially: beer conferred a larger increase than liquor, whereas moderate wine drinking did not increase serum uric acid levels [13].
Until now, few studies have focused on the relation between moderate alcohol consumption and serum uric acid level in a general population. If there is a different effect of high and moderate alcohol consumption on uric acid in a general crowd, it would have practical implications for prevention and management of hyperuricemia in the real world. Thus, we performed the present study to evaluate whether different alcohol consumption has different effects on the risk of hyperuricemia in a general population from rural China, with the aim of providing evidence that may be useful for the prospective study on management of individuals with different alcohol consumption rates.

2. Methods

2.1. Study Population

The detailed methods have been previously published [14,15]. This study adopted a multistage, stratified, random cluster sampling scheme. From January 2012 to August 2013, a representative sample of individuals who were at 35 years of age or older was selected in order to examine the prevalence, incidence, and natural history of cardiovascular risk factors in Liaoning Province. In the first stage, three counties (Dawa, Zhangwu, and Liaoyang County) were selected randomly to represent the eastern, southern, and northern regions of Liaoning province. In the second stage, one town was randomly selected from each county (a total of three towns). In the third stage, 8–10 rural villages from each town were randomly selected (a total of 26 rural villages). Participants that were pregnant, had malignant tumors, malnutrition, hepatic disease, and or mental disorders were excluded from the present study. All eligible permanent residents aged ≥35 years from each village were invited to participate in the study (a total of 14,016 potential participants). Of those, 11,956 participants agreed to participate in the present study (response rate of 85.3%). This research was approved by the Ethics Committee of China Medical University (Shenyang, China, AF-SDP-07-1, 0-01). Procedures were performed in accordance with ethical standards. Written consent was obtained from each participant, after they had been informed of the objectives, benefits, medical items, and confidentiality agreement of personal information. If the participants were illiterate, we obtained written informed consents from their close relatives. We used baseline data in this report, and only participants who had complete data sets for the variables analyzed were included, yielding a final sample size of 11,039 individuals (4997 males and 6042 females).

2.2. Data Collection and Measurements

Via an interview with a standardized questionnaire, data was obtained on demographics, lifestyle, dietary habits, and history of disease. Using the questionnaire, the information of “any self-reported medication used in the past two weeks” was recorded including any medication used over the past two weeks by the participants. Blood pressure was measured three times at 2-min intervals after at least 5 min of rest using a standardized automatic electronic sphygmomanometer (HEM-907; Omron, Tokyo, Japan) according to American Heart Association protocol, which had been validated according to the British Hypertension Society protocol. The participants were advised to avoid caffeinated beverages and exercise for at least 30 min before the measurement. During the measurement, the participants were seated with their arm supported at the level of the heart. The mean of three blood pressure (BP) measurements was calculated and used in all analyses. Blood samples were obtained from all of the subjects in the morning after at least 12 h of fasting. Serum uric acid, as well as other routine blood biochemical indexes, were analyzed using an auto-analyzer (Olympus AU 640; Olympus Corp., Kobe, Japan). Details of data collection and measurements methods of this study were described elsewhere [16,17].

2.3. Alcohol Consumption Assessment

Alcohol consumption was assessed during the interview using the questionnaire. Participants were asked to provide information regarding whether they regularly consumed alcohol, their average alcohol consumption per day, and the number of days per month that they consumed alcohol. The ethanol weight content differed among beverages: 5% for beer, 12.5% for red wine, and 45% for hard liquor. One drink was defined as an average of 15 g of ethanol [18]. We used cut-off values based on the definition of daily alcohol consumption from the National Institute on Alcohol Abuse and Alcoholism to classify the participants’ level of consumption: non-drinkers (abstainers, no alcohol consumption history), moderate drinkers (up to 1 drink/day for women and up to 2 drinks/day for men), and heavy drinkers (>1 drink/day for women and >2 drinks/day for men) [19].

2.4. Definitions

Hyperuricemia was defined as serum uric acid ≥416 μmol/L in men and ≥357 μmol/L in women according to guidelines [20]. According to the Seventh Report of the Joint National Committee, hypertension is defined as a systolic BP (SBP) above 140 mm Hg and/or a diastolic BP (DBP) above 90 mm Hg and/or use of antihypertensive medications [21]. According to the World Health Organization (WHO) criteria, obese was defined as body mass index (BMI) values ≥30 kg/m2 [12]. Dyslipidemia was determined by the National Cholesterol Education Program, Third Adult Treatment Panel criteria [22]. Fasting plasma glucose (FPG) above 7 mmol/L (126 mg/dL) and/or receiving treatment for diabetes was diagnosed as diabetes according to the WHO criteria [23]. Using the Chronic Kidney Disease Epidemiology Collaboration equation, the glomerular filtration rate (GFR) was estimated [24]. Decreased eGFR was defined as an estimated GFR (eGFR) <60 mL/min/1.73 m2 [25].

2.5. Statistical Analysis

As described in detail previously [16,17], descriptive statistics were calculated for all the variables, including continuous variables (expressed as the mean values and standard deviations) and categorical variables (expressed as numbers and proportions). Differences among categories were evaluated using a t-test, an ANOVA, non-parametric tests or a χ2 test, as appropriate. Comparisons between groups were performed using the Scheffe method. Multivariate logistic regression analyses were used to identify independent associations between weight, metabolic status, and prolonged QTc in different models by calculating the odds ratios (ORs) and corresponding 95% confidence intervals (CIs). All of the statistical analyses were performed using SPSS version 20.0 software, and p values less than 0.05 were considered to be statistically significant.

3. Result

3.1. Baseline Characteristics of the Study Population by Gender

The baseline characteristics of the included participants are shown in Table 1. In total, 11,039 participants aged 35 years or older were included (4997 men and 6042 women). Male participants had a higher rate of current drinking than females (44.9% vs. 2.90%, p < 0.001). The percentage of non-, moderate, and heavy drinkers in males was 50.5%, 15.0%, and 34.5%, respectively; the percentage of non-, moderate, and heavy drinkers in females was 96.8%, 1.2%, and 2.0%, respectively. The mean level of uric acid was 333.3 ± 83.5 mmol/L in males and 255.8 ± 67.7 mmol/L in females. The total mean alcohol consumption per day was also lower in females than in males (1.0 ± 8.3 g/d vs. 32.6 ± 49.6 g/d, p < 0.001). Alcohol consumption from beer was 3.9 ± 12.8 g/d for males and 0.1 ± 2.0 g/d for females. Alcohol consumption from liquor was 28.6 ± 46.9 g/d for males and 0.9 ± 7.7 g/d for females. Alcohol consumption from wine was 0.0 ± 1.8 g/d for males and 0.0 ± 0.0 g/d for females.

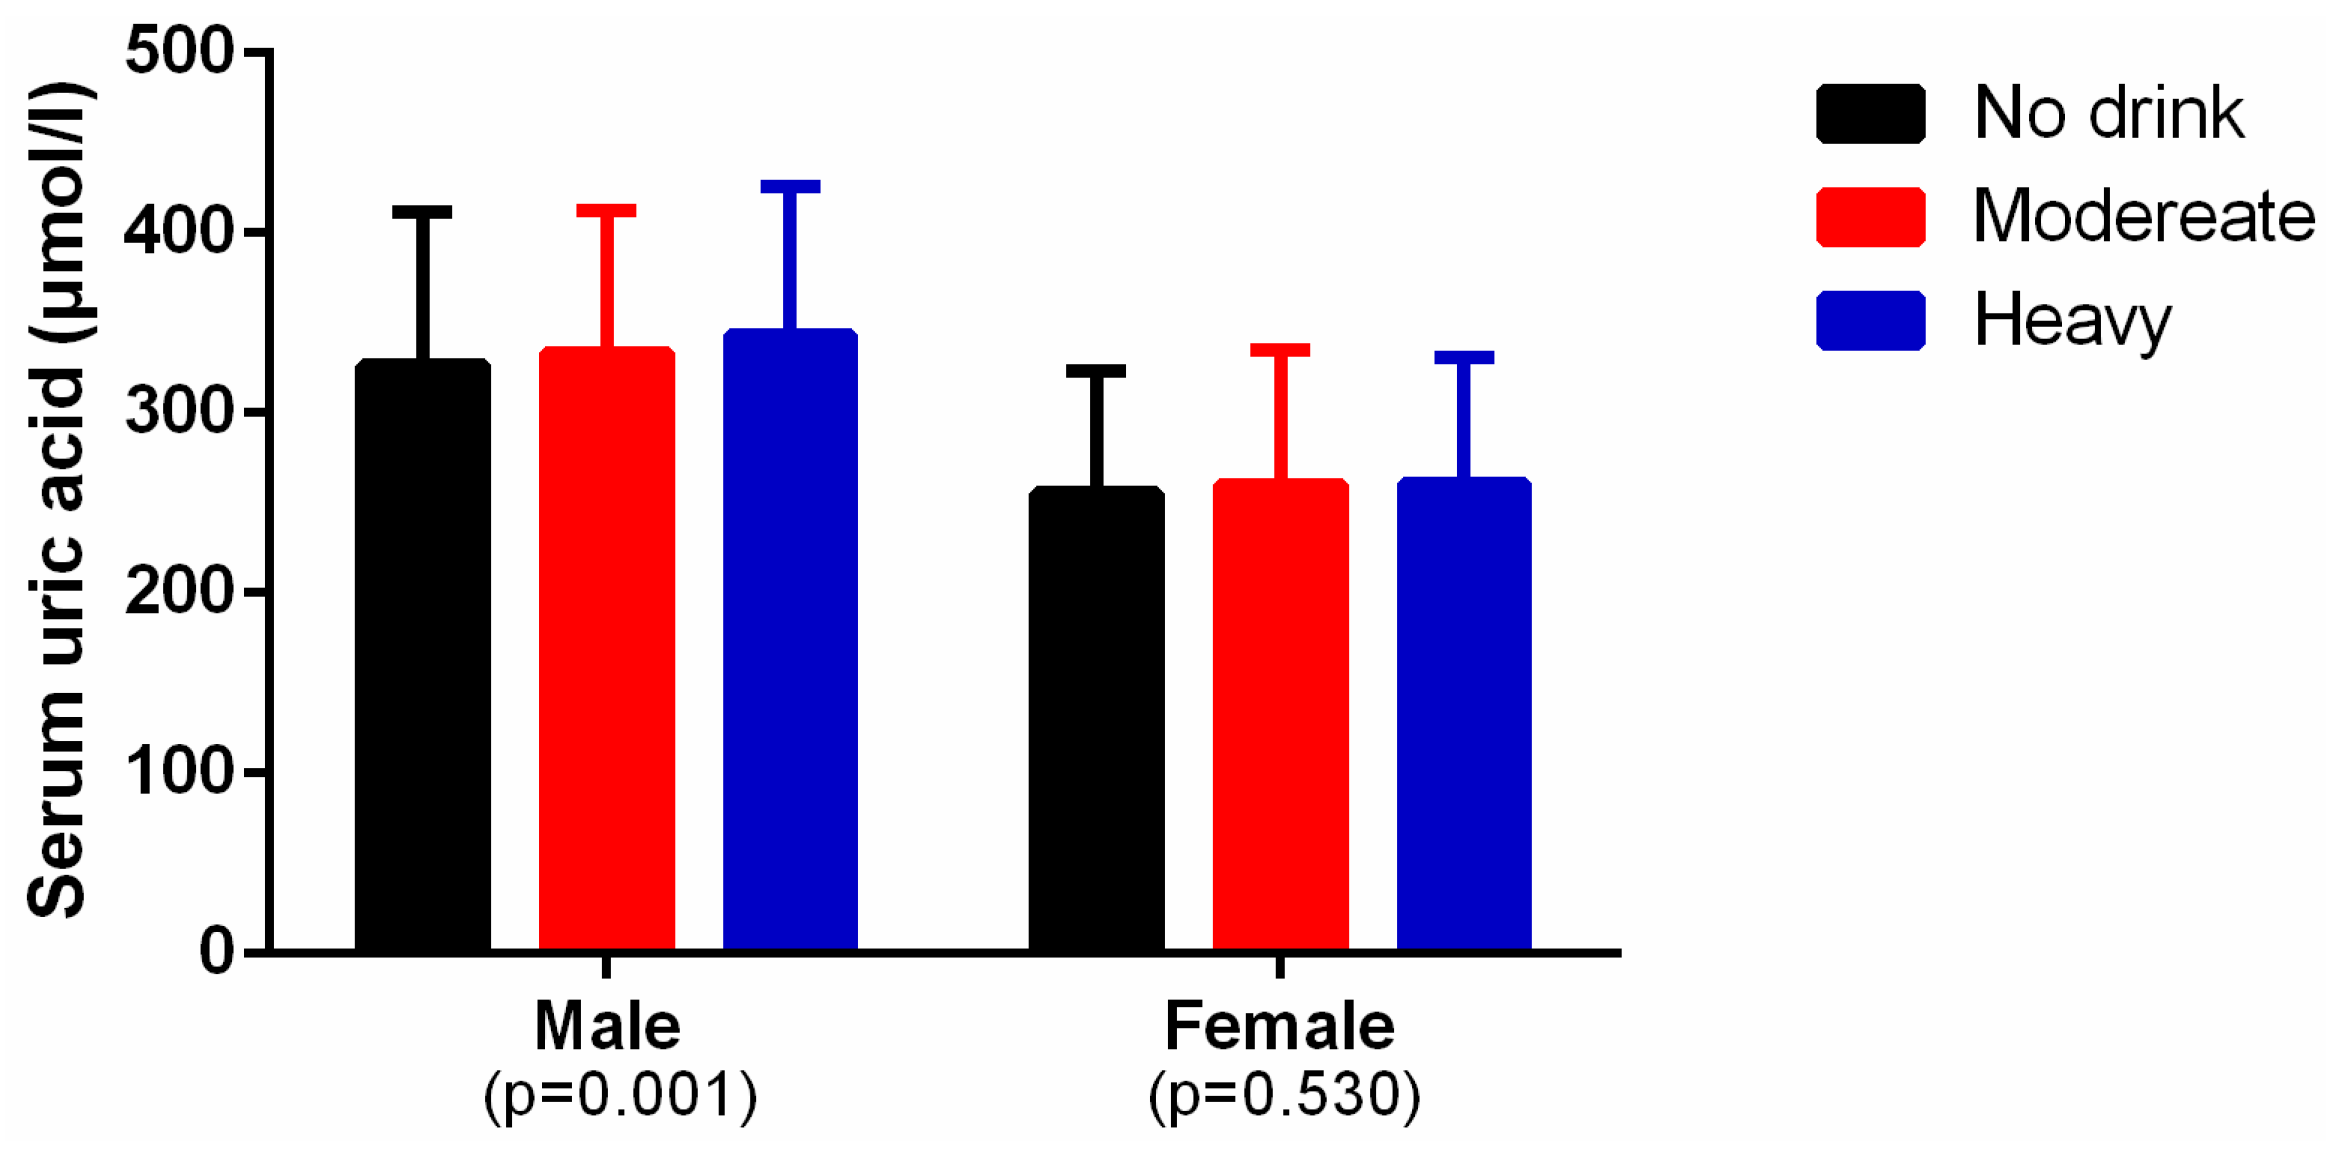
3.2. Levels of Alcohol Consumption and Serum Uric Acid

As shown in Figure 1, among the males, the mean level of serum uric acid was higher in heavy and moderate drinkers than in the non-drinkers (heavy vs. non-drinker: 343.0 ± 83.2 vs. 326.6 ± 84.7 mmol/L, p < 0.001; moderate vs. non-drinker: 333.4 ± 78.8 vs. 326.6 ± 84.7, p = 0.027). Among the females, there was no difference among the three groups. Figure 2 shows the prevalence of hyperuricemia in the different male alcohol consumption groups was 11.9% in non-drinkers, 12.6% in moderate drinkers, and 16.3% in heavy drinkers (p < 0.001). In females, the rates were 6.3% in non-drinkers, 8.1% in moderate drinkers, and 6.6% for heavy drinkers (p = 0.818). Alcohol consumption was much higher in males with hyperuricemia than in those without hyperuricemia (38.6 ± 2.0 g/d vs. 31.6 ± 0.75 g/d, p = 0.001) (Figure 3). Alcohol consumption was slightly higher in females with hyperuricemia than in those without hyperuricemia; however, the difference was not significant (1.1 ± 0.4 g/d vs. 1.0 ± 0.1 g/d, p = 0.530) (Figure 4).

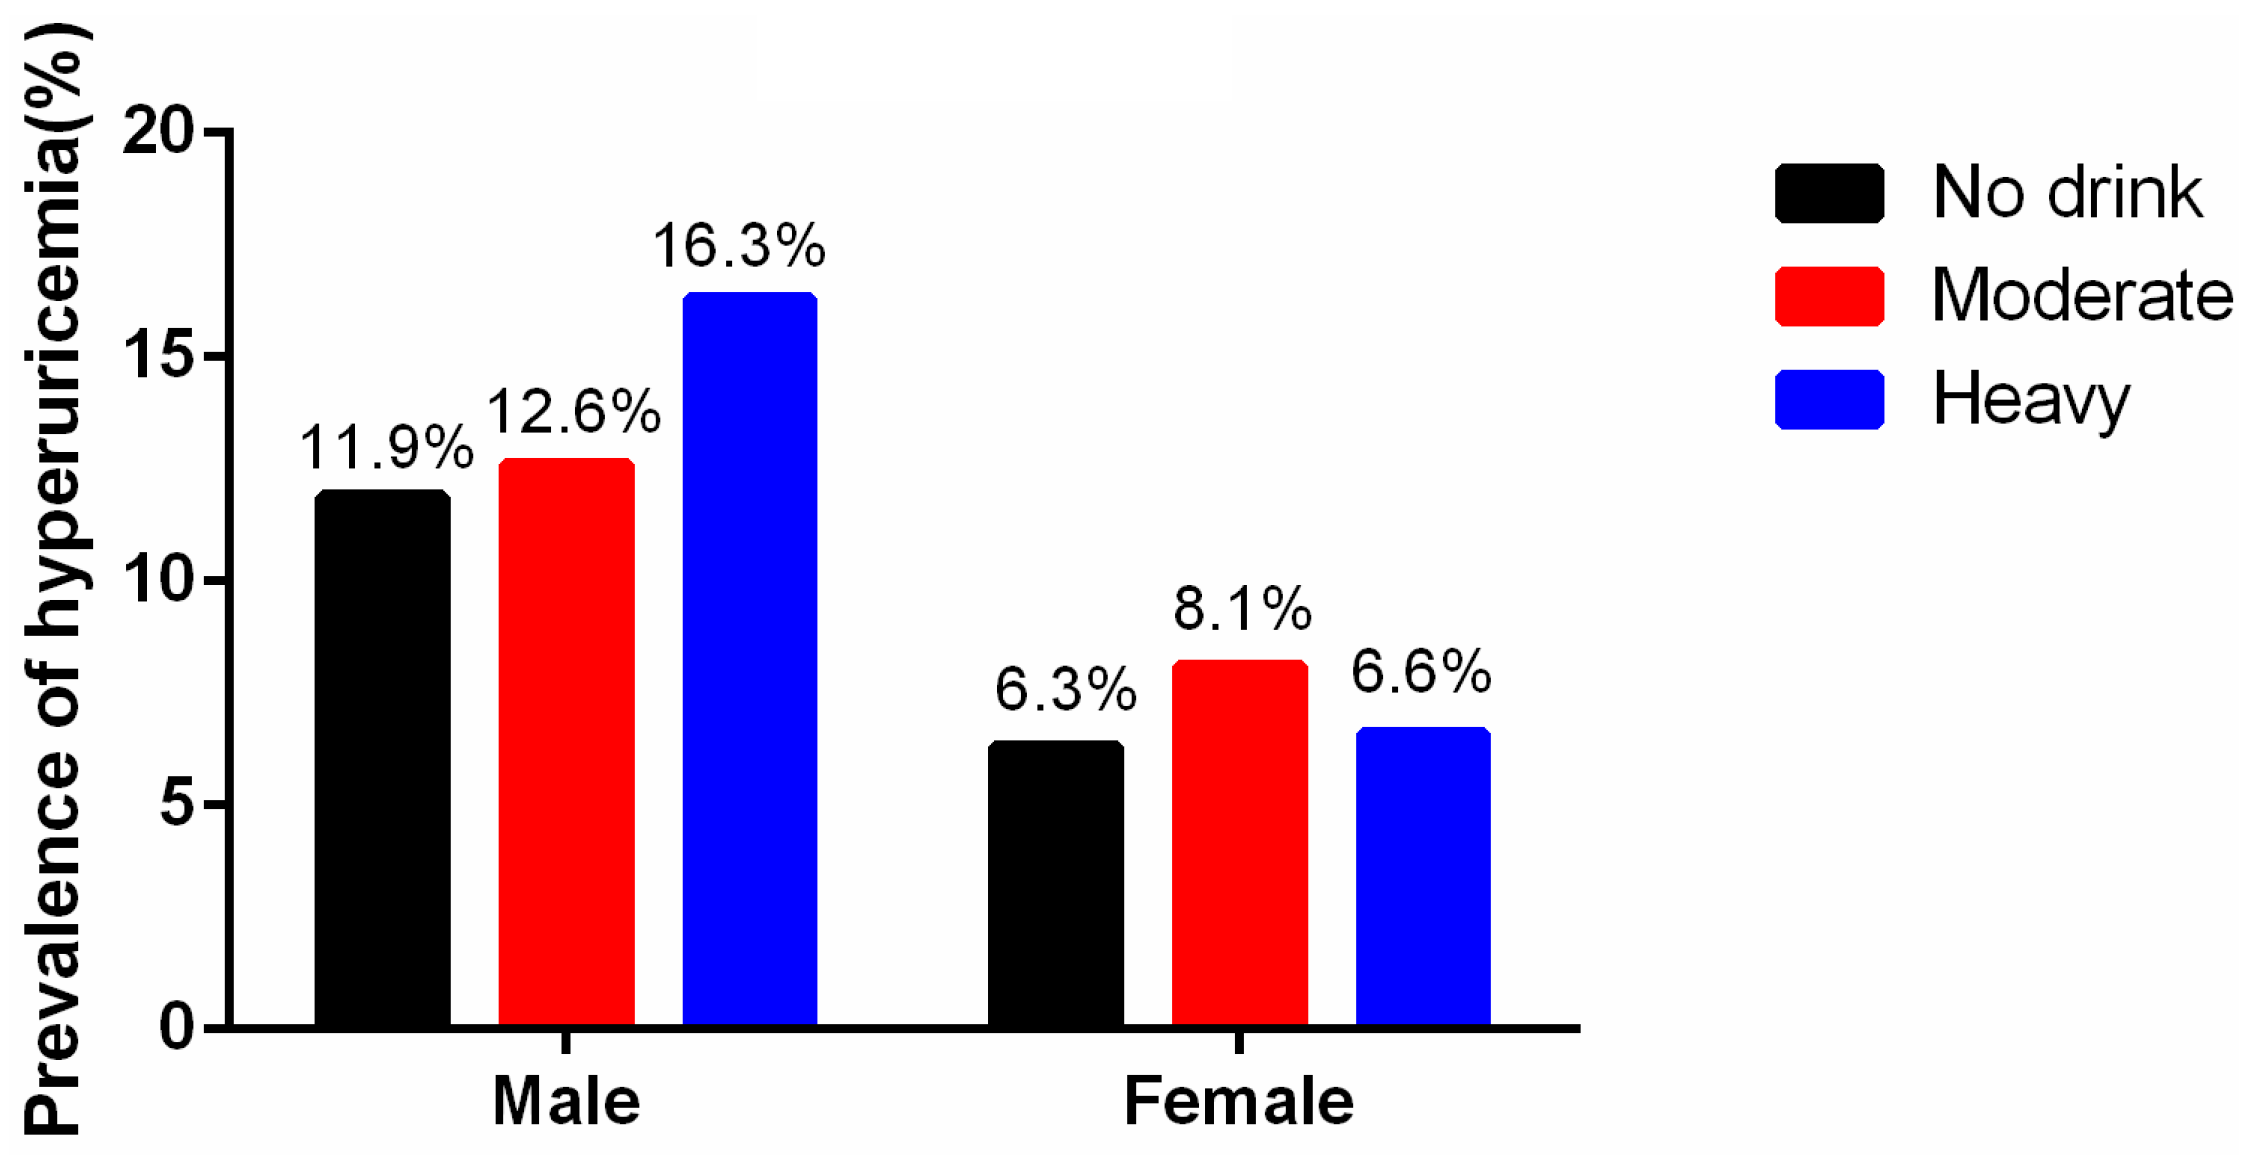
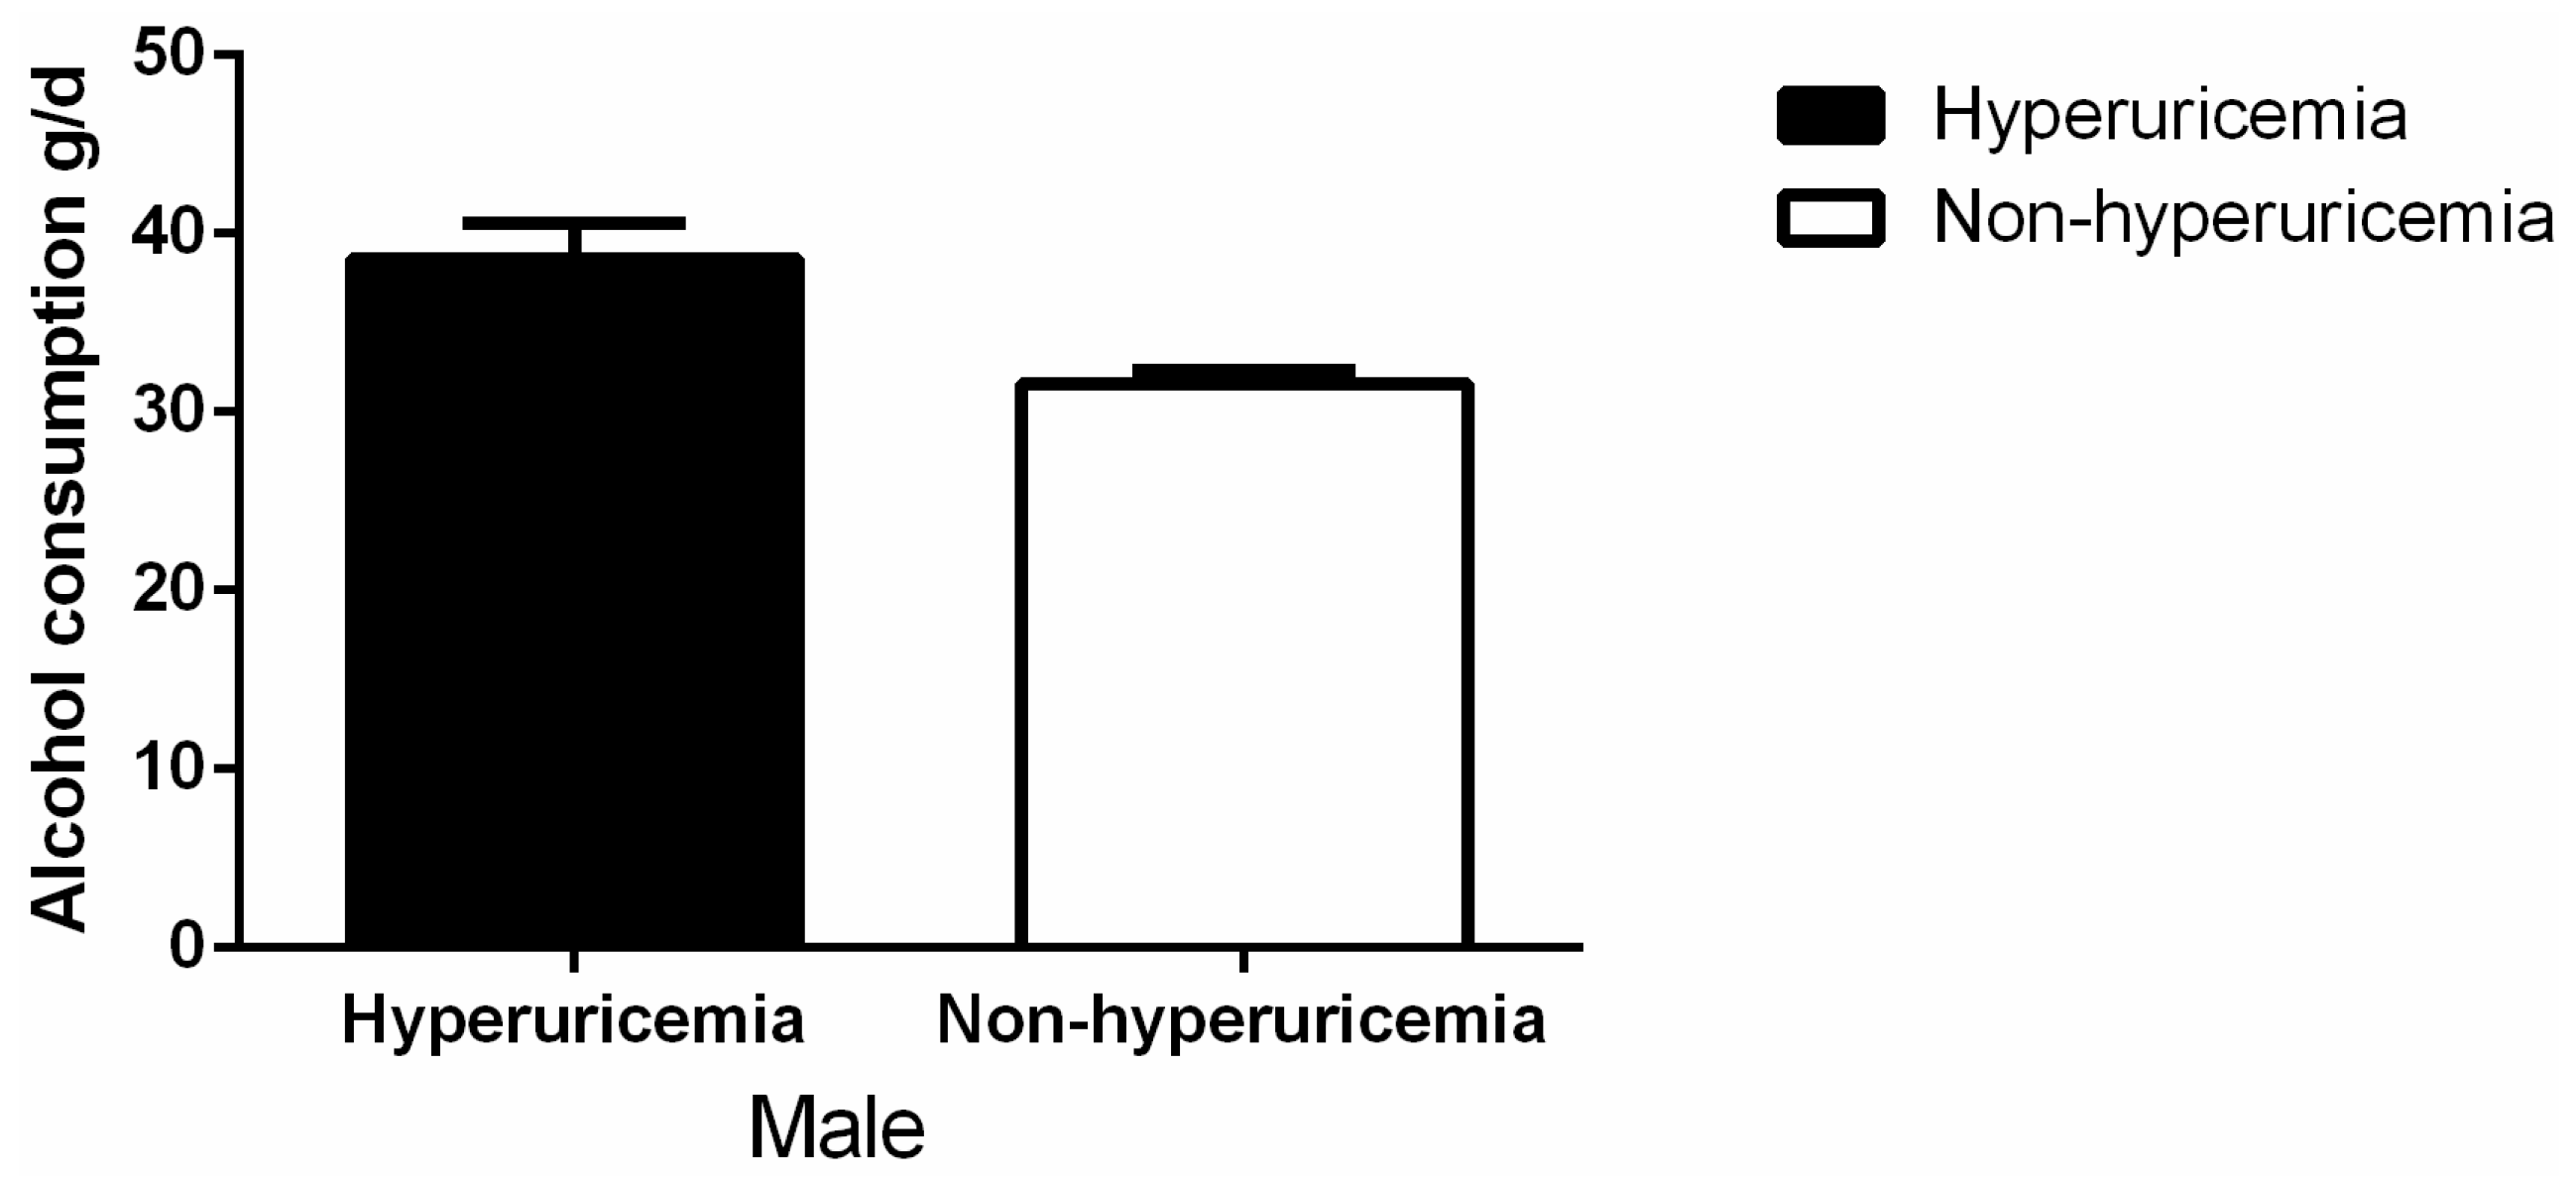
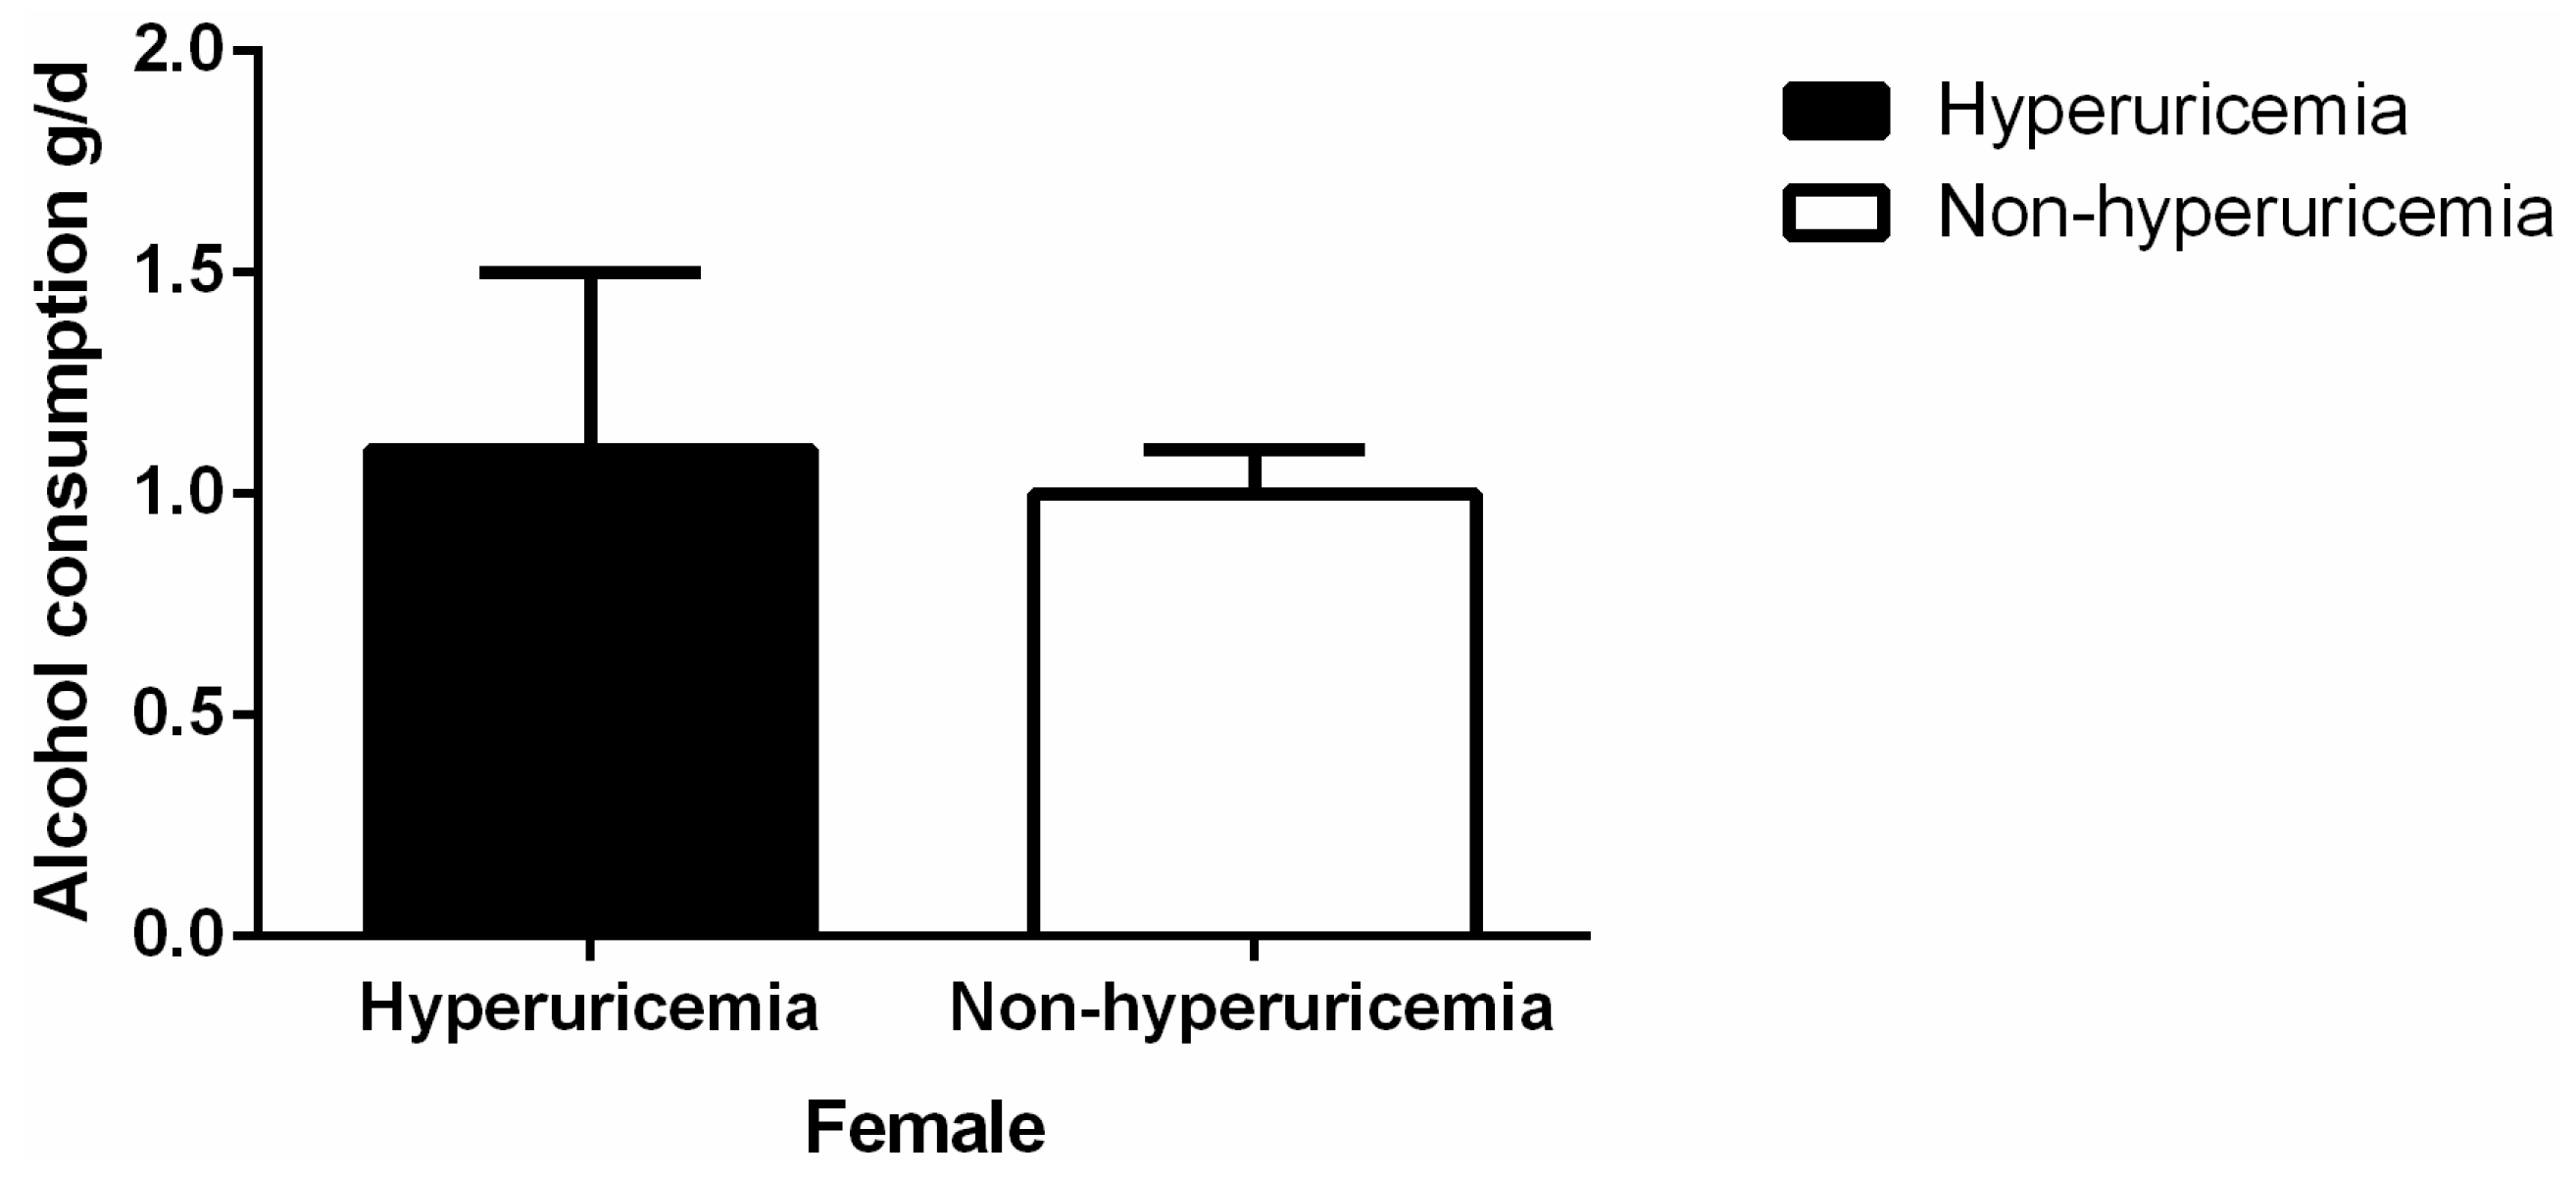
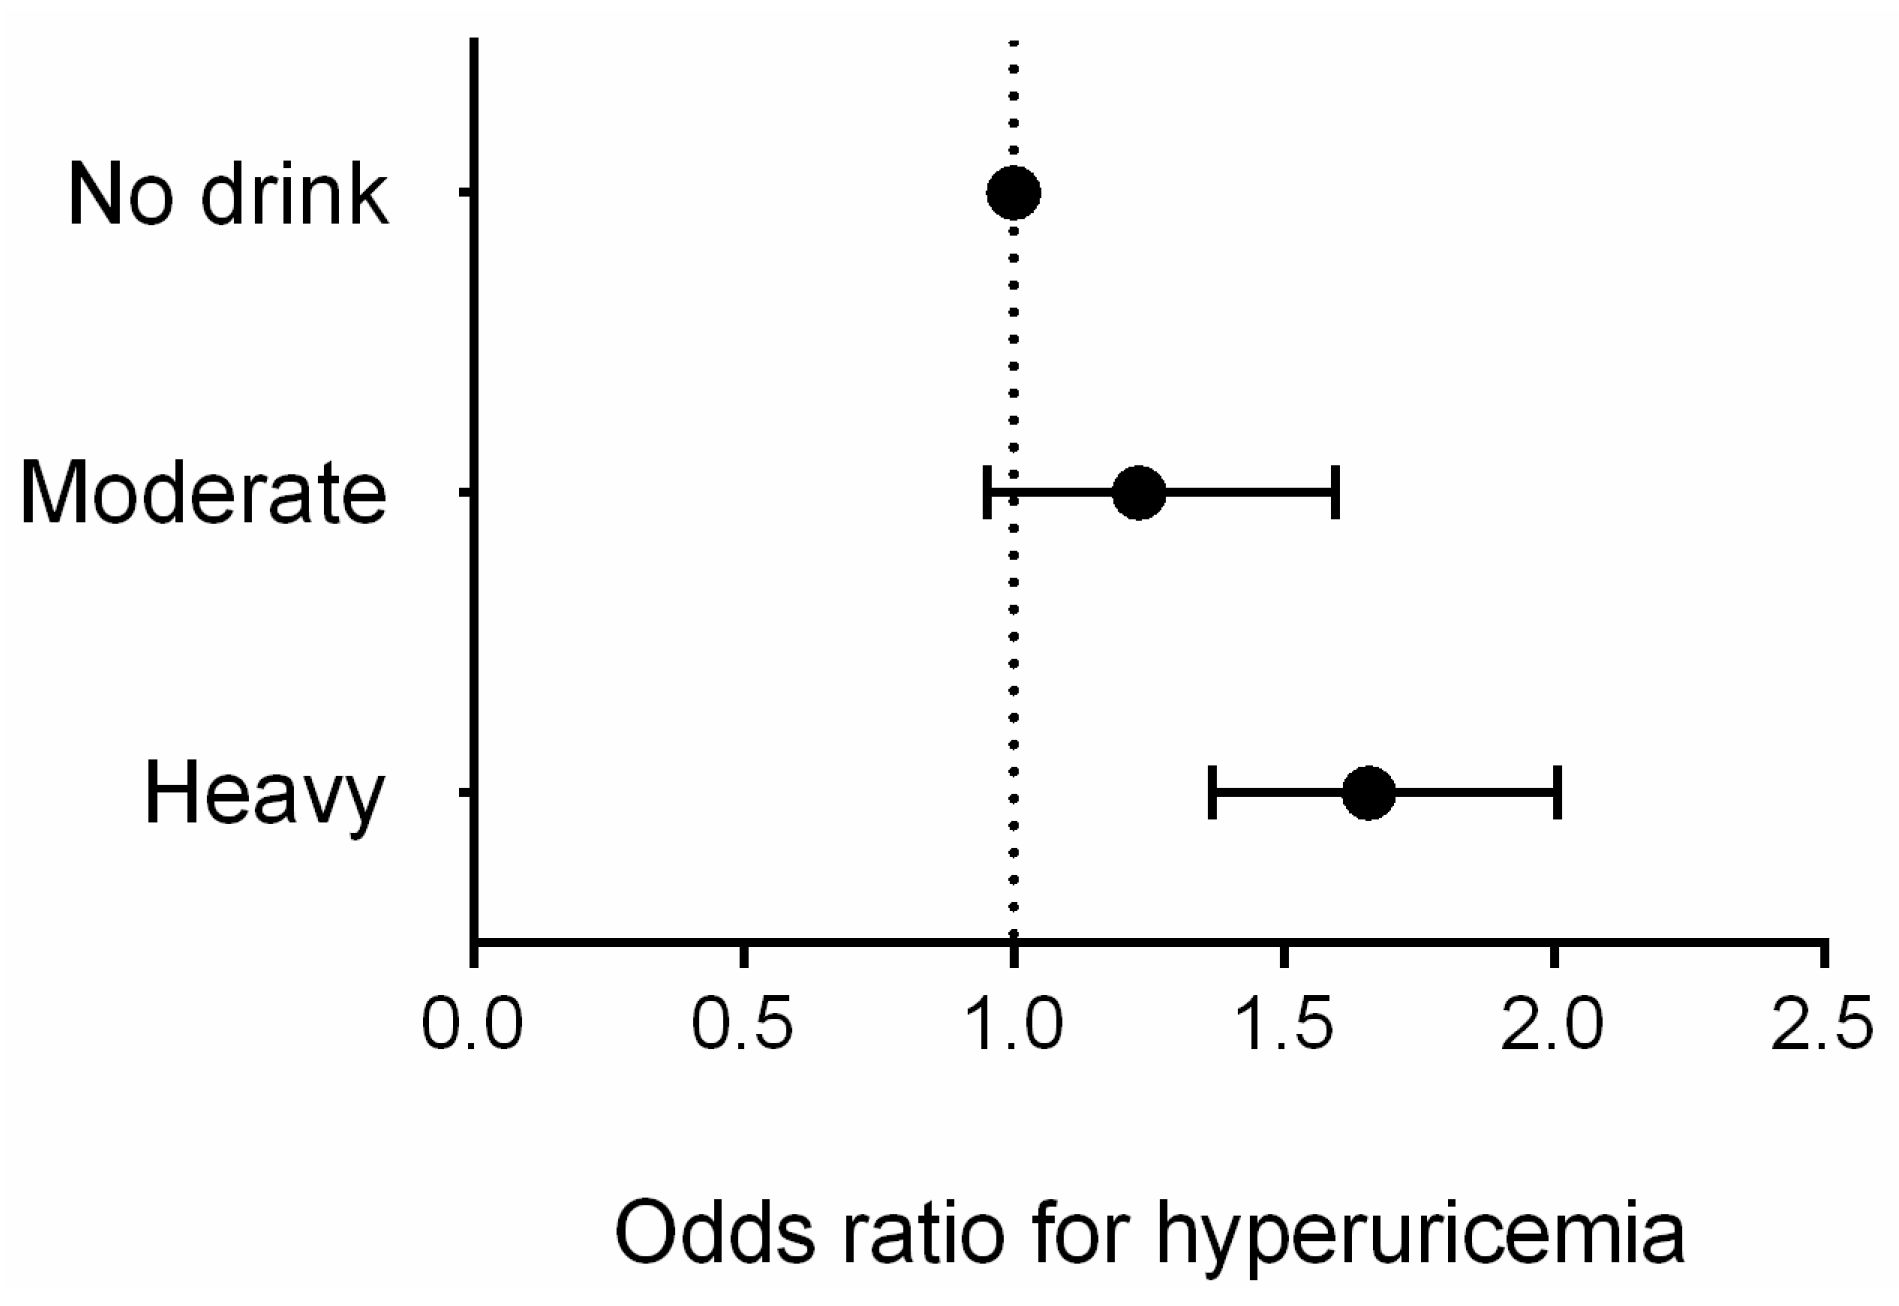
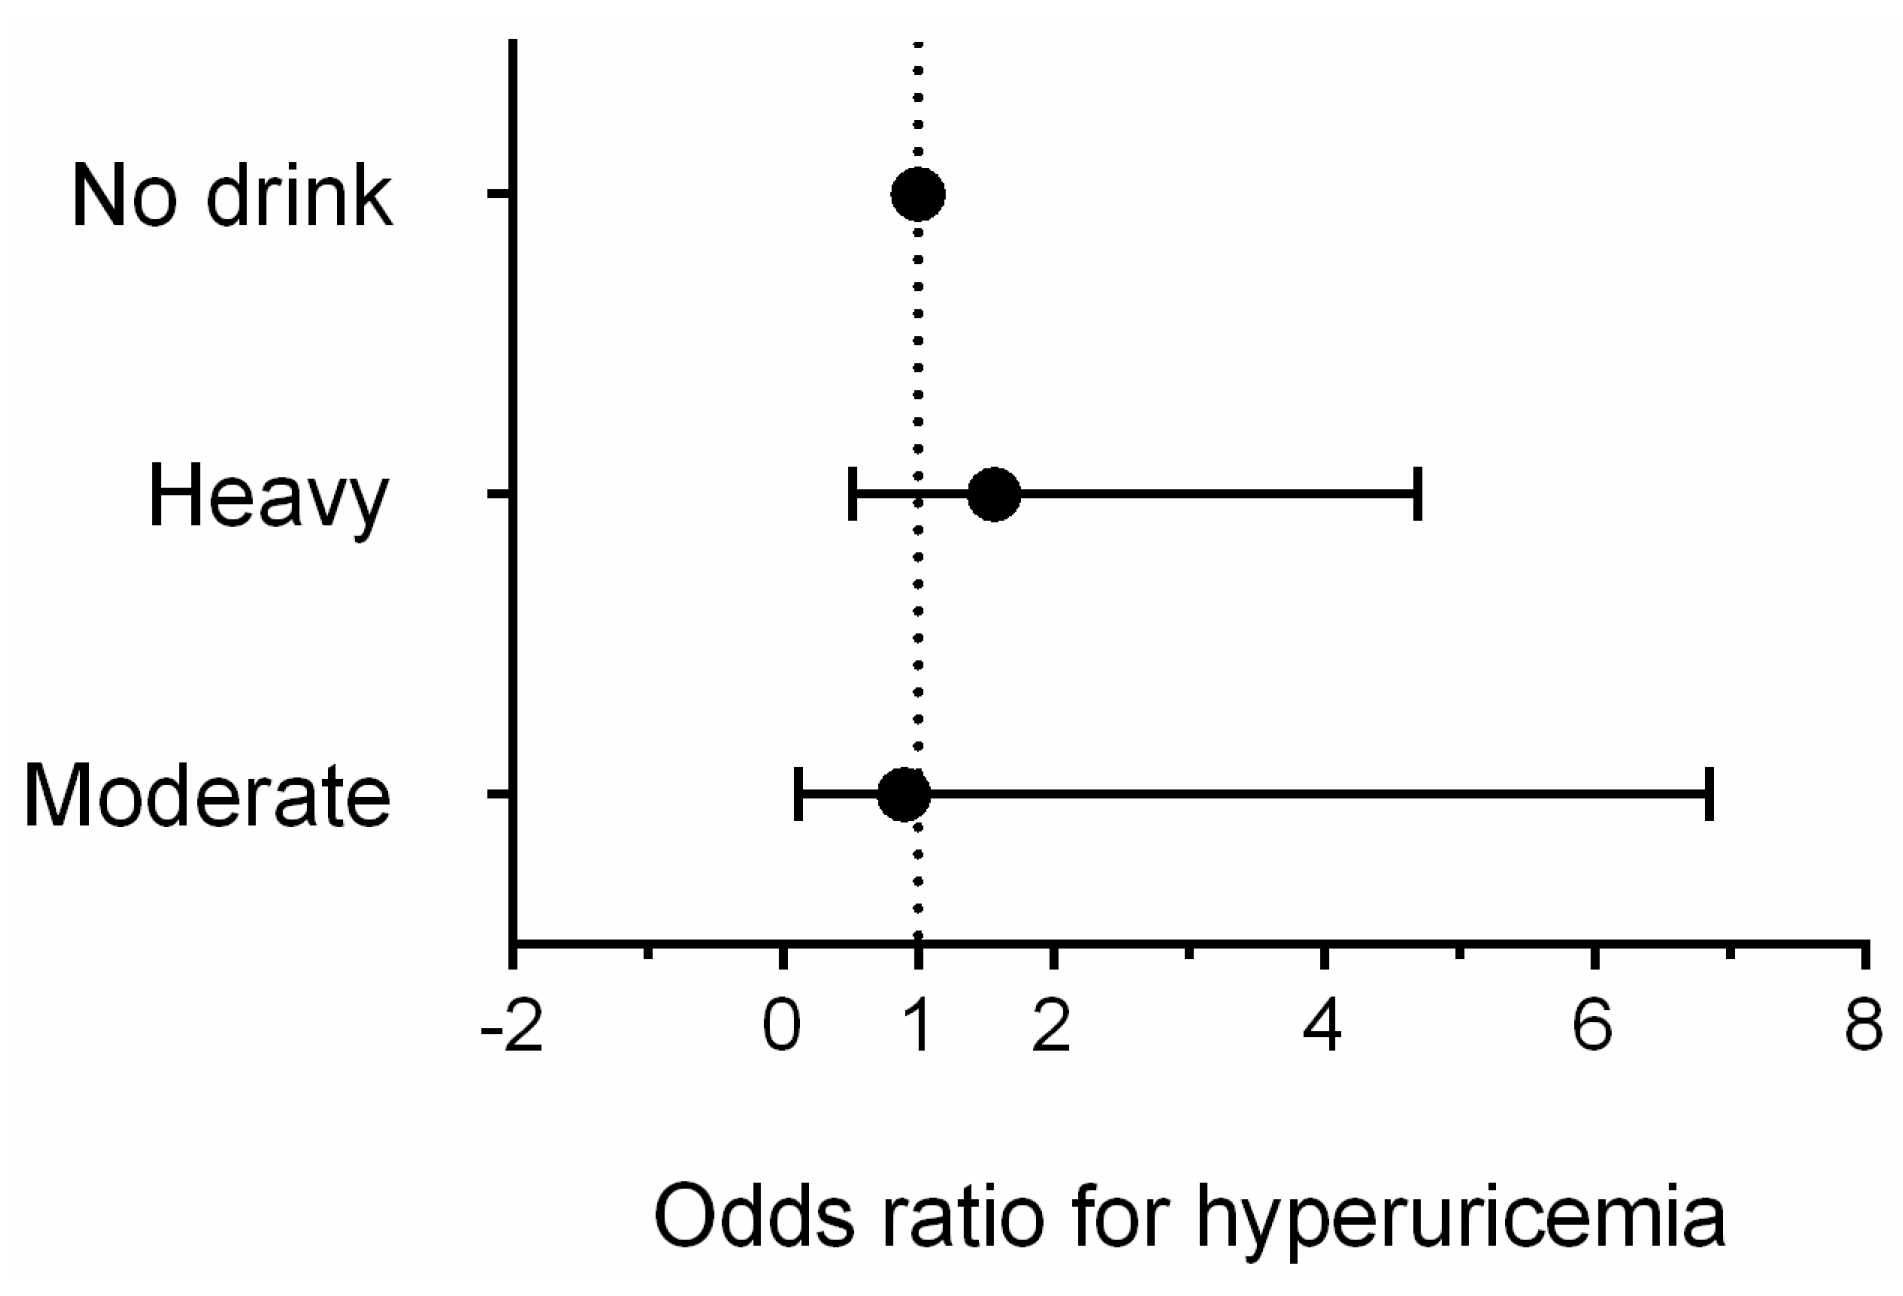
3.3. Association Between Alcohol Consumption and Hyperuricemia by Gender

Table 2 presents characteristics of study population according to homocysteine or not by gender. Similar to the previous reports [26], the difference of age, life styles, BMI, blood pressure, eGFR, lipid level, prevalence of disease, and medication used was significant between hyperuricemia and not hyperuricemia. Additionally, post-menopausal females had higher prevalence of homocysteine than pre-menopausal females (p < 0.001). So we selected related variables mentioned above as the confounders in the multivariate logistic regression model. Figure 5 and Figure 6 showed multivariate logistic regression analyses of the risk of hyperuricemia corrected according to the different levels of alcohol consumption. In males, after adjusting for factors including age, race, education, income, diet scores, smoking status, activity level, obesity, hypertension, dyslipidemia, diabetes, and medication used, heavy drinkers had an approximately 1.7-fold higher risk of hyperuricemia (OR: 1.657, 95% CI: 1.368 to 2.007, p < 0.001) than non-drinkers; moderate drinkers did not experience a significant increase in risk (OR: 1.232, 95% CI: 0.951 to 1.596, p = 0.114). For females, we adjusted menopausal status plus the same factors as the males, multivariate logistic regression analyses showed that compared with non-drinkers, neither moderate nor heavy drinkers had a significantly increased risk of hyperuricemia (OR: 1.565, 95% CI: 0.521 to 4.695, p = 0.425 for heavy drinkers; OR: 0.897, 95% CI: 0.117 to 6.855, p = 0.916 for moderate drinkers).

4. Discussion

In the present study, we first evaluated the association between different levels of alcoholic drink consumption and hyperuricemia in a general population. We found that males who were heavy drinkers had an increased risk of hyperuricemia, but the same result was not found in females who were heavy drinkers. In both males and females, moderate alcohol consumption, compared with the absence of alcohol consumption, did not increase the risk of hyperuricemia.
Hyperuricemia is considered the precursor to gout, which can cause multiple organ damage [27,28,29,30,31]. Although the relationship between uric acid and drinking has been well investigated, there is a lack of research specifically focusing on different levels of alcohol consumption and hyperuricemia. A study including 2062 apparently healthy volunteers from Finland reported that serum uric acid concentrations in male moderate drinkers were significantly higher than those in the corresponding groups of alcohol abstainers, and in females, these concentrations were lower [12]. A study consisting of Japanese men who worked for a metal products factory in Toyama prefecture, between the ages of 20–54 years, reported that both moderate and heavy alcohol intake increased the risk of incident hyperuricemia [32]. Our previous studies also focused on drinking and hyperuricemia; however, the effect of different levels of alcohol consumption has not been studied [33]. To the best of our knowledge, the present study is the first to focus on the relationship between different levels of alcohol consumption and hyperuricemia in a general population in rural China. The results show that heavy but not moderate drinkers had an increased risk of hyperuricemia in males. Compared with the absence of alcohol consumption, moderate alcohol consumption did not increase the risk of hyperuricemia in both males and females. It is possible that the results are affected in part by the menopausal status the female cohort since estrogen is known to increase renal uric acid clearance [34]. Additionally, in this study, alcohol consumption from beer in males was significantly higher than in woman population. Since beer contains large amounts of purine, it is possible that attenuated rise in serum uric acid levels in the male cohort was due to the differences in beer consumption. So we adjusted bottles of beer consumption per week in the multivariate analyses for further analyses and got the same conclusions which data was shown in Table 3.
However, the mechanism of the different effects due to different levels of alcohol consumption is unclear. We speculate that moderate alcohol intake can increase the glomerular filtration rate, which may increase uric acid excretion. However, this requires further study. In addition, we found that males who were heavy drinkers had an increased risk of hyperuricemia, while the same result was not observed in females. There are several reasons for these disparate results. First, in this general population, there were significantly fewer female drinkers than male drinkers; therefore, we speculate that the smaller sample size may have driven the non-significant results. Second, women absorb and metabolize alcohol differently than men [35,36]. However, further research should be conducted to explore the mechanism underlying our findings.
This estimate has an important implication for public health policy. Our present results corroborate previous findings that moderate alcohol consumption was reasonable for men and women. For an individual person, hyperuricemia could exist in combination with heart disease and other diseases, as shown in our basic characteristics. However, other studies have reported that moderate consumption of alcohol is harmless for some diseases such as coronary heart disease and ischemic stroke [37,38]. As such, according to the present results, a reduction in alcohol intake in heavy drinkers among the male population could be recommended to lower the risk of hyperuricemia.
Our study had some limitations. First, the data are not representative of the adult population throughout China. Second, since some of the study population had several risk factors including hypertension, DM, and dyslipidemia, we could not eliminate the possible effects of underlying diseases and medications used for these diseases on the present findings. Additionally, we did not analyze every type of medication used by the participants, including uric acid lowering medication which may affect the results, but we adjusted the “any self-reported medication used in the past two weeks” in the multivariate analyses which may reduce the influence of drug confounders. Finally, our study was descriptive and the results were obtained using a cross-sectional design, thus, the conclusions are based only on correlations and no cause-and-effect relationships could be established. So, further prospective population-based studies are needed to confirm our result and investigate the related mechanism.

5. Conclusions

In conclusion, based on this rural general population, we found that male heavy drinkers had increased odds of hyperuricemia, but the same result was not found in females. Among both males and females, moderate alcohol consumption did not increase the odds of hyperuricemia. This will have practical implications for prevention and management of hyperuricemia in rural areas.

Acknowledgments

This study was supported by grants from the “Twelfth Five-Year” project funds (National Science and Technology Support Program of China, Grant No. 2012BAJ18B02) and the Natural Science Foundation of Liaoning Province (2013021090).

Author Contributions

All authors participated in the primary research. Zhao Li and Yamin Liu managed and analyzed the data and wrote the first draft of the manuscript. Xiaofan Guo and Guangshuo Zhu managed and analyzed the data. Zhao Li, Xiaofan Guo, and Ye Chang enrolled participants and collected data. Yingxian Sun and Maria Roselle Abraham was responsible for designing the study.

Conflicts of Interest

The authors declare that they have no competing interests.

References

  1. Robinson, P.C.; Taylor, W.J.; Merriman, T.R. Systematic review of the prevalence of gout and hyperuricaemia in Australia. Intern. Med. J. 2012, 42, 997–1007. [Google Scholar] [PubMed]
  2. Qu, Y.L.; Yu, L.; Li, Z.M.; Kong, L.H.; Xiao, T.C.; Li, M. Epidemiological status and risk factors of hyperuricemia in rural area of the Three Gorges. Chin. J. Cardiol. 2013, 41, 427–431. (In Chinese) [Google Scholar]
  3. Zhang, X.; Liu, L.; Liang, R.; Jin, S. Hyperuricemia is a biomarker of early mortality in patients with chronic obstructive pulmonary disease. Int. J. Chron. Obstruct. Pulmon. Dis. 2015, 10, 2519–2523. [Google Scholar] [PubMed]
  4. Bobak, M.; Malyutina, S.; Horvat, P.; Pajak, A.; Tamosiunas, A.; Kubinova, R.; Marmot, M.G. Alcohol, drinking pattern and all-cause, cardiovascular and alcohol-related mortality in Eastern Europe. Eur. J. Epidemiol. 2016, 31, 21–30. [Google Scholar] [CrossRef] [PubMed]
  5. Braga, F.; Pasqualetti, S.; Ferraro, S.; Panteghini, M. Hyperuricemia as risk factor for coronary heart disease incidence and mortality in the general population: A systematic review and meta-analysis. Clin. Chem. Lab. Med. 2016, 54, 7–15. [Google Scholar] [CrossRef] [PubMed]
  6. Huang, W.M.; Hsu, P.F.; Cheng, H.M.; Lu, D.Y.; Cheng, Y.L.; Guo, C.Y.; Chen, C.H. Determinants and prognostic impact of hyperuricemia in hospitalization for acute heart failure. Circ. J. 2016, 80, 404–410. [Google Scholar] [CrossRef] [PubMed]
  7. Choi, H.K.; Atkinson, K.; Karlson, E.W.; Willett, W.; Curhan, G. Alcohol intake and risk of incident gout in men: A prospective study. Lancet. 2004, 363, 1277–1281. [Google Scholar] [CrossRef]
  8. Bae, J.; Park, P.S.; Chun, B.Y.; Choi, B.Y.; Kim, M.K.; Shin, M.H.; Kim, S.K. The effect of coffee, tea, and caffeine consumption on serum uric acid and the risk of hyperuricemia in Korean Multi-Rural Communities Cohort. Rheumatol. Int. 2015, 35, 327–336. [Google Scholar] [CrossRef] [PubMed]
  9. Markus, M.R.P.; Lieb, W.; Stritzke, J.; Siewert, U.; Troitzsch, P.; Koch, M.; Baumeister, S.E. Light to moderate alcohol consumption is associated with lower risk of aortic valve sclerosis: The study of health in pomerania (SHIP). Arterioscler. Thromb. Vasc. Biol. 2015, 35, 1265–1270. [Google Scholar] [CrossRef] [PubMed]
  10. Wei, C.Y.; Sun, C.C.; Wei, J.C.C.; Tai, H.C.; Sun, C.A.; Chung, C.F.; Yang, T. Association between hyperuricemia and metabolic syndrome: An epidemiological study of a labor force population in Taiwan. BioMed Res. Int. 2015. [Google Scholar] [CrossRef] [PubMed]
  11. Liu, R.; Han, C.; Wu, D.; Xia, X.; Gu, J.; Guan, H.; Teng, W. Prevalence of hyperuricemia and gout in mainland China from 2000 to 2014: A systematic review and meta-analysis. BioMed Res. Int. 2015. [Google Scholar] [CrossRef] [PubMed]
  12. Alatalo, P.I.; Koivisto, H.M.; Hietala, J.P.; Bloigu, R.S.; Niemelä, O.J. Gender-dependent impacts of body mass index and moderate alcohol consumption on serum uric acid—An index of oxidant stress status? Free Radical Biol. Med. 2009, 46, 1233–1238. [Google Scholar] [CrossRef] [PubMed]
  13. Choi, H.K.; Curhan, G. Beer, liquor, and wine consumption and serum uric acid level: The Third National Health and Nutrition Examination Survey. Arthritis Rheum. 2004, 51, 1023–1029. [Google Scholar] [CrossRef] [PubMed]
  14. Yu, S.; Guo, X.; Yang, H.; Zheng, L.; Sun, Y. An update on the prevalence of metabolic syndrome and its associated factors in rural northeast China. BMC Public Health 2014. [Google Scholar] [CrossRef] [PubMed]
  15. Guo, X.; Li, Z.; Guo, L.; Zheng, L.; Yu, S.; Yang, H.; Zhang, Y. An update on overweight and obesity in rural Northeast China: From lifestyle risk factors to cardiometabolic comorbidities. BMC Public Health 2014. [Google Scholar] [CrossRef] [PubMed]
  16. Sun, G.; Ma, M.; Ye, N.; Wang, J.; Chen, Y.; Dai, D.; Sun, Y. Diabetes mellitus is an independent risk factor for atrial fibrillation in a general Chinese population. J. Diabetes Investig. 2016. [Google Scholar] [CrossRef] [PubMed]
  17. Sun, G.Z.; Li, Z.; Guo, L.; Zhou, Y.; Yang, H.M.; Sun, Y.X. High prevalence of dyslipidemia and associated risk factors among rural Chinese adults. Lipids Health Dis. 2014. [Google Scholar] [CrossRef] [PubMed]
  18. Qiao, Y.; Shi, R.; Hou, B.; Wu, L.; Zheng, L.; Ding, L.; Yao, Y. Impact of alcohol consumption on substrate remodeling and ablation outcome of paroxysmal atrial fibrillation. J. Am. Heart Assoc. 2015. [Google Scholar] [CrossRef] [PubMed]
  19. National Institute on Alcohol Abuse and Alcoholism. The Physicians’ Guide to Helping Patients with Alcohol Problem; NIH: Bethesda, MD, USA, 1995.
  20. Shmerling, R.H. Management of gout: A 57-year-old man with a history of podagra, hyperuricemia, and mild renal insufficiency. JAMA 2012, 308, 2133–2141. [Google Scholar] [CrossRef] [PubMed]
  21. Chobanian, A.V.; Bakris, G.L.; Black, H.R.; Cushman, W.C.; Green, L.A.; Izzo, J.L.; Roccella, E.J. Seventh report of the joint national committee on prevention, detection, evaluation, and treatment of high blood pressure. Hypertension 2003, 42, 1206–1252. [Google Scholar] [CrossRef] [PubMed]
  22. Expert Panel on Detection, Evaluation, and Treatment of High Blood Cholesterol in Adults. Executive summary of the Third Report of the National Cholesterol Education Program (NCEP) expert panel on detection, evaluation, and treatment of high blood cholesterol in adults (Adult Treatment Panel III). JAMA 2001, 285, 2486–2497. [Google Scholar]
  23. World Health Organization. Definition and Diagnosis of Diabetes Mellitus and Intermediate Hyperglycaemia; WHO: Geneva, Switzerland, 2006. [Google Scholar]
  24. Kumral, E.; Karaman, B.; Orman, M.; Kabaroglu, C. Association of uric acid and carotid artery disease in patients with ischemic stroke. Acta Neurol. Scand. 2014, 130, 11–17. [Google Scholar] [CrossRef] [PubMed]
  25. Levey, A.S.; Stevens, L.A.; Schmid, C.H.; Zhang, Y.L.; Castro, A.F.; Feldman, H.I.; Coresh, J. A new equation to estimate glomerular filtration rate. Ann. Intern. Med. 2009, 150, 604–612. [Google Scholar] [CrossRef] [PubMed]
  26. Yu, S.; Yang, H.; Guo, X.; Zhang, X.; Zhou, Y.; Ou, Q.; Sun, Y. Prevalence of hyperuricemia and its correlates in rural Northeast Chinese population: From lifestyle risk factors to metabolic comorbidities. Clin. Rheumatol. 2016, 35, 1207–1215. [Google Scholar] [CrossRef] [PubMed]
  27. Elmadhun, N.Y.; Sadek, A.A.; Sabe, A.A.; Lassaletta, A.D.; Sellke, F.W. Alcohol and the heart: A proteomics analysis of pericardium and myocardium in a swine model of myocardial ischemia. Ann. Thorac. Surg. 2015, 100, 1627–1635. [Google Scholar] [CrossRef] [PubMed]
  28. Chen, J.H.; Lan, J.L.; Cheng, C.F.; Liang, W.M.; Lin, H.Y.; Tsay, G.J.; Pan, W.H. Effect of urate-lowering therapy on all-cause and cardiovascular mortality in hyperuricemic patients without Gout: A case-matched cohort study. PLoS ONE 2015. [Google Scholar] [CrossRef] [PubMed]
  29. Hernandez-Hernandez, A.; Gea, A.; Ruiz-Canela, M.; Toledo, E.; Beunza, J.J.; Bes-Rastrollo, M.; Martinez-Gonzalez, M.A. Mediterranean alcohol-drinking pattern and the incidence of cardiovascular Disease and cardiovascular mortality: The SUN Project. Nutrients 2015, 7, 9116–9126. [Google Scholar] [CrossRef] [PubMed]
  30. Ofori, S.N.; Odia, O.J. Serum uric acid and target organ damage in essential hypertension. Vasc. Health Risk Manag. 2014, 10, 253–261. [Google Scholar] [CrossRef] [PubMed]
  31. Nacak, H.; van Diepen, M.; de Goeij, M.C.; Rotmans, J.I.; Dekker, F.W. Uric acid: Association with rate of renal function decline and time until start of dialysis in incident pre-dialysis patients. BMC Nephrol. 2014. [Google Scholar] [CrossRef] [PubMed]
  32. Nakamura, K.; Sakurai, M.; Miura, K.; Morikawa, Y.; Yoshita, K.; Ishizaki, M.; Nakagawa, H. Alcohol intake and the risk of hyperuricaemia: A 6-year prospective study in Japanese men. Nutr. Metab. Cardiovasc. Dis. 2012, 22, 989–996. [Google Scholar] [CrossRef] [PubMed]
  33. Li, Y.; Lu, J.; Wu, X.; Yang, C. Serum uric acid concentration and asymptomatic hyperuricemia with subclinical organ damage in general population. Angiology 2014, 65, 634–640. [Google Scholar] [CrossRef] [PubMed]
  34. Hak, A.E.; Choi, H.K. Menopause, postmenopausal hormone use and serum uric acid levels in US women—The Third National Health and Nutrition Examination Survey. Arthritis Res. Ther. 2008. [Google Scholar] [CrossRef] [PubMed]
  35. Cook, L.J. Educating women about the hidden dangers of alcohol. J. Psychosoc. Nurs. Ment. Health Serv. 2004, 42, 24–31. [Google Scholar] [PubMed]
  36. World Health Organization. Diet, Nutrition and the Prevention of Chronic Diseases; WHO: Geneva, Switzerland, 2003. [Google Scholar]
  37. Lee, S.J.; Cho, Y.J.; Kim, J.G.; Ko, Y.; Hong, K.S.; Park, J.M.; Cha, J.K. Moderate alcohol intake reduces risk of ischemic stroke in Korea. Neurology 2015, 85, 1950–1956. [Google Scholar] [CrossRef] [PubMed]
  38. Tektonidis, T.G.; Åkesson, A.; Gigante, B.; Wolk, A.; Larsson, S.C. A Mediterranean diet and risk of myocardial infarction, heart failure and stroke: A population-based cohort study. Atherosclerosis 2015, 243, 93–98. [Google Scholar] [CrossRef] [PubMed]
Figure 1. The mean level of serum uric acid in different alcohol consumption groups by gender.
Ijerph 13 00732 g001
Figure 2. Prevalence of hyperuricemia in different alcohol consumption levels by gender.
Ijerph 13 00732 g002
Figure 3. Alcohol consumption by hyperuricemia or not in males.
Ijerph 13 00732 g003
Figure 4. Alcohol consumption by hyperuricemia or not in females.
Ijerph 13 00732 g004
Figure 5. Multivariate logistic regression analyses of the risk of hyperuricemia corrected according to the different levels of alcohol consumption in males.
Ijerph 13 00732 g005
Figure 6. Multivariate logistic regression analyses of the risk of hyperuricemia corrected according to the different levels of alcohol consumption in females.
Ijerph 13 00732 g006
Table 1. Baseline characteristics of study population by gender (N = 11039).
VariablesMale (4997)Female (6042)p-value
Age (year)54.4 ± 10.8 53.4 ± 10.3 <0.001
Current drinking2244 (44.9%)173 (2.9%)<0.001
Total alcohol consumption (g/d)32.6 ± 49.6 1.0 ± 8.3 <0.001
Alcohol consumption from beer (g/d)3.9 ± 12.8 0.1 ± 2.0 <0.001
Alcohol consumption from liquor (g/d)28.6 ± 46.9 0.9 ± 7.7 <0.001
Alcohol consumption from wine (g/d)0.0 ± 1.8 0.0 ± 0.0 <0.001
Alcohol consumption <0.001
No drink 2524 (50.5%)584 7 (96.8%)
Moderate751 (15.0%)74 (1.2%)
Heavy1722 (34.5%)121 (2.0%)
Data are expressed as the mean ± SD or as n (%).
Table 2. Baseline characteristics of study population according to hyperuricemia or not by gender.
VariablesFemale Male
Non-HyperuricemiaHyperuricemiap-valueNon-HyperuricemiaHyperuricemiap-value
Age (year)53.1 ± 10.257.8 ± 10.6<0.00154.6 ± 10.853.2 ± 11.10.002
SBP (mmHg)139.7 ± 2.8146.4 ± 25.0<0.001143.2 ± 22.6145.6 ± 22.90.010
DBP(mmHg)80.3 ± 11.483.9 ± 12.7<0.00183.1 ± 11.687.2 ± 12.7<0.001
Serum creatinine (mmol/L)64.3 ± 11.882.7 ± 63.1<0.00178.1 ± 16.288.7 ± 30.3<0.001
eGFR(mL/min)95.2 ± 14.388.0 ± 19.4<0.00192.9 ± 15.475.6 ± 19.1<0.001
Serum uric acid (μmol/L)245.1 ± 53.7413.8 ± 54.7<0.001309.9 ± 58.3482.9 ± 62.6<0.001
FPG (mmol/L)5.8 ± 1.66.2 ± 1.6<0.0015.9 ± 1.76.0 ± 1.50.705
TC (mmol/L)5.3 ± 1.15.8 ± 1.3<0.0015.1 ± 1.05.5 ± 1.2<0.001
TG (mmol/L)1.6 ± 1.22.5 ± 2.2<0.0011.5 ± 1.42.5 ± 2.7<0.001
HDL-C (mmol/L)1.4 ± 0.31.3 ± 0.3<0.0011.4 ± 0.41.3 ± 0.4<0.001
LDL-C (mmol/L)2.9 ± 0.83.3 ± 0.9<0.0012.8 ± 0.83.0 ± 0.8<0.001
Dietscore2.1 ± 1.12.0 ± 1.10.0092.5 ± 1.12.6 ± 1.10.101
BMI(kg/m2)24.7 ± 3.726.7 ± 3.8<0.00124.5 ± 3.426.4 ± 3.9<0.001
Race group (han)5361 (94.8%)374 (97.4%)0.0104092 (94.7%)646 (95.6%)0.200
Education <0.001 0.535
Primary school or below3173 (56.1%)258 (67.2%) 1811 (41.9%)278 (41.1%)
Middle school2047 (36.2%)97 (25.3%) 2036 (47.1%)314 (46.4%)
High school or above438 (7.7%)29 (7.6%) 474 (11.0%)84 (12.4%)
Physical activity 0.010 0.001
Low3173 (56.1%)374 (97.4%) 913 (21.1%)180 (26.6%)
Moderate2047 (36.2%)10 (2.6%) 3160 (73.1%)471 (69.7%)
High438 (7.7%)384 (100.0%) 248 (5.7%)25 (3.7%)
Currently smoking929 (16.4%)66 (17.2%)0.6942504 (57.9%)351 (51.9%)0.002
Family income (CNY/year) 0.360 0.482
≤5000646 (11.4%)53 (13.8%) 582 (13.5%)90 (13.3%)
5000–20,0003135 (55.4%)209 (54.4%) 2349 (54.4%)353 (52.2%)
>20,0001877 (33.2%)122 (31.8%) 1390 (32.2%)233 (34.5%)
Medication used a 0.004 <0.001
Yes2277 (87.8%)317 (12.2%) 2418 (96.6%)85 (3.4%)
No2008 (85.0%)355 (15.0%) 3196 (91.5%)295 (8.5%)
Menopause status <0.001
Yes 3233 (91.9%)285 (8.1%)
No 2385 (96.2%)94 (3.8%)
Data are expressed as the mean ± SD or as n (%); QTc: corrected QT; CNY: China Yuan (1 CNY = 0.157 USD); BMI: body mass index; WC: waist circumference; SBP: systolic blood pressure; DBP: diastolic blood pressure; FPG: fasting plasma glucose; TC: total cholesterol; TG: triglyceride; LDL-C: low-density lipoprotein cholesterol; HDL-C: high-density lipoprotein cholesterol; a Indicating any self-reported medication used in the past two weeks; ps: p for category from chi-square; for continous from non-parametric test.
Table 3. Multivariable logistic regression analyses for hyperuricemia.
VariablesMaleFemale
p-valueOR (95% CI)p-valueOR (95% CI)
Race (han)0.2040.770 (0.515–1.152)0.0690.457 (0.196–1.061)
Current smoking0.0020.756 (0.634–0.902)0.0380.656 (0.440–0.977)
Medication use a0.0221.224 (1.030–1.454)<0.0011.734 (1.273–2.362)
Age (years)<0.0010.978 (0.969–0.988)0.3081.009 (0.992–1.026)
Diabetes0.0580.760 (0.572–1.009)0.0121.563 (1.105–2.210)
Dyslipidemia<0.0012.167 (1.822–2.577)<0.0012.630 (1.995–3.468)
Obesity<0.0012.066 (1.569–2.719)0.0011.886 (1.303–2.730)
Hypertension0.0041.315 (1.094–1.581)0.0231.422 (1.051–1.924)
decreased eGFR<0.0017.400 (4.581–11.953)<0.00111.136 (6.873–18.042)
Annual income (CNY/year)
≤50000.8641.000 (reference) 1.000 (reference)
5000–20,0000.5890.929 (0.711–1.214)0.7531.071 (0.698–1.643)
>20,0000.6790.940 (0.703–1.258)0.4951.179 (0.735–1.890)
Dietscore0.3541.038 (0.959–1.123)0.6190.970 (0.859–1.095)
Physical activity
Low0.0131.000 (reference) 1.000 (reference)
Moderate0.0470.811 (0.659–0.997)0.0501.340 (0.999–1.795)
High0.0070.535 (0.339–0.845)0.9910.996 (0.523–1.899)
Education level
Primary school or below0.7331.000 (reference)0.6591.000 (reference)
Middle school0.4420.927 (0.764–1.124)0.4250.874 (0.628–1.217)
High school or above0.880 0.978 (0.732–1.306)0.8131.068 (0.621–1.835)
Beer (bottles/weeks)0.222 1.010 (0.994–1.027)0.0881.135 (0.981–1.312)
Alcohol consumption group
No<0.0011.000 (reference)0.9791.000 (reference)
Moderate0.1681.201 (0.926–1.558 )0.8430.814 (0.106–6.238)
Heavy<0.0011.573 (1.285–1.926)0.9510.956 (0.228–4.001)
Menopause--0.5951.083 (0.806–1.456)
OR: odds ratio; 95% CI: 95% confidence interval; CNY: China Yuan (1CNY = 0.157 USD); a Indicating any self-reported medication used in the past two weeks.

