Health Risk of Polonium 210 Ingestion via Drinking Water: An Experience of Malaysia

 ,
,  ,
,
Abstract
:1. Introduction
2. Materials and Methods
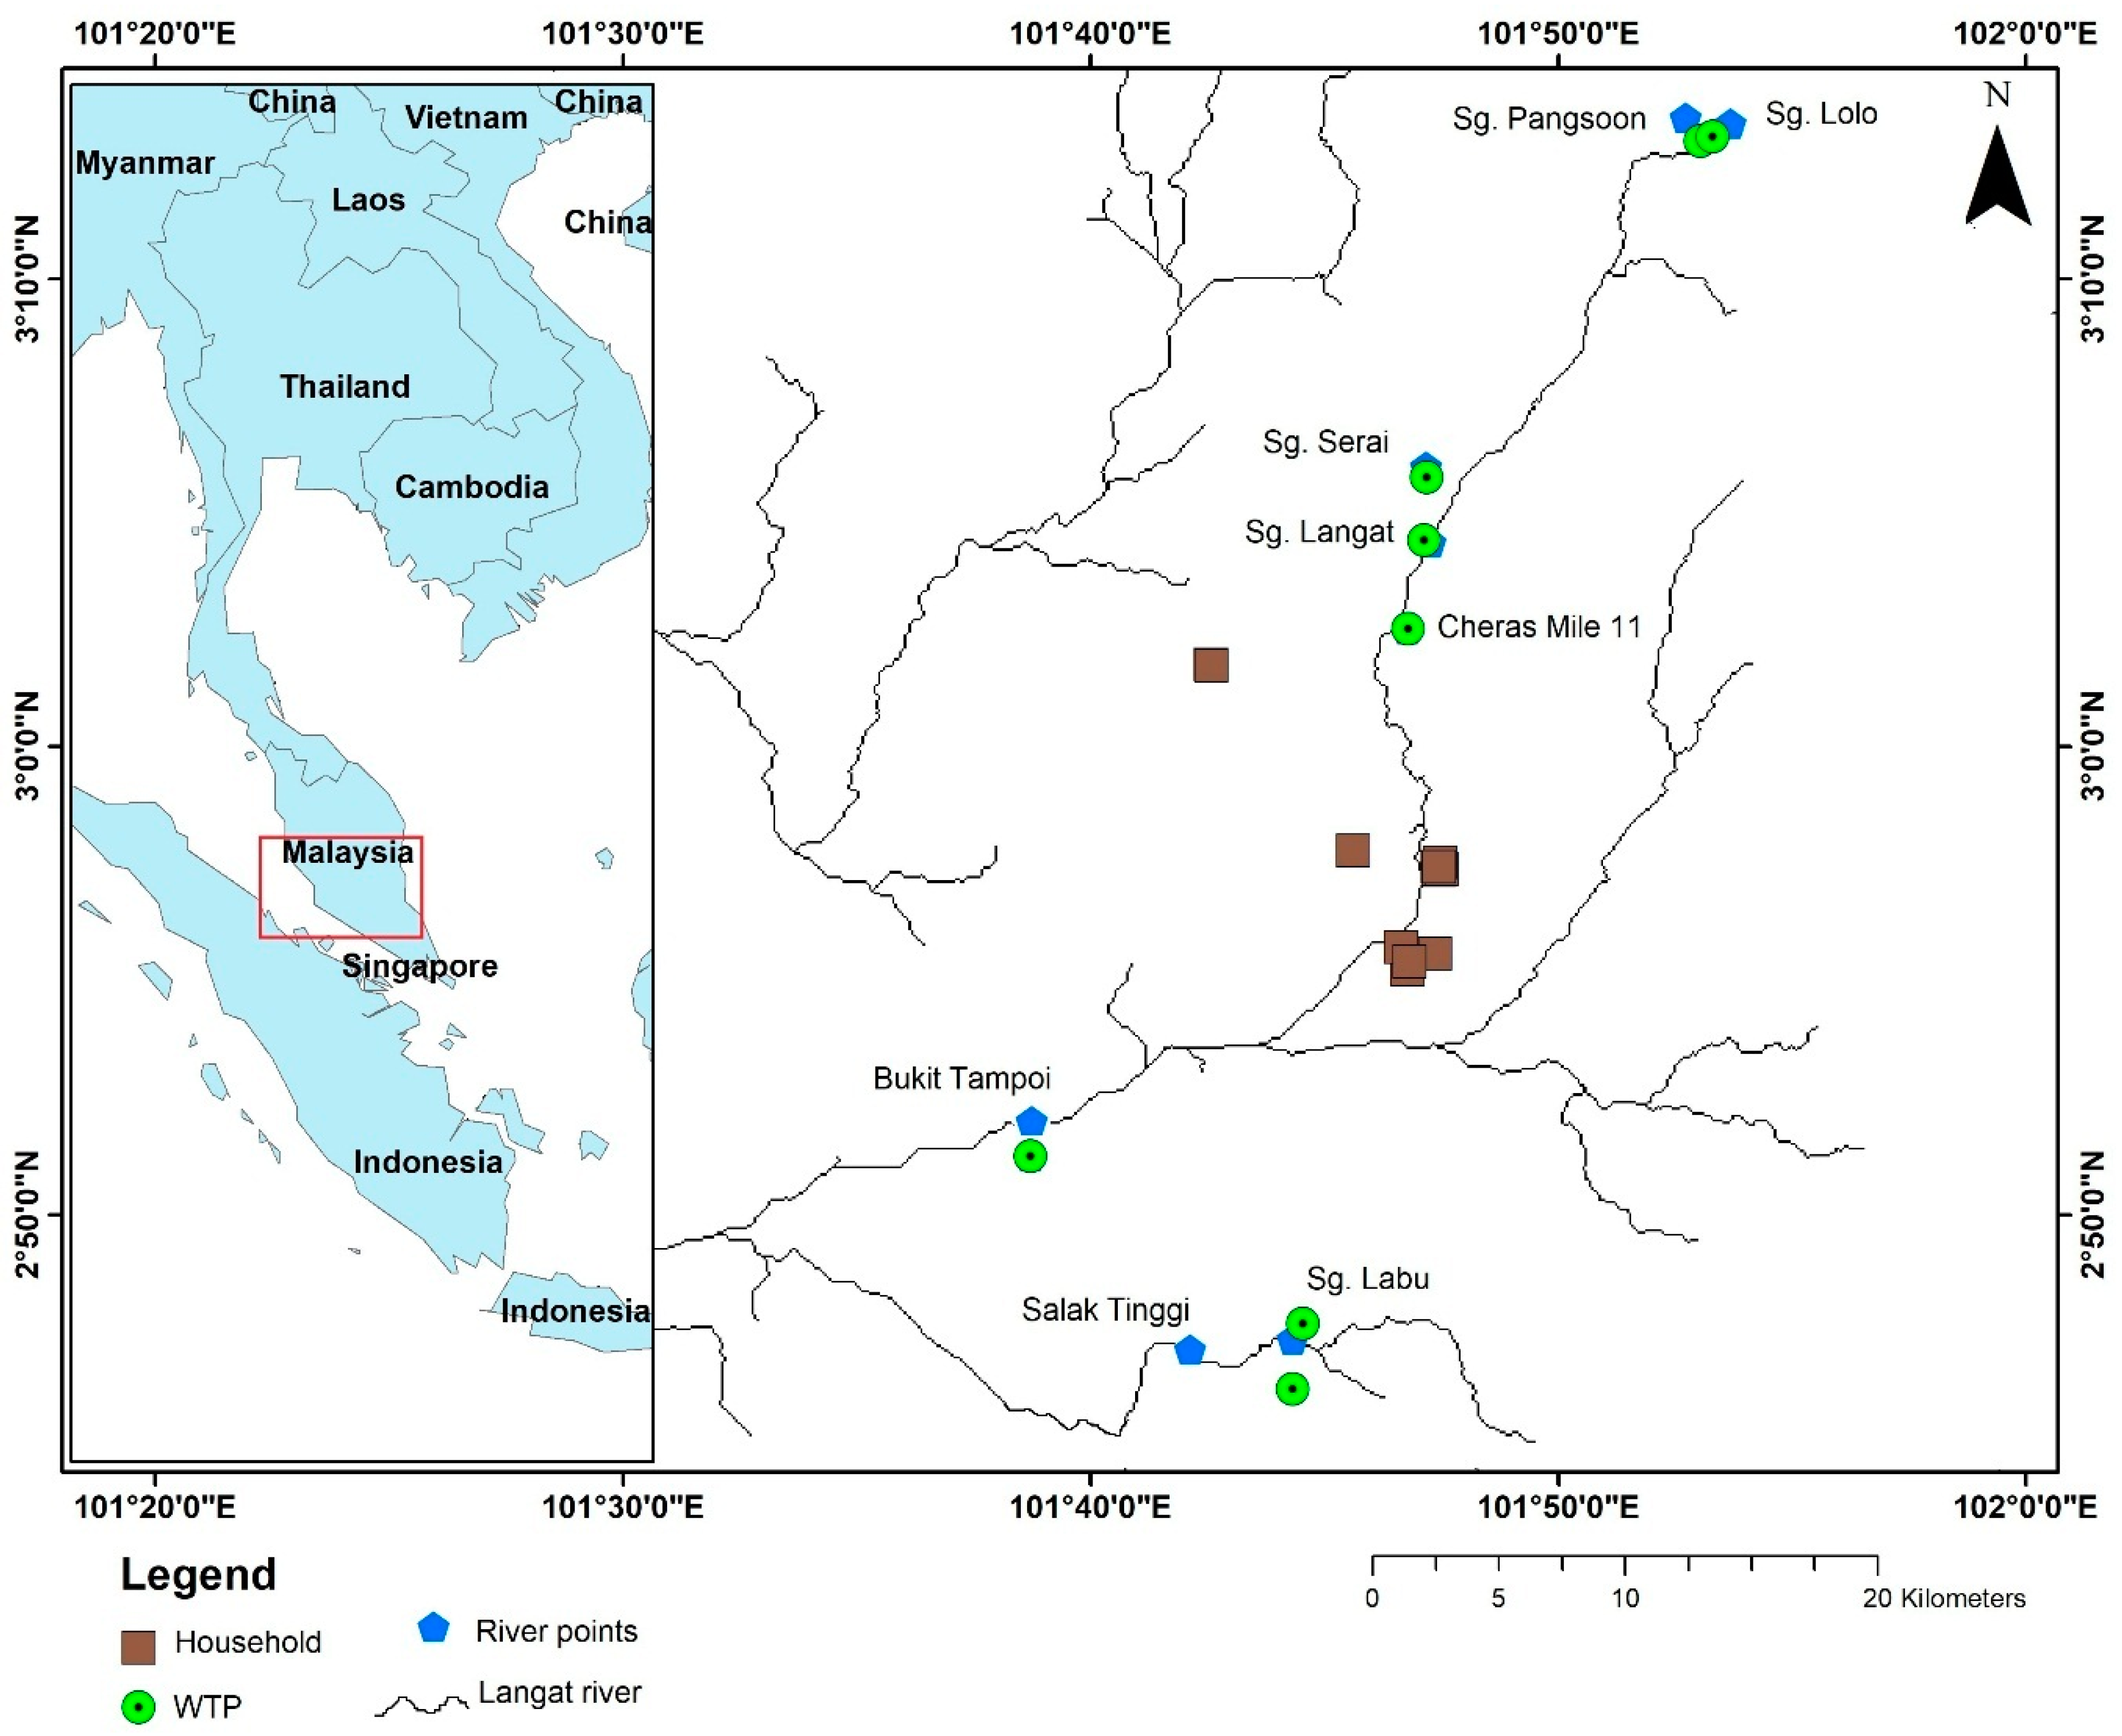
2.1. Water Sample Collection
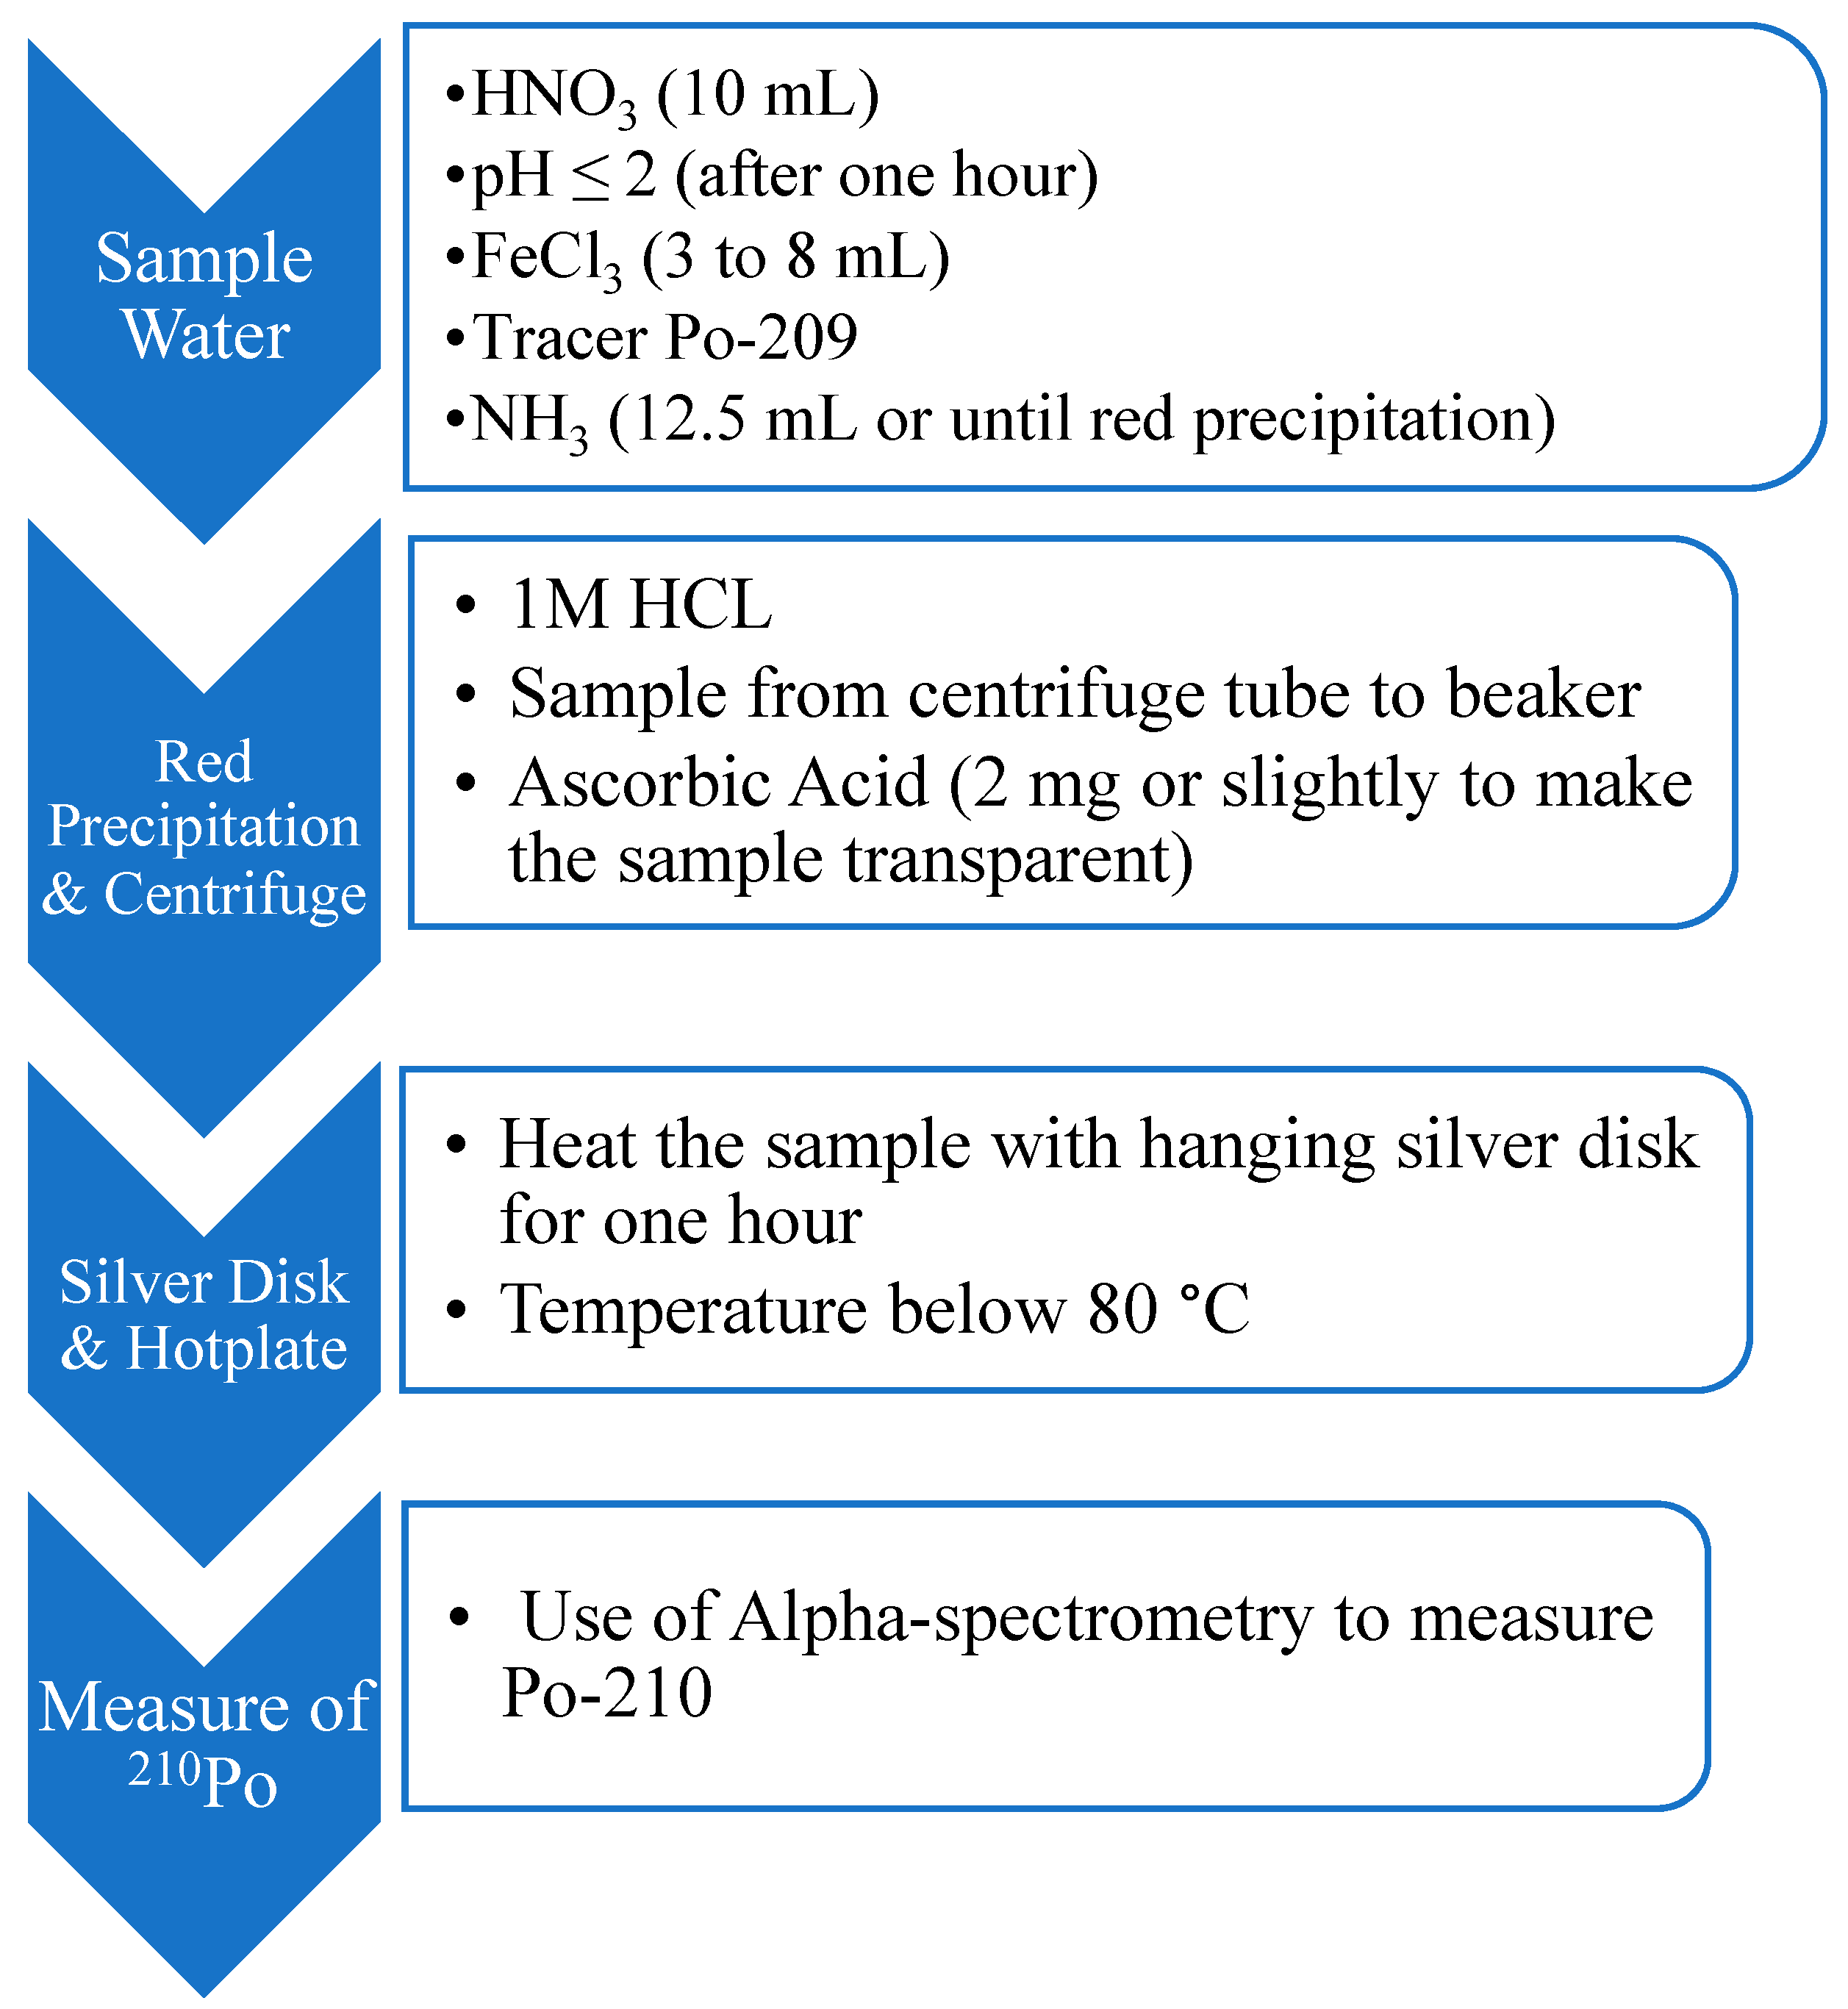
2.2. Analysis of Po-210
2.3. Calculating Po-210 Activity
2.4. Calculating Annual Effective Dose of Po-210
2.5. Household Questionnaire Survey
2.6. Time-Series Environmental Data
3. Results and Discussion
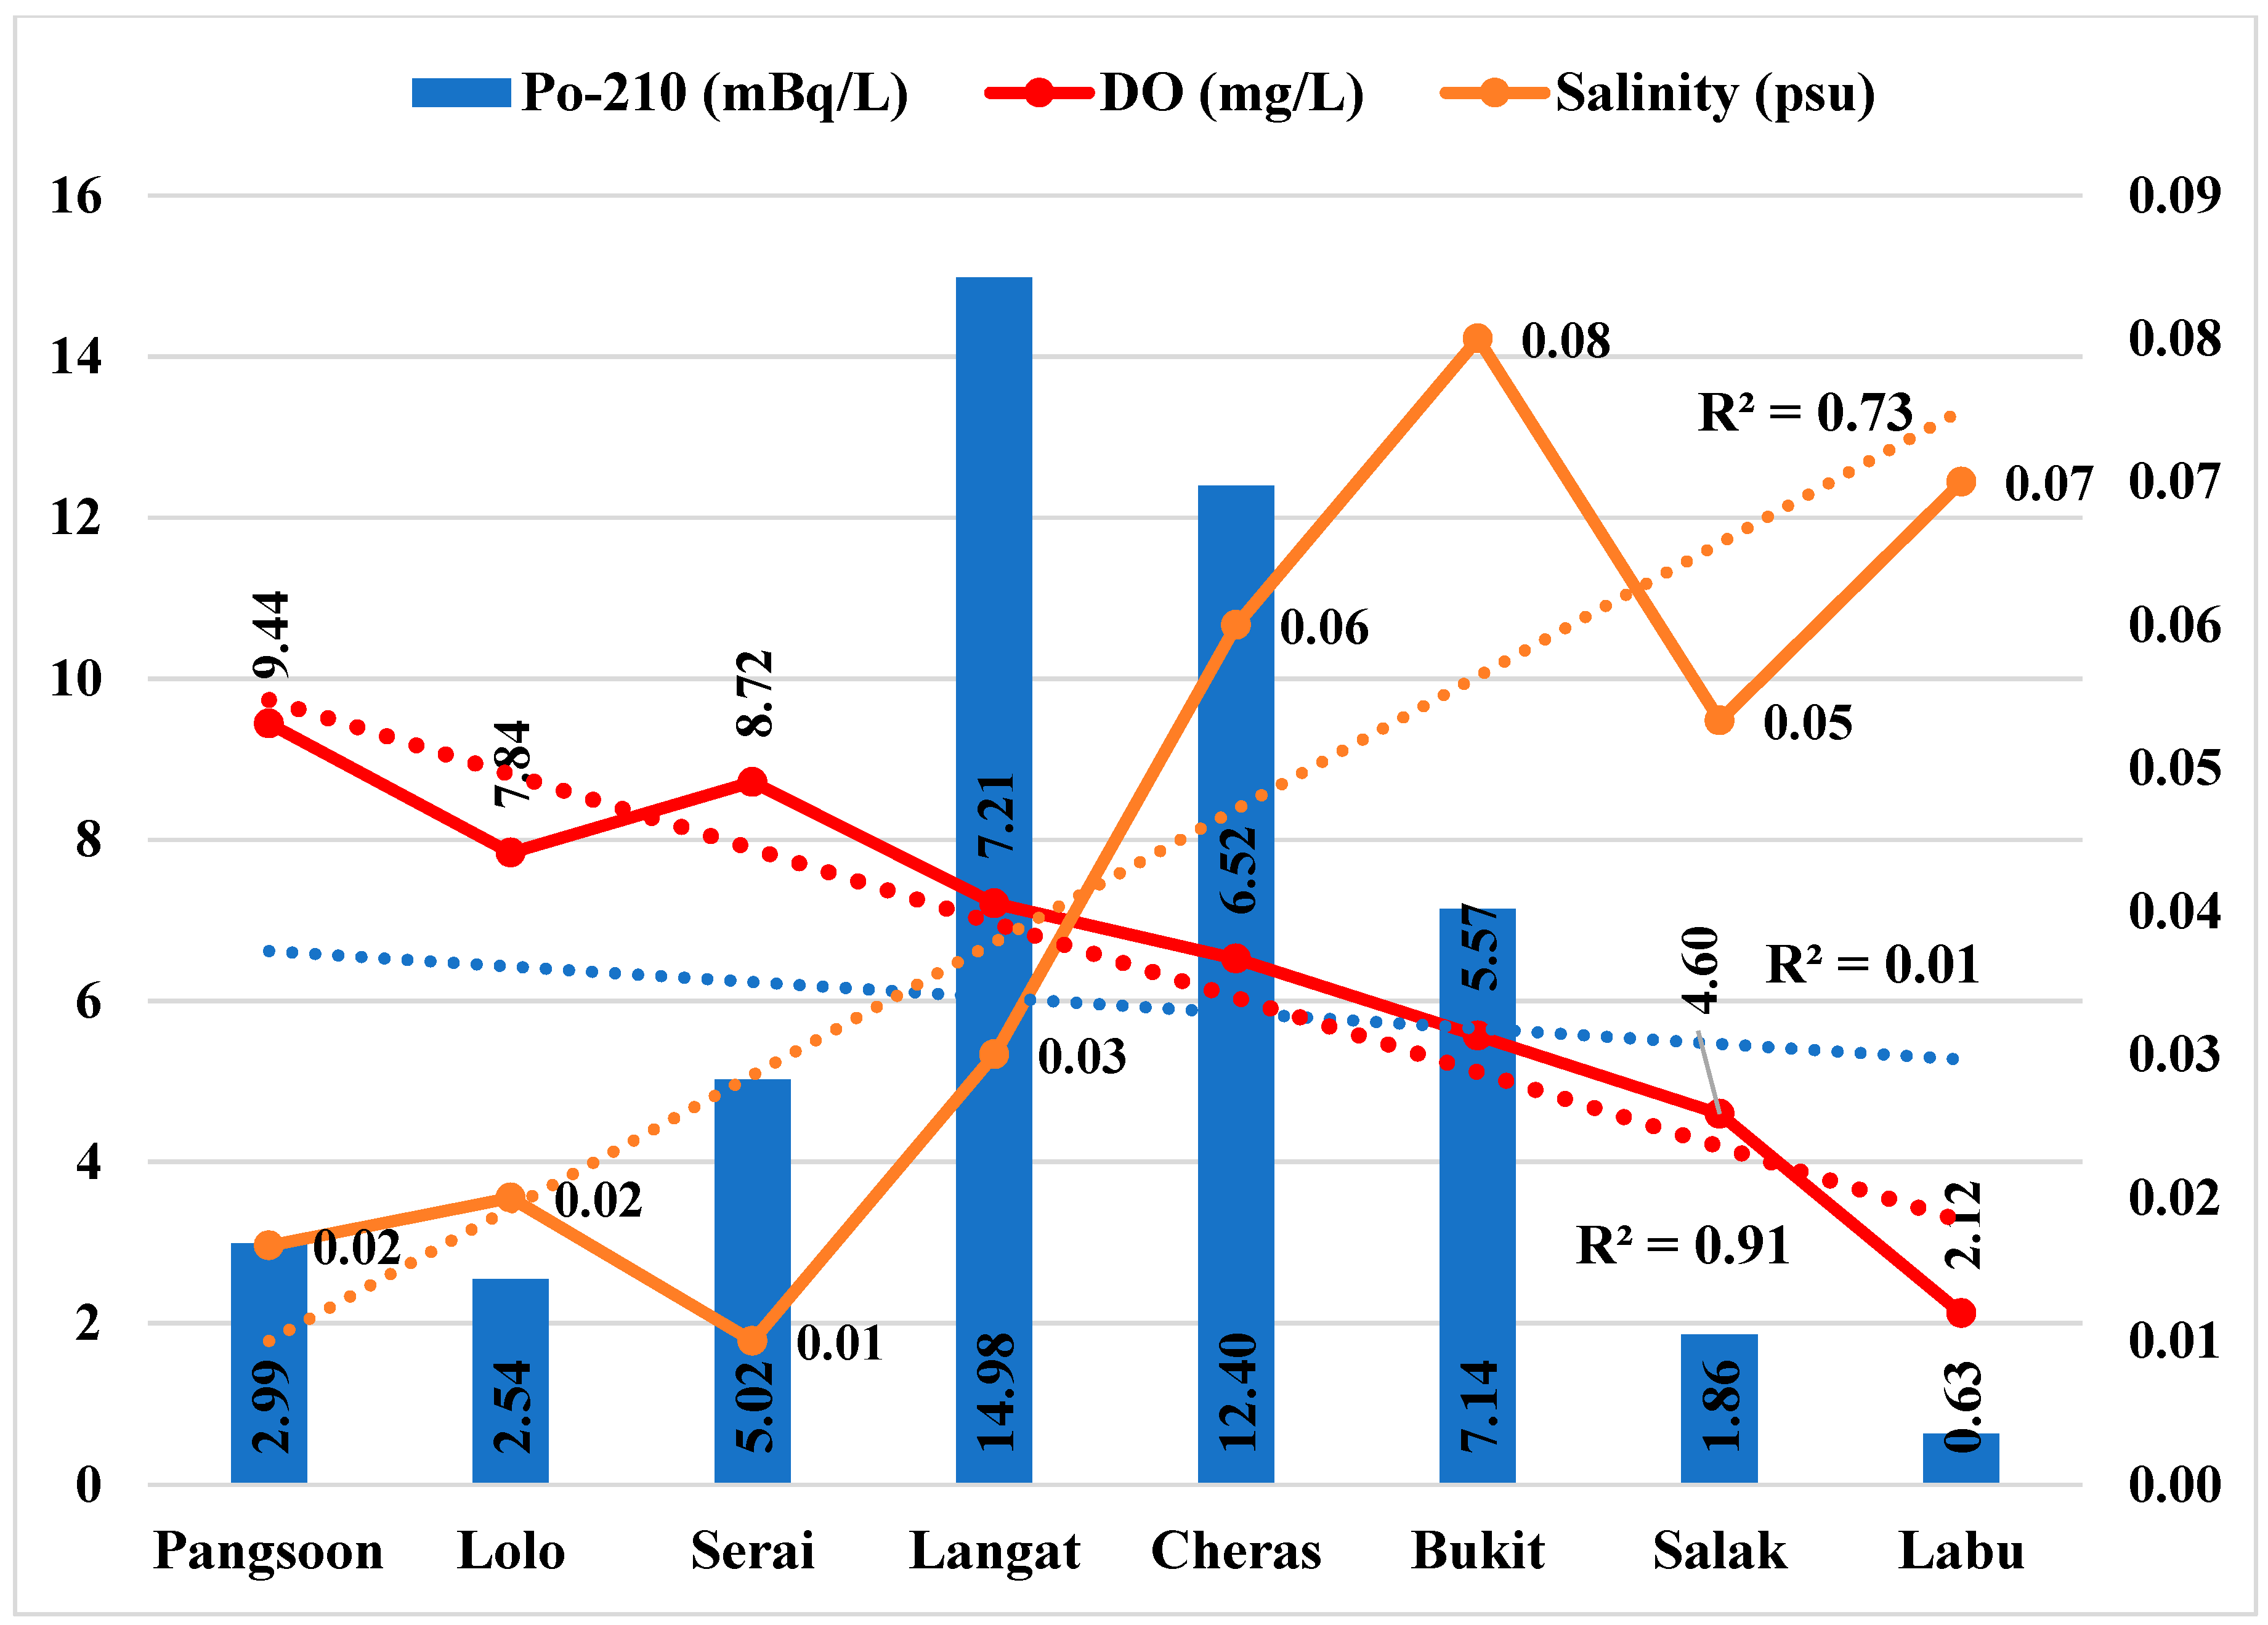
3.1. Po-210 Status in Raw and Treated Water
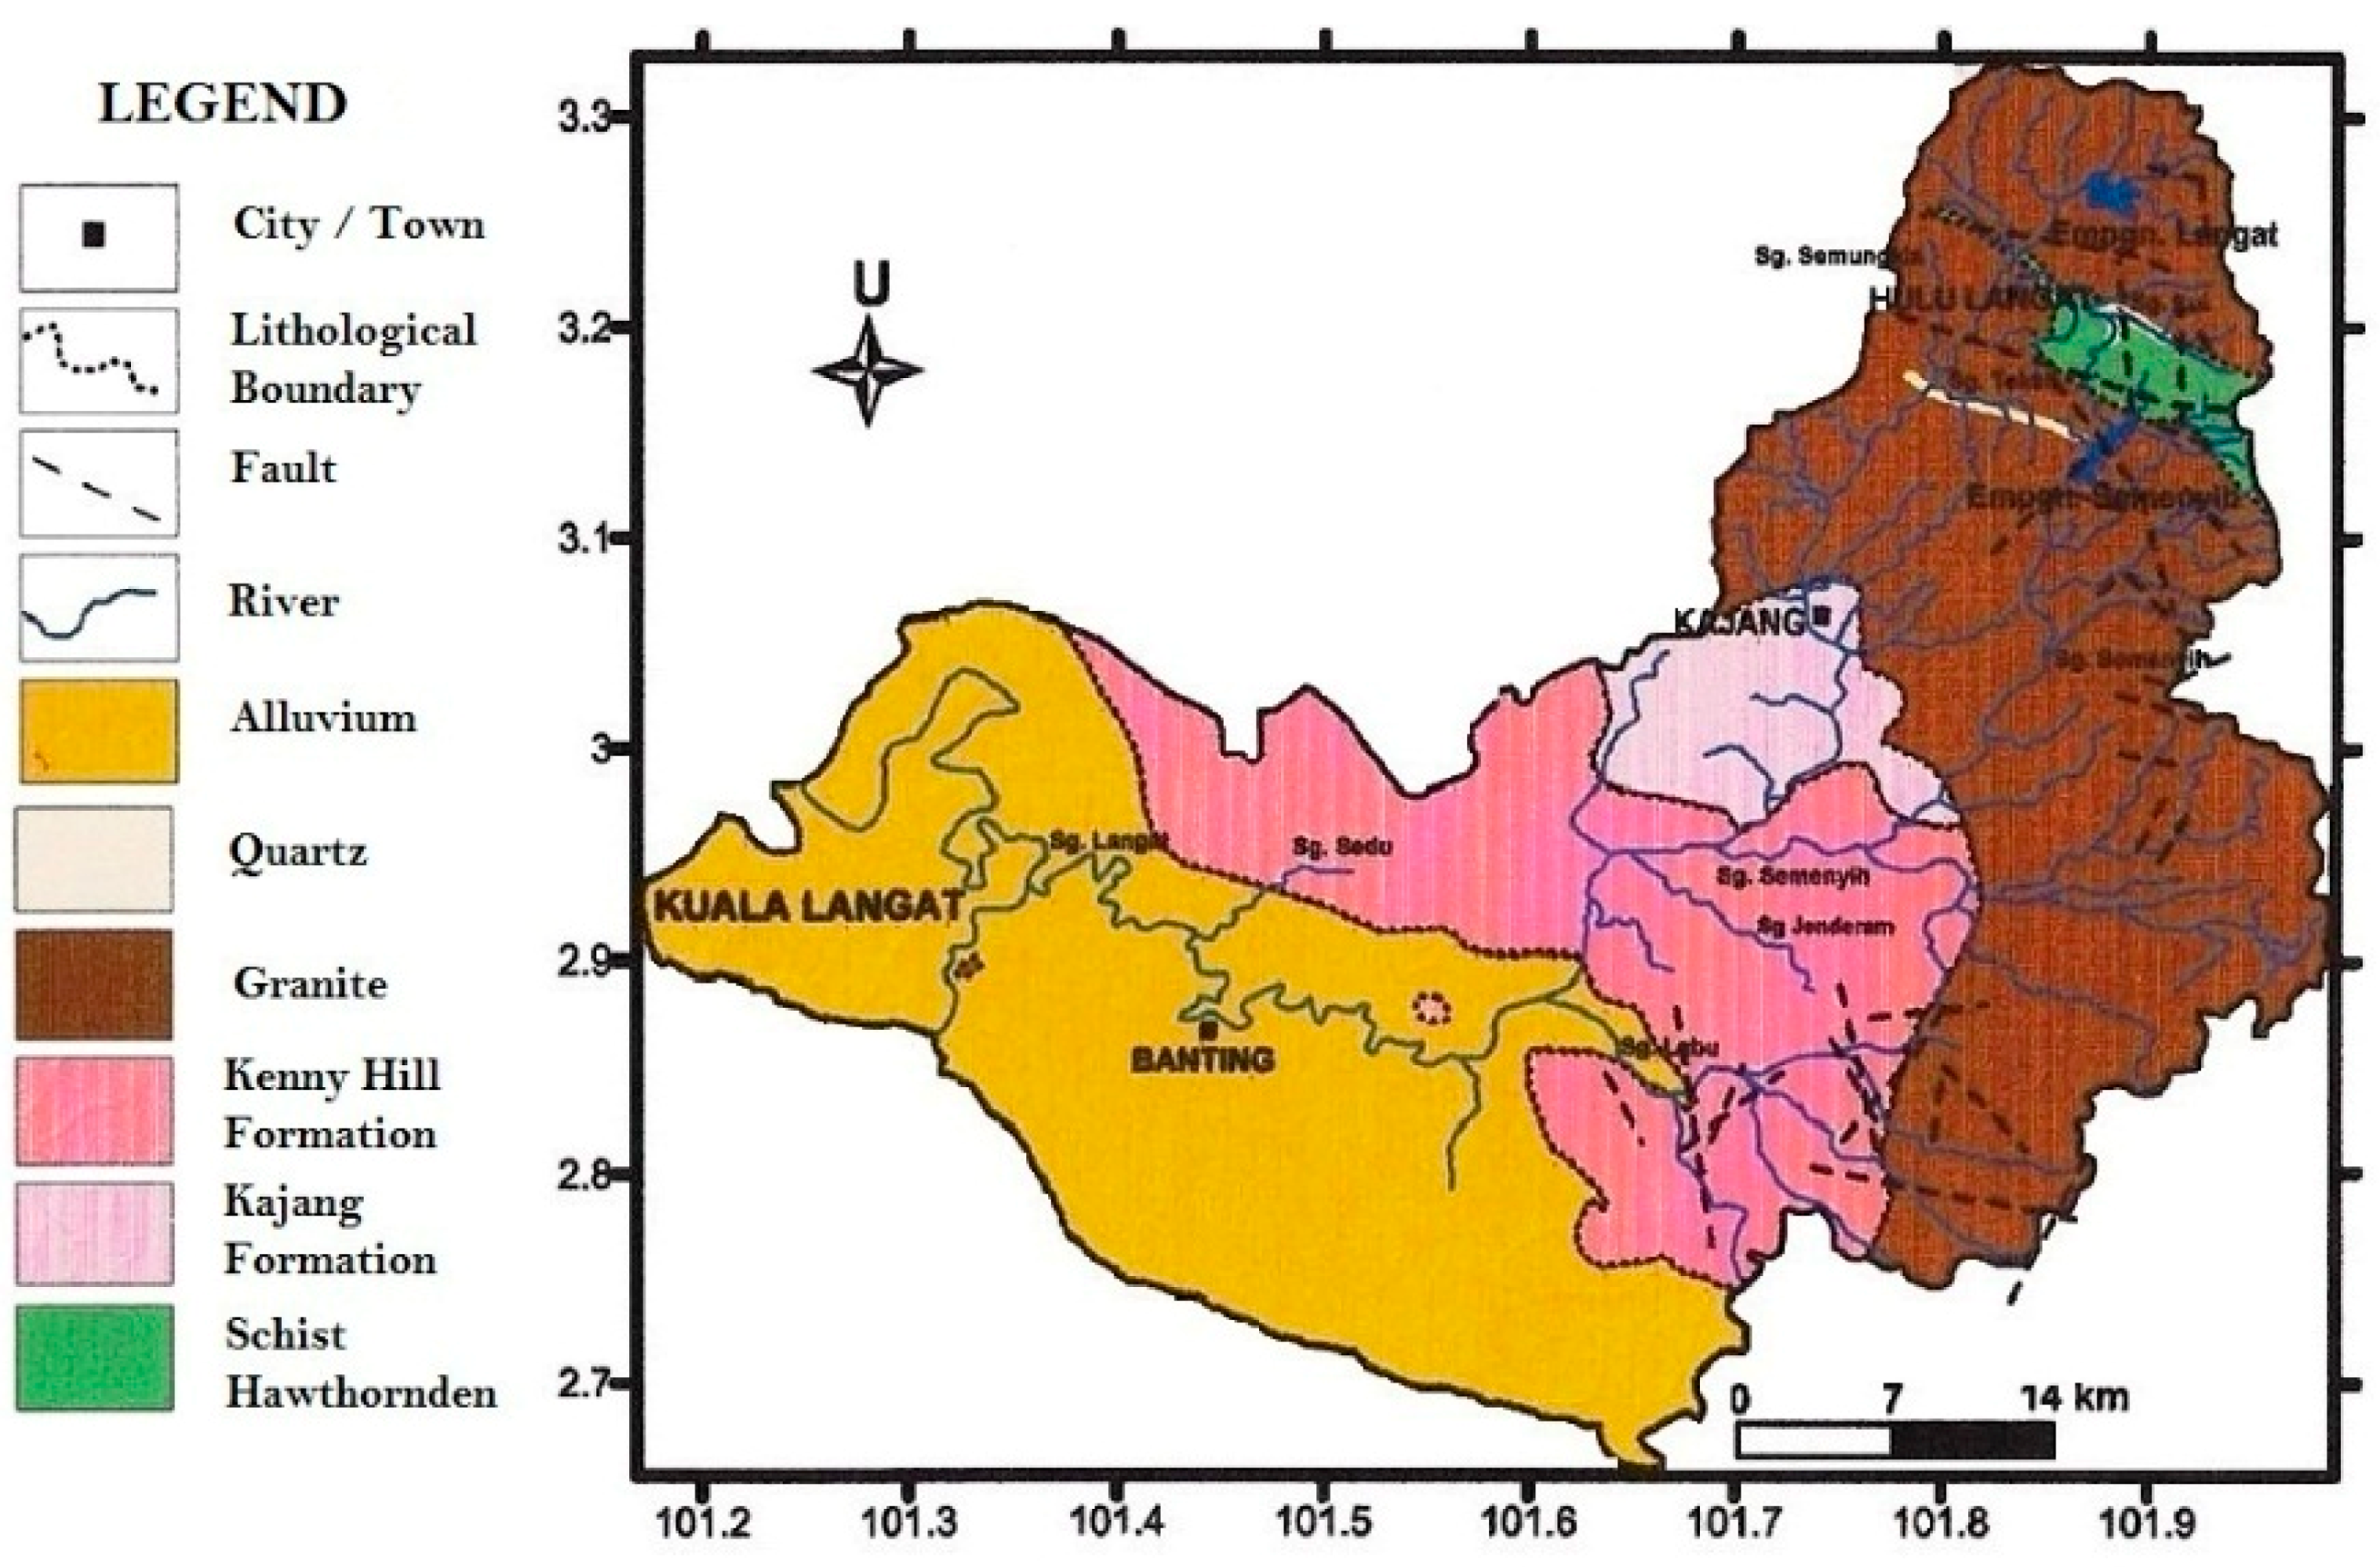
Sources of Po-210 in the Langat River
3.2. Po-210 Status in Household’s Tap and Filtration Water
3.3. Human Health Hazard of Po-210 Ingestion
4. Conclusions
Author Contributions
Funding
Acknowledgments
Conflicts of Interest
References
- Yii Mei-Wo, P.; Assyikeen, M.J.N.; Ahmad, Z. Radiation Hazard from Natural Radioactivity in the Sediment of the East Coast Peninsular Malaysia Exclusive Economic Zone (EEZ). Malays. J. Anal. Sci. 2011, 15, 202–212. [Google Scholar]
- Sanusi, M.S.M.; Ramli, A.T.; Wagiran, H.; Lee, M.H.; Heryanshah, A.; Said, M.N. Investigation of geological and soil influence on natural gamma radiation exposure and assessment of radiation hazards in Western Region, Peninsular Malaysia. Environ. Earth Sci. 2016. [Google Scholar] [CrossRef]
- Sanusi, M.S.M.; Ramli, A.T.; Gabdo, H.T.; Garba, N.N.; Heryanshah, A.; Wagiran, H.; Said, M.N. Isodose mapping of terrestrial gamma radiation dose rate of Selangor state, Kuala Lumpur and Putrajaya, Malaysia. J. Environ. Radioact. 2014. [Google Scholar] [CrossRef] [PubMed]
- Adnan, M.; Siti, N.S.B.; Yusoff, S.; Chua, Y.P. Soil chemistry and pollution study of a closed landfill site at Ampar Tenang, Selangor, Malaysia. Waste Manag. Res. 2013. [Google Scholar] [CrossRef]
- Alam, L.; Mohamed, C.A.R. Polonium. Radionuclides in the Environment; Atwood, D.A., Ed.; John Wiley & Sons Ltd.: Chichester, UK, 2010; pp. 149–154. [Google Scholar]
- Jobbágy, V.; Kávási, N.; Somlai, J.; Máté, B.; Kovács, T. Radiochemical characterization of spring waters in Balaton Upland, Hungary, estimation of radiation dose to members of public. Microchem. J. 2010, 94, 159–165. [Google Scholar] [CrossRef]
- Kurttio, P.; Salonen, L.; Ilus, T.; Pekkanen, J.; Pukkala, E. Auvinen, A. Well water radioactivity and risk of cancers of the urinary organs. Environ. Res. 2006, 102, 333–338. [Google Scholar] [CrossRef] [PubMed]
- Benedik, L.; Vasile, M.; Spasova, Y.; Wätjen, U. Sequential determination of 210Po and uranium radioisotopes in drinking water by alpha-particle spectrometry. Appl. Radiat. Isot. 2009, 67, 770–775. [Google Scholar] [CrossRef] [PubMed]
- Jia, G.; Torri, G.; Magro, L. Concentrations of 238U, 234U, 235U, 232Th, 230Th, 228Th, 226Ra, 228Ra, 224Ra, 210Po, 210Pb and 212Pb in drinking water in Italy: Reconciling safety standards based on measurements of gross α and β. J. Environ. Radioact. 2009, 100, 941–949. [Google Scholar] [CrossRef] [PubMed]
- Seiler, R. 210Po in drinking water, its potential health effects, and inadequacy of the gross alpha activity MCL. Sci. Total Environ. 2016, 568, 1010–1017. [Google Scholar] [CrossRef] [PubMed]
- Vasile, M.; Loots, H.; Jacobs, K.; Verheyen, L.; Sneyers, L.; Verrezen, F.; Bruggeman, M. Determination of 210Pb, 210Po, 226Ra, 228Ra and uranium isotopes in drinking water in order to comply with the requirements of the EU ‘Drinking Water Directive’. Appl. Radiat. Isot. 2016, 109, 465–469. [Google Scholar] [CrossRef] [PubMed]
- Maguire, H.; Fraser, G.; Croft, J.; Bailey, M.; Tattersall, P.; Morrey, M.; Walsh, B. Assessing public health risk in the London polonium-210 incident, 2006. Public Health 2010, 124, 313–318. [Google Scholar] [CrossRef] [PubMed]
- Walsh, M.; Wallner, G.; Jennings, P. Radioactivity in drinking water supplies in Western Australia. J. Environ. Radioact. 2014, 130, 56–62. [Google Scholar] [CrossRef] [PubMed] [Green Version]
- Musa, S. Radioactive Level in Malaysia Still Safe and Low. 2011. UKM News Portal. Available online: http://www.ukm.my/news/arkib/index.php/en/extras/689-radioactive-level-in-malaysia-still-safe-and-low.html (accessed on 5 August 2018).
- Almayahi, B.A.; Tajuddin, A.A.; Jaafar, M.S. Measurements of natural radionuclides in human teeth and animal bones as markers of radiation exposure from soil in the Northern Malaysian Peninsula. Radiat. Phys. Chem. 2014, 97, 56–67. [Google Scholar] [CrossRef]
- Ahmad, N.; Jaafar, M.S.; Bakhash, M.; Rahim, M. An overview on measurements of natural radioactivity in Malaysia. J. Radiat. Res. Appl. Sci. 2015, 8, 136–141. [Google Scholar] [CrossRef]
- Almayahi, B.; Tajuddin, A.; Jaafar, M. Radiation hazard indices of soil and water samples in Northern Malaysian Peninsula. Appl. Radiat. Isot. 2012, 70, 2652–2660. [Google Scholar] [CrossRef] [PubMed]
- Tawalbeh, A.A.; Samat, S.B.; Yasir, M.S. Radionuclides level and its radiation hazard index in some drinks consumed in the central zone of Malaysia. Sains Malays. 2013, 42, 319–323. [Google Scholar]
- Ahmed, M.F.; Alam, L.; Ta, G.C.; Mohamed, C.A.R.; Mokhtar, M. A Preliminary Study on the Concentration of Po-210 in the Tap Water. In Proceedings of the 3rd International Conference Limit to Growth and Sustainability: Contemporary Issues and Perspectives, Kedah, Malaysia, 5–7 December 2015. [Google Scholar]
- Yap, C.K.; Ismail, A.; Tan, S.G.; Omar, H. Concentrations of Cu and Pb in the offshore and intertidal sediments of the west coast of Peninsular Malaysia. Environ. Int. 2002. [Google Scholar] [CrossRef]
- Ta, G.C.; Meng, C.K.; Mokhtar, M.; Ern, L.K.; Alam, L.; Sultan, M.M.A.; Ali, N.L. Enhancing the regulatory framework for upstream chemicals management in Malaysia: Some proposals from an academic perspective. J. Chem. Health Saf. 2016, 23, 12–18. [Google Scholar] [CrossRef]
- Alina, M.; Azrina, A.; Yunus, M.A.S.; Zakiuddin, M.S.; Effendi, M.F.H.; Muhammad, R.R. Heavy metals (mercury, arsenic, cadmium, plumbum) in selected marine fish and shellfish along the straits of Malacca. Int. Food Res. J. 2012, 19, 135–140. [Google Scholar]
- Hamzah, Z.; Rosli, T.N.T.M.; Saat, A.; Wood, A.K. An assessment of natural radionuclides in water of Langat River estuary, Selangor. AIP Conf. Proc. 2014, 1584, 228. [Google Scholar] [CrossRef]
- Hamzah, Z.; Rahman, S.A.; Saat, A.; Agos, S.S.; Ahmad, Z. Measurement of 226 Ra in river water using liquid scintillation counting technique. J. Nucl. Relat. Technol. 2010, 7, 12–23. [Google Scholar]
- Bahari, I.; Mohsen, N.; Abdullah, P. Radioactivity and radiological risk associated with effluent sediment containing technologically enhanced naturally occurring radioactive materials in amang (tin tailings) processing industry. J. Environ. Radioact. 2007, 95, 161–170. [Google Scholar] [CrossRef] [PubMed]
- Department of Environment (DOE). Malaysia Environmental Quality Report 2013; Department of Environment: Putrajaya, Malaysia, 2013.
- Juahir, H.H. Water Quality Data Analysis and Modeling of the Langat River Basin. Ph.D. Thesis, University of Malaya, Kuala Lumpur, Malaysia, 2009. Available online: http://repository.um.edu.my/1223/5/Chapter%203%20Revised.pdf (accessed on 07 February 2015).
- Ashraf, M.A.; Maah, M.J.; Yusoff, I.; Wajid, A.; Mahmood, K. Sand mining effects, causes and concerns: A case study from Bestari Jaya, Selangor, Peninsular Malaysia. Sci. Res. Essays 2011. [Google Scholar] [CrossRef]
- Memarian, H.; Balasundram, S.K.; Talib, J.B.; Sood, A.M.; Abbaspour, K.C. Trend analysis of water discharge and sediment load during the past three decades of development in the Langat basin, Malaysia. Hydrol. Sci. J. 2012. [Google Scholar] [CrossRef]
- Lin, T.I. Regulatory Control of Milling of Minerals Containing Naturally Occurring Radioactive Materials (NORM) in Malaysia. At. Energy Licens. Board, Malaysia. 2015. Available online: https://www.iaea.org/OurWork/ST/NE/NEFW/Technical-Areas/NFC/documents/uranium/tr-darwin-2012/Presentations/46.Teng (Malaysia)_-_Regulatory_control_of_NORM_in_Malaysia.pdf (accessed on 1 February 2018).
- JPN. Atomic Energy Licensing (Radioactive Waste Management) Regulations 2011. Jabatan Peguam Negera/Attorney General’s Chambers of Malaysia. Federal Government Gazette, Part VIII, 13 (1b). 16 August 2011. Available online: http://www.aelb.gov.my/malay/dokumen/perundangan/P.U.(A)274.pdf (accessed on 7 August 2018).
- MOH. Drinking Water Quality Standard. Ministry of Health: Malaysia, 2010. Available online: http://kmam.moh.gov.my/public-user/drinking-water-quality-standard.html (accessed on 28 February 2018).
- Ahmed, M.F.; Lubna, A.; Choo, T.G.; Rahim, M.C.; Mazlin, M. A review on the chemical pollution of Langat River, Malaysia. Asian J. Water Environ. Pollut. 2016, 13, 9–15. [Google Scholar] [CrossRef]
- Lim, W.Y.; Aris, A.Z.; Ismail, T.H.T.; Zakaria, M.P. Elemental hydrochemistry assessment on its variation and quality status in Langat River, Western Peninsular Malaysia. Environ. Earth Sci. 2013. [Google Scholar] [CrossRef] [Green Version]
- Mohamed, C.A.R.; Ahmad, Z.; Mon, G.C. Aktiviti 226Ra dalam sistem aliran sungai Lembangan Langat, Selangor. Malays. J. Anal. Sci. 2006, 10, 295–302. [Google Scholar]
- Yussuf, N.M.; Hossain, I.; Wagiran, H. Natural radioactivity in drinking and mineral water in Johor Bahru (Malaysia). Sci. Res. Essays 2012, 7, 1070–1075. [Google Scholar] [CrossRef]
- Amin, Y.B.M.; Jemangin, M.H.; Mahat, R.H. Concentration of Ra-226 in Malaysian Drinking and Bottled Mineral Water. AIP Conf. Proc. 2010, 1250. [Google Scholar] [CrossRef]
- Mohamed, C.A.R.; Siang, T.C. Seasonal variation of Po 210 in different salinity: Case of Kuala Selangor river, west coast of peninsular Malaysia. (Special section: Ocean pollution). Coast. Mar. Sci. 2010, 34, 186–194. [Google Scholar]
- International Atomic Energy Agency (IAEA). A Procedure for the Determination of Po-210 in Water Samples by Alpha Spectrometry Vienna; International Atomic Energy Agency: Vienna, Austria, 2009. [Google Scholar]
- Saili, N.F.B.B. Aktiviti Polonium-210 (210Po) dan Plumbum-210 (210Pb) Dalam turus air di Sungai Mersing, Johor. Master’s Thesis, Faculty of Science & Technology, Universiti Kebangsaan Malaysia, Bangi Selangor, Malaysia, 2012. [Google Scholar]
- World Health Organization (WHO). Guidelines for Drinking-Water Quality: Fourth Edition Incorporating the First Addendum; World Health Organization: Geneva, Switzerland, 2017; Available online: http://apps.who.int/iris/bitstream/10665/254637/1/9789241549950-eng.pdf?ua=1 (accessed on 29 May 2017).
- Jia, G.; Torri, G. Estimation of radiation doses to members of the public in Italy from intakes of some important naturally occurring radionuclides (238U, 234U, 235U, 226Ra, 228Ra, 224Ra and 210Po) in drinking water. Appl. Radiat. Isot. 2007, 65, 849–857. [Google Scholar] [CrossRef] [PubMed]
- Department of Statistics (DOS). Population Distribution by Local Authority Areas and Mukims 2010; Department of Statistics: Putrajaya, Malaysia, 2013. Available online: http://newss.statistics.gov.my/newss-portalx/ep/epProductFreeDownloadSearch.seam (accessed on 25 November 2015).
- Yamane, T. Statistics: An Introductory Analysis, 2nd ed.; Harper and Row: New York, NY, USA, 1967. [Google Scholar]
- Alam, M.M. Linkages between Climatic Changes and Food Security among the Poor and Low-Income Households in the East Coast Economic Region (ECER), Malaysia. Ph.D. Thesis, Universiti Kebangsaan Malaysia, Bangi Selangor, Malaysia, 2014. [Google Scholar]
- Poon, W.C.; Herath, G.; Sarker, A.; Masuda, T.; Kada, R. River and fish pollution in Malaysia: A green ergonomics perspective. Appl. Ergon. 2016, 57, 80–93. [Google Scholar] [CrossRef] [PubMed]
- Juahir, H.; Zain, S.M.; Yusoff, M.K.; Hanidza, T.T.; Armi, A.M.; Toriman, M.E.; Mokhtar, M. Spatial water quality assessment of Langat River Basin (Malaysia) using environmetric techniques. Environ. Monit. Assess. 2011, 173, 625–641. [Google Scholar] [CrossRef] [PubMed]
- Aris, A.Z.; Lim, W.Y.; Looi, L.J. Natural and Anthropogenic Determinants of Freshwater Ecosystem Deterioration: An environmental Forensic Study of the Langat River Basin, Malaysia. In Environmental Management of River Basin Ecosystems; Ramkumar, M., Ed.; Springer: Basel, Switzerland, 2015; pp. 455–476. [Google Scholar]
- Ehmann, W.D.; Vance, D.E. Radiochemistry and Nuclear Methods of Analysis; John Wiley & Sons, Inc.: New York, NY, USA, 1991; p. 479. ISBN 0-471-60076-8 (c). [Google Scholar]
- Shaheed, K.; Somasundaram, S.S.N.; Hameed, P.S.; Iyengar, M.A.R. A study of polonium-210 distribution aspects in the riverine ecosystem of Kaveri, Tiruchirappalli, India. Environ. Pollut. 1997, 95, 371–377. [Google Scholar] [CrossRef]
- Alam, L.; Mokhtar, M.B.; Alam, M.; Bari, M.; Kathijotes, N.; Ta, G.C.; Ern, L.K. Assessment of environmental and human health risk for contamination of heavy metal in tilapia fish collected from Langat Basin, Malaysia. Asian J. Water Environ. Pollut. 2015, 12, 21–30. [Google Scholar]
- United States Environmental Protection Agency (USEPA). Radionuclides in Drinking Water: A Small Entity Compliance Guide; United States Environmental Protection Agency: Washington, DC, USA, 2002. Available online: https://www.epa.gov/sites/production/files/2015-06/documents/compliance-radionuclidesindw.pdf (accessed on 12 August 2017).
- Mokhtar, M.B.; Toriman, M.E.H.; Hossain, A.A. Social learning in facing challenges of sustainable development: A case of Langat River Basin, Malaysia. Res. J. Appl. Sci. 2010, 5, 434–443. [Google Scholar]
- Mokhtar, M.B.; Toriman, M.E.H.; Hossain, M.; Abraham, A.; Tan, K.W. Institutional challenges for integrated river basin management in Langat River Basin, Malaysia. Water Environ. J. 2011, 25, 495–503. [Google Scholar] [CrossRef]
- Seiler, R.L. 210Po in Nevada groundwater and its relation to gross alpha radioactivity. Groundwater 2011, 49, 160–171. [Google Scholar] [CrossRef] [PubMed]
- Theng, T.L.; Mohamed, C.A.R. Activities of 210Po and 210Pb in the water column at Kuala Selangor, Malaysia. J. Environ. Radioact. 2005. [Google Scholar] [CrossRef] [PubMed]
- Yunus, S.M.; Hamzah, Z.; Wood, A.K.H.; Saat, A. Natural Radionuclides and heavy Metals Pollution in Seawater at Kuala Langat Coastal Area. Malays. J. Anal. Sci. 2015, 19, 766–774. [Google Scholar]
- Lim, W.Y.; Aris, A.Z.; Zakaria, M.P. Spatial Variability of Metals in Surface Water and Sediment in the Langat River and Geochemical Factors That Influence Their Water-Sediment Interactions. Sci. World J. 2012. [Google Scholar] [CrossRef] [PubMed]
- Sabuti, A.A.; Mohamed, C.A.R. High 210Po Activity Concentration in the Surface Water of Malaysian Seas Driven by the Dry Season of the Southwest Monsoon (June–August 2009). Estuaries Coasts 2015, 38, 482–493. [Google Scholar] [CrossRef]
- Yusoff, A.H.; Mohamed, C.A.R. Mini Review Uranium-Thorium Decay Series in the Marine Environment of the Southern South China Sea. J. Geol. Geophys. 2016, 5, 1–9. [Google Scholar] [CrossRef]
- Vasukevich, T.A.; Nitievskaya, L.S. Application of deactivating properties of some sorbents in aquaculture feed production. Radiats. Biol. Radioecol. 2014, 54, 613–620. [Google Scholar] [PubMed]
- Strumińska-Parulska, D.I.; Skwarzec, B.; Tuszkowska, A.; Jahnz-Bielawska, A.; Boryło, A. Polonium (210Po), uranium (238U) and plutonium (239+240Pu) in the biggest Polish rivers. J. Radioanal. Nucl. Chem. 2010. [Google Scholar] [CrossRef]
- Persson, B.R.R.; Holm, E. Polonium-210 and lead-210 in the terrestrial environment: A historical review. J. Environ. Radioact. 2011. [Google Scholar] [CrossRef] [PubMed]
- Leong, K.H.; Tan, L.B.; Mustafa, A.M. Contamination levels of selected organochlorine and organophosphate pesticides in the Selangor River, Malaysia between 2002 and 2003. Chemosphere 2007, 66, 1153–1159. [Google Scholar] [CrossRef] [PubMed]
- Santhi, V.A.; Sakai, N.; Ahmad, E.D.; Mustafa, A.M. Occurrence of bisphenol A in surface water, drinking water and plasma from Malaysia with exposure assessment from consumption of drinking water. Sci. Total Environ. 2012, 427, 332–338. [Google Scholar] [CrossRef] [PubMed]
- Alsalahi, M.A.; Latif, M.T.; Ali, M.M.; Magam, S.M.; Wahid, N.B.A. Distribution of surfactants along the estuarine area of Selangor River, Malaysia. Mar. Pollut. Bull. 2014, 80, 344–350. [Google Scholar] [CrossRef] [PubMed]
- Ahmed, M.F.; Alam, L.; Ta, G.C.; Mohamed, C.A.R.; Mokhtar, M. A Preliminary Study on the Concentration of Po-210 in the Tap Water. In In-House Seminar of the Chemical Oceanography Laboratory; Chemical Oceanography Laboratory, School of Environmental Science and Natural Resources, Faculty of Science and Technology, Universiti Kebangsaan Malaysia: Kuala Selangor, Malaysia, 2016; Volume 1, pp. 34–38. ISBN 978-967-0829-22-7. [Google Scholar]
- Hong, G.H.; Park, S.K.; Baskaran, M.; Kim, S.H.; Chung, C.S.; Lee, S.H. Lead-210 and polonium-210 in the winter well-mixed turbid waters in the mouth of the Yellow Sea. Cont. Shelf Res. 1999. [Google Scholar] [CrossRef]
- Carvalho, F.P. Distribution, cycling and mean residence time of 226Ra, 210Pb and 210Po in the Tagus estuary. Stud. Environ. Sci. 1997. [Google Scholar] [CrossRef]
- Desideri, D.; Meli, M.A.; Feduzi, L.; Roselli, C.; Rongoni, A.; Saetta, D. 238U, 234U, 226Ra, 210Po concentrations of bottled mineral waters in Italy and their dose contribution. J. Environ. Radioact. 2007, 94, 86–97. [Google Scholar] [CrossRef] [PubMed]
- Skwarzec, B.; Strumińska, D.I.; Borylo, A. The radionuclides 234 U, 238 U and 210 Po in drinking water in Gdańsk agglomeration (Poland). J. Radioanal. Nucl. Chem. 2001, 250, 315–318. [Google Scholar] [CrossRef]
- Kannan, V.; Iyengar, M.A.R.; Ramesh, R. Dose estimates to the public from 210Po ingestion via dietary sources at Kalpakkam (India). Appl. Radiat. Isot. 2001, 54, 663–674. [Google Scholar] [CrossRef]
- Outola, I.; Nour, S.; Kurosaki, H.; Inn, K.; LaRosa, J. Investigation of radioactivity in selected drinking water samples from Maryland. J. Radioanal. Nucl. Chem. 2008, 277, 155–159. [Google Scholar] [CrossRef]
- Irlweck, K. Determination of 210Pb, 210Bi and 210Po in natural drinking water. J. Radioanal. Nucl. Chem. 2001, 249, 191–196. [Google Scholar] [CrossRef]
- Kozłowska, B.; Walencik, A.; Dorda, J.; Przylibski, T.A. Uranium, radium and 40K isotopes in bottled mineral waters from Outer Carpathians, Poland. Radiat. Meas. 2007, 42, 1380–1386. [Google Scholar] [CrossRef]
- World Health Organization (WHO). Polonium-210: Basic Facts and Questions; World Health Organization: Grneva, Switzerland, 2018; Available online: http://www.who.int/ionizing_radiation/pub_meet/polonium210/en/ (accessed on 10 March 2018).
- Zaga, V.; Lygidakis, C.; Chaouachi, K.; Gattavecchia, E. Polonium and lung cancer. J. Oncol. 2011. [Google Scholar] [CrossRef] [PubMed]
- Scott, B.R. Health risk evaluations for ingestion exposure of humans to polonium-210. Dose-Response 2007, 5, 94–122. [Google Scholar] [CrossRef] [PubMed]
- Munter, R. Technology for the removal of radionuclides from natural water and waste management: State of the art Rein Munter. Proc. Est. Acad. Sci. 2013. [Google Scholar] [CrossRef]
- Yii, M.W.; Zaharudin, A.; Abdul-Kadir, I. Distribution of naturally occurring radionuclides activity concentration in East Malaysian marine sediment. Appl. Radiat. Isot. 2009. [Google Scholar] [CrossRef] [PubMed]
- Ramli, A.T.; Hussein, A.W.M.A.; Wood, A.K. Environmental 238U and 232Th concentration measurements in an area of high level natural background radiation at Palong, Johor, Malaysia. J. Environ. Radioact. 2005. [Google Scholar] [CrossRef] [PubMed]


| Sample | Spiked Weight of Po-209 (g) | Stock Tracer Po-209 (dpm/g) | Spiked Tracer Po-209 (dpm) |
|---|---|---|---|
| Pangsoon River | 0.2893 | 12.17 | 3.52 |
| Pangsoon WTP | 0.4296 | 1.43 | 0.61 |
| Lolo River | 0.2957 | 12.17 | 3.60 |
| Lolo WTP | 0.3036 | 12.17 | 3.69 |
| Serai River | 0.4987 | 12.17 | 6.07 |
| Serai WTP | 0.3506 | 1.43 | 0.50 |
| Langat River | 0.2643 | 12.17 | 3.22 |
| Langat WTP | 0.4629 | 12.17 | 5.63 |
| Cheras River | 0.4695 | 12.17 | 5.71 |
| Cheras WTP | 0.4711 | 12.17 | 5.73 |
| Bukit River | 0.3597 | 12.17 | 4.38 |
| Bukit WTP | 0.4844 | 12.17 | 5.90 |
| Salak River | 0.2297 | 12.17 | 2.80 |
| Salak WTP | 0.4430 | 12.17 | 5.39 |
| Labu River | 0.2030 | 1.43 | 0.29 |
| Labu WTP | 0.4896 | 12.17 | 5.96 |
| Carbon Supply Hentian Kajang | 0.2768 | 12.17 | 3.37 |
| Carbon Filter Hentian Kajang | 0.2186 | 12.17 | 2.66 |
| Distilled Supply UKM | 0.2090 | 1.43 | 0.30 |
| Distilled Filter UKM | 0.1940 | 12.17 | 2.36 |
| RO Supply Hentian Kajang | 0.3646 | 12.00 | 4.38 |
| RO Filter Hentian Kajang | 0.2097 | 12.00 | 2.52 |
| Alkaline Supply Serdand | 0.3289 | 12.17 | 4.00 |
| Alkaline Filter Serdand | 0.3251 | 12.17 | 3.96 |
| UV Supply UKM | 0.1880 | 12.17 | 2.29 |
| UV Filter UKM | 0.3090 | 12.17 | 3.76 |
| Location | Water (L) | Recovery Po-209 (%) | Sampling Date | Test Date |
|---|---|---|---|---|
| Pangsoon River | 20 | 19.68 | 6/8/2015 | 22/12/2015 |
| Pangsoon WTP | 20 | 26.43 | 6/8/2015 | 22/12/2015 |
| Lolo River | 20 | 19.27 | 6/8/2015 | 22/12/2015 |
| Lolo WTP | 20 | 33.36 | 6/8/2015 | 22/12/2015 |
| Serai River | 20 | 15.92 | 20/8/2015 | 2/1/2016 |
| Serai WTP | 20 | 58.84 | 20/8/2015 | 28/12/2015 |
| Langat River | 20 | 25.96 | 11/8/2015 | 22/12/2015 |
| Langat WTP | 20 | 20.13 | 11/8/2015 | 22/12/2015 |
| Cheras River | 20 | 28.70 | 12/8/2015 | 26/12/2015 |
| Cheras WTP | 20 | 12.87 | 12/8/2015 | 24/12/2015 |
| Bukit River | 20 | 16.84 | 13/8/2015 | 26/12/2015 |
| Bukit WTP | 20 | 25.23 | 13/8/2015 | 22/12/2015 |
| Salak River | 20 | 14.38 | 14/8/2015 | 23/1/2016 |
| Salak WTP | 20 | 11.37 | 14/8/2015 | 22/12/2015 |
| Labu River | 20 | 19.70 | 20/8/2015 | 2/1/2016 |
| Labu WTP | 20 | 20.62 | 20/8/2015 | 2/1/2016 |
| Carbon Supply Hentian Kajang | 3 | 44.09 | 20/11/2015 | 28/12/2015 |
| Carbon Filter Hentian Kajang | 3 | 18.81 | 20/11/2015 | 28/12/2015 |
| Distilled Supply UKM | 3 | 30.22 | 20/11/2015 | 26/12/2015 |
| Distilled Filter UKM | 3 | 23.83 | 5/5/2016 | 22/6/2016 |
| RO Supply Hentian Kajang | 3 | 40.20 | 18/11/2015 | 24/12/2015 |
| RO Filter Hentian Kajang | 3 | 31.94 | 18/11/2015 | 24/12/2015 |
| Alkaline Supply Serdang | 3 | 23.43 | 15/11/2015 | 30/1/2016 |
| Alkaline Filter Serdang | 3 | 26.78 | 15/11/2015 | 30/1/2016 |
| UV Supply UKM | 3 | 13.38 | 15/11/2015 | 30/1/2016 |
| Carbon Supply Hentin Kajang | 3 | 44.09 | 20/11/2015 | 28/12/2015 |
| Carbon Filter Hentian Kajang | 3 | 18.81 | 20/11/2015 | 28/12/2015 |
| Location | River | WTP | Efficiency WTP (%) | Weighted 1 Efficiency |
|---|---|---|---|---|
| Pangsoon | 2.99 ± 0.33 | 1.22 ± 0.49 | 59 | 3.72 |
| Lolo | 2.54 ± 0.31 | 1.83 ± 0.20 | 28 | 1.49 |
| Serai | 5.02 ± 0.47 | 0.34 ± 0.10 | 93 | 9.83 |
| Langat | 14.98 ± 1.18 | 2.86 ± 0.31 | 81 | 25.49 |
| Cheras | 12.40 ± 0.84 | 6.80 ± 0.71 | 45 | 11.77 |
| Bukit | 7.14 ± 0.69 | 5.18 ± 0.42 | 27 | 4.12 |
| Salak | 1.86 ± 0.45 | 0.84 ± 0.20 | 55 | 2.14 |
| Labu | 0.63 ± 0.29 | 0.51 ± 0.11 | 20 | 0.26 |
| Mean | 5.95 ± 5.22 | 2.45 ± 2.37 | 59 | 58.83 (Total) |
| t value | 3.220 | 2.924 | ||
| p value | 0.015 * | 0.022 * | ||
| MOH (2010) | <0.1 × 10³ mBq/L | |||
| WOH (2017) | <0.1 × 10³ mBq/L | |||
| Parameters | Constant | River Point Coefficient | R-Square | F-Stat |
|---|---|---|---|---|
| Po-210 | 6.81 (1.56) | −0.09 (−0.22) | 0.01 | 0.05 (0.832) |
| DO | 10.66 (17.43) | −0.95 (−7.63) | 0.91 | 58.21 (0.0003) |
| Salinity | 0.001 (0.61) | 0.85 (4.01) | 0.73 | 16.09 (0.007) |
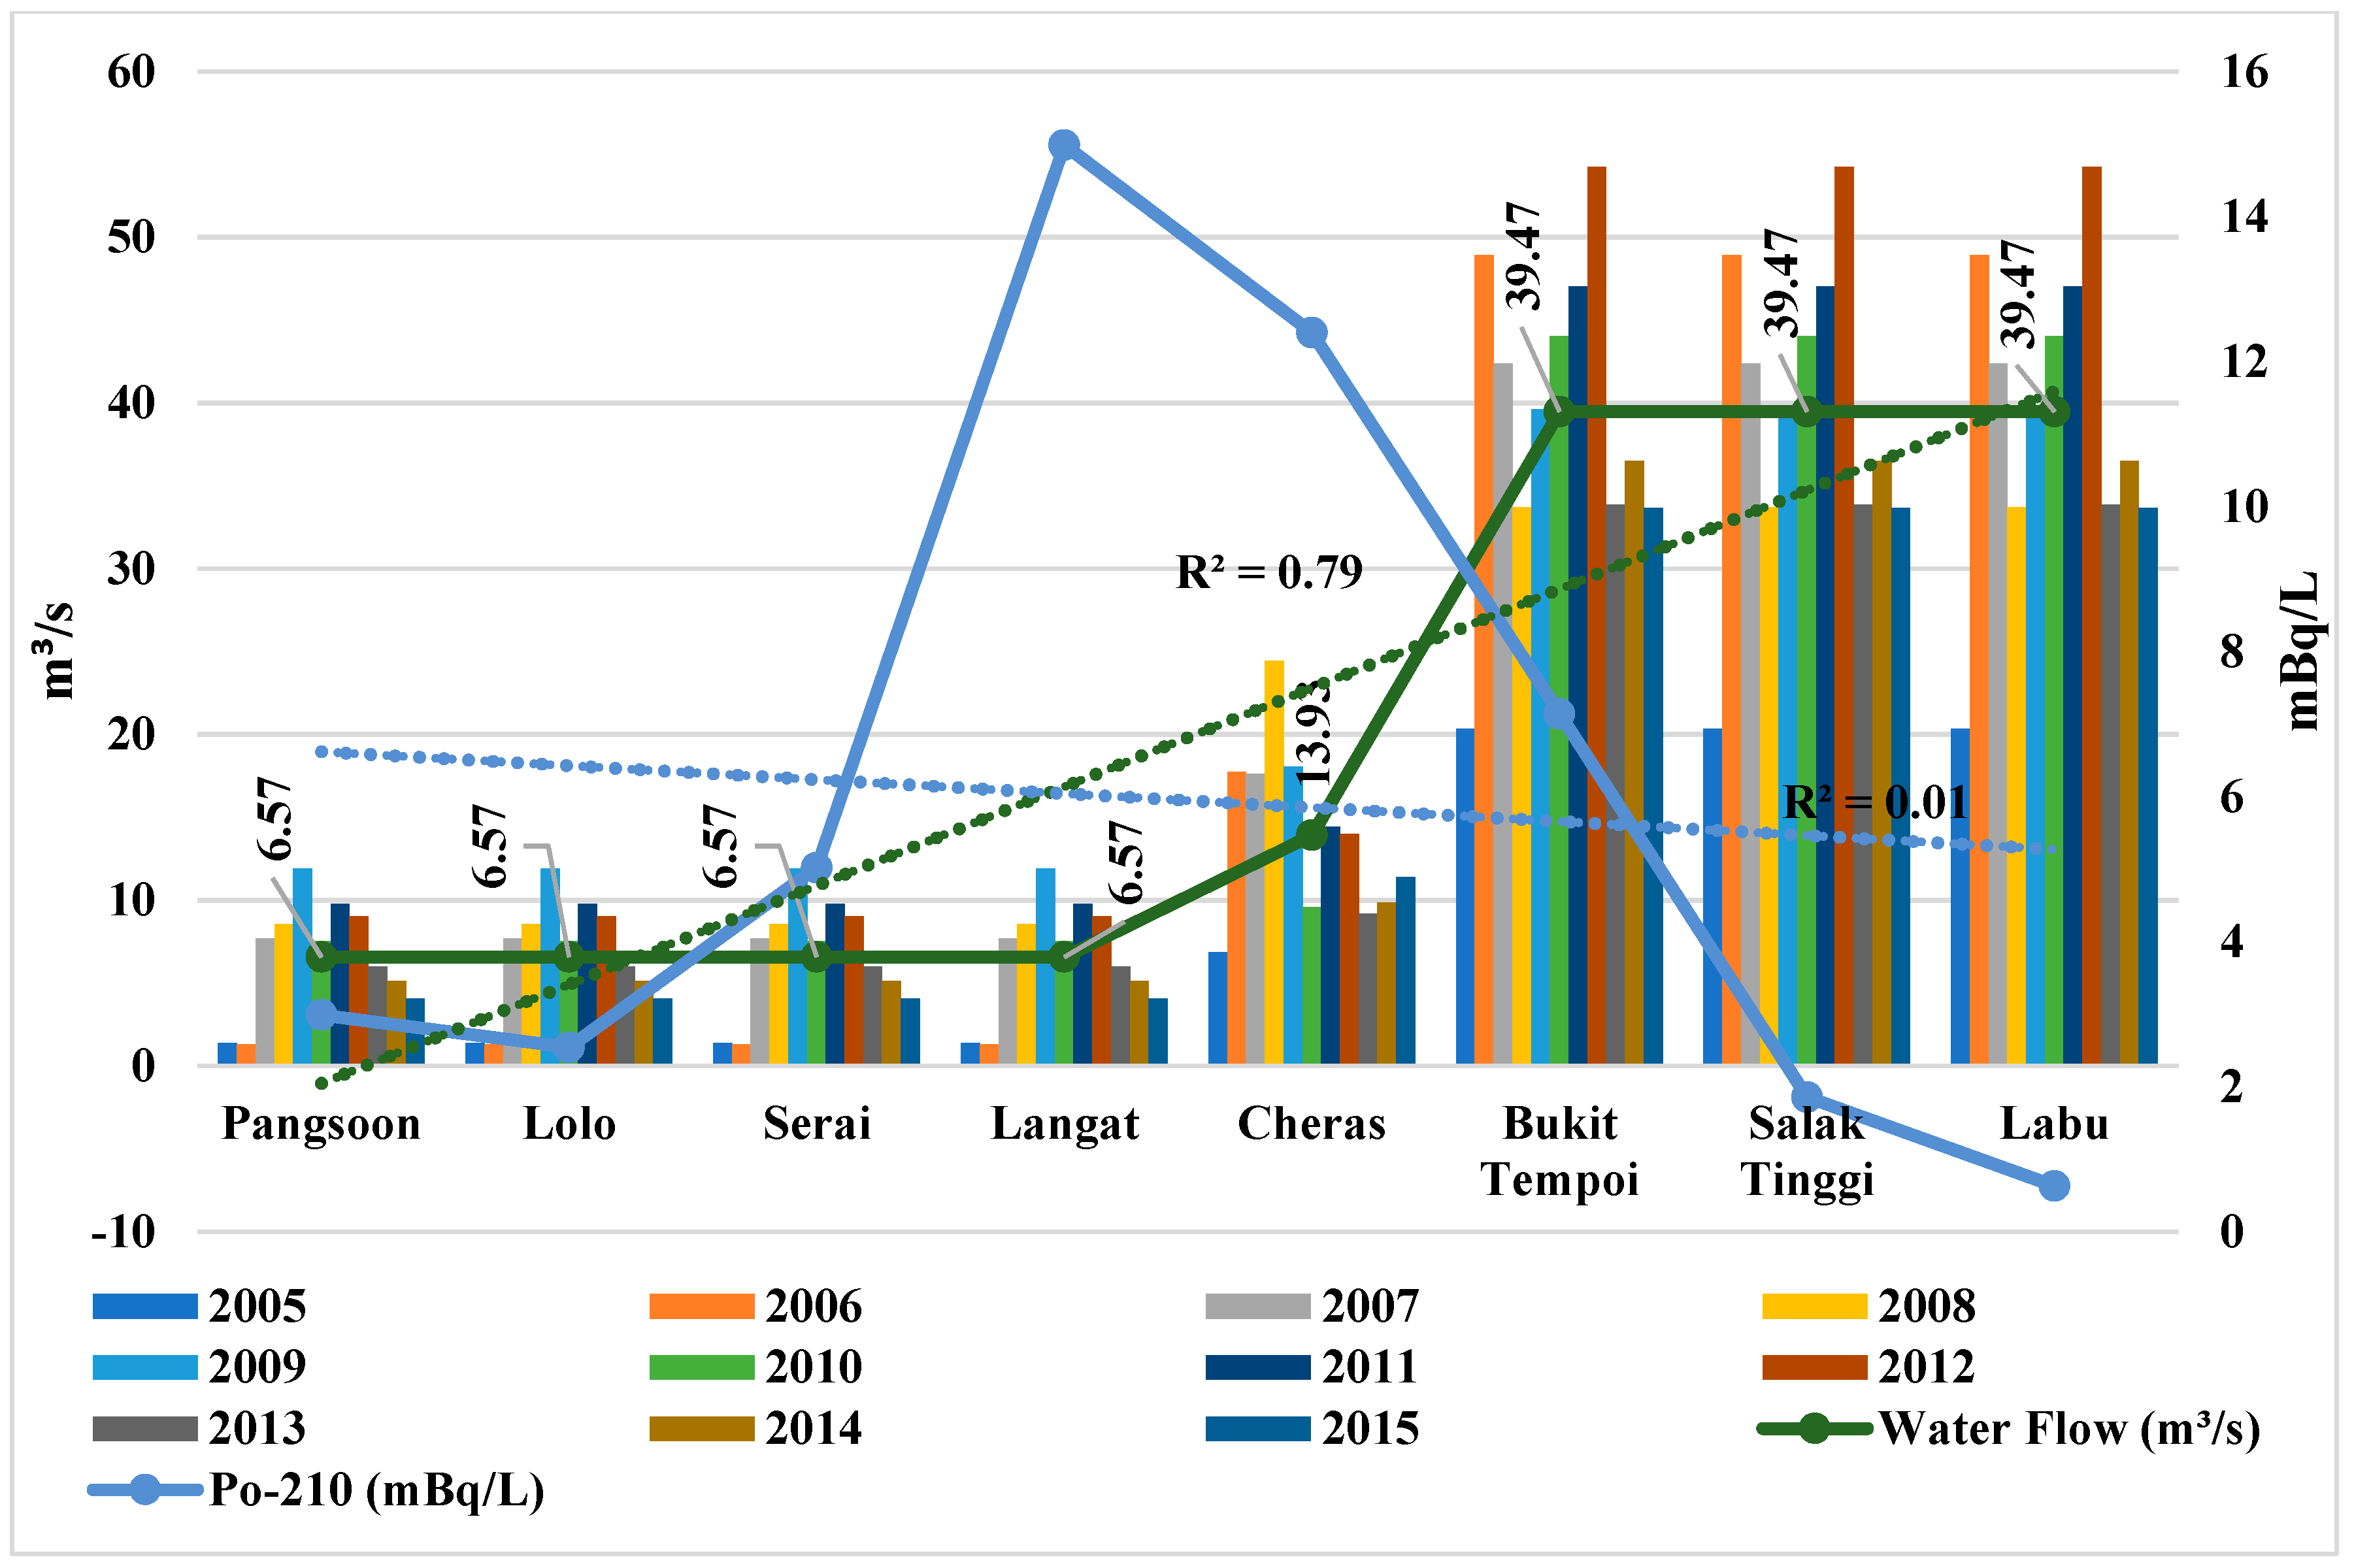
| Water Flow | −6.99 (−1.09) | 0.89 (4.72) | 0.79 | 22.28 (0.003) |
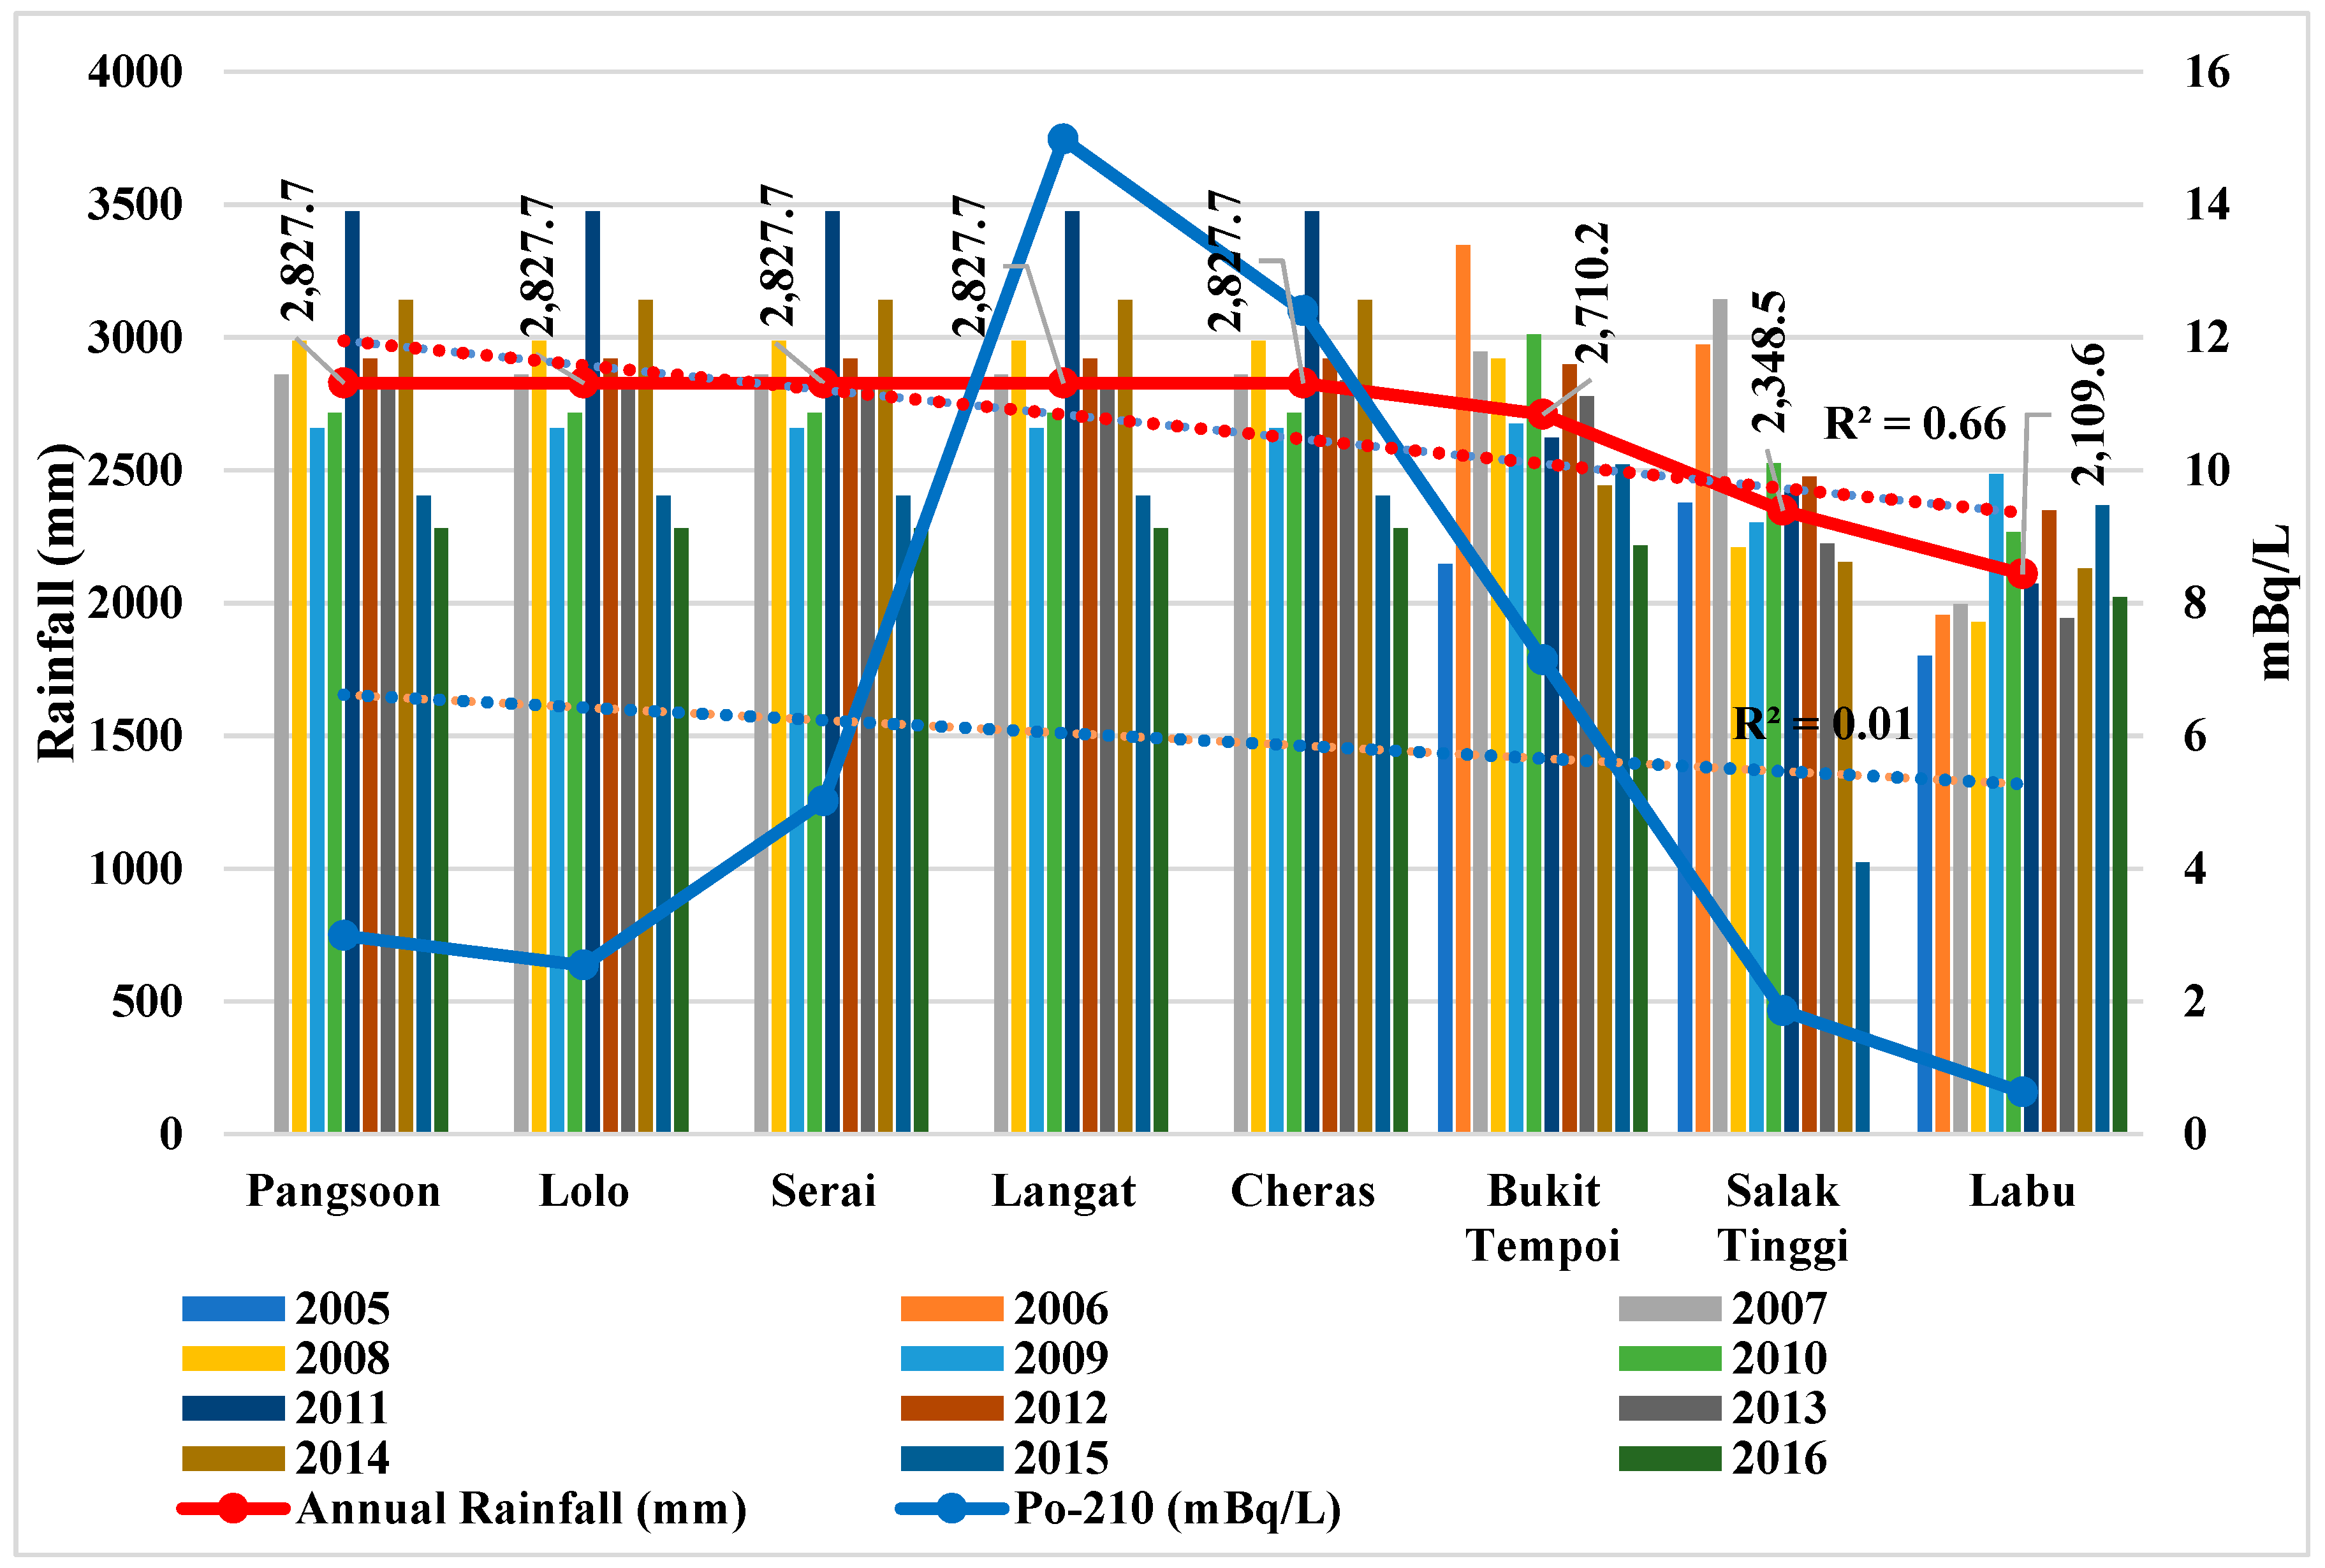
| Rainfall | 3079.94 (22.62) | −0.81 (−3.43) | 0.66 | 11.79 (0.014) |
| Flood Incidents | 13.24 (10.56) | −0.74 (−2.70) | 0.55 | 7.27 (0.036) |
| Parameters | Po-210 | Salinity | DO | Conductivity | Temperature | Flood | Rainfall | Water Flow | |
|---|---|---|---|---|---|---|---|---|---|
| Po-210 | Pearson Correlation | 1 | |||||||
| Sig. (1-tailed) | |||||||||
| Salinity | Pearson Correlation | 0.043 | 1 | ||||||
| Sig. (1-tailed) | 0.459 | ||||||||
| DO | Pearson Correlation | 0.244 | −0.800 *** | 1 | |||||
| Sig. (1-tailed) | 0.280 | 0.009 | |||||||
| Conductivity | Pearson Correlation | 0.016 | 0.995 *** | −0.811 *** | 1 | ||||
| Sig. (1-tailed) | 0.485 | 0.000 | 0.007 | ||||||
| Temperature | Pearson Correlation | 0.161 | 0.819 *** | −0.852 *** | 0.824 *** | 1 | |||
| Sig. (1-tailed) | 0.352 | 0.006 | 0.004 | 0.006 | |||||
| Flood | Pearson Correlation | 0.542 * | −0.287 | 0.743 * | −0.318 | −0.533 | 1 | ||
| Sig. (1-tailed) | 0.083 | 0.245 | 0.017 | 0.222 | 0.087 | ||||
| Rainfall | Pearson Correlation | 0.553 * | −0.546 | 0.900 *** | −0.556 | −0.657 ** | 0.922 ** | 1 | |
| Sig. (1-tailed) | 0.077 | 0.081 | 0.001 | 0.076 | 0.038 | 0.001 | |||
| Water Flow | Pearson Correlation | −0.370 | 0.838 *** | −0.867 *** | 0.850 *** | 0.815 *** | −0.609 | −0.805 *** | 1 |
| Sig. (1-tailed) | 0.184 | 0.005 | 0.003 | 0.004 | 0.007 | 0.054 | 0.008 | ||
| River (Year) | Minimum | Maximum | References |
|---|---|---|---|
| Langat, Malaysia | 0.63 ± 0.29 | 14.98 ± 1.18 | Present Study |
| Langat, Malaysia (2015) | - | 7.70 ± 0.60 | [67] |
| Kuala Selangor, Malaysia (2010) | 0.0002 ± 0.0001 | 0.014 ± 0.003 | [38] |
| Kuala Selangor, Malaysia (2005) | 0.22 ± 0.06 | 0.75 ± 0.28 | [68] |
| Vistula, Poland (2004) | 0.49 ± 0.09 | 9.80 ± 0.02 | [62] |
| Oder, Poland (2004) | 0.60 ± 0.09 | 5.21 ± 0.19 | |
| Pomeranian, Poland (2004) | 3.82 ± 0.24 | 5.50 ± 0.33 | |
| Yellow, China (1999) | 0.25 ± 0.08 | 1.55 ± 0.50 | [69] |
| Tagus, Portugal (1997) | 0.50 ± 0.36 | 0.67 ± 0.03 | [70] |
| Location (Year) | Minimum | Maximum | References |
|---|---|---|---|
| Langat, Malaysia | 5.51 × 10⁻⁴ | 1.31 × 10⁻² | Present Study |
| Langat, Malaysia (2015) | - | 6.8 × 10⁻³ | [67] |
| Kuala Selangor, Malaysia (2010) | 0.0002 × 10⁻³ | 0.01 × 10⁻³ | [38] |
| Kuala Selangor, Malaysia (2005) | 0.2 × 10⁻³ | 0.7 × 10⁻³ | [68] |
| Vistula, Poland (2004) | 0.4 × 10⁻³ | 8.6 × 10⁻³ | [62] |
| Oder, Poland (2004) | 0.5 × 10⁻³ | 4.6 × 10⁻³ | |
| Pomeranian, Poland (2004) | 3.4 × 10⁻³ | 4.8 × 10⁻³ | |
| Yellow, China (1999) | 0.2 × 10⁻³ | 1.4 × 10⁻³ | [69] |
| Tagus, Portugal (1997) | 0.4 × 10⁻³ | 0.6 × 10⁻³ | [70] |
| Location | Tap Water | Filter Type | Filtration Water | Efficiency Filter (%) | Weighted 1 Efficiency |
|---|---|---|---|---|---|
| Hentian Kajang | 1.33 ± 0.25 | Carbon | 1.05 ± 0.33 | 21 | 0.66 |
| UKM | 1.57 ± 0.70 | Distilled | 0.49 ± 0.19 | 69 | 2.55 |
| Hentian Kajang | 22.35 ± 1.67 | RO | 7.30 ± 0.84 | 67 | 35.51 |
| Serdang | 1.05 ± 0.33 | Alkaline | 0.87 ± 0.28 | 17 | 0.42 |
| UKM | 16.08 ± 2.27 | UV | 1.13 ± 0.37 | 93 | 35.28 |
| Mean | 8.48 ± 10.10 | Mean | 2.17 ± 2.88 | 74 | 74.42 (Total) |
| t value | 1.885 | t value | 1.684 | ||
| p value | 1.32 | p value | 1.68 | ||
| MOH (2010) | <0.1 × 10³ mBq/L | ||||
| WOH (2017) | <0.1 × 10³ mBq/L | ||||
| Location (Year) | Activity (mBq/L) | Dose (mSv/Year) | References |
|---|---|---|---|
| Langat Basin | 8.48 | 7.41 × 10⁻³ | Present Study |
| Bangi, Malaysia (2015) | 1.7 | 1.5 × 10⁻³ | [67] |
| Italy (2009) | 3.25 | 2.84 × 10⁻³ | [9] |
| Italy (2007) | 1 | 0.9 × 10⁻³ | [70] |
| Hungary (2010) | 2 | 1.75 × 10⁻³ | [6] |
| Poland (2001) | 0.48 | 0.42 × 10⁻³ | [71] |
| India (2001) | 1.4 | 1.2 × 10⁻³ | [72] |
| Bombay, India (1977) | 1.9 | 1.7 × 10⁻³ | |
| Brazil (1992) | 1 | 0.9 × 10⁻³ | |
| Portugal (1995) | 0.21 | 0.2 × 10⁻³ | |
| Syria (1995) | 1 | 0.9 × 10⁻³ | |
| Austria (2001) | 0.4 | 0.35 × 10⁻³ | [74] |
| USA (2008) | 5 | 4.4 × 10⁻³ | [73] |
| Location | River (mSv/Year) | WTP (mSv/Year) | Location | Tap (mSv/Year) | Filter Type | Filtered (mSv/Year) |
|---|---|---|---|---|---|---|
| Pangsoon | 2.62 × 10⁻³ | 1.07 × 10⁻³ | Hentian Kajang | 1.16 × 10⁻³ | Carbon Filter | 9.18 × 10⁻⁴ |
| Lolo | 2.22 × 10⁻³ | 1.6 × 10⁻³ | UKM | 1.37 × 10⁻³ | Distilled Filter | 4.28 × 10⁻⁴ |
| Serai | 4.39 × 10⁻³ | 3.01 × 10⁻⁴ | Hentian Kajang | 1.95 × 10⁻² | RO Filter | 6.38 × 10⁻³ |
| Langat | 1.31 × 10⁻² | 2.50 × 10⁻³ | Serdang | 9.18 × 10⁻⁴ | Alkaline Filter | 7.61 × 10⁻⁴ |
| Cheras | 1.08 × 10⁻² | 5.94 × 10⁻³ | UKM | 1.41 × 10⁻² | UV Filter | 9.88 × 10⁻⁴ |
| Bukit | 6.24 × 10⁻³ | 4.53 × 10⁻³ | Average | 7.41 × 10⁻³ | Average | 1.90 × 10⁻³ |
| Salak | 1.63 × 10⁻³ | 7.35 × 10⁻⁴ | Std. | 8.78 × 10⁻³ | Std. | 2.52 × 10⁻³ |
| Labu | 5.52 × 10⁻⁴ | 4.43 × 10⁻⁴ | t value | 1.886 | t value | 1.684 |
| Average | 5.20 × 10⁻³ | 2.14 × 10⁻³ | p value | 0.132 | p value | 0.167 |
| Std. | 4.56 × 10⁻³ | 2.07 × 10⁻³ | ||||
| t value | 3.223 | 2.926 | ||||
| p value | 0.015 * | 0.022 * | ||||
© 2018 by the authors. Licensee MDPI, Basel, Switzerland. This article is an open access article distributed under the terms and conditions of the Creative Commons Attribution (CC BY) license (http://creativecommons.org/licenses/by/4.0/).
Share and Cite
Ahmed, M.F.; Alam, L.; Mohamed, C.A.R.; Mokhtar, M.B.; Ta, G.C. Health Risk of Polonium 210 Ingestion via Drinking Water: An Experience of Malaysia. Int. J. Environ. Res. Public Health 2018, 15, 2056. https://0-doi-org.brum.beds.ac.uk/10.3390/ijerph15102056
Ahmed MF, Alam L, Mohamed CAR, Mokhtar MB, Ta GC. Health Risk of Polonium 210 Ingestion via Drinking Water: An Experience of Malaysia. International Journal of Environmental Research and Public Health. 2018; 15(10):2056. https://0-doi-org.brum.beds.ac.uk/10.3390/ijerph15102056
Chicago/Turabian StyleAhmed, Minhaz Farid, Lubna Alam, Che Abd Rahim Mohamed, Mazlin Bin Mokhtar, and Goh Choo Ta. 2018. "Health Risk of Polonium 210 Ingestion via Drinking Water: An Experience of Malaysia" International Journal of Environmental Research and Public Health 15, no. 10: 2056. https://0-doi-org.brum.beds.ac.uk/10.3390/ijerph15102056