The Pertinence of Microwave Irradiated Coconut Shell Bio-Sorbent for Wastewater Decolourization: Structural Morphology and Adsorption Optimization Using the Response Surface Method (RSM)

 ,
, 
 and
and
Abstract
:1. Introduction
2. Materials and Methods
2.1. POME Samples Preparation
2.2. Microwave Irradiation Pre-Treatment
2.3. Characterization of the Pretreated and Non-Pretreated AC
2.4. Analytical Procedure
2.4.1. Initial Concentration Analysis
2.4.2. Adsorption Optimization Experiment
2.4.3. Adsorption Capacity Test
2.4.4. Adsorption Isotherms Test
The Freundlich Isotherm Model
The Langmuir Isotherm Model
3. Results and Discussion
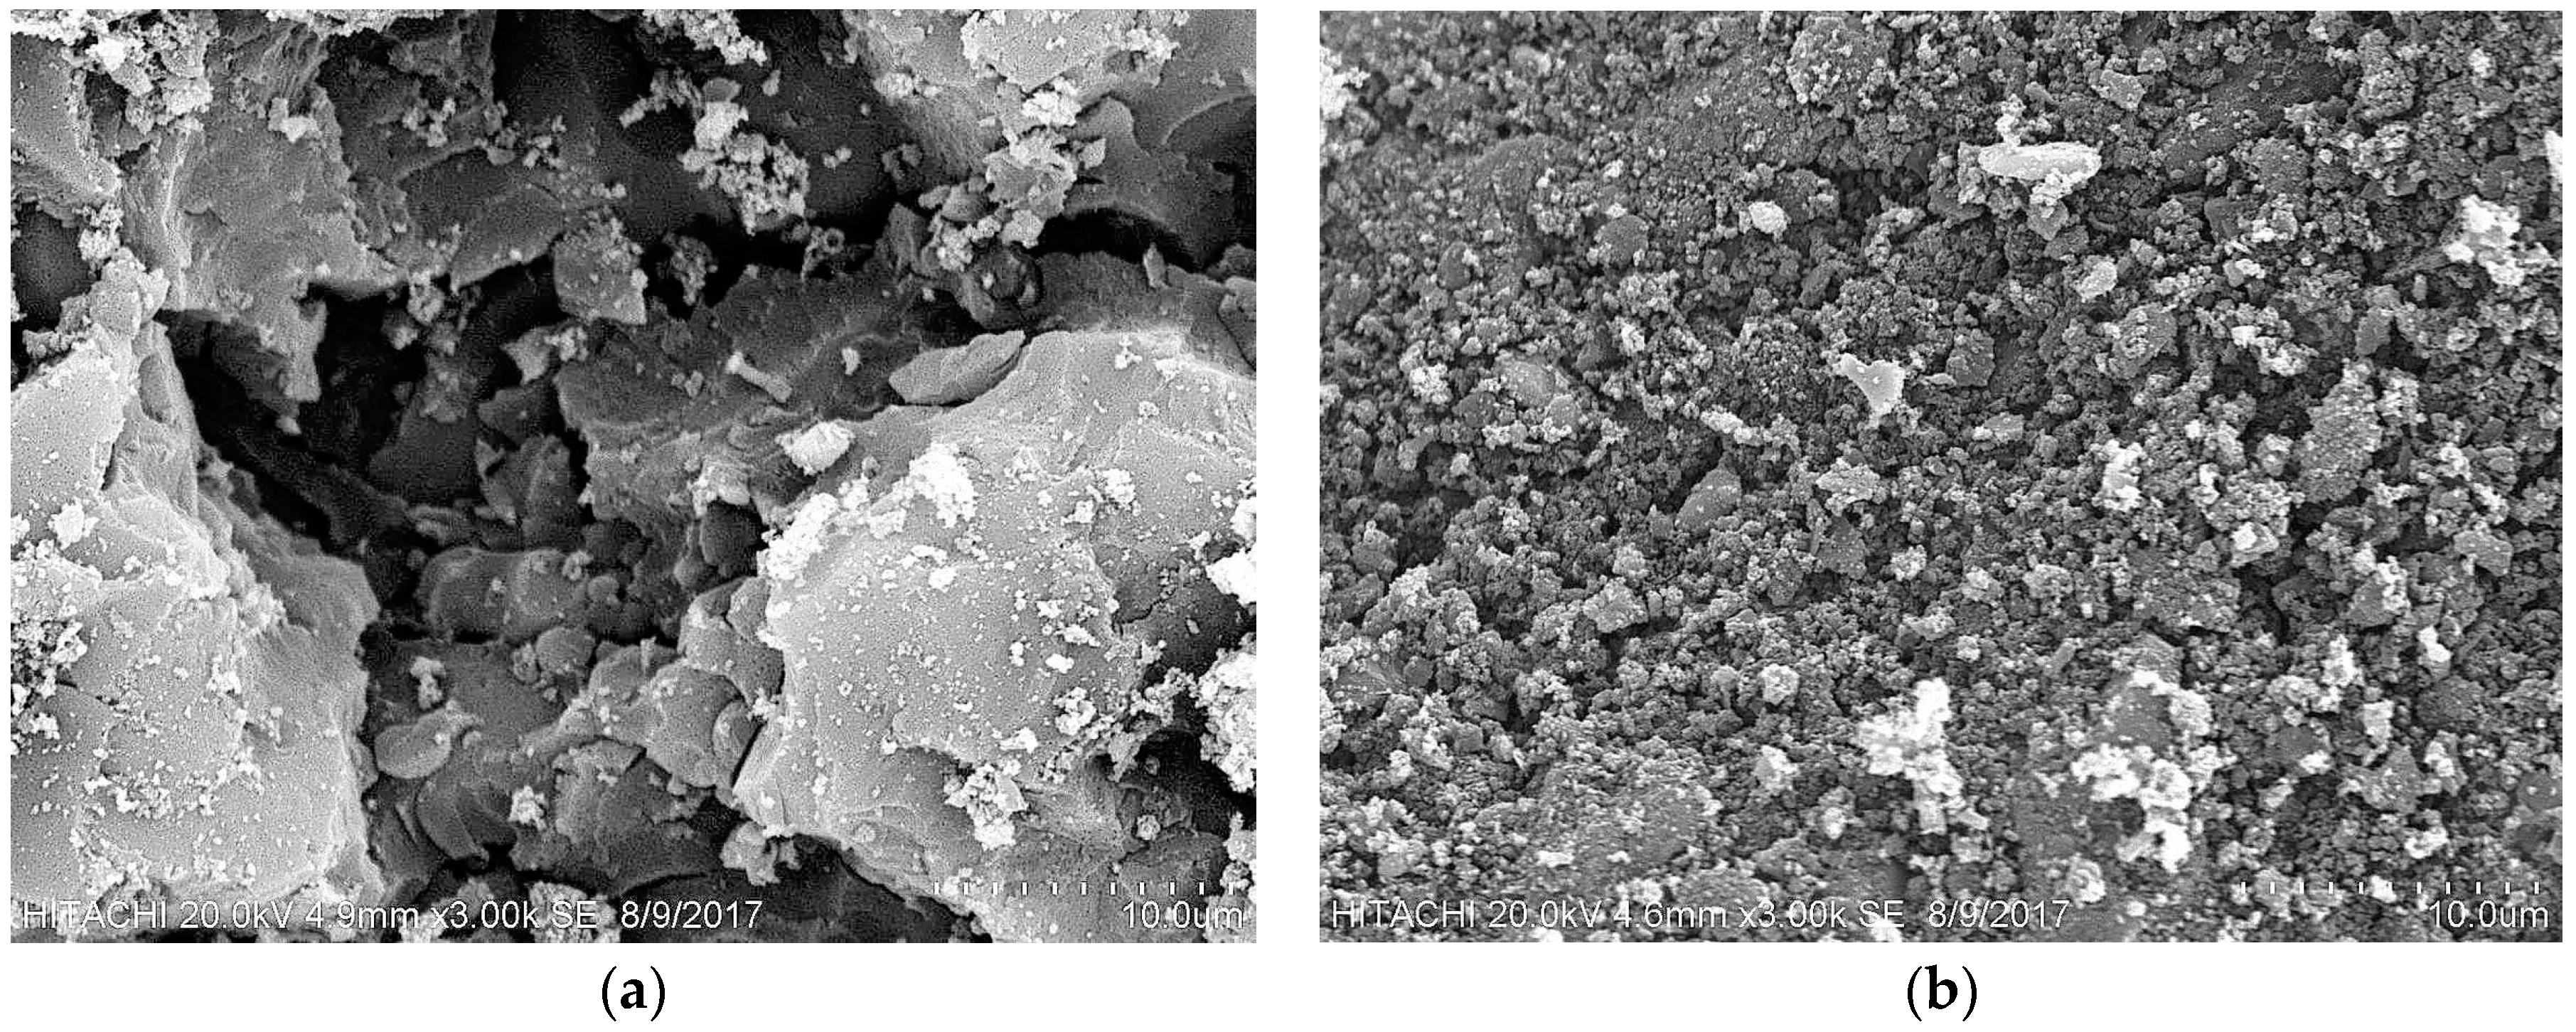
3.1. Effect of Microwave Pre-Treatment on CSAC Morphology
3.1.1. SEM Analysis
3.1.2. EDX Analysis
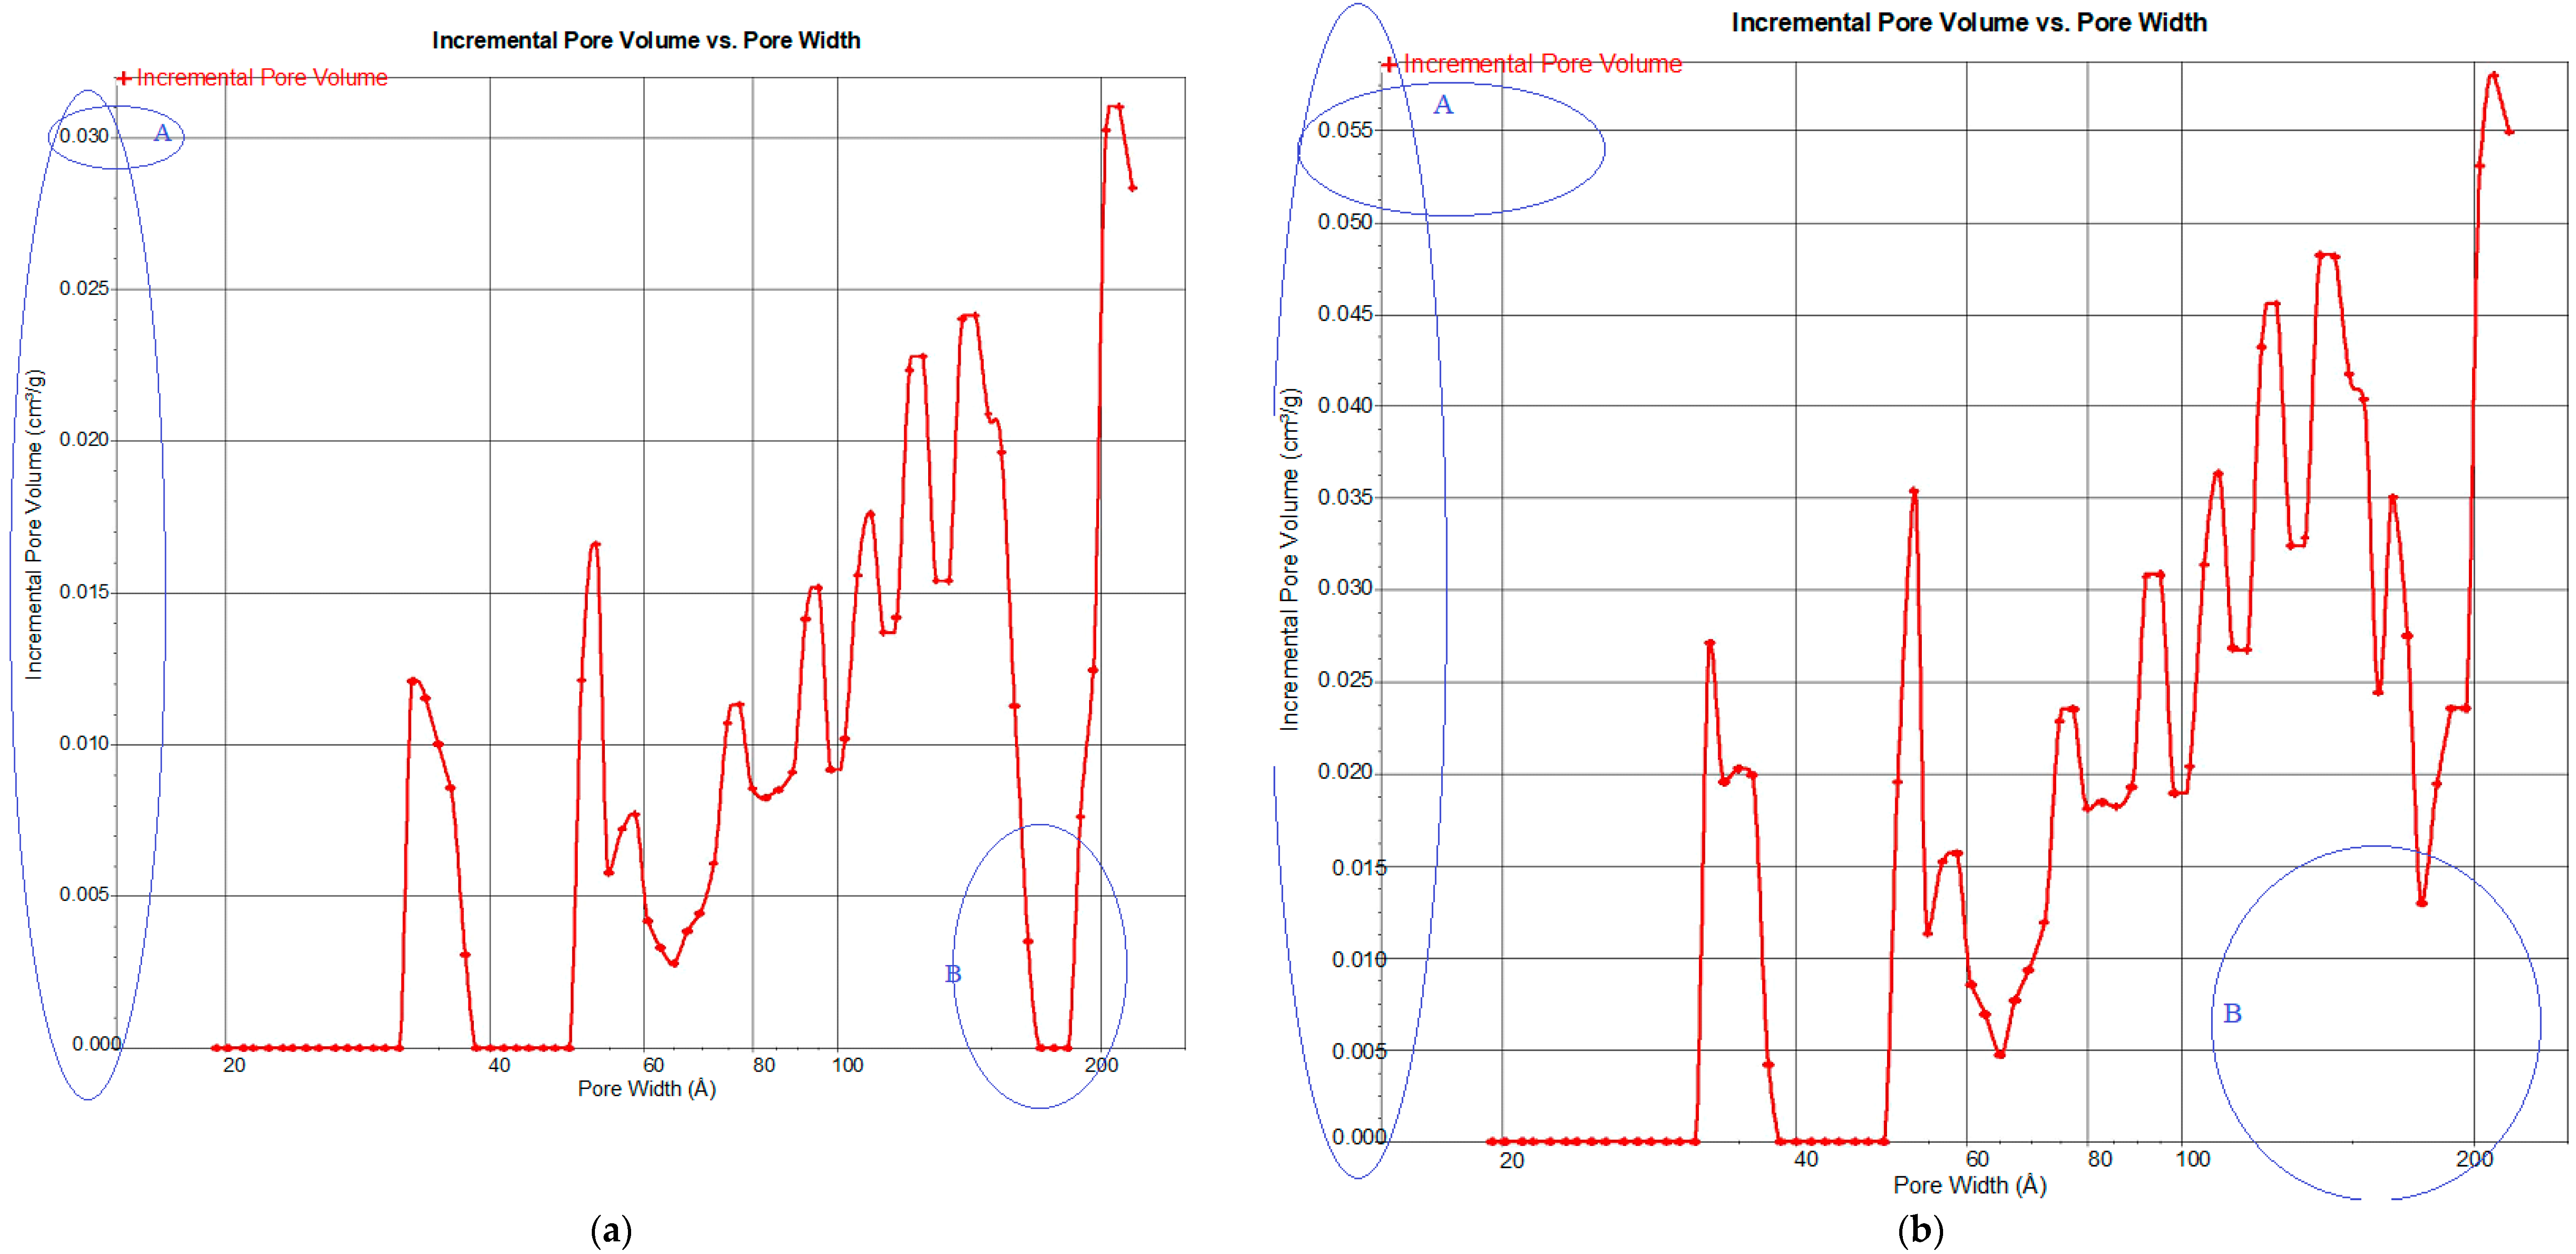
3.1.3. BET Analysis
3.2. Adsorption Experiments using Microwave-Pretreated CSAC
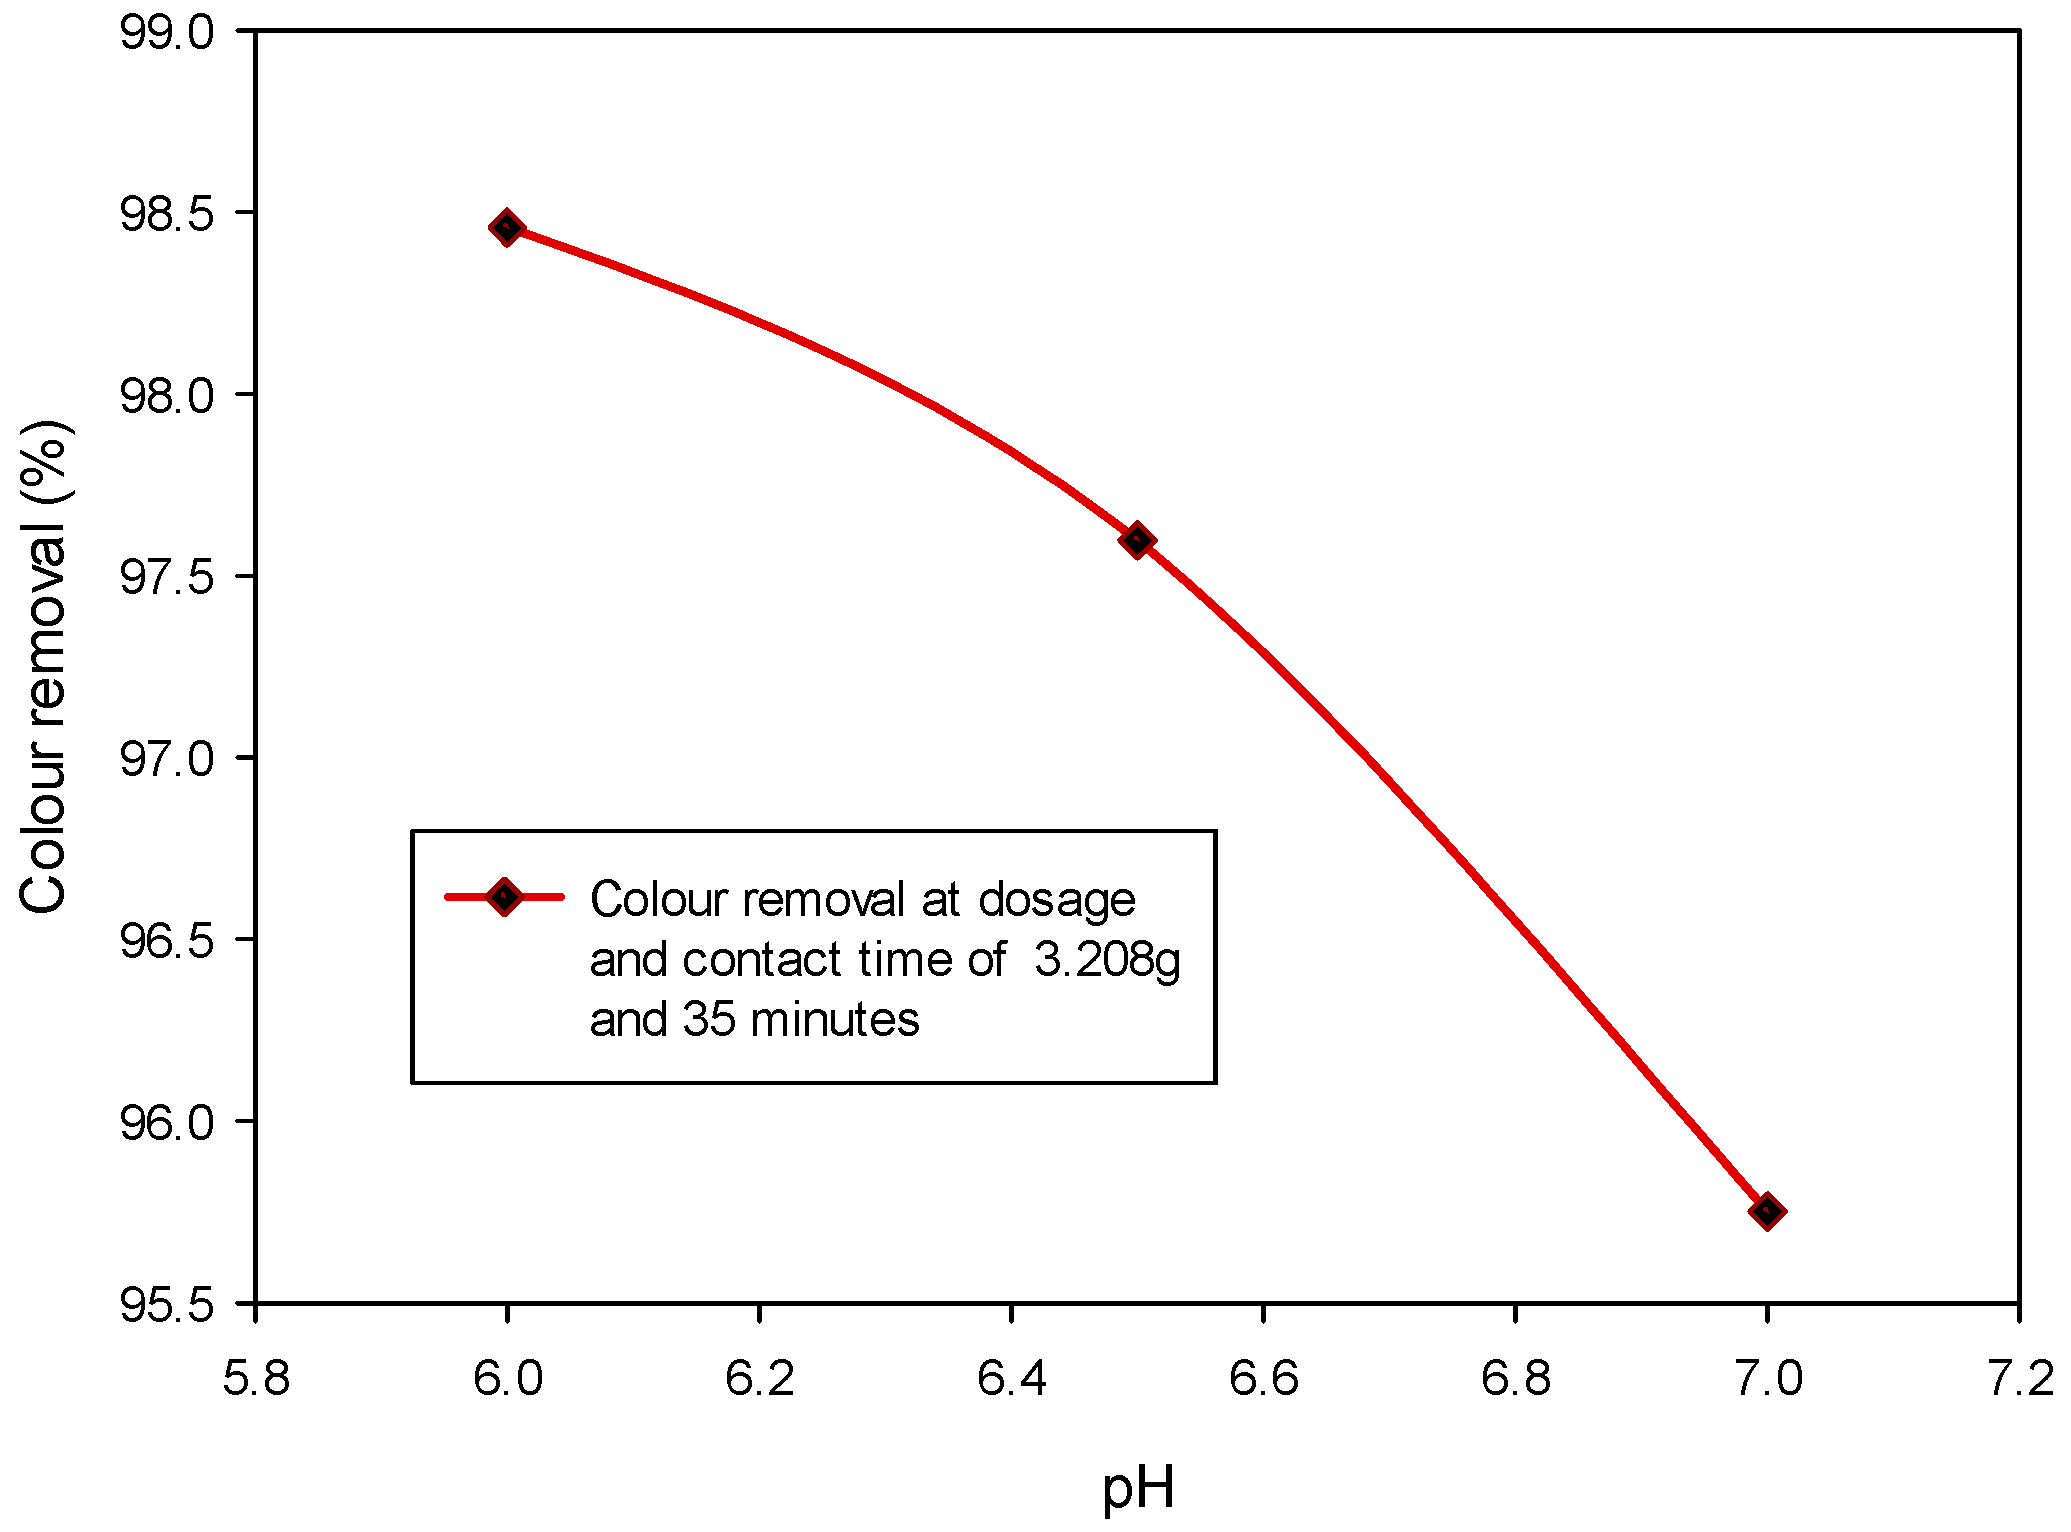
3.2.1. Effect of pH
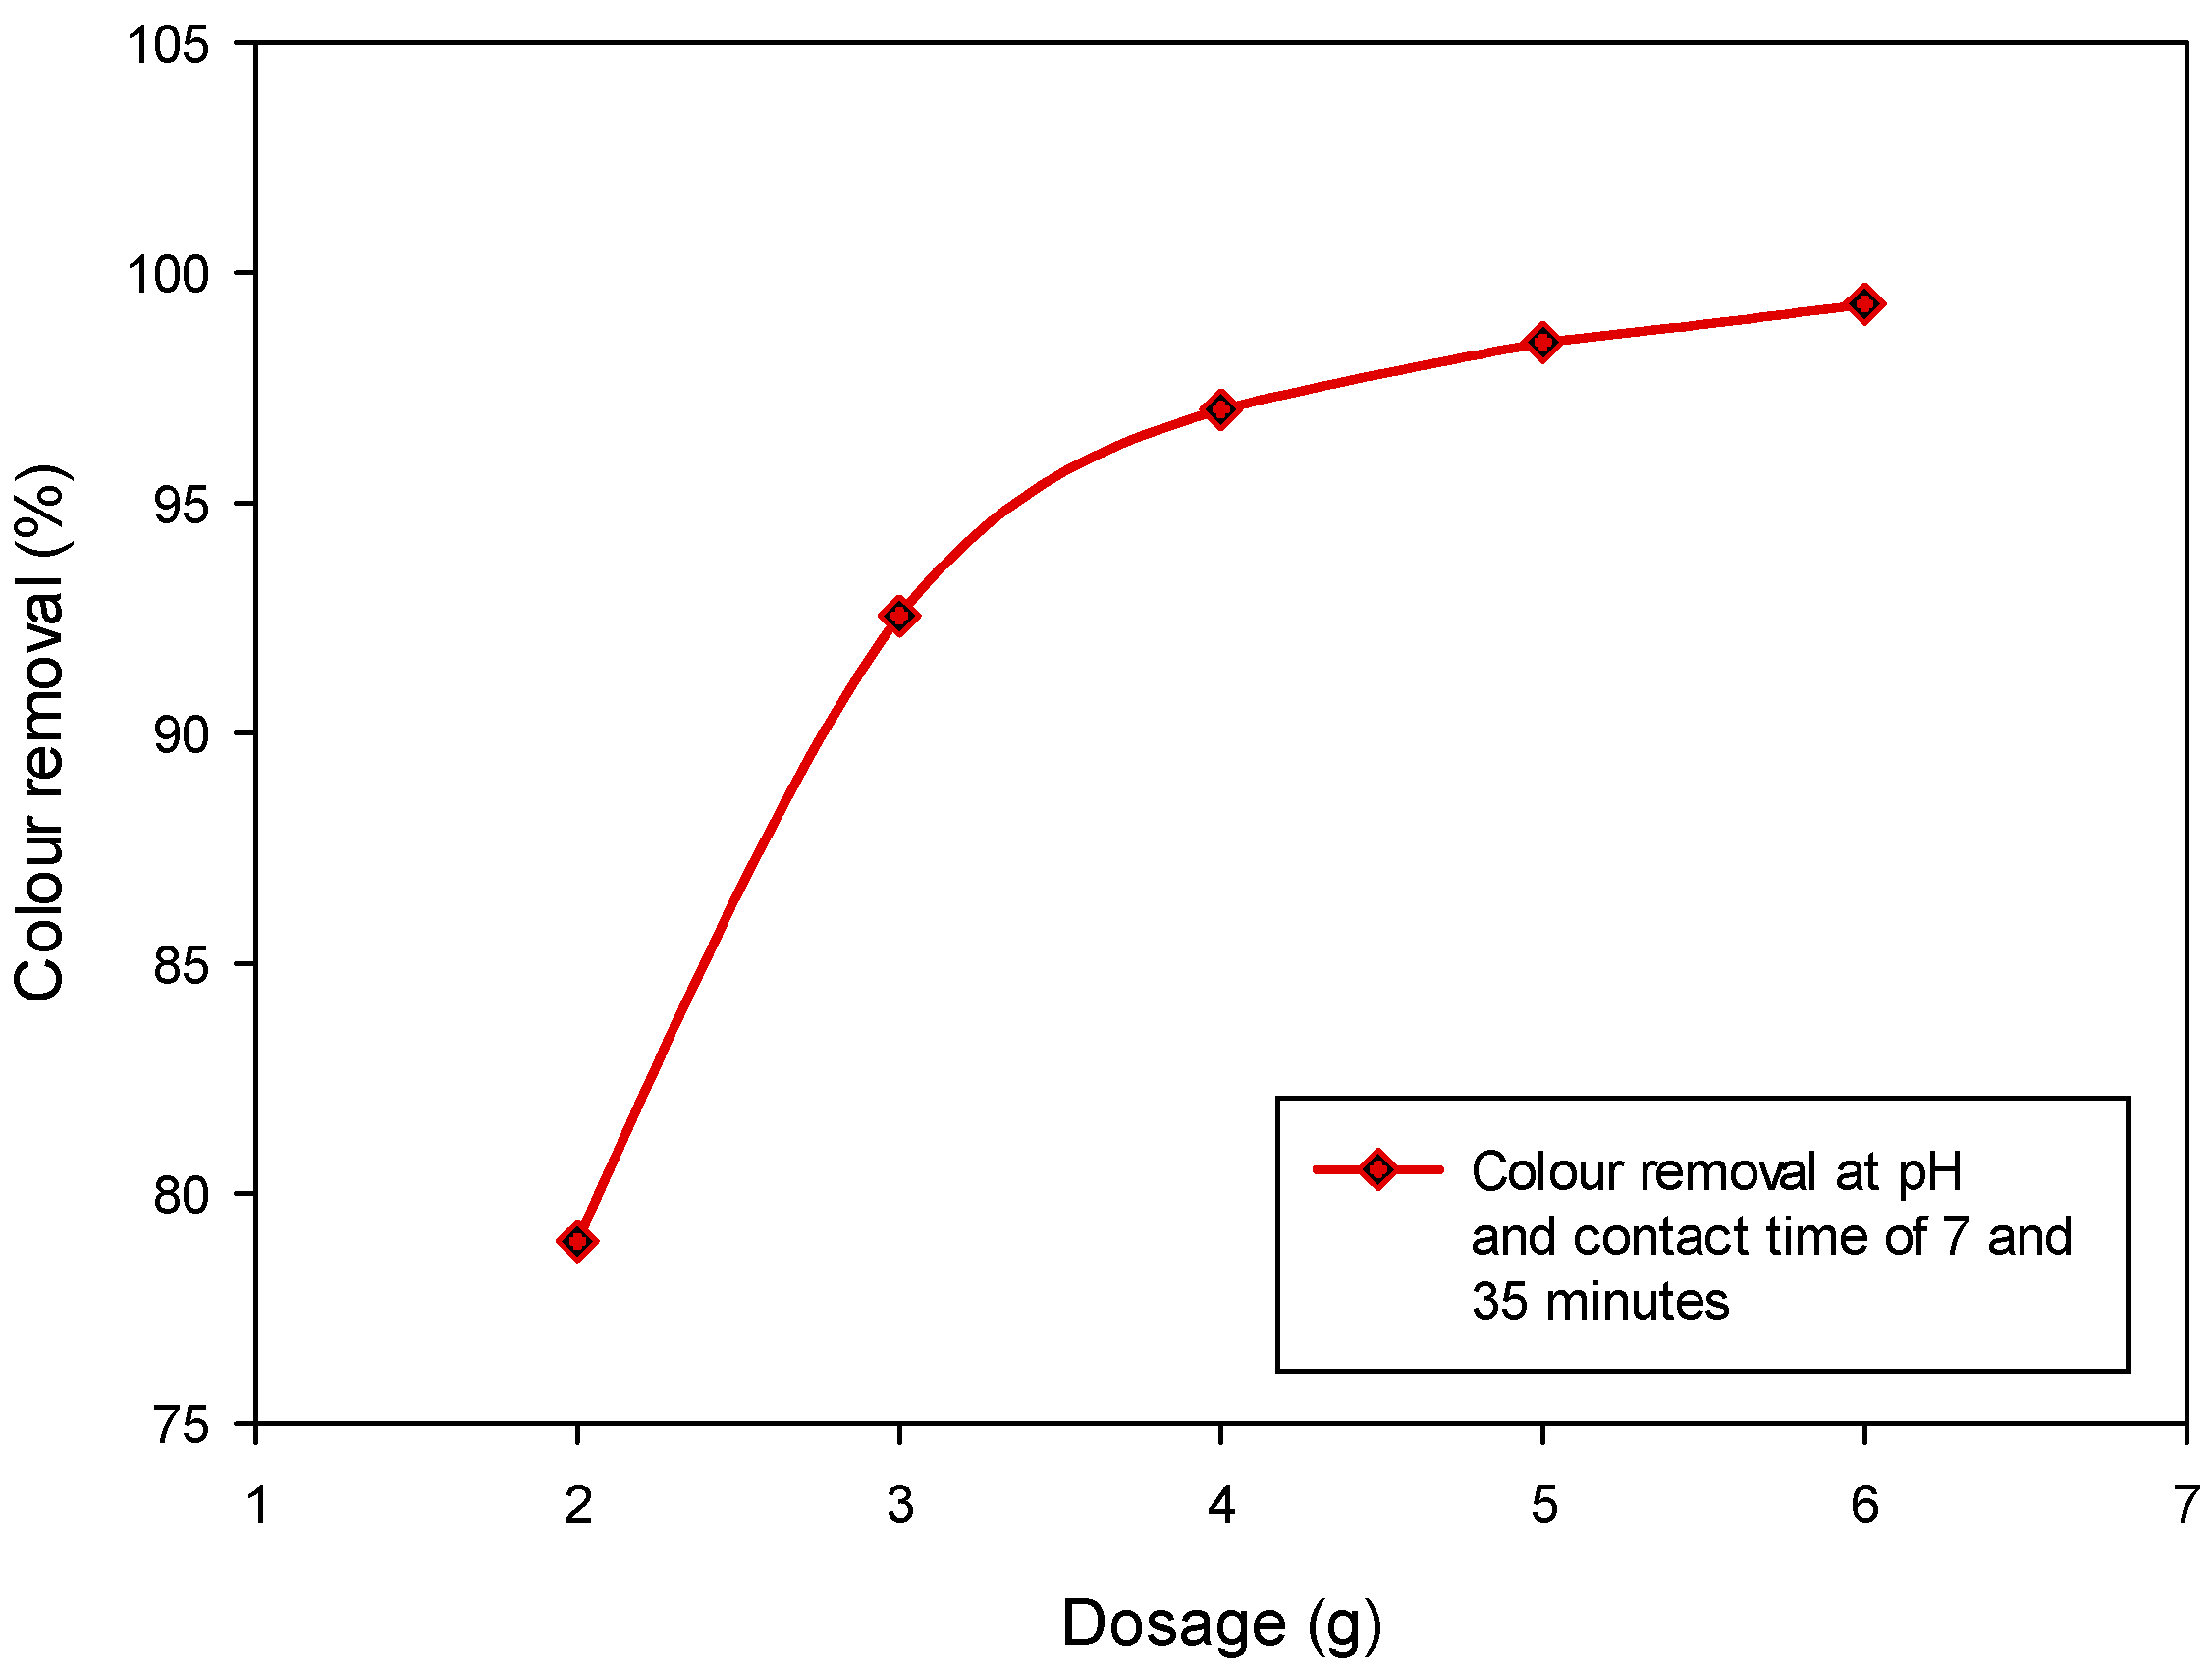
3.2.2. Effect of Adsorbent Dosage
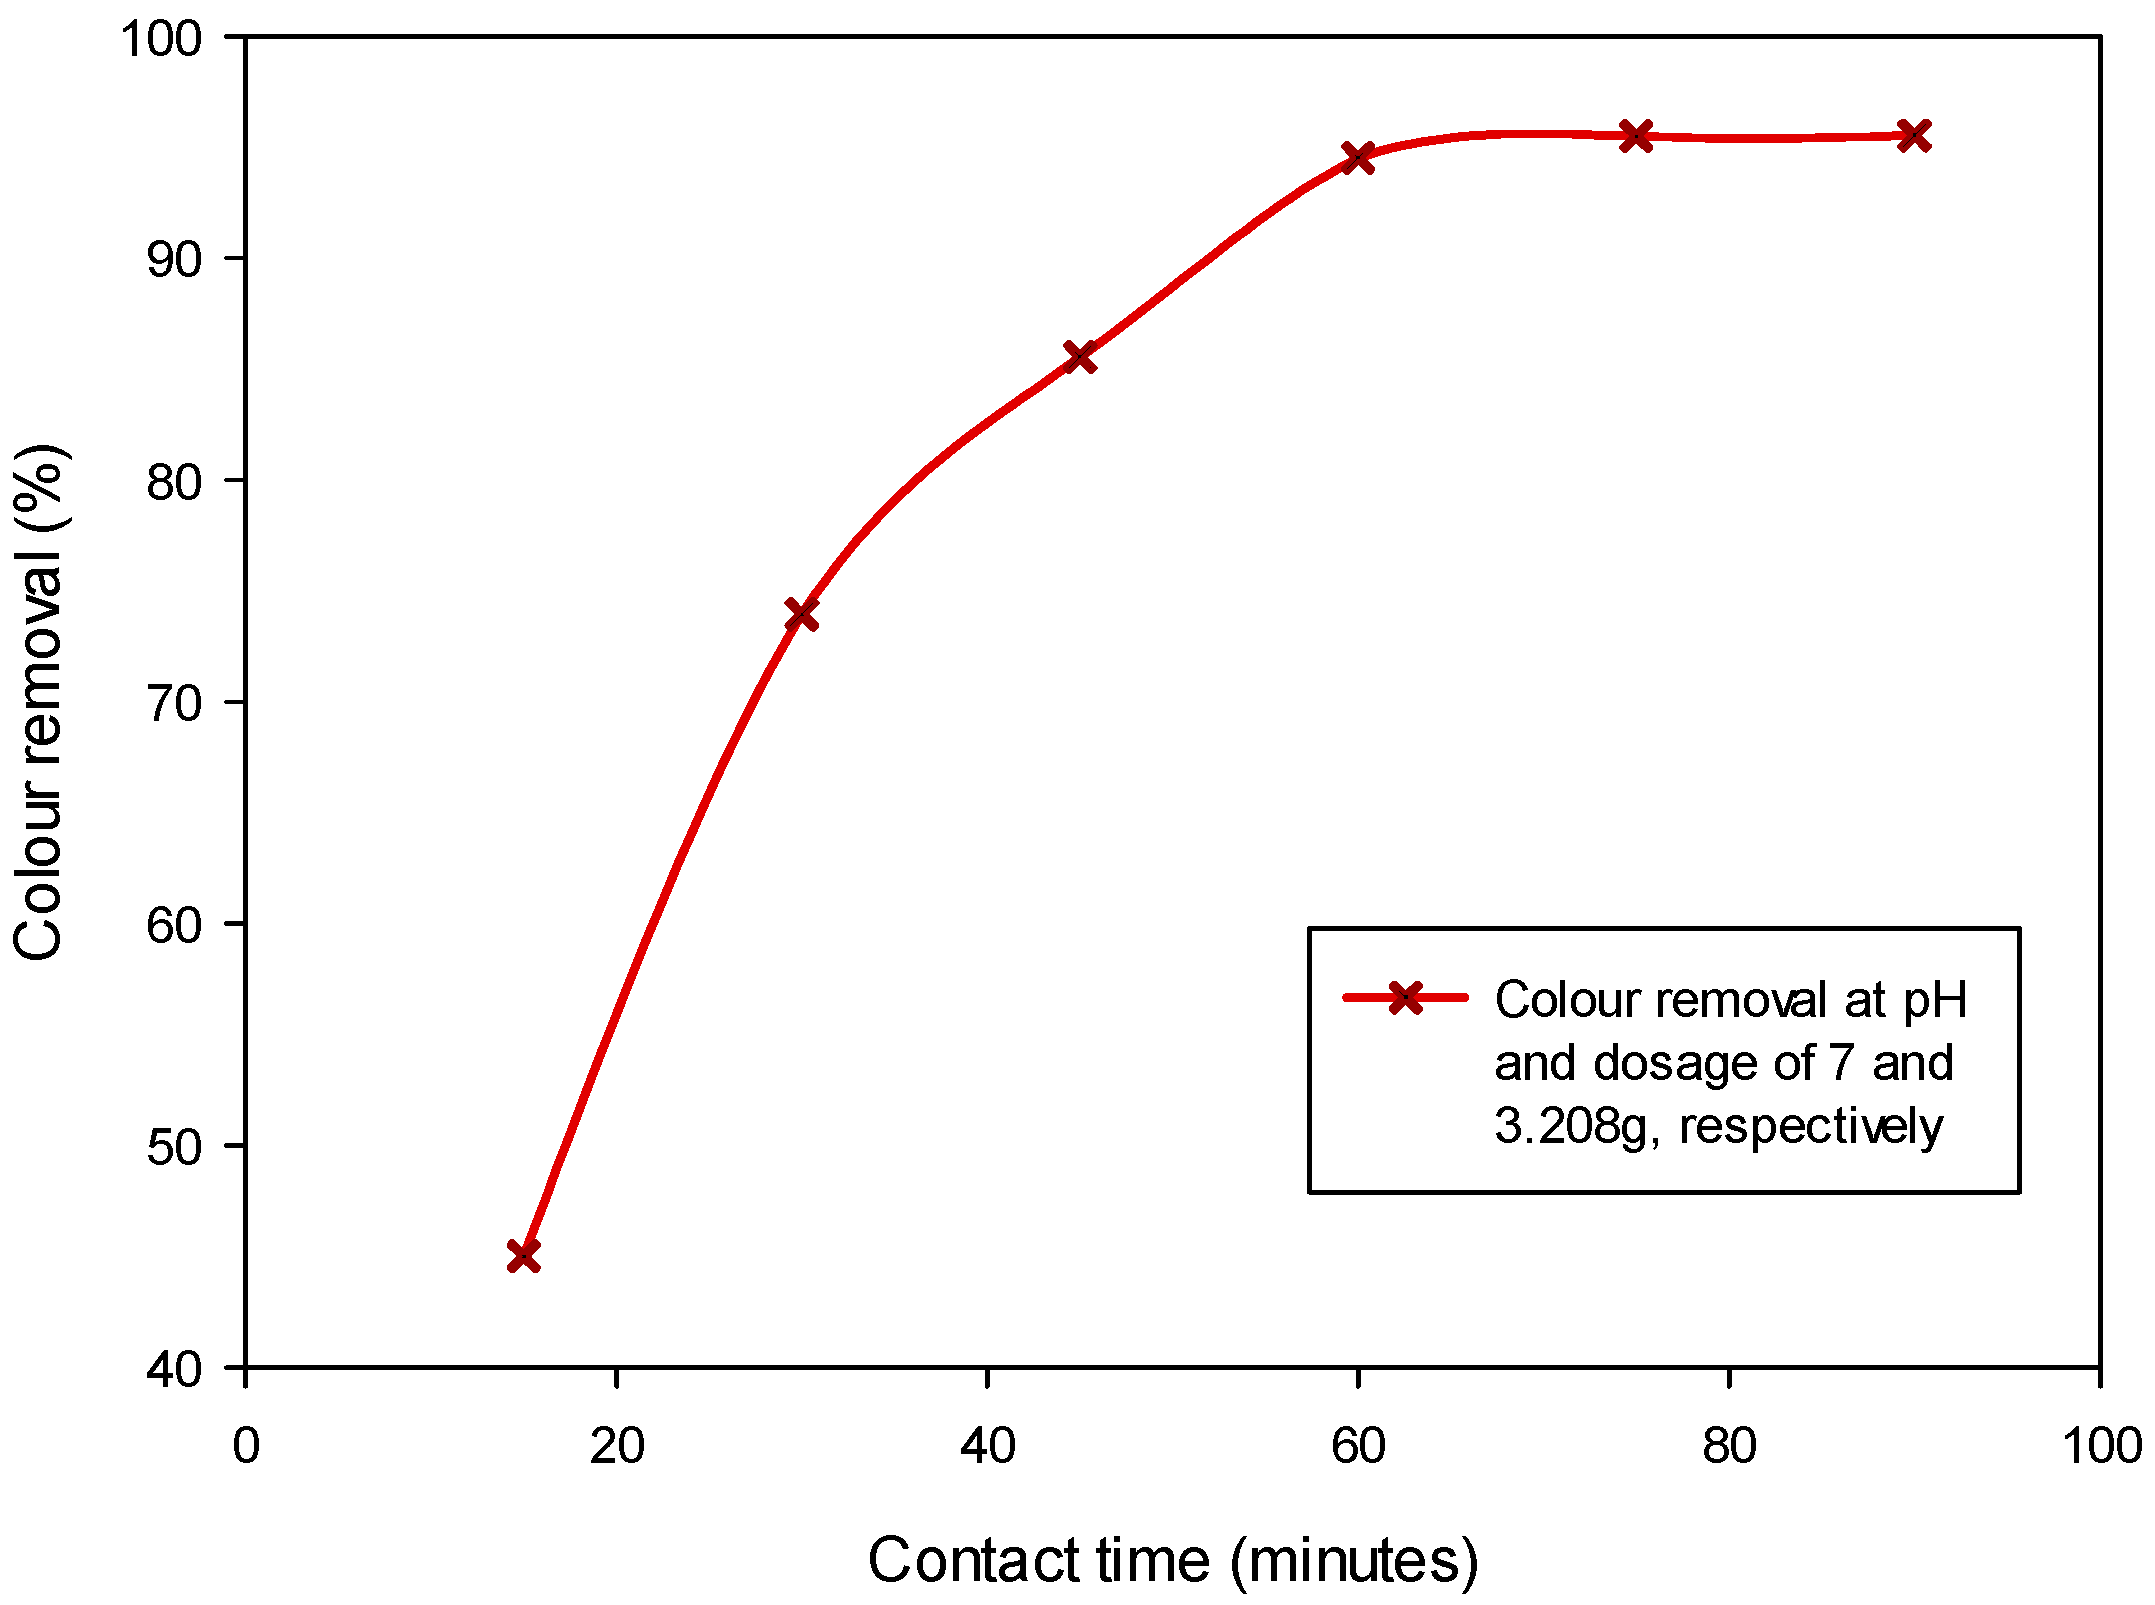
3.2.3. Effect of Contact Time
3.3. Adsorption Optimization and Validation Result
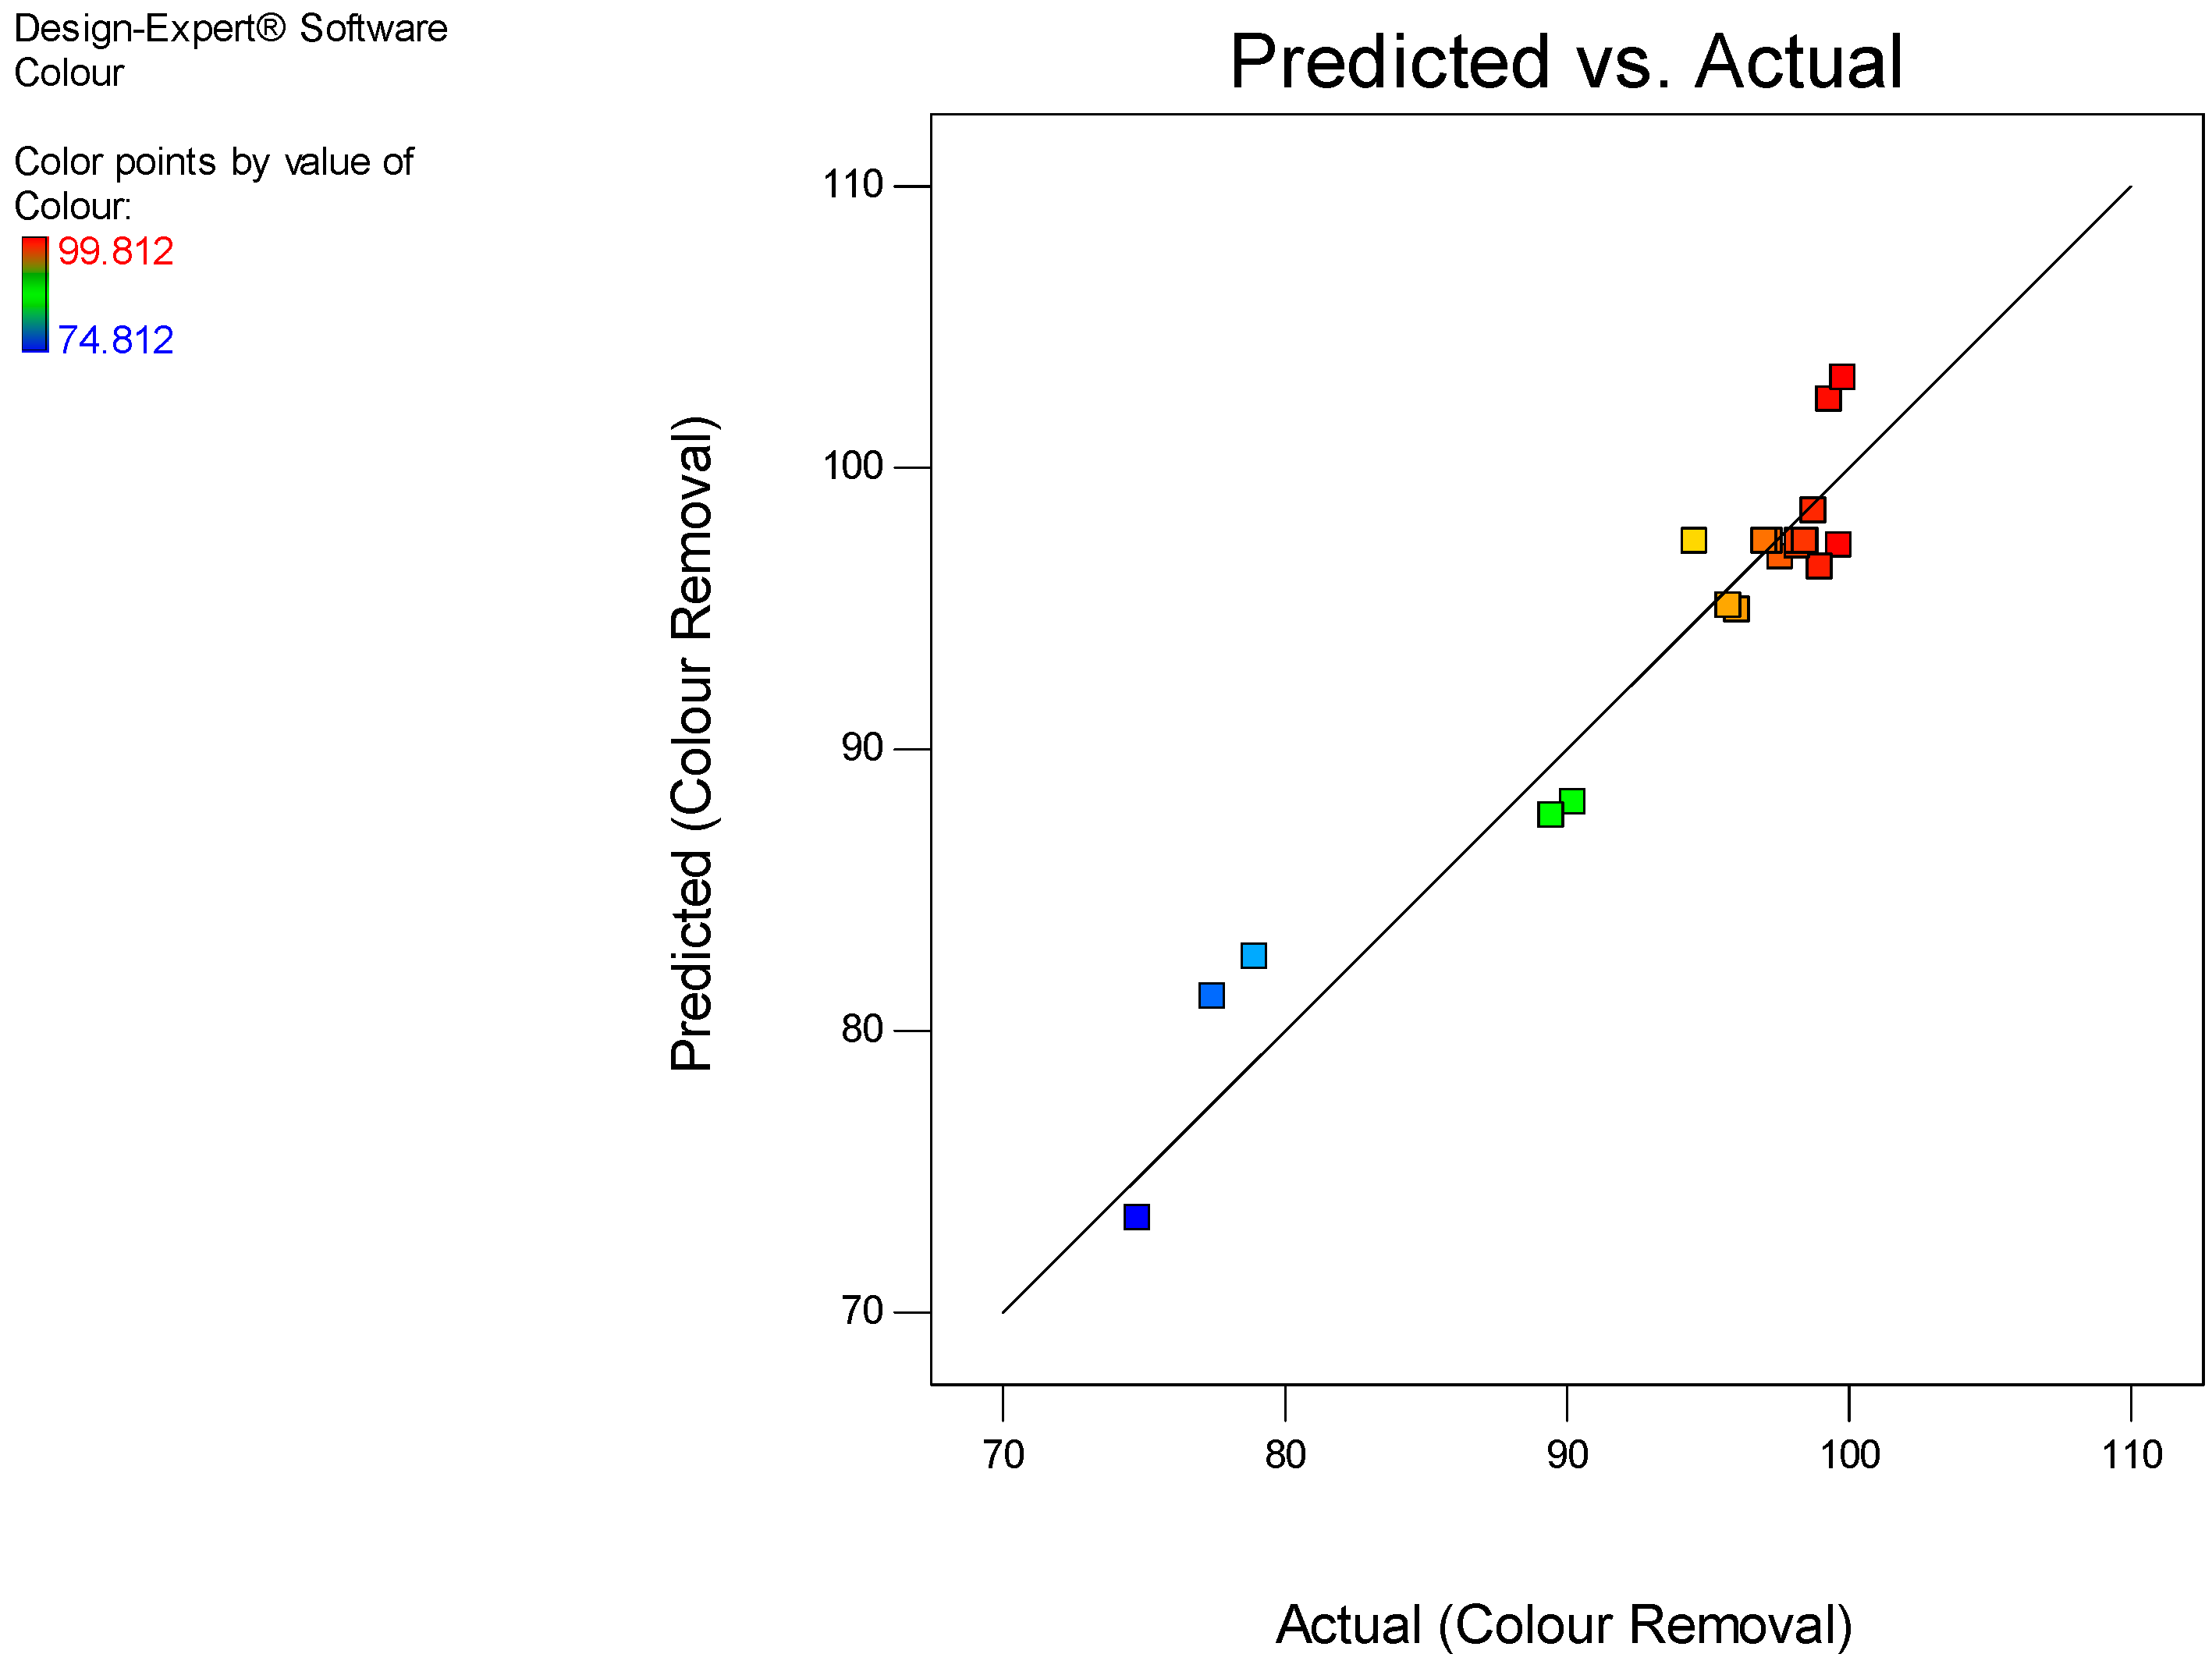
3.3.1. Result Analysis
3.3.2. Result Validation
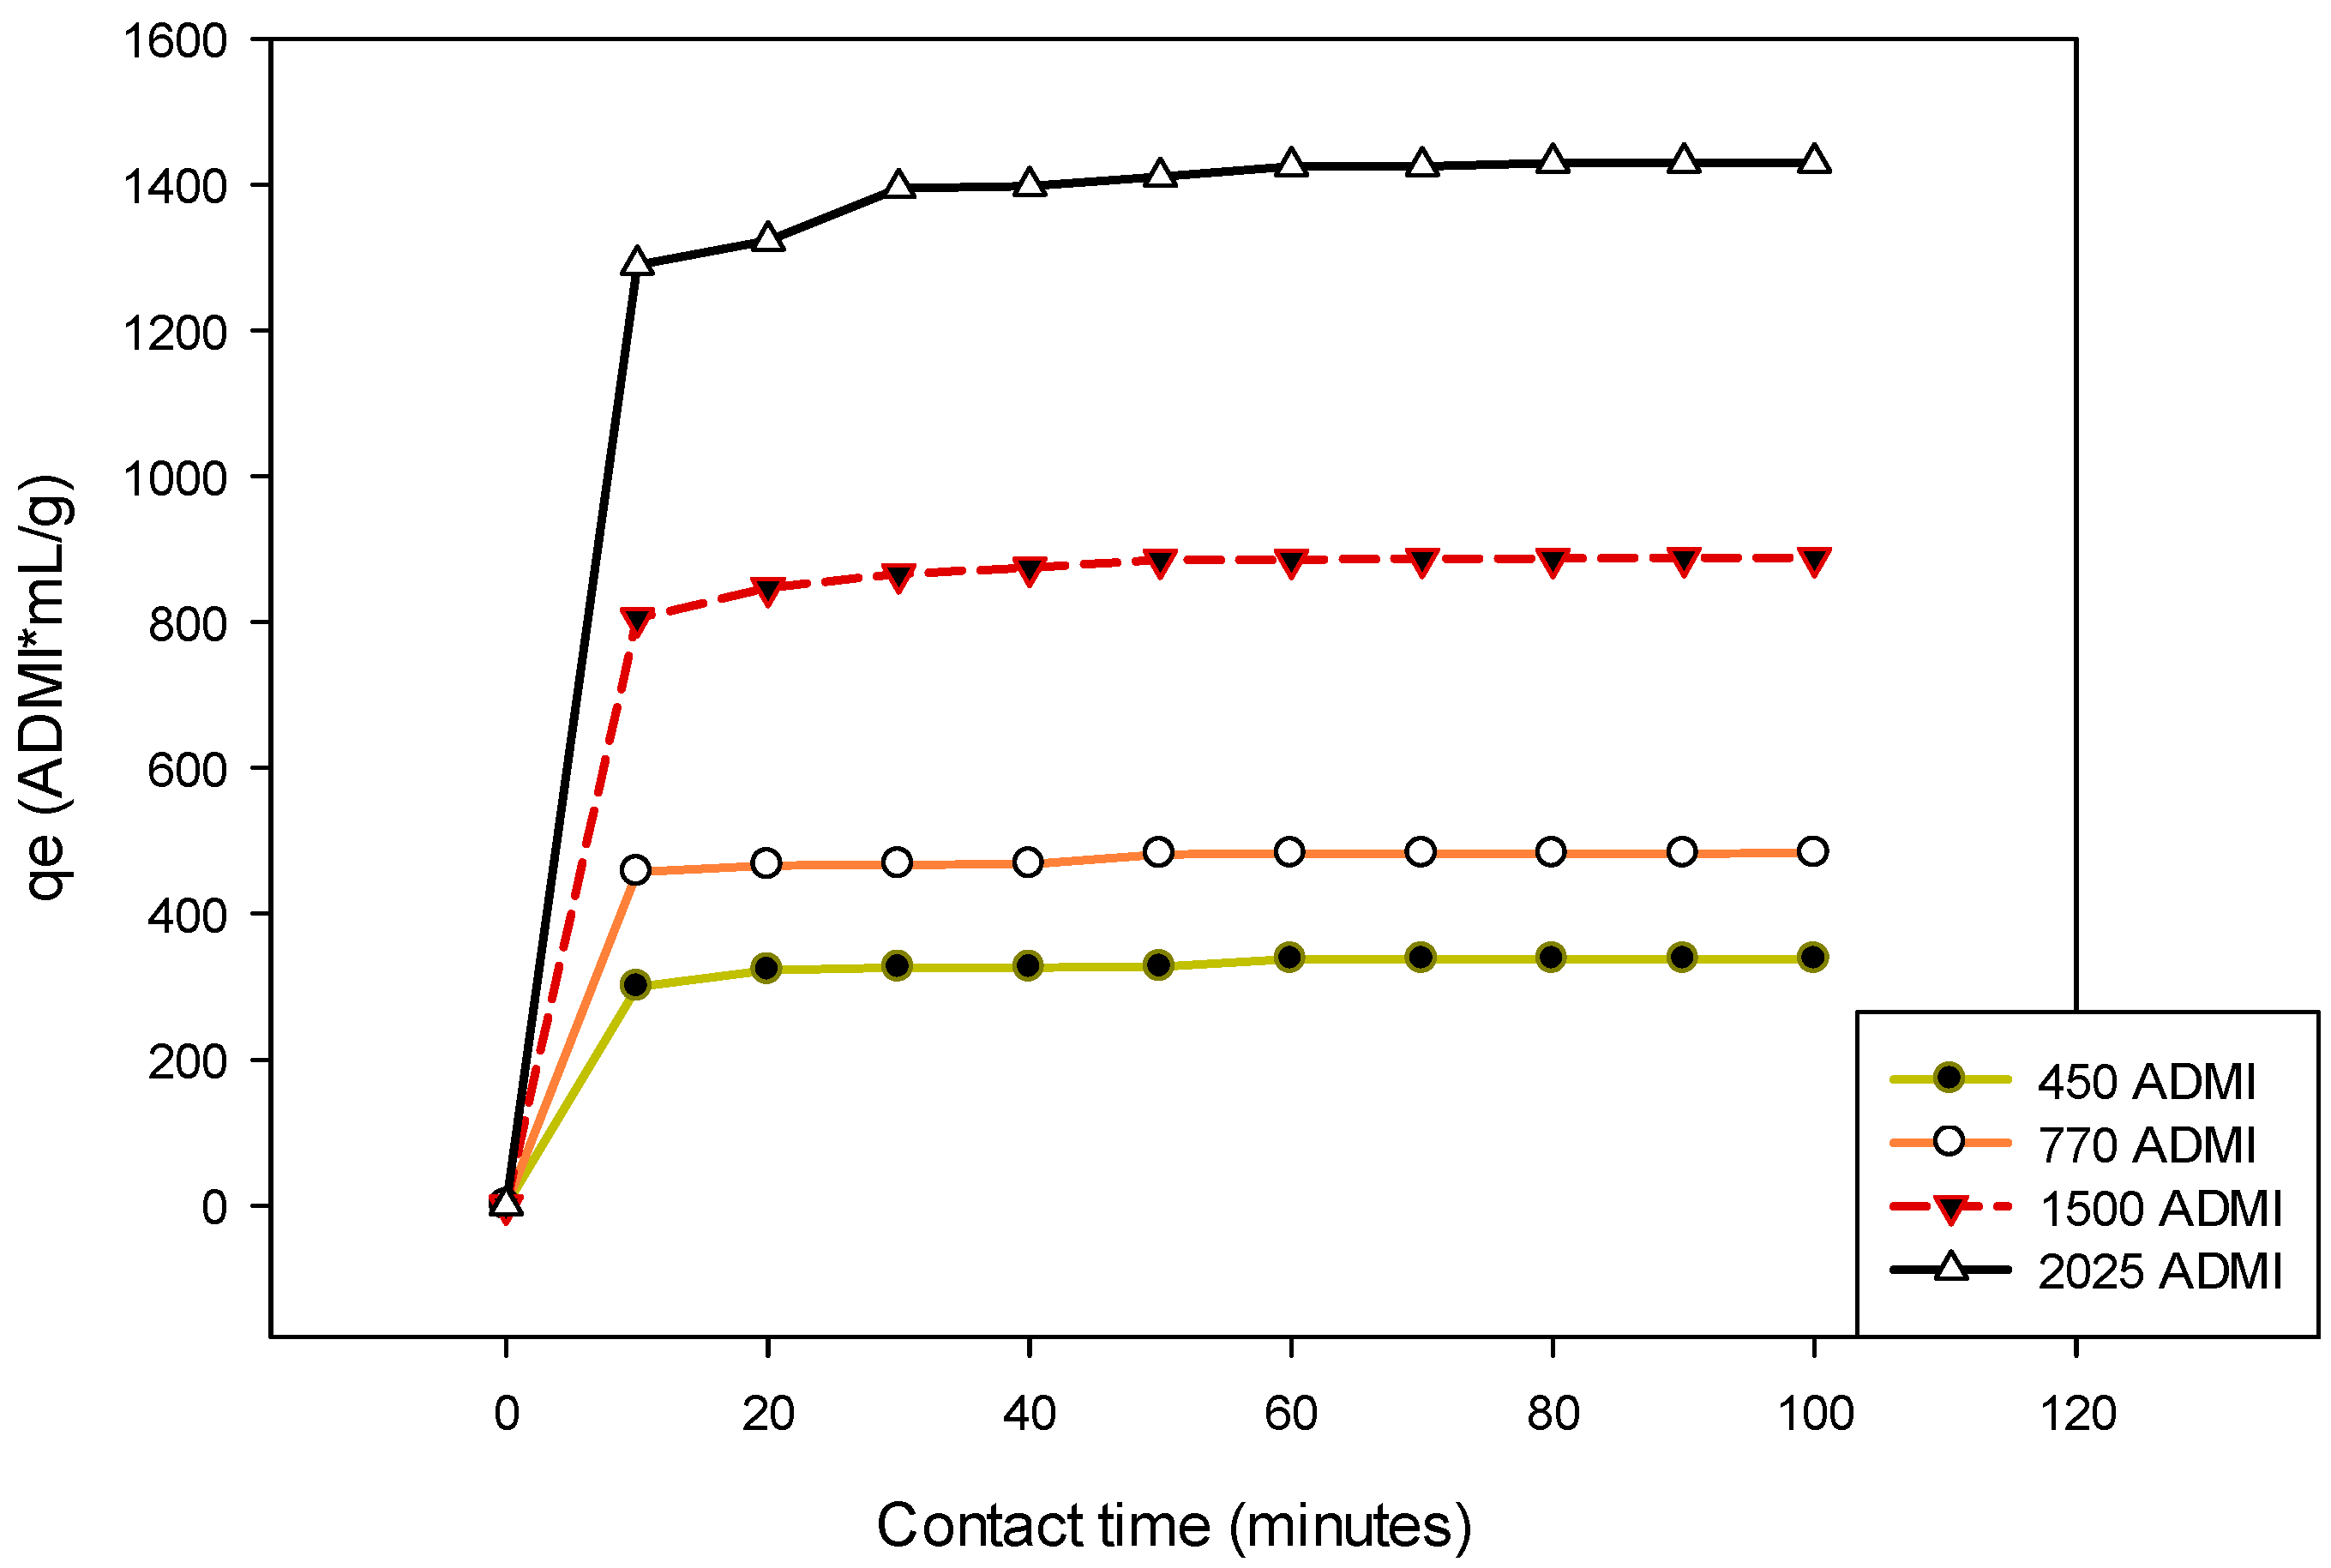
3.4. Adsorption Equilibrium Capacity
3.5. Adsorption Isotherm
4. Conclusions
Supplementary Materials
Author Contributions
Funding
Acknowledgements
Conflicts of Interest
References
- Sia, Y.Y.; Ai, I.; Tan, W.; Abdullah, M.O. Adsorption of colour, TSS and COD from palm oil mill effluent (POME) using acid-washed coconut shell activated carbon. Kinet. Mech. Stud. 2017, 03010, 1–7. [Google Scholar] [CrossRef]
- Hashim, Z.; Subramaniam, V.; Harun, M.H.; Kamarudin, N. Carbon footprint of oil palm planted on peat in Malaysia. Int. J. Life Cycle Assess. 2017, 23, 1201–1217. [Google Scholar] [CrossRef]
- Ahmad, A.L.; Ismail, S.; Bhatia, S. Optimization of coagulation-flocculation process for palm oil mill effluent using response surface methodology. Environ. Sci. Technol. 2005, 39, 2828–2834. [Google Scholar] [CrossRef] [PubMed]
- Tabassum, S.; Zhang, Y.; Zhang, Z. An integrated method for palm oil mill effluent (POME) treatment for achieving zero liquid discharge—A pilot study. J. Clean. Prod. 2015, 95, 145–155. [Google Scholar] [CrossRef]
- Parthasarathy, S.; Mohammed, R.R.; Fong, C.M.; Gomes, R.L.; Manickam, S. A novel hybrid approach of activated carbon and ultrasound cavitation for the intensification of palm oil mill effluent (POME) polishing. J. Clean. Prod. 2016, 112, 1218–1226. [Google Scholar] [CrossRef] [Green Version]
- Saeed, M.O.; Azizli, K.; Isa, M.H.; Bashir, M.J.K. Application of CCD in RSM to obtain optimize treatment of POME using Fenton oxidation process. J. Water Process Eng. 2015, 8, e7–e16. [Google Scholar] [CrossRef]
- Tan, Y.H.; Goh, P.S.; Ismail, A.F.; Ng, B.C.; Lai, G.S. Decolourization of aerobically treated palm oil mill effluent (AT-POME) using polyvinylidene fluoride (PVDF) ultrafiltration membrane incorporated with coupled zinc-iron oxide nanoparticles. Chem. Eng. J. 2017, 308, 359–369. [Google Scholar] [CrossRef]
- Subramaniam, M.N.; Goh, P.S.; Lau, W.J.; Tan, Y.H.; Ng, B.C.; Ismail, A.F. Hydrophilic hollow fiber PVDF ultrafiltration membrane incorporated with titanate nanotubes for decolourization of aerobically-treated palm oil mill effluent. Chem. Eng. J. 2017, 316, 101–110. [Google Scholar] [CrossRef]
- Baranitharan, E.; Khan, M.R.; Prasad, D.M.R.; Teo, W.F.A.; Tan, G.Y.A.; Jose, R. Effect of biofilm formation on the performance of microbial fuel cell for the treatment of palm oil mill effluent. Bioprocess Biosyst. Eng. 2015, 38, 15–24. [Google Scholar] [CrossRef] [PubMed]
- Neoh, C.H.; Yung, P.Y.; Noor, Z.Z.; Razak, M.H.; Aris, A.; Md Din, M.F.; Ibrahim, Z. Correlation between microbial community structure and performances of membrane bioreactor for treatment of palm oil mill effluent. Chem. Eng. J. 2017, 308, 656–663. [Google Scholar] [CrossRef]
- Tee, P.F.; Abdullah, M.O.; Tan, I.A.W.; Mohamed Amin, M.A.; Nolasco-Hipolito, C.; Bujang, K. Performance evaluation of a hybrid system for efficient palm oil mill effluent treatment via an air-cathode, tubular upflow microbial fuel cell coupled with a granular activated carbon adsorption. Bioresour. Technol. 2016, 216, 478–485. [Google Scholar] [CrossRef] [PubMed] [Green Version]
- Alkhatib, M.F.; Mamun, A.A.; Akbar, I. Application of response surface methodology (RSM) for optimization of color removal from POME by granular activated carbon. Int. J. Environ. Sci. Technol. 2015, 12, 1295–1302. [Google Scholar] [CrossRef]
- Demirbas, A. Agricultural based activated carbons for the removal of dyes from aqueous solutions: A review. J. Hazard. Mater. 2009, 167, 1–9. [Google Scholar] [CrossRef] [PubMed]
- Ghaedi, M.; Sadeghian, B.; Pebdani, A.A.; Sahraei, R.; Daneshfar, A.; Duran, C. Kinetics, thermodynamics and equilibrium evaluation of direct yellow 12 removal by adsorption onto silver nanoparticles loaded activated carbon. Chem. Eng. J. 2012, 187, 133–141. [Google Scholar] [CrossRef]
- Kismir, Y.; Aroguz, A.Z. Adsorption characteristics of the hazardous dye Brilliant Green on Sakli{dotless}kent mud. Chem. Eng. J. 2011, 172, 199–206. [Google Scholar] [CrossRef]
- Jumasiah, A.; Chuah, T.G.; Gimbon, J.; Choong, T.S.Y.; Azni, I. Adsorption of basic dye onto palm kernel shell activated carbon: Sorption equilibrium and kinetics studies. Desalination 2005, 186, 57–64. [Google Scholar] [CrossRef]
- Mohammed, R.R.; Chong, M.F. Treatment and decolorization of biologically treated Palm Oil Mill Effluent (POME) using banana peel as novel biosorbent. J. Environ. Manag. 2014, 132, 237–249. [Google Scholar] [CrossRef] [PubMed]
- Fang, R.; Huang, H.; Ji, J.; He, M.; Feng, Q.; Zhan, Y.; Leung, D.Y.C. Efficient MnOxsupported on coconut shell activated carbon for catalytic oxidation of indoor formaldehyde at room temperature. Chem. Eng. J. 2018, 334, 2050–2057. [Google Scholar] [CrossRef]
- Aljeboree, A.M.; Alshirifi, A.N.; Alkaim, A.F. Kinetics and equilibrium study for the adsorption of textile dyes on coconut shell activated carbon. Arab. J. Chem. 2017, 10, S3381–S3393. [Google Scholar] [CrossRef]
- Yuan, G.; Yin, F.; Zhao, Y.; Bakenov, Z.; Wang, G.; Zhang, Y. Corn stalk-derived activated carbon with a stacking sheet-like structure as sulfur cathode supporter for lithium/sulfur batteries. Ionics 2016, 22, 63–69. [Google Scholar] [CrossRef]
- Han, M.; Qu, J.; Guo, Q. Corn stalk activated carbon based Co catalyst prepared by one-step method for hydrogen generation. Procedia Eng. 2015, 102, 450–457. [Google Scholar] [CrossRef]
- Cechinel, M.A.P.; de Souza, S.M.A.G.; de Souza, A.A. Study of lead (II) adsorption onto activated carbon originating from cow bone. J. Clean. Prod. 2013, 65, 342–349. [Google Scholar] [CrossRef]
- Cazetta, A.L.; Martins, A.C.; Pezoti, O.; Bedin, K.C.; Beltrame, K.K.; Asefa, T.; Almeida, V.C. Synthesis and application of N-S-doped mesoporous carbon obtained from nanocasting method using bone char as heteroatom precursor and template. Chem. Eng. J. 2016, 300, 54–63. [Google Scholar] [CrossRef]
- Yahya, M.A.; Al-Qodah, Z.; Ngah, C.W.Z. Agricultural bio-waste materials as potential sustainable precursors used for activated carbon production: A review. Renew. Sustain. Energy Rev. 2015, 46, 218–235. [Google Scholar] [CrossRef]
- Shen, F.; Wang, Y.; Li, L.; Zhang, K.; Smith, R.L.; Qi, X. Porous carbonaceous materials from hydrothermal carbonization and KOH activation of corn stover for highly efficient CO2capture. Chem. Eng. Commun. 2018, 205, 423–431. [Google Scholar] [CrossRef]
- Etim, U.J.; Umoren, S.A.; Eduok, U.M. Coconut coir dust as a low cost adsorbent for the removal of cationic dye from aqueous solution. J. Saudi Chem. Soc. 2016, 20, S67–S76. [Google Scholar] [CrossRef]
- Ghani, Z.A.; Yusoff, M.S.; Zaman, N.Q.; Zamri, M.F.M.A.; Andas, J. Optimization of preparation conditions for activated carbon from banana pseudo-stem using response surface methodology on removal of color and COD from landfill leachate. Waste Manag. 2017, 62, 177–187. [Google Scholar] [CrossRef] [PubMed]
- Azmi, N.S.; Yunos, K.F. Wastewater Treatment of Palm Oil Mill Effluent (POME) by Ultrafiltration Membrane Seperation Technique Coupled with Adsorption Treatment as Pretreatment. Agric. Agric. Sci. Procedia. 2014, 2, 257–264. [Google Scholar] [CrossRef]
- Amosa, M.K.; Jami, M.S.; Alkhatib, M.F.R. Electrostatic Biosorption of COD, Mn and H2S on EFB-Based Activated Carbon Produced through Steam Pyrolysis: An Analysis Based on Surface Chemistry, Equilibria and Kinetics. Waste Biomass Valoriz. 2016, 7, 109–124. [Google Scholar] [CrossRef]
- Gupta, V.K.; Carrott, P.J.M.; Ribeiro Carrott, M.M.L. Suhas Low-Cost adsorbents: Growing approach to wastewater treatmenta review. Crit. Rev. Environ. Sci. Technol. 2009, 39, 783–842. [Google Scholar] [CrossRef]
- Fang, P.; Omar, M.; Ai, I.; Tan, W.; Khairunnisa, N.; Rashid, A.; Mohamed, A.; Nolasco-hipolito, C.; Bujang, K. Review on hybrid energy systems for wastewater treatment and bio-energy production. Renew. Sustain. Energy Rev. 2016, 54, 235–246. [Google Scholar] [CrossRef] [Green Version]
- Kaman, S.; Tan, I.; Lim, L. Palm oil mill effluent treatment using coconut shell–based activated carbon: Adsorption equilibrium and isotherm. MATEC Web 2017, 87, 3009. [Google Scholar] [CrossRef]
- Basta, A.H.; Fierro, V.; El-Saied, H.; Celzard, A. 2-Steps KOH activation of rice straw: An efficient method for preparing high-performance activated carbons. Bioresour. Technol. 2009, 100, 3941–3947. [Google Scholar] [CrossRef] [PubMed]
- Hoseinzadeh Hesas, R.; Arami-Niya, A.; Wan Daud, W.M.A.; Sahu, J.N. Microwave-assisted production of activated carbons from oil palm shell in the presence of CO2 or N2 for CO2 adsorption. J. Ind. Eng. Chem. 2015, 24, 196–205. [Google Scholar] [CrossRef]
- Saucier, C.; Adebayo, M.A.; Lima, E.C.; Cataluña, R.; Thue, P.S.; Prola, L.D.T.; Puchana-Rosero, M.J.; Machado, F.M.; Pavan, F.A.; Dotto, G.L. Microwave-assisted activated carbon from cocoa shell as adsorbent for removal of sodium diclofenac and nimesulide from aqueous effluents. J. Hazard. Mater. 2015, 289, 18–27. [Google Scholar] [CrossRef] [PubMed]
- Yang, K.; Peng, J.; Srinivasakannan, C.; Zhang, L.; Xia, H.; Duan, X. Preparation of high surface area activated carbon from coconut shells using microwave heating. Bioresour. Technol. 2010, 101, 6163–6169. [Google Scholar] [CrossRef] [PubMed]
- APHA. Standard Methods for the Examination of Water and Waste Water, 21st ed.; American Public Health Association: Washington, DC, USA, 2005. [Google Scholar]
- Jalani, N.F.; Aziz, A.A.; Wahab, N.A.; Hasamudin, W.; Hassan, W.; Zainal, N.H. Application of Palm Kernel Shell Activated Carbon for the Removal of Pollutant and Color in Palm Oil Mill Effluent Treatment. J. Earth Environ. Health Sci. 2016, 15–20. [Google Scholar] [CrossRef]
- Heibati, B.; Rodriguez-Couto, S.; Al-Ghouti, M.A.; Asif, M.; Tyagi, I.; Agarwal, S.; Gupta, V.K. Kinetics and thermodynamics of enhanced adsorption of the dye AR 18 using activated carbons prepared from walnut and poplar woods. J. Mol. Liq. 2015, 208, 99–105. [Google Scholar] [CrossRef]
- Pathania, D.; Sharma, S.; Singh, P. Removal of methylene blue by adsorption onto activated carbon developed from Ficus carica bast. Arab. J. Chem. 2017, 10, S1445–S1451. [Google Scholar] [CrossRef]
- Liu, C.; Tang, Z.; Chen, Y.; Su, S.; Jiang, W. Bioresource Technology Characterization of mesoporous activated carbons prepared by pyrolysis of sewage sludge with pyrolusite. Bioresour. Technol. 2010, 101, 1097–1101. [Google Scholar] [CrossRef] [PubMed]
- Song, X.; Liu, H.; Cheng, L.; Qu, Y. Surface modification of coconut-based activated carbon by liquid-phase oxidation and its effects on lead ion adsorption. Desalination 2010, 255, 78–83. [Google Scholar] [CrossRef]
- Zhang, Y.; Tan, Z.; Liu, B.; Mao, D.; Xiong, C. Coconut shell activated carbon tethered ionic liquids for continuous cycloaddition of CO 2 to epichlorohydrin in packed bed reactor. CATCOM 2015, 68, 73–76. [Google Scholar] [CrossRef]
- Yang, T.; Lua, A.C. Characteristics of activated carbons prepared from pistachio-nut shells by potassium hydroxide activation. Microporous Mesoporous Mater. 2003, 63, 113–124. [Google Scholar] [CrossRef]
- Foo, K.Y.; Hameed, B.H. Coconut husk derived activated carbon via microwave induced activation: Effects of activation agents, preparation parameters and adsorption performance. Chem. Eng. J. 2012, 184, 57–65. [Google Scholar] [CrossRef]
- Foo, K.Y.; Hameed, B.H. Adsorption characteristics of industrial solid waste derived activated carbon prepared by microwave heating for methylene blue. Fuel Process. Technol. 2012, 99, 103–109. [Google Scholar] [CrossRef]
- Sharif, Y.M.; Saka, C.; Baytar, O.; Şahin, Ö. Preparation and Characterization of Activated Carbon from Sesame Seed Shells by Microwave and Conventional Heating with Zinc Chloride Activation. Anal. Lett. 2018, 2719, 1–14. [Google Scholar] [CrossRef]
- Li, W.; Peng, J.; Zhang, L.; Yang, K.; Xia, H.; Zhang, S.; Guo, S. Preparation of activated carbon from coconut shell chars in pilot-scale microwave heating equipment at 60 kW. Waste Manag. 2009, 29, 756–760. [Google Scholar] [CrossRef] [PubMed]
- Su, W.; Zhou, L.; Zhou, Y. Preparation of microporous activated carbon from coconut shells without activating agents. Carbon N. Y. 2003, 41, 861–863. [Google Scholar] [CrossRef]
- Monsalvo, V.M.; Mohedano, A.F.; Rodriguez, J.J. Activated carbons from sewage sludge. Application to aqueous-phase adsorption of 4-chlorophenol. Desalination 2011, 277, 377–382. [Google Scholar] [CrossRef]
- Li, L.; Liu, S.; Liu, J. Surface modification of coconut shell based activated carbon for the improvement of hydrophobic VOC removal. J. Hazard. Mater. 2011, 192, 683–690. [Google Scholar] [CrossRef] [PubMed]
- Namasivayam, C.; Kadirvelu, K. Activated Carbons Prepared From Coir Pith By Physical and Chemical Activation Methods. Bioresour. Technol. 1997, 62, 123–127. [Google Scholar] [CrossRef]
- Hidayu, A.R.; Mohamad, N.F.; Matali, S.; Sharifah, A.S.A.K. Characterization of activated carbon prepared from oil palm empty fruit bunch using BET and FT-IR techniques. Procedia Eng. 2013, 68, 379–384. [Google Scholar] [CrossRef]
- Li, W.H.; Yue, Q.Y.; Gao, B.Y.; Ma, Z.H.; Li, Y.J.; Zhao, H.X. Preparation and utilization of sludge-based activated carbon for the adsorption of dyes from aqueous solutions. Chem. Eng. J. 2011, 171, 320–327. [Google Scholar] [CrossRef]
- Hoseinzadeh Hesas, R.; Arami-Niya, A.; Wan Daud, W.M.A.; Sahu, J.N. Comparison of oil palm shell-based activated carbons produced by microwave and conventional heating methods using zinc chloride activation. J. Anal. Appl. Pyrolysis 2013, 104, 176–184. [Google Scholar] [CrossRef]
- Singh, K.P.; Malik, A.; Sinha, S.; Ojha, P. Liquid-phase adsorption of phenols using activated carbons derived from agricultural waste material. J. Hazard. Mater. 2008, 150, 626–641. [Google Scholar] [CrossRef] [PubMed]
- Achaw, O.W.; Afrane, G. The evolution of the pore structure of coconut shells during the preparation of coconut shell-based activated carbons. Microporous Mesoporous Mater. 2008, 112, 284–290. [Google Scholar] [CrossRef]
- Velghe, I.; Carleer, R.; Yperman, J.; Schreurs, S.; D’Haen, J. Characterisation of adsorbents prepared by pyrolysis of sludge and sludge/disposal filter cake mix. Water Res. 2012, 46, 2783–2794. [Google Scholar] [CrossRef] [PubMed]
- Cook, C.; Francocci, F.; Cervone, F.; Bellincampi, D.; Bolwell, P.G.; Ferrari, S.; Devoto, A. Combination of Pretreatment with White Rot Fungi and Modification of Primary and Secondary Cell Walls Improves Saccharification. Bioenergy Res. 2015, 8, 175–186. [Google Scholar] [CrossRef]
- Li, W.; Yue, Q.; Tu, P.; Ma, Z.; Gao, B.; Li, J.; Xu, X. Adsorption characteristics of dyes in columns of activated carbon prepared from paper mill sewage sludge. Chem. Eng. J. 2011, 178, 197–203. [Google Scholar] [CrossRef]
- Mohammed, R.R. Decolorisation of Biologically Treated Palm Oil Mill Effluent (POME) Using Adsorption Technique. Int. Ref. J. Eng. Sci. 2013, 2, 1–11. [Google Scholar]
- Gupta, V.K.; Agarwal, S.; Saleh, T.A. Chromium removal by combining the magnetic properties of iron oxide with adsorption properties of carbon nanotubes. Water Res. 2011, 45, 2207–2212. [Google Scholar] [CrossRef] [PubMed]
- Sia, Y.Y.; Tan, I.A.W.; Abdullah, M.O. Adsorption of colour, TSS and COD from palm oil mill effluent (POME) using acid-washed coconut shell activated carbon: Kinetic and mechanism studies. MATEC Web Conf. 2017, 87. [Google Scholar] [CrossRef]
- Yang, S.; Li, J.; Shao, D.; Hu, J.; Wang, X. Adsorption of Ni(II) on oxidized multi-walled carbon nanotubes: Effect of contact time, pH, foreign ions and PAA. J. Hazard. Mater. 2009, 166, 109–116. [Google Scholar] [CrossRef] [PubMed]
- Mohammed, R.R.; Ketabachi, M.R.; McKay, G. Combined magnetic field and adsorption process for treatment of biologically treated palm oil mill effluent (POME). Chem. Eng. J. 2014, 243, 31–42. [Google Scholar] [CrossRef]
- Alam, M.Z.; Ameem, E.S.; Muyibi, S.A.; Kabbashi, N.A. The factors affecting the performance of activated carbon prepared from oil palm empty fruit bunches for adsorption of phenol. Chem. Eng. J. 2009, 155, 191–198. [Google Scholar] [CrossRef]
- Tan, I.A.W.; Hameed, B.H.; Ahmad, A.L. Equilibrium and kinetic studies on basic dye adsorption by oil palm fibre activated carbon. Chem. Eng. J. 2007, 127, 111–119. [Google Scholar] [CrossRef]
- Guechi, E.K.; Hamdaoui, O. Sorption of malachite green from aqueous solution by potato peel: Kinetics and equilibrium modeling using non-linear analysis method. Arab. J. Chem. 2016, 9, S416–S424. [Google Scholar] [CrossRef]


| Independent Factor | Unit | Symbol | Coded Level | ||
|---|---|---|---|---|---|
| −1 | 0 | +1 | |||
| pH | - | A | 6 | 6.5 | 7 |
| Dosage | g | B | 2 | 4 | 6 |
| Contact time | minutes | C | 10 | 55 | 100 |
| Element | Non-Pretreated CSAC | Microwave Pretreated CS-AC | ||
|---|---|---|---|---|
| Weight % | Atom % | Weight % | Atom % | |
| C | 95.03 | 97.58 | 98.93 | 99.36 |
| O | 1.56 S | 1.20 | 0.41 S | 0.28 |
| Si | 0.69 | 0.30 | 0.27 | 0.15 |
| Cl | 1.78 | 0.62 | - | - |
| K | 0.94 | 0.30 | 0.39 | 0.21 |
| Total | 100.00 | 100.00 | 100.00 | 100.00 |
| Parameters | Abbreviation | Non-Pretreated CSAC | Microwave Pre-Treated CSAC | Percentage of Increment % | |
|---|---|---|---|---|---|
| BET Surface Are (m2/g) | SBET | 421.5786 | 702.4341 | 66.62 | |
| Pore volume (cm3/g) | PV | 0.030 | 0.056 | 86.67 | |
| BET Analysis Conditions | |||||
| Analysis adsorptive | N2 | ||||
| Temperature (K) | 77 | ||||
| Cold free space (cm3) | 60.8085 | ||||
| Warm free space (cm3) | 16.2270 | ||||
| Equilibration interval (s) | 10 | ||||
| Ramp rate (°C/min) | 10 | ||||
| sample density (g/cm3) | 1.000 | ||||
| Reference | Activation Method | Activation Temperature (°C) | Activation Agent | Activation Time (Minutes) | SBET (m2/g) |
|---|---|---|---|---|---|
| Current Study | Physical | 850 | Steam | 120 | 421.5786 |
| Physical + Microwave | 900 | Steam + N2 | 10 (microwave) | 702.4341 | |
| Yang et al. [36] | Microwave | 900 | Steam + CO2 | 75 | 2194 |
| Su et al. [49] | Physical | 850 | - | 60 | 663 |
| Monsalvo et al. [50] | Physical | 800 | CO2 | 240 | 97 |
| Li et al. [51] | Physical | 850 | N2 + Stream | 60 | 280 |
| Namasivayam and Kadirvelu [52] | Physical | 400 | Steam | 60 | 346 |
| Hidayu et al. [53] | Physical | 765 | Steam | 77 | 720 |
| Li et al. [54] | Physical | 850 | N2 + Steam | 60 | 130 |
| Hesas et al. [55] | Physical | 500 | N2 | 120 | 484 |
| Singh et al. [56] | Physical | 200-800 | Inert-Atmosphere | 60 | 378 |
| Achaw and Afrane [57] | Physical | 800 | Steam + N2 | 120 | 524 |
| Velghe et al. [58] | Physical | 450 | N2 | 90 | 60 |
| Source | Sum of Squares | df | Mean Square | F Value | p-Value Prob > F | |
|---|---|---|---|---|---|---|
| Model | 1075.08 | 9 | 119.45 | 13.97 | 0.0001 | significant |
| A-pH | 0.025 | 1 | 0.025 | 2.926E-003 | 0.9579 | |
| B-Dosage | 761.31 | 1 | 761.31 | 89.06 | <0.0001 | |
| C-Contact Time | 0.18 | 1 | 0.18 | 0.021 | 0.8870 | |
| AB | 1.46 | 1 | 1.46 | 0.17 | 0.6878 | |
| AC | 70.79 | 1 | 70.79 | 8.28 | 0.0165 | |
| BC | 0.11 | 1 | 0.11 | 0.013 | 0.9118 | |
| A2 | 9.99 | 1 | 9.99 | 1.17 | 0.3050 | |
| B2 | 237.07 | 1 | 237.07 | 27.73 | 0.0004 | |
| C2 | 0.24 | 1 | 0.24 | 0.028 | 0.8710 | |
| R2 | 0.9263 | |||||
| Adjusted-R2 | 0.8601 |
| Recommended Optimal Treatment Conditions | Actual Colour Removal | Deviations | ||||
|---|---|---|---|---|---|---|
| Number | pH | Dosage | Contact Time | Predicted Colour Removal | ||
| 1 | 7.000 | 3.208 | 35.000 | 95.844 | 96.52 | 0.676 |
| 2 | 7.000 | 3.193 | 35.000 | 95.767 | 96.21 | 0.443 |
| 3 | 7.000 | 3.190 | 35.000 | 95.753 | 96.03 | 0.277 |
| 4 | 7.000 | 3.170 | 35.000 | 95.649 | 95.81 | 0.161 |
| 5 | 7.000 | 3.289 | 35.000 | 96.261 | 96.89 | 0.629 |
| Average Values | 95.855 | 96.292 | 0.437 | |||
| Isotherm Model | Plotted Variables | Constants | R2 | ||
|---|---|---|---|---|---|
| 1/n | n | KF | |||
| Freundlich: | 0.9758 | 1.031 | 0.8744 | 0.9851 | |
| Langmuir: | 0.0127 | ||||
| 0.00003 | 1.3780 | 0.7257 | |||
© 2018 by the authors. Licensee MDPI, Basel, Switzerland. This article is an open access article distributed under the terms and conditions of the Creative Commons Attribution (CC BY) license (http://creativecommons.org/licenses/by/4.0/).
Share and Cite
Abdulsalam, M.; Che Man, H.; Isma Idris, A.; Zainal Abidin, Z.; Faezah Yunos, K. The Pertinence of Microwave Irradiated Coconut Shell Bio-Sorbent for Wastewater Decolourization: Structural Morphology and Adsorption Optimization Using the Response Surface Method (RSM). Int. J. Environ. Res. Public Health 2018, 15, 2200. https://0-doi-org.brum.beds.ac.uk/10.3390/ijerph15102200
Abdulsalam M, Che Man H, Isma Idris A, Zainal Abidin Z, Faezah Yunos K. The Pertinence of Microwave Irradiated Coconut Shell Bio-Sorbent for Wastewater Decolourization: Structural Morphology and Adsorption Optimization Using the Response Surface Method (RSM). International Journal of Environmental Research and Public Health. 2018; 15(10):2200. https://0-doi-org.brum.beds.ac.uk/10.3390/ijerph15102200
Chicago/Turabian StyleAbdulsalam, Mohammed, Hasfalina Che Man, Aida Isma Idris, Zurina Zainal Abidin, and Khairul Faezah Yunos. 2018. "The Pertinence of Microwave Irradiated Coconut Shell Bio-Sorbent for Wastewater Decolourization: Structural Morphology and Adsorption Optimization Using the Response Surface Method (RSM)" International Journal of Environmental Research and Public Health 15, no. 10: 2200. https://0-doi-org.brum.beds.ac.uk/10.3390/ijerph15102200