Article

Estimated Acute Effects of Ozone on Mortality in a Rural District of Beijing, China, 2005–2013: A Time-Stratified Case-Crossover Study

1
State Key Laboratory of Severe Weather & Key Laboratory of Atmospheric Chemistry of CMA, Chinese Academy of Meteorological Sciences, Beijing 100081, China
2
Institute of Environmental Pollution and Health, School of Environmental and Chemical Engineering, Shanghai University, Shanghai 200444, China
3
Chinese Center for Disease Control and Prevention, Beijing 102206, China
4
Institute of Urban Meteorology, China Meteorological Administration, Beijing 100089, China
*
Author to whom correspondence should be addressed.
Int. J. Environ. Res. Public Health 2018, 15(11), 2460; https://0-doi-org.brum.beds.ac.uk/10.3390/ijerph15112460
Submission received: 14 September 2018 / Revised: 11 October 2018 / Accepted: 24 October 2018 / Published: 5 November 2018

Abstract

:
Studies have shown that ozone (O3) has adverse impacts on human health. In China, O3 levels have continued to increase since 2010. When compared to the large number of studies concerning the health effects of PM2.5 in China, there have been limited explorations of the effects of O3. The Beijing region has one of the highest O3 concentrations in the country, but there appear to be no published studies regarding the health effects of O3 in Beijing. In this study, we applied a time-stratified case-crossover design to explore the effects of O3 on cause-specific mortality for a rural location near Beijing over the period 2005–2013. For year-round effects, we found that for all-causes mortality, with a 10-unit increase in O3 concentration, the odds ratios (ORs) were in the range of 1.009–1.020 for different lag days. The ORs for cardiovascular mortality with a 10-unit increase in O3 concentration were in the range of 1.011–1.017 for different lag days. For warm season effects, the ORs with a 10-unit increase in O3 concentration for all-cause mortality were in the range of 1.025–1.031 for different lag days. The ORs for cardiovascular mortality with a 10-unit increase of O3 concentration were in the range of 1.020–1.024 for different lag days. Our findings fill a knowledge gap that has hitherto existed in studies regarding O3 health impacts, and our results will strengthen the rationale for O3 control in China.

1. Introduction

In recent years, China has experienced increasing numbers of severe air pollution events. Studies have demonstrated adverse impacts of ozone on human health; among all of the air pollutants, ozone (O3) and PM2.5 (particles with aerodynamic diameters < 2.5 μm) are believed to have the most significant associations between cause-specific mortality and morbidity, especially cardiorespiratory morbidity [1,2]. Most studies have focused on the adverse effects of PM2.5; based on the results of the research, policies regarding PM2.5 control have been implemented. In China, strict policies for PM10 (particles with aerodynamic diameters < 10.0 μm) and PM2.5 control have been implemented. Due to these strategies, concentrations of atmospheric TSP (total suspended particles) and PM10 have been decreasing since 1998. Moreover, levels of PM2.5 continued to decrease during the period 2010–2016 [3,4,5,6,7,8,9]. However, O3 continued to increase after 2010, especially in the three most developed areas in China: the Pearl River delta, Yangtze River delta and Beijing-Tianjin-Hebei [3,4,5,6,7,8,9]. There were no data published concerning O3 before 2008. Since PM2.5 control policies included reducing both NOx and VOCs (volatile organic compounds), O3 concentration increased with a more favorable ratio of NOx to VOCs [10].
Evidence concerning the adverse effects of O3 on human health, while being relatively limited, is nonetheless very convincing [11,12,13]. These studies have demonstrated links between short-term O3 exposure and adverse health effects, including respiratory illnesses, acute respiratory symptoms, emergency department visits, hospital admissions, and premature mortality. Based on this, the World Health Organization has set O3 standards and provided suggestions [14]. In 2012, the Ministry of Environmental Protection of the People’s Republic of China set the following O3 air quality standards (GB 3095-2012): class 1 (remote) areas mandate daily 8-h and 1-h maxima of 100 and 160 μg/m3, respectively; in class 2 (urban/industrial and surrounding rural) areas, the corresponding values are 160 and 200 μg/m3. It is difficult to evaluate the O3 standards due to the lack of evidence in regard to the health effects of O3 in China. When compared to the large number of studies of PM2.5 health effects in China, there have been limited explorations of O3. There are only five such studies being reported for Mainland China. Moreover, because of the geographic diversity of the country, these studies are inconsistent in seasonal patterns and health outcomes [15,16,17,18]. Moreover, those studies were all performed in central and southern China, even though the Beijing region has one of the highest O3 concentrations in the entire country.
In the present study, we examined the acute effects of O3 on mortality in Miyun County, a suburban district of Beijing. Our purpose was to estimate the impacts of O3 on human mortality in northern China. To achieve this aim, we applied a time-stratified case-crossover design to explore the lag effects of O3 on cause-specific mortality while using a dataset from 2005–2013. We discuss the implications of seasonal modification on the effects of O3.

2. Materials and Methods
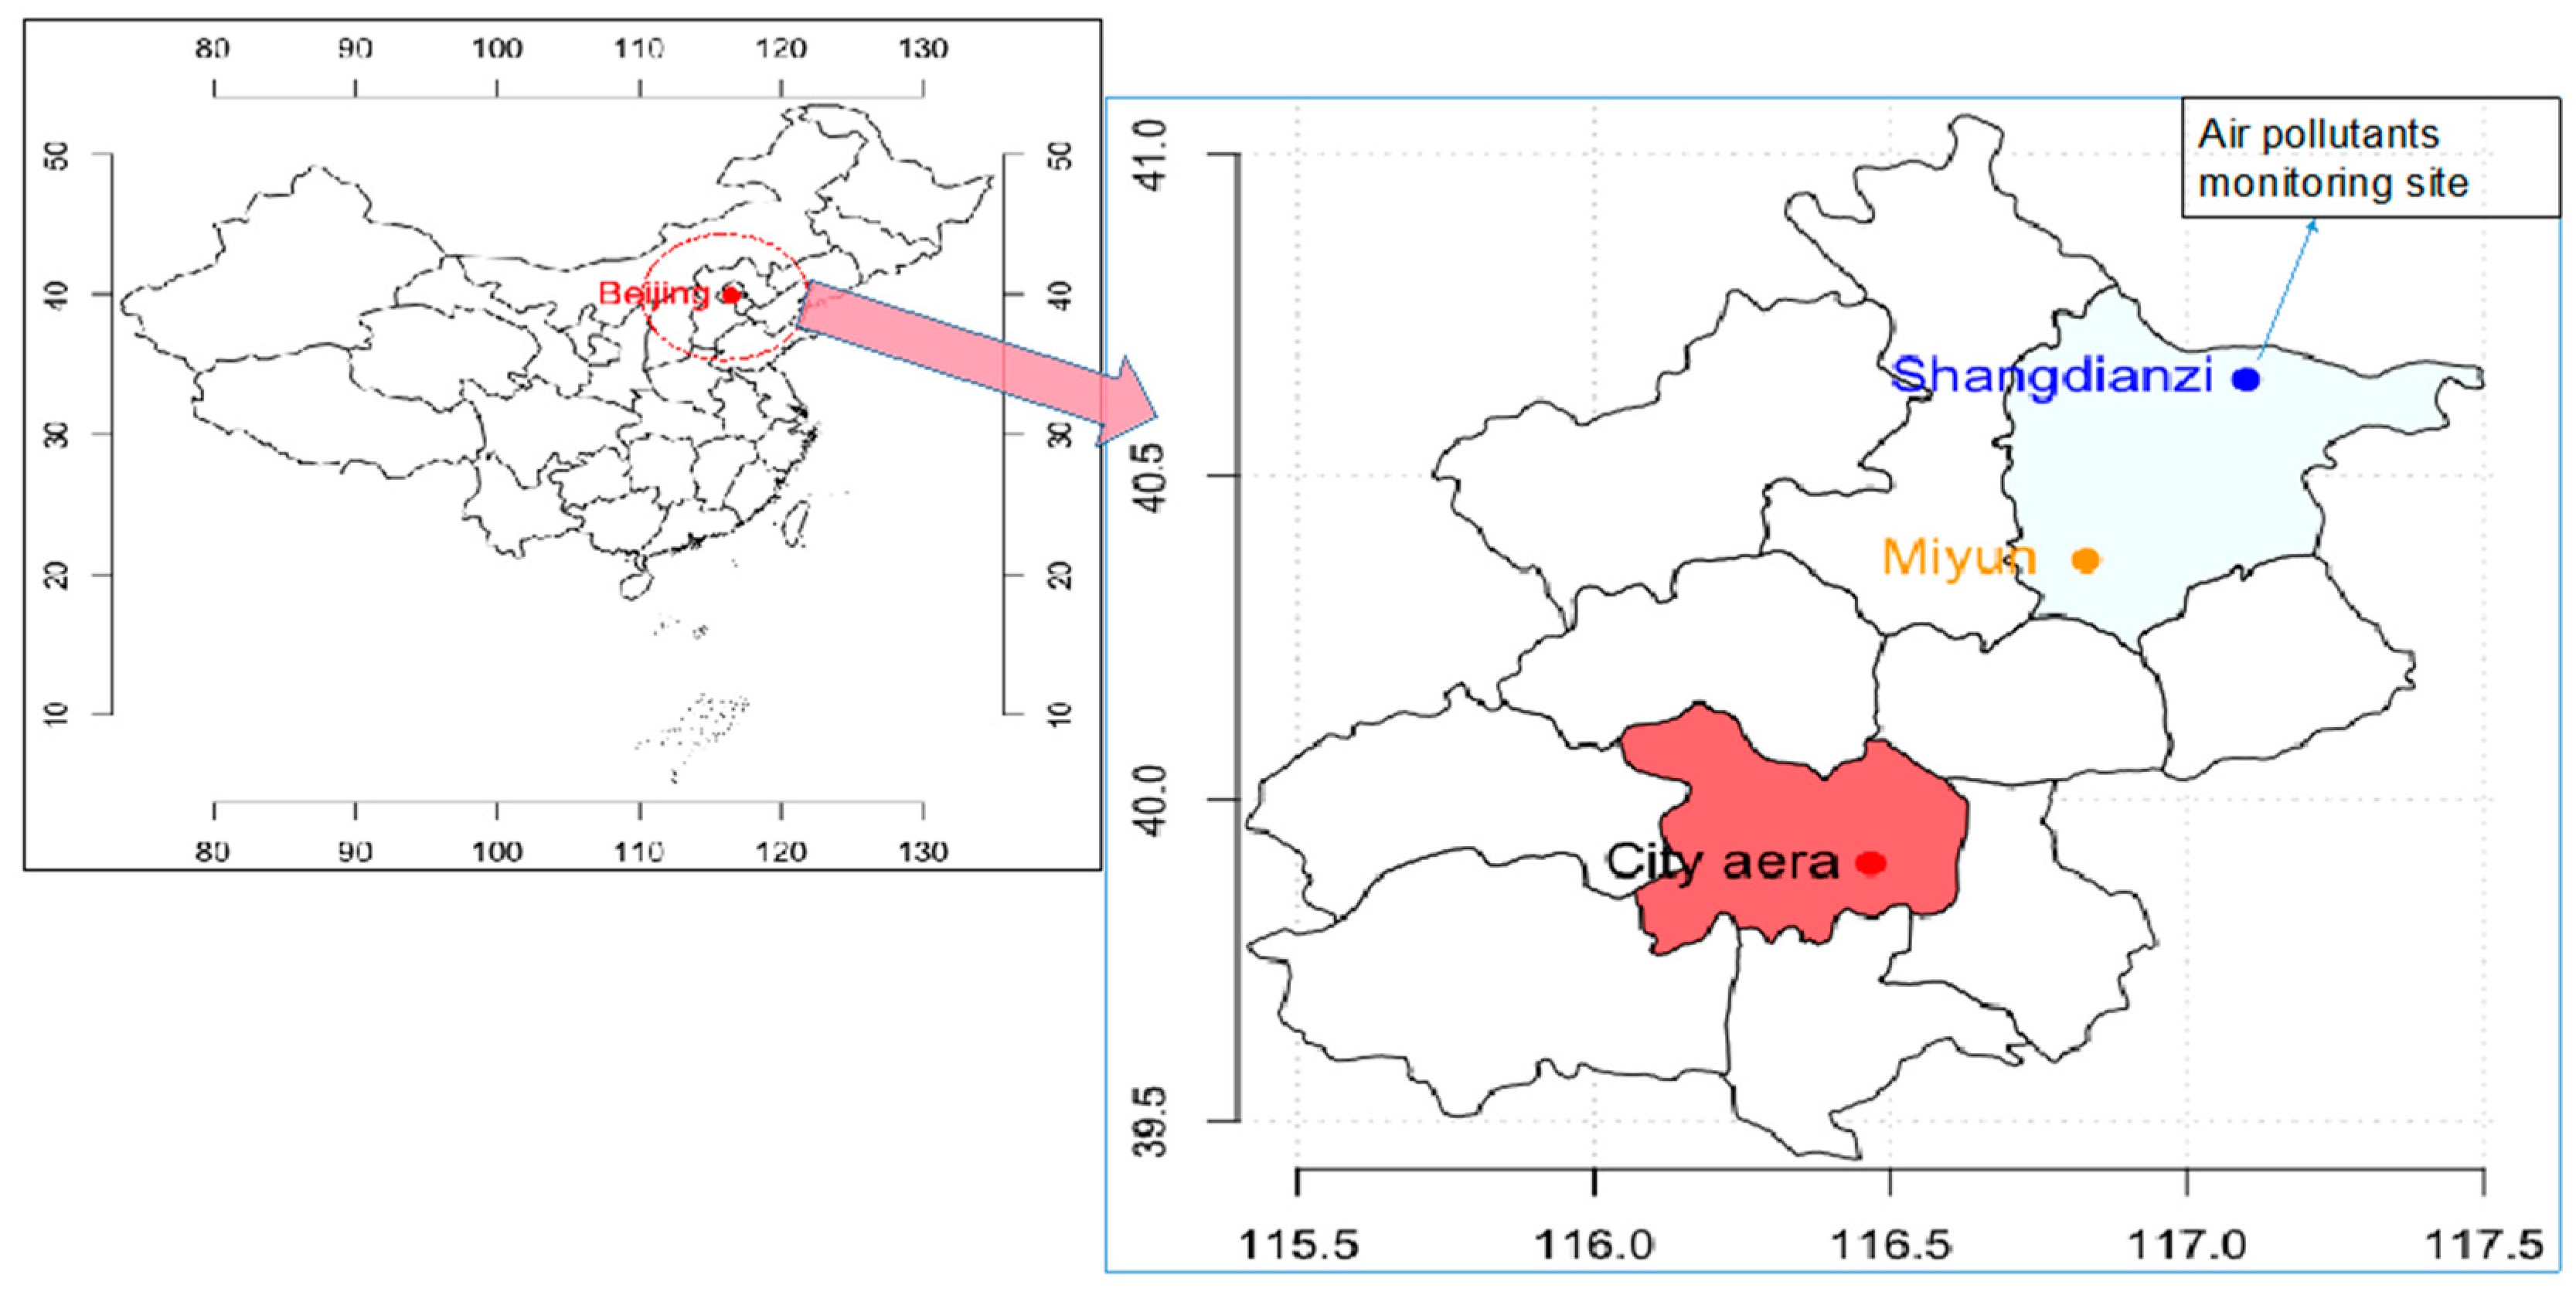
2.1. Study Area

Miyun County is located in the northeast of the Beijing urban area, about 30 km from the center of the city, and is regarded as a background area of Beijing. Air pollution and meteorological data were obtained from the Shangdianzi regional Global Atmosphere Watch (GAW) station (40.39° N, 117.07° E, 293.9 m a.s.l.). This station is located approximately 55 km northeast of the Beijing city area (Figure 1). More details regarding this station can be found elsewhere [19,20].

2.2. Data Collection

The datasets consisted of daily mortality records from 1 January 2005 to 31 December 2013. Mortality data were obtained from the Chinese Center for Disease Control and Prevention. We used three death counts, i.e., cardiovascular diseases (ICD-10 code: I00-I99), respiratory diseases (J00-J99), and all-cause mortality (A00-R99).
Daily PM2.5 and gaseous pollutants (SO2, NOx, and O3) were obtained from Shangdianzi station. Shangdianzi station (SDZ, 40°39′ N, 117°7′ E, 293.9 m a.s.l.), is one of the regional Global Atmosphere Watch (GAW) stations in China. The station is located in the northern part of the North China Plain and in the Miyun County of Beijing, approximately 100 km and 55 km northeast of the urban area and the Miyun Township of Beijing, respectively (Figure 1b). Only sparsely populated small villages, and thus insignificant anthropogenic emission sources, lie within 30 km of the site. The station’s instrument building is situated on the south slope of a hill surrounded by mountains in every direction, except the southwest. Due to the valley topography, the prevailing winds at SDZ are from the east-northeast and the west-southwest. Polluted air masses from urban areas and satellite towns of Beijing can therefore be easily transported to SDZ by southwesterly winds, while relatively clean air masses arrive from other wind directions.
Daily meteorological variables (mean and maximum temperature, relative humidity, pressure, wind speed, and direction) were recorded by China Meteorological Administration. From 1 January 2005 to 31 December 2013, 3287 days had data recorded. We used both 8-h maximum ground-level O3 and 8-h maximum moving average O3.

2.3. Statistical Methods

A time-stratified case-crossover design was used to investigate the associations between O3 and cause-specific mortality. In this design, “case” days when deaths occurred were compared with control days to assess the effects resulting from differences in exposure to O3. Control days were selected to be nearby to case days; in this way, only recent changes in exposure would be compared, and long-term or seasonal variation in exposure could be efficiently eliminated. Conditional logistic regression was used to calculate the odds ratio for cases as compared with controls for a unit increase in O3 exposure.
We split our time series data into equally-sized, non-overlapping strata and then used a 35-day stratum length with an exclusion period of three days. The exposure of the case day (index day) was compared with the exposure of the control days, which were matched on the same day of the week within the same stratum. Both single pollutant models and multivariate models (containing all pollutants and meteorological factors) were calculated; separate models were used for all natural cause, and cardiovascular mortality. We also controlled for day of the week (DOW), with Sunday as the reference day. The estimates for O3 were scaled to correspond to a 10 ppb increase.
As temperature may have larger effects on mortality than O3 and is highly correlated with O3, we controlled for temperature by selecting control days within a similar temperature range as the case day.
Odds ratios and 95% confidence intervals (95% CIs) were estimated. The lag structure was an unconstrained distributed lag of the same-day 8-h maximum average ground-level O3 concentration (lag 0) and ground-level ozone lag 0-3 days before the case- or control-day. To explore seasonal O3 effects on mortality, we divided the data into separate datasets for the warm season (May-October) and the cold season (November-April).
We considered p < 0.05 as significant in our statistical tests (all were two-sided). We used R software (version 3.4.3) [21] and the “season” package [22,23] to perform the analysis.

2.4. Sensitivity Analysis

We also replaced the 8-h maximum O3 concentration with the 8-h moving O3 concentration and tested different stratum lengths. The 8-h moving O3 concentration means the maximum value of the 8-h moving-average O3 concentration. At time T, 8-h moving O3 concentration means the mathematical mean value of hour T-7, T-6, T-5, T-4, T-3, T-2, T-1 and time T. Also, we tried different strata length in our model.

3. Results

Table 1 shows summary statistics for mortality data, air pollutants, and meteorological factors. The results show considerable variation in O3, temperature, relative humidity, and PM2.5, i.e., 2.10 to 200.60 μg/m3 for O3, −15.9 to 32.8 °C for daily mean temperature, 8.0% to 98.0% for relative humidity, and 3.63 to 250.13 μg/m3 for PM2.5. There were also ranges of 0.07-54.45 μg/m3 for SO2 and 0.70–90.51 μg/m3 for NOx. There were a total of 21,941 all-cause deaths, 1858 respiratory deaths, and 12,275 cardiovascular deaths during the study period.
Figure 2 shows the correlation matrix of air pollutants and temperature. The correlation coefficient between PM2.5 and O3 was 0.26, much smaller than 0.4, indicating that PM2.5 and O3 had a weak linear correlation; the two pollutants could be incorporated into a regression model without causing model instability. In addition, there was a strong correlation between temperature and O3. The correlation coefficient between NOx and O3 was −0.3, and that between SO2 and O3 was −0.19. Figure 3 presents boxplots for air pollutants during our study period. It could also be seen that the variation of temperature and O3 concentrations were relatively larger than those of PM2.5, NOx, and SO2 concentrations.

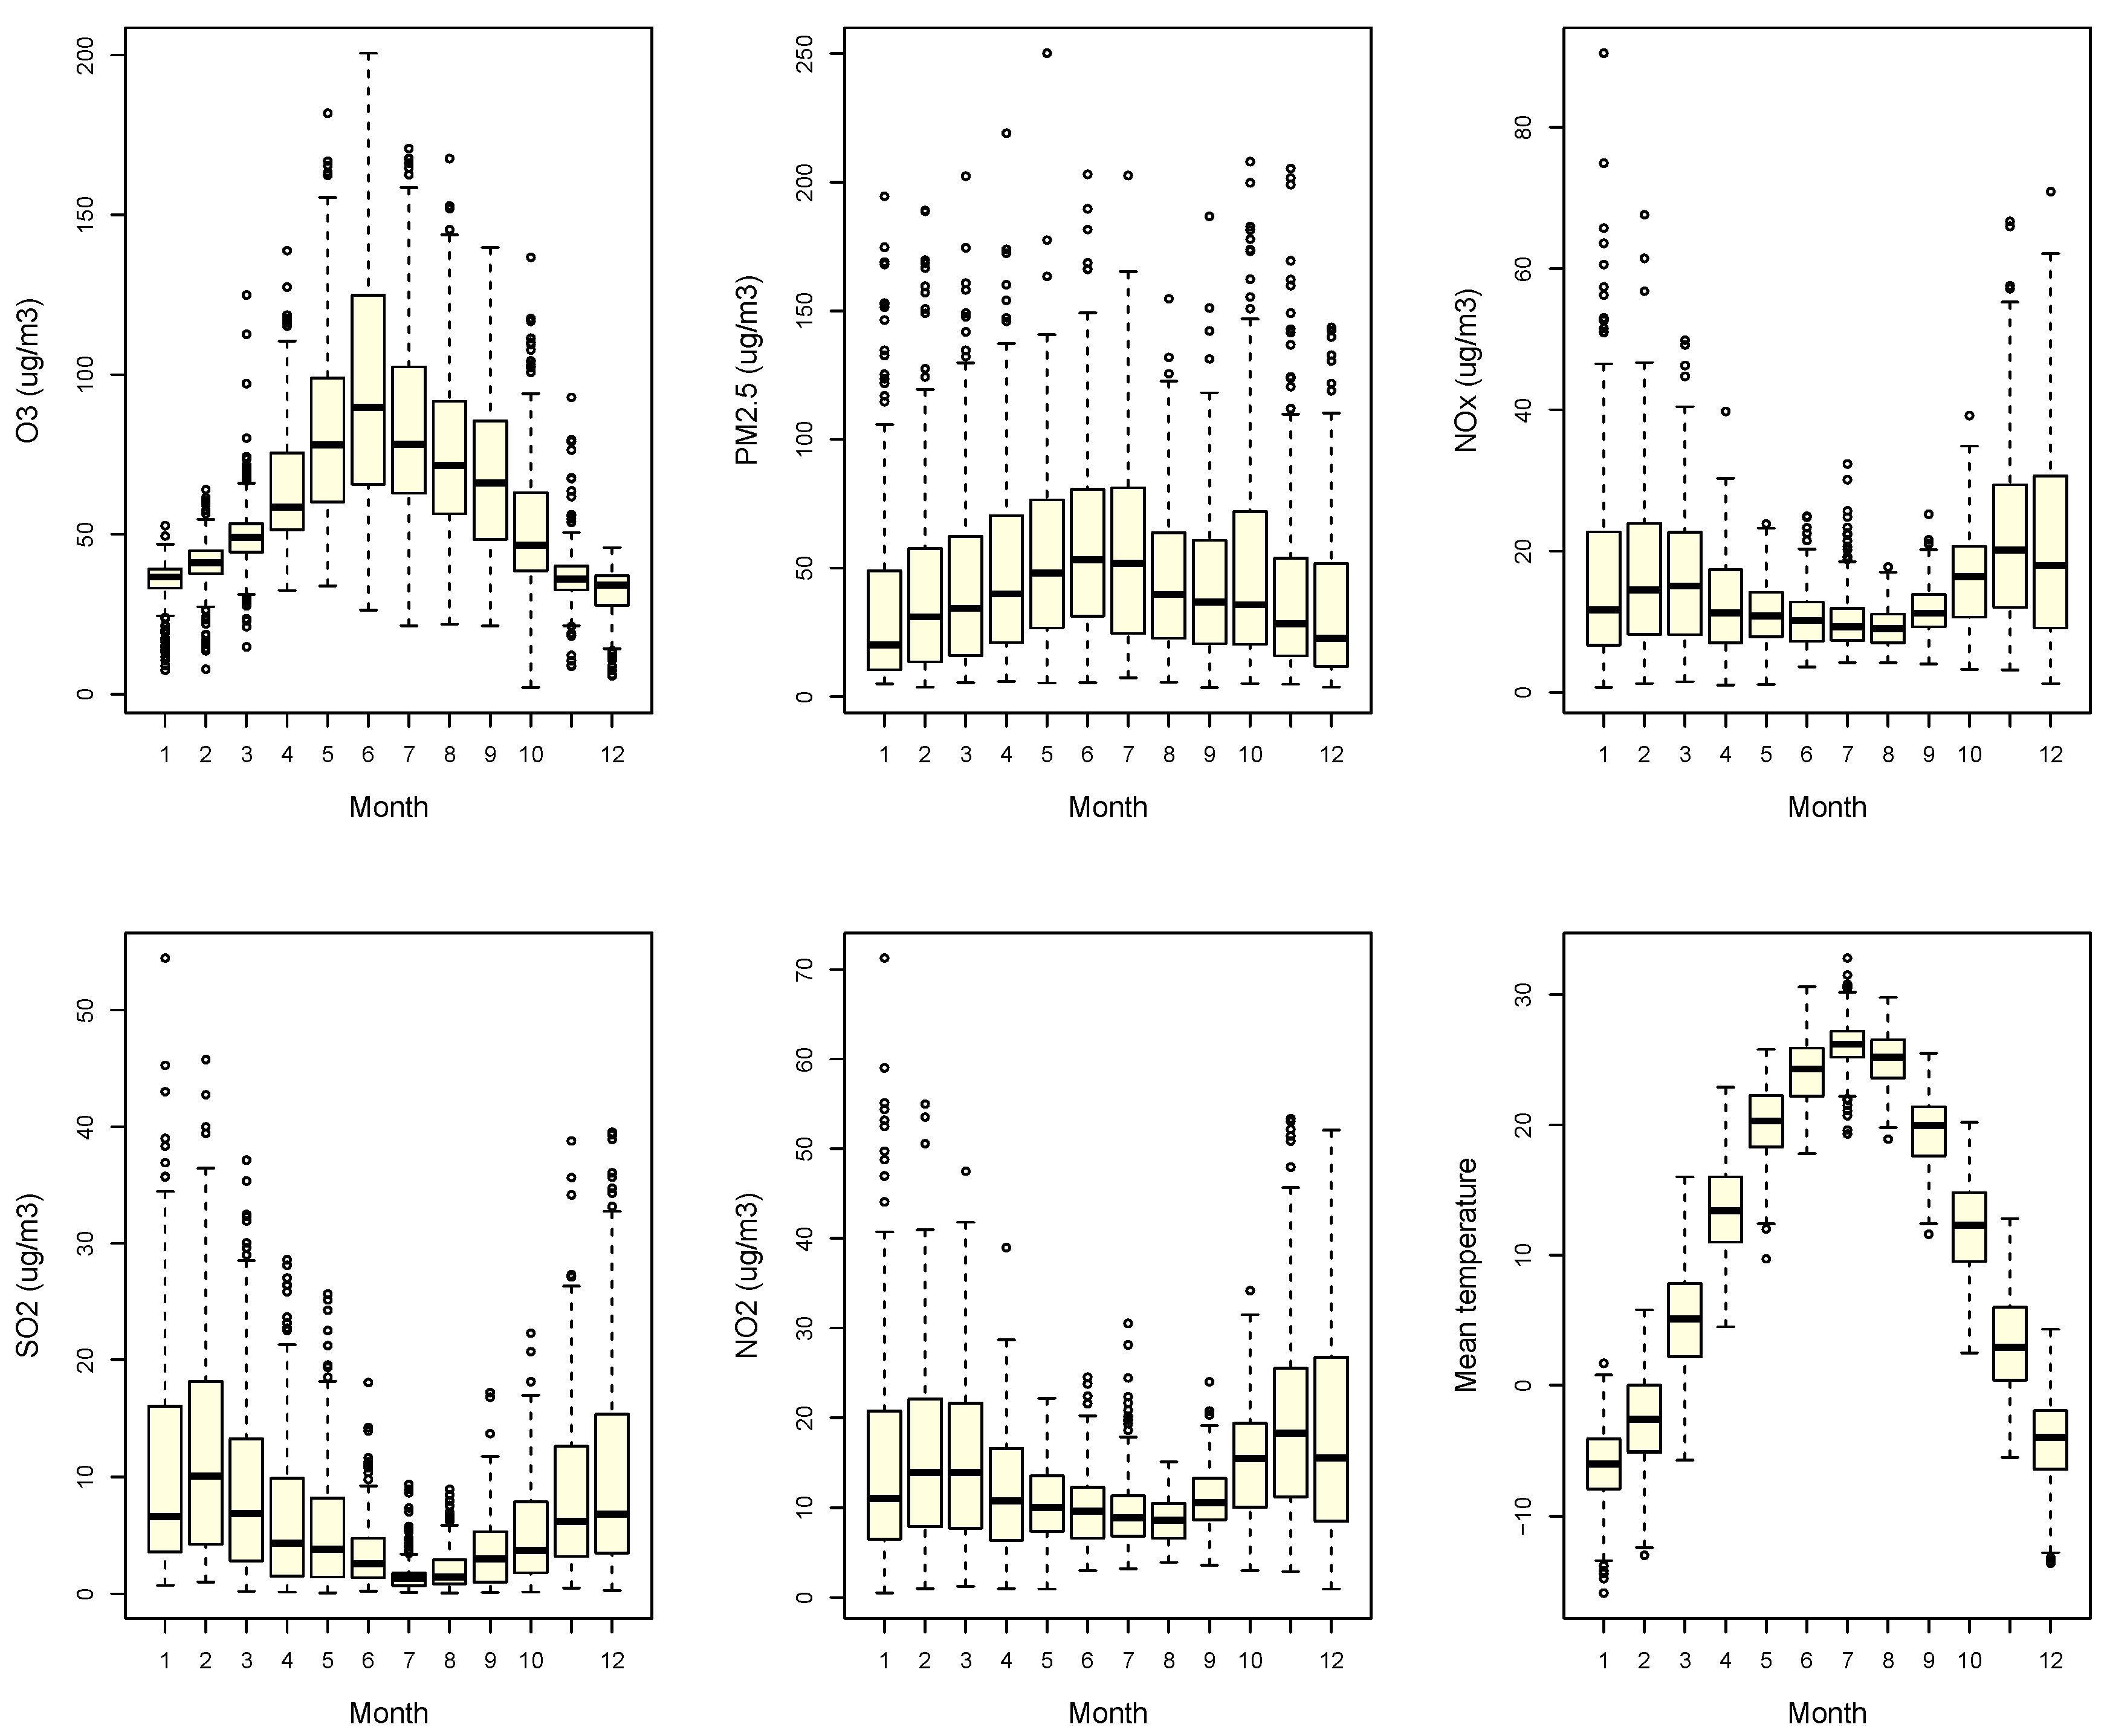
3.1. Seasonal Characteristics of Health Outcomes, Temperature and Air Pollutants

Figure 4 shows that PM2.5 concentration did not fluctuate much between the four seasons, but there were significant seasonal variations (p < 0.01) in O3, NOx, and SO2 concentrations. The highest concentration of O3 was in summer, followed by spring and fall. The NOx and SO2 patterns were opposite, highest in winter, followed by fall and spring.
In our study, the health outcomes also had seasonal patterns due to a complex array of causes, among which temperature, PM2.5, and O3 were the most important.

3.2. Time-Stratified Case-Crossover

Table 2 shows the lag structure of O3 effects on mortality throughout one year and during the warm season. A total of 3109 case-days and 53,285 control-days were included in the analysis. Significant (p < 0.05) associations between O3 and cause-specific mortalities on different lag days were observed, and odds ratios (ORs) increased with O3 concentration. Most of the estimates were statistically significant in both single-pollutant and multi-pollutants models, although there were differences between lag days. Estimated effects of O3 were moderately reduced but still significant after adjustment for PM2.5 and SO2 in two-pollutant models. This is probably because, in the atmosphere, O3 has a different formation path from those of PM2.5 and SO2 and thus does not typically covary with these pollutants. The weak correlations observed between O3 and these two pollutants indicate that the mortality effect of O3 exposure was at least partially independent. In addition, during the warm season, NO2 was an important confounder in the association between O3 and mortality.
In the single pollutant model (without adjusting for other pollutants) for all-cause mortality for a whole year, O3 had significant effects on the current day, lag 1 day and lag 2 day; with a 10-unit increase in ambient O3 concentration, the ORs were 1.021 (95% CI: 1.013–1.029), 1.010 (95% CI: 1.002–1.019), and 1.010 (95% CI: 1.001–1.018), respectively. As for cardiovascular mortality, in the single pollutant model, O3 had significant effects on the current day, lag 1 day, lag 2 day, and lag 3 day; with a 10-unit increase in ambient O3 concentration, the ORs were 1.017 (95% CI: 1.007–1.029) 1.013 (95% CI: 1.002–1.024), 1.011 (95% CI: 1.000–1.022), and 1.012 (95% CI: 1.001–1.023), respectively. There was no significant association observed between O3 and respiratory mortality in our study.
We included other pollutants in the two-pollutant models to estimate O3 effects. Pearson correlation coefficients between any two pollutants were all < 0.4. Table 2 shows that estimated effects of O3 were still significant with slight change after adjustment for PM2.5, NO2, and SO2 for all-cause mortality. However, for cardiovascular mortality, after adjusting for PM2.5, the effects for lag 1 day and lag 2 day became insignificant, while those for the current day and lag 2 day were still significant though slightly decreased. After adjusting for SO2, O3 effects for lag 1 day and lag 3 day became insignificant, while those effects for the current day and lag 2 day were still significant with only slight changes. After adjusting for NO2, the associations for different lags became insignificant.
Table 2 also shows all of the significant (p < 0.05) effects of O3 on health outcomes during the warm season for both single O3 models and in the multiple-pollutants model matched for temperature. After matching for temperature to within one degree, we observed significant associations between O3 and mortality, and the magnitude of the ORs during the warm season were larger than those for year-round estimates.
The associations between O3 and all-cause mortality for every 10-ppb increase in the 8–h maximum O3 concentrations were on the current day (OR 1.031, 95% CI 1.005–1.045), lag 1 day (OR 1.028, 95% CI 1.006–1.046), lag 2 day (OR 1.028, 95% CI 1.001–1.041), and lag 3 day (OR 1.025, 95% CI 0.995–1.035). After being adjusted for PM2.5, the effects on the current day (OR 1.016, 95% CI 0.999–1.033) and lag 3 day (OR 1.026, 95% CI 1.008–1.044) were still significant. After being adjusted for SO2, the effects on current day (OR 1.090, 95% CI 1.037–1.146) and lag 3 day (OR 1.043, 95% CI 0.992–1.106) were still significant. After being adjusted for SO2, the effects on the current day (OR 1.090, 95% CI 1.037–1.146) and lag 3 day (OR 1.043, 95% CI 0.992–1.099) were still significant. After being adjusted for NO2, all of the associations became insignificant.
The associations between O3 and cardiovascular mortality for every 10-ppb increase in the 8-h maximum O3 concentrations were on the current day (OR 1.024, 95% CI 1.005–1.045), lag 1 day (OR 1.025, 95% CI 1.006–1.046), lag 2 day (OR 1.020, 95% CI 1.001–1.041), and lag 3 day (OR 1.020, 95% CI 1.002–1.043). After being adjusted for PM2.5, the effects on the current day (OR 1.021, 95% CI 1.003–1.053), lag 1 day (OR 1.030, 95% CI 1.003–1.059), and lag 3 day (OR 1.044, 95% CI 1.015–1.075) were still significant. After being adjusted for SO2, the effects on the current day (OR 1.078, 95% CI 1.012–1.150) and lag 3 day (OR 1.076, 95% CI 1.010–1.148) were still significant. After being adjusted for NO2, all of the associations became insignificant.

3.3. Sensitivity Analysis

We replaced 8-h maximum O3 concentration with the 8-h moving average maximum O3 concentration in all of the models and replaced daily mean temperature with daily maximum temperature and repeated the analysis. The results did not change significantly. We found that the model was robust to changes in stratum length.

4. Discussion

We found significant associations between cause-specific mortalities and ambient O3 concentration increases. When O3 concentration increased, the ORs of all-cause and cardiovascular mortality increased. For both mortalities, the estimated effects of O3 were robust with adjustment for other pollutants (PM2.5, NO2, and SO2), while that for respiratory mortality was not, and this is consistent with previous reports [24]. Larger estimates of O3 appeared during the warm season for both all-cause and cardiovascular mortality. For year-round effects, the ORs with 10-unit increases of O3 concentration for all-cause mortality were in the range of 1.009–1.020 for different lag days before controlling for other pollutants; the range changed to 1.009–1.025 after those controls. The ORs with 10-unit increases in O3 concentration for cardiovascular mortality were in the range of 1.011–1.017 for different lag days before controlling for other pollutants; the range changed to 1.010–1.017 after those controls.
During the warm season, the ORs with 10-unit increases in O3 concentration for all-cause mortality were in the range of 1.025–1.031 for different lag days before controlling for other pollutants; the range changed to 1.016–1.090 after those controls. The ORs with 10-unit increases of O3 concentration in cardiovascular mortality were in the range of 1.020–1.024 for different lag days before controlling for other pollutants; the range changed to 1.021–1.078 after those controls.
Positive ORs estimates for O3 in all-cause and cardiovascular mortalities became slightly larger when NO2 or SO2 were included in the model (Table 2). The reason may be that O3 and NO2 or SO2 are negatively correlated in the atmosphere. This negative correlation had an enhancement effect in the two-pollutant model.
We obtained larger estimates for lag 3 day exposure as compared with those of the current day for both all-cause mortality and cardiovascular mortality during the warm season (Table 2) while controlling for PM2.5. These observations are consistent with those from other cities (Shanghai, another metropolitan city in east China) [15] in China. The larger ORs estimated for lag 3 day suggest the accumulation of both acute and less acute health effects over longer periods. The reason why O3 could affect the cardiovascular system might be that exposure to O3 can induce inflammatory responses. As in vivo and in vitro experiments have demonstrated, O3 may mediate a pulmonary inflammatory response; inflammation may subsequently activate hemostatic pathways, impairing vascular function and accelerating atherosclerosis. As cardiovascular mortality accounted for more than 60% of all-cause mortality, a similar result was observed in the estimates of O3 on all-cause mortality.
The magnitude of O3 estimated effect was much higher than those reported in the USA or Europe. According to a multisite time-series study in the USA, the pooled estimate for 95 urban communities was a 20 μg/m3 increase of O3 associated with approximately a 0.45–0.60% increase in mortality [12,25]. The concentrations of O3 in Miyun County (annual mean 52–65 μg/m3 and seasonal mean 35–85 μg/m3) were much higher than those in North American cities (14–38 μg/m3) [26]. In our smoothed plots of O3 concentration against mortality risk, we observed a steeper slope in the high O3 concentration range (Supplementary Material, Figure S1). It is worth investigating whether there is any association between long-term O3 exposure and the acute effects of O3.
Although much higher than those reported in the USA and Europe, the magnitude of estimated O3 effect in our study was similar to those of other cities in China [18,27,28]. In four cities in the Pearl River Delta (Guangdong Province, southern China), the strongest effect was on respiratory mortality, and the RR was 1.46~2.61% with a 10 μg/m3 increase in O3 concentration. In Hong Kong [29], Shanghai [15], and Jiangsu Province [30], the estimated effects (RR) for cardiovascular mortality were 1.31~1.75%. In Wuhan [31], the RR range was 1.03~1.64%. In Zhengzhou [32], the RR range was 1.28~1.79%.
Although the magnitudes of the estimated effects were similar, seasonal patterns were very different between our study and others in China. In our study, the most significant association was observed during the warm season, whereas in the other investigations [30,32], in cities of central-eastern (Zhengzhou, Wuhan, and Yangtze River Delta) and southern (Pearl River Delta and Hong Kong) China, there were significant associations between ambient O3 and mortality in the cold season. In the latter studies, after adjusting for PM10, the estimated effects of O3 on total and cardiovascular mortality increased from September through November, while those for respiratory mortality were only significant from January to August and in December.
The above differences might originate from geographic disparities. When compared to central or southern China, Beijing is a northern city with four distinct seasons as illustrated in Figure 4. Due to those seasons, air pollution in Beijing has a very distinct seasonal pattern. A major impact of seasons is peoples’ exposure patterns to O3. In southern China, it is cooler and drier in the “cold” season compared to the “warm” season (higher temperatures and humidity), so people are more likely to open windows or stay outside, increasing their frequency of exposure to O3. In the warm season, people are more likely to close windows and use air conditioners. In Beijing, because of lower O3 concentrations and lower temperatures in late fall and winter (with heating from 15 November to 15 March), people are exposed to very low levels of O3. Moreover, although some significant associations appeared in the single-pollutant O3 model, they became insignificant after adjusting for PM2.5. Due to the heating supply, a much higher concentration of PM2.5 appeared in the cold season; this may “cover” the effects of O3. The seasonal pattern in our study is similar to those of northern cities in the USA and Europe [33].
As noted above, we did not observe positive associations between O3 and respiratory mortality. The first potential reason is the climate. Jerrett et al. [13] stated in their large cohort study across the USA that it was quite possible that no positive association between O3 and respiratory mortality would be found in cool areas (cool in this case meaning a long period of average daily maximum temperature < 25.4 °C). Given Miyun’s cooler climate (yearly mean maximum temperature 17–19 °C) relative to most of the USA, this might be one reason why we found no association between O3 and respiratory mortality.
One strength of the present study is that we chose a rural district of Beijing as the study area. Beijing is one of the three highest O3 pollution areas (the other two being the Yangtze and Pearl River deltas) in China, but we are unaware of any study regarding O3 and health effects in Beijing. It is important to compare the results from various geographic regions in China for policymaking. Moreover, most health effect studies of O3 have been conducted in urban areas, and very limited work has been done in suburban and rural areas. As O3 and PM2.5 are the two air pollutants that have the most significant associations with health effects, and people are often exposed to these two pollutants simultaneously, it is important to evaluate a relatively independent effect of O3 on mortality. A rural district as a study object would be a good choice. The O3 concentration in the Beijing city area was much lower than that in Miyun County, opposite to the PM2.5 concentration. From 2005–2013, the mean concentration of O3 in Miyun was 36.0 μg/m3, about 1.59 times higher than that in the city area (22.6 μg/m3), whereas the mean concentration of PM2.5 in Miyun was 44.0 μg/m3, only 60% of that in the city area (73.4 μg/m3). Since people that were exposed to high concentrations of PM2.5 may be more vulnerable to O3 pollution, an area with relatively high O3 and low PM2.5 would be a good choice for exploring the health effects of ozone.
The second advantage is that Miyun County has a cooler summer compared to the city area. The annual daily mean temperature in Miyun was ~1 °C lower than that in the Beijing city area. Moreover, there were only 57 high-temperature (>35 °C) days during 2005–2013 in Miyun, but 102 days in the Beijing city area. Also, there were 626 days with maximum temperature >30 °C in Miyun summers, and 702 d in the Beijing city area. A cooler summer and less developed economy suggest less air conditioner use and more open windows, increasing exposure to ambient O3. In our study, we found that the most significant association between O3 and health outcomes was in summer. Almost all of the RRs in that season were significantly higher than those in the entire year or other seasons for both all-cause and cardiovascular mortalities. Since summer in Miyun has the least toxic PM2.5 and maximum O3 concentration, the effects on mortality may be the least confounded.
The third strength of our study is our design for controlling for temperature in the model. As O3 correlates to sunlight, the most important confounder is temperature. It is well known that temperature plays an important role in the association between O3 and mortality. In our study, the seasonal pattern in mortality was the reverse of that in O3: it was the lowest in summer when the highest concentration of O3 appeared. This suggested that higher concentrations of O3 were associated with lower mortality risks; this illustrated how temperature confounded the association between O3 and mortality: higher temperature is associated with lower death risk. It is obvious that temperature had different effects among seasons; the most significant effects appeared in summer and winter with different lag days.
In our study, although stratification was designed to control for the collinearity between O3 and temperature, within the strata there still might be a significant correlation between temperature and O3 in a city with distinct seasons such as Beijing. In order to control more rigidly for the effects of temperature, we selected control days within a similar temperature range as the case days. An advantage of matching using a confounder is that the shape of the association between the confounder and the dependent variable is not important. This means that the association can take any shape (including non-linear forms), and the estimates would be robust.
One limitation of our study is that compared to the Beijing city area, there is a smaller resident population in Miyun County (470 thousand compared to nine million), and the number of respiratory deaths was relatively small. This small number limited our ability to detect a weak pollution association. Another limitation should be noted in interpreting the results of our study. The exposure data were obtained from only one air pollution monitoring station, and the pollutant measurements may differ from individual exposure levels. Therefore, further investigation is needed to explore this issue. In this case, several factors might be taken into account, such as the correlation between individual exposure or average population exposure and monitoring data. Therefore, the used O3 exposure concentration should be most closely related to the individual exposure level when analyzing the health effects of ambient O3 exposure.
A third limitation was that we did not include other confounders, such as socio-economic position or individual behavior, which could also influence the health effects of ozone. This was due to data limitation.

5. Conclusions

We used a time-stratified case-crossover model to account for the effects of O3 on human health, and the analysis provided lag-specific estimates. We conclude that O3 had major impacts on cause-specific mortalities in Beijing during the warm season. Our results suggest the need for further investigation of the pathophysiological mechanism of O3-associated cardiovascular impact in the northern city. Our work strengthens the evidence for the adverse impact of O3 on human health, and our data should be helpful in disease prevention and policy development. Also, our findings fill a knowledge gap that has hitherto existed in studies regarding the health impacts of O3. The results will strengthen the rationale for O3 control in China.

Supplementary Materials

The following are available online at https://0-www-mdpi-com.brum.beds.ac.uk/1660-4601/15/11/2460/s1, Figure S1: Smoothed plots of relative risk against ozone concentration.

Author Contributions

Y.L. analyzing data and writing this manuscript; Y.S. helping to construct the case-crossover model; C.Z. interpretation the health outcome data; Z.M. interpretation the observing data and substantively revised this manuscript.

Funding

This study was supported by the National Key Research and Development Program of China (No. 2016YFA0602004) and the National Natural Science Foundation of China (No. 41475135).

Conflicts of Interest

The authors declare no conflict of interest.

References

  1. Bell, M.L.; Dominici, F.; Samet, J.M. A meta-analysis of time-series studies of ozone and mortality with comparison to the national morbidity, mortality, and air pollution study. Epidemiology 2005, 16, 436–445. [Google Scholar] [CrossRef] [PubMed]
  2. Franklin, M.; Zeka, A.; Schwartz, J. Association between PM2.5 and all-cause and specific-cause mortality in 27 US communities. J. Expo. Sci. Environ. 2007, 17, 279–287. [Google Scholar] [CrossRef] [PubMed]
  3. Ministry of Environmental Protection of the People’s Republic of China. China Environment Bulletin; Ministry of Environmental Protection of the People’s Republic of China: Beijing, China, 2016.
  4. Ministry of Environmental Protection of the People’s Republic of China. China Environment Bulletin; Ministry of Environmental Protection of the People’s Republic of China: Beijing, China, 2015.
  5. Ministry of Environmental Protection of the People’s Republic of China. China Environment Bulletin; Ministry of Environmental Protection of the People’s Republic of China: Beijing, China, 2014.
  6. Ministry of Environmental Protection of the People’s Republic of China. China Environment Bulletin; Ministry of Environmental Protection of the People’s Republic of China: Beijing, China, 2013.
  7. Ministry of Environmental Protection of the People’s Republic of China. China Environment Bulletin; Ministry of Environmental Protection of the People’s Republic of China: Beijing, China, 2012.
  8. Ministry of Environmental Protection of the People’s Republic of China. China Environment Bulletin; Ministry of Environmental Protection of the People’s Republic of China: Beijing, China, 2011.
  9. Ministry of Environmental Protection of the People’s Republic of China. China Environment Bulletin; Ministry of Environmental Protection of the People’s Republic of China: Beijing, China, 2010.
  10. Zhao, H.; Wang, S.S.; Wang, W.X.; Liu, R.; Zhou, B. Investigation of Ground-Level Ozone and High-Pollution Episodes in a Megacity of Eastern China. PLoS ONE 2015, 10, e0131878. [Google Scholar] [CrossRef] [PubMed]
  11. Hao, Y.P.; Balluz, L.; Strosnider, H.; Wen, X.J.; Li, C.Y.; Qualters, J.R. Ozone, Fine Particulate Matter, and Chronic Lower Respiratory Disease Mortality in the United States. Am. J. Respir. Crit. Care Med. 2015, 192, 337–341. [Google Scholar] [CrossRef] [PubMed]
  12. Bell, M.L.; McDermott, A.; Zeger, S.L.; Samet, J.M.; Dominici, F. Ozone and short-term mortality in 95 US urban communities, 1987–2000. JAMA 2004, 292, 2372–2378. [Google Scholar] [CrossRef] [PubMed]
  13. Jerrett, M.; Burnett, R.T.; Pope, C.A.; Ito, K.; Thurston, G.; Krewski, D.; Shi, Y.L.; Calle, E.; Thun, M. Long-Term Ozone Exposure and Mortality. N. Engl. J. Med. 2009, 360, 1085–1095. [Google Scholar] [CrossRef] [PubMed] [Green Version]
  14. World Health Organization (WHO). Air Quality Guidelines Global Update 2005: Particulate Matter, O3, Nitrogen Dioxide and Sulfur Dioxide. Available online: http://apps.who.int/iris/handle/10665/107823 (accessed on 2 July 2018).
  15. Zhang, Y.H.; Huang, W.; London, S.J.; Song, G.X.; Chen, G.H.; Jiang, L.L.; Zhao, N.Q.; Chen, B.H.; Kan, H.D. Ozone and daily mortality in Shanghai, China. Environ. Health Perspect. 2006, 114, 1227–1232. [Google Scholar] [CrossRef] [PubMed]
  16. Yang, C.X.; Yang, H.B.; Guo, S.; Wang, Z.S.; Xu, X.H.; Duan, X.L.; Kan, H.D. Alternative ozone metrics and daily mortality in Suzhou: The China Air Pollution and Health Effects Study (CAPES). Sci. Total Environ. 2012, 426, 83–89. [Google Scholar] [CrossRef] [PubMed]
  17. Wong, C.M.; Vichit-Vadakan, N.; Kan, H.D.; Qian, Z.M.; Teams, P.P. Public Health and Air Pollution in Asia (PAPA): A multicity study of short-term effects of air pollution on mortality. Environ. Health Perspect. 2008, 116, 1195–1202. [Google Scholar] [CrossRef] [PubMed] [Green Version]
  18. Tao, Y.B.; Huang, W.; Huang, X.L.; Zhong, L.J.; Lu, S.E.; Li, Y.; Dai, L.Z.; Zhang, Y.H.; Zhul, T. Estimated Acute Effects of Ambient Ozone and Nitrogen Dioxide on Mortality in the Pearl River Delta of Southern China. Environ. Health Perspect. 2012, 120, 393–398. [Google Scholar] [CrossRef] [PubMed] [Green Version]
  19. Lin, W.; Xu, X.; Zhang, X.; Tang, J. Contributions of pollutants from north china plain to surface ozone at the shangdianzi GAW station. Atmos. Chem. Phys. 2008, 8, 5889–5898. [Google Scholar] [CrossRef]
  20. Zhang, Z.; Zhang, X.; Gong, D.; Quan, W.; Zhao, X.; Ma, Z.; Kim, S. Evolution of surface O3 and PM2.5 concentrations and their relationships with meteorological conditions over the last decade in Beijing. Atmos. Environ. 2015, 108, 67–75. [Google Scholar] [CrossRef]
  21. R Development Core Team. 2015. Available online: http://www.R-project.org/ (accessed on 2 July 2018).
  22. Barnett, A.G.; Baker, P.; Dobson, A.J. Analysing Seasonal Data. Available online: https://journal.r-project.org/archive/2012/RJ-2012-001/RJ-2012-001.pdf (accessed on 30 June 2012).
  23. Barnett, A.G.; Dobson, A.J. Analysing Seasonal Health Data; Springer: Berlin, Germany, 2010. [Google Scholar]
  24. Bell, M.L.; Kim, J.Y.; Dominici, F. Potential confounding of particulate matter on the short-term association between ozone and mortality in multisite time-series studies. Environ. Health Perspect. 2007, 115, 1591–1595. [Google Scholar] [CrossRef] [PubMed]
  25. Jhun, I.; Fann, N.; Zanobetti, A.; Hubbell, B. Effect modification of ozone-related mortality risks by temperature in 97 US cities. Environ. Int. 2014, 73, 128–134. [Google Scholar] [CrossRef] [PubMed]
  26. Katsouyanni, K. APHEA project: Air pollution and health: A European approach. Epidemiology 2006, 17, S19. [Google Scholar] [CrossRef]
  27. Yan, M.L.; Liu, Z.R.; Liu, X.T.; Duan, H.Y.; Li, T.T. Meta-analysis of the Chinese studies of the association between ambient ozone and mortality. Chemosphere 2013, 93, 899–905. [Google Scholar] [CrossRef] [PubMed]
  28. Wang, T.; Xue, L.K.; Brimblecombe, P.; Lam, Y.F.; Li, L.; Zhang, L. Ozone pollution in China: A review of concentrations, meteorological influences, chemical precursors, and effects. Sci. Total Environ. 2017, 575, 1582–1596. [Google Scholar] [CrossRef] [PubMed]
  29. Wang, X.K.; Lu, W.Z.; Wang, W.J.; Leung, A.Y.T. A study of ozone variation trend within area of affecting human health in Hong Kong. Chemosphere 2003, 52, 1405–1410. [Google Scholar] [CrossRef]
  30. Chen, K.; Zhou, L.; Chen, X.D.; Bi, J.; Kinney, P.L. Acute effect of ozone exposure on daily mortality in seven cities of Jiangsu Province, China: No clear evidence for threshold. Environ. Res. 2017, 155, 235–241. [Google Scholar] [CrossRef] [PubMed] [Green Version]
  31. Qian, Z.; He, Q.C.; Lin, H.M.; Kong, L.L.; Liao, D.; Yang, N.N.; Bentley, C.M.; Xu, S.Q. Short-term effects of gaseous pollutants on cause-specific mortality in Wuhan, China. J. Air Waste Manag. 2007, 57, 785–793. [Google Scholar] [CrossRef]
  32. Qin, L.J.; Gu, J.Q.; Liang, S.J.; Fang, F.; Bai, W.M.; Liu, X.; Zhao, T.; Walline, J.; Zhang, S.L.; Cui, Y.J.; et al. Seasonal association between ambient ozone and mortality in Zhengzhou, China. Int. J. Biometeorol. 2017, 61, 1003–1010. [Google Scholar] [CrossRef] [PubMed]
  33. Ito, K.; De Leon, S.F.; Lippmann, M. Associations between ozone and daily mortality—Analysis and meta-analysis. Epidemiology 2005, 16, 446–457. [Google Scholar] [CrossRef] [PubMed]
Figure 1. Study area. Red indicates Beijing city districts; light blue indicates Miyun County.
Ijerph 15 02460 g001
Figure 2. Correlation matrix of pollutants and meteorological factors
Ijerph 15 02460 g002
Figure 3. Box plots of air pollutants during the study period.
Ijerph 15 02460 g003
Figure 4. Monthly O3, NOx, NO2, mean temperature, SO2, and PM2.5 concentration.
Ijerph 15 02460 g004
Table 1. Summary of health outcomes, pollutants, and meteorological factors.
Min25%MedianMean75%Max
All-cause mortality1567921
Cardiovascular mortality1244515
Respiratory mortality111127
PM2.53.6318.6136.8947.7066.48250.13
O3(8 h maximum concentration)2.1038.1050.5059.9574.85200.60
Maximum temperature−9.207.2020.1518.0028.5040.80
Mean temperature−15.900.2012.9011.3722.4532.80
Relative humidity8.0043.0060.0058.6874.0098.00
SO20.071.623.906.728.9154.45
NO0.020.360.611.161.1519.23
NO20.517.5411.1013.4817.1771.28
NOx0.708.0411.7514.6418.4190.51
Table 2. Odds ratios for daily cause-specific mortality for a 10 μg/m3 increase in air pollutants.
All-Cause MortalityCardiovascular Mortality
Whole YearWarm SeasonWhole YearWarm Season
single O3lag01.020 (1.013,1.029) **1.031(1.005,1.045) **1.017 (1.007,1.029) **1.024 (1.005,1.045) *
lag11.010 (1.002,1.019) **1.028 (1.006,1.046) **1.013 (1.002,1.024) *1.025 (1.007,1.045) *
lag21.009 (1.001,1.018) *1.028 (1.001,1.041) **1.011 (1,1.022) *1.020 (1.002,1.043) *
lag31.006 (0.999,1.015)1.025 (0.995,1.035) **1.011 (1.001,1.023) *1.015 (0.995,1.035)
lag41.001 (0.993,1.01)1.006 (0.979,1.019)0.997 (0.986,1.008)0.999 (0.979,1.019)
adjusted for PM2.5lag01.025 (1.016,1.034) *1.016 (0.999,1.033) *1.012 (1,1.025) *1.021 (1.003,1.053) *
lag11.018(1.009,1.028) **1.007 (0.989,1.024)1.008 (0.996,1.021)1.030 (1.003,1.059) *
lag21.013 (1.004,1.023) **1.013 (0.996,1.03)1.010 (0.998,1.023) *1.019 (0.992,1.048)
lag31.009 (1,1.019) *1.026 (1.008,1.044) **1.015 (1.003,1.028) *1.044 (1.015,1.075) **
lag41.000 (0.992,1.01)1.007 (0.989,1.024)0.995 (0.983,1.008)1.001 (0.973,1.03)
adjusted for SO2lag01.017 (1.009,1.026) **1.090 (1.037,1.146) **1.017 (1.006,1.029) **1.078 (1.012,1.15) *
lag11.009 (1.001,1.018) *1.033 (0.982,1.087)1.010 (0.999,1.022) *1.028 (0.965,1.095)
lag21.008 (1,1.017) *1.032 (0.981,1.086)1.016 (1.004,1.028) *1.076 (1.01,1.148) *
lag31.003 (0.995,1.012)1.043 (0.992,1.099) *1.010 (0.999,1.022) *1.000 (0.94,1.063)
lag40.998 (0.99,1.007)1.050 (0.998,1.106)0.997 (0.986,1.009)0.989 (0.926,1.057)
adjusted for NO2lag01.021 (1.013,1.03) **1.01 (0.939,1.087)1.014 (1.003,1.026) *1.037 (0.965,1.116)
lag11.014 (1.006,1.023) **0.962 (0.895,1.035)1.010 (0.999,1.022) *0.999 (0.93,1.075)
lag21.015 (1.007,1.024) **1.01 (0.936,1.091)1.012 (1.001,1.024) *0.933 (0.865,1.008)
lag31.007 (0.999,1.016)0.991 (0.921,1.066)1.006 (0.995,1.018)0.955 (0.888,1.028)
lag41.001 (0.993,1.01)1.033 (0.964,1.108)0.996 (0.985,1.008)0.987 (0.921,1.059)
Note: *: p < 0.05, **: p < 0.01.

