Occurrence and Ecological and Human Health Risk Assessment of Polycyclic Aromatic Hydrocarbons in Soils from Wuhan, Central China


Abstract
:1. Introduction
2. Materials and Methods
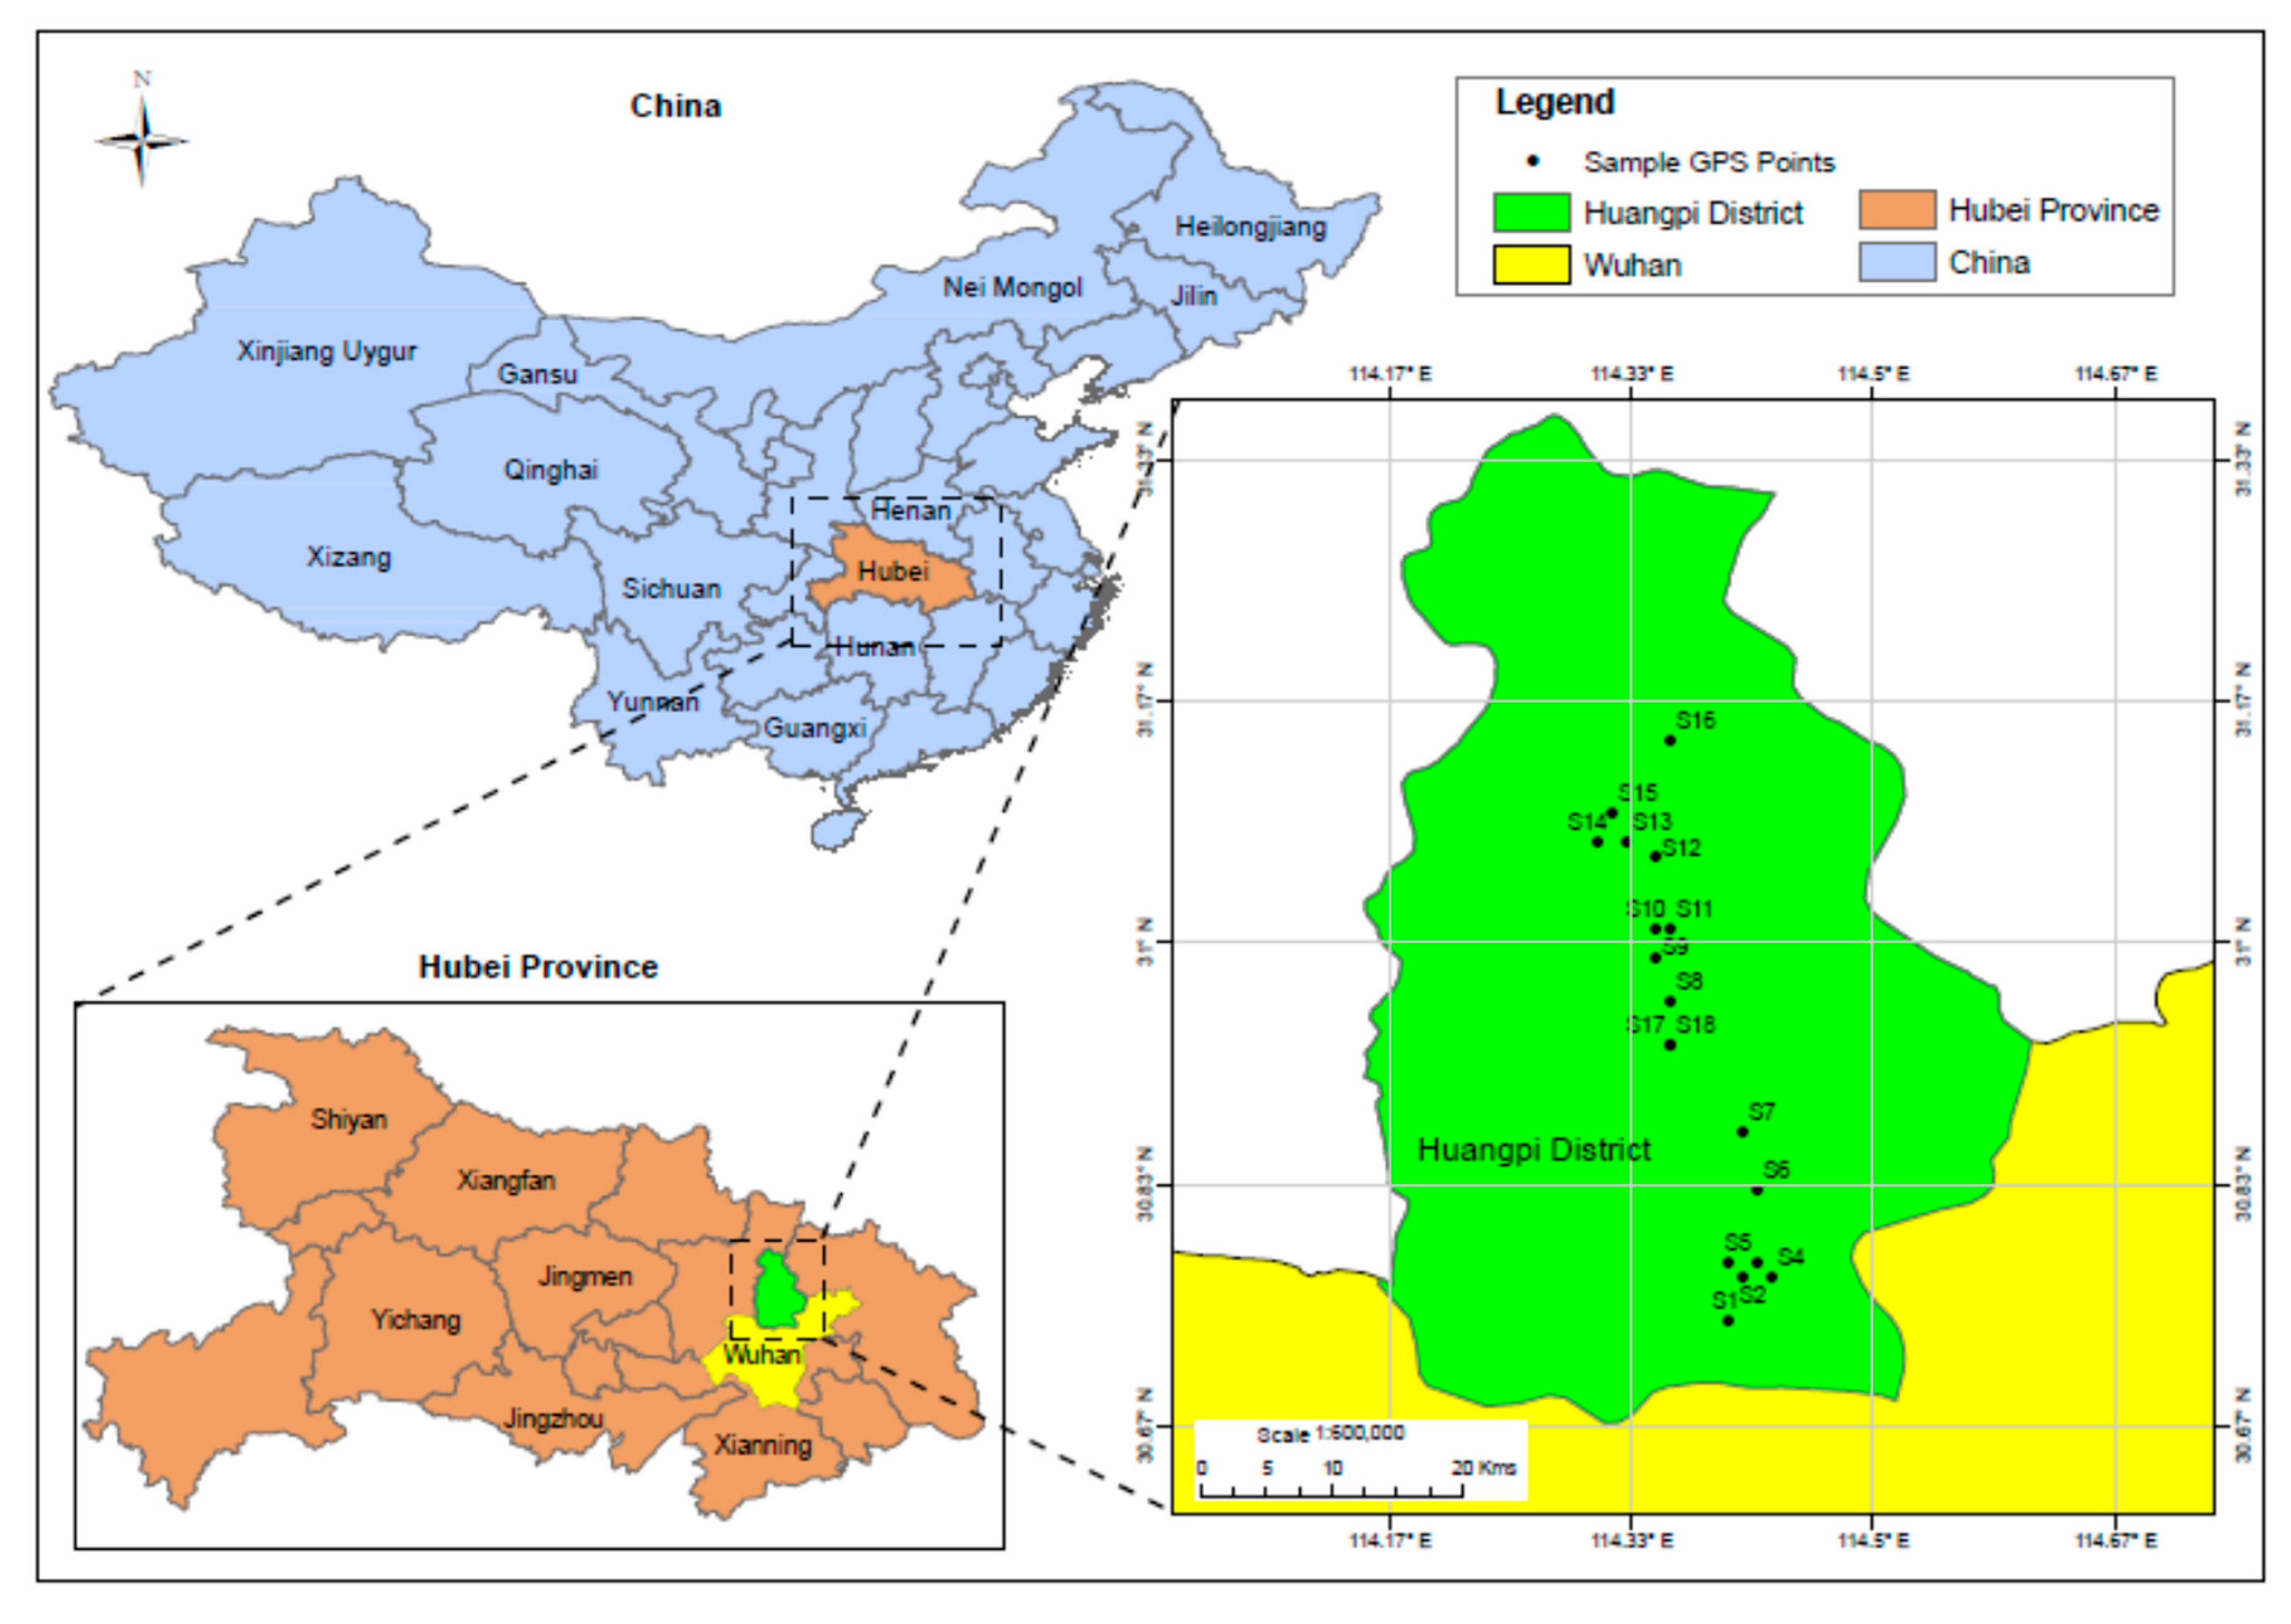
2.1. Sample Collection and Pretreatment
2.2. Chemicals and Standards
2.3. Sample Extraction
2.4. Instrumental Analysis
2.5. Ecological Toxicity and Risk Assessment
2.6. Statistical Analysis
3. Result and Discussion
3.1. Concentrations of Polycyclic Aromatic Hydrocarbons in Soil
3.2. Relationship Among Polycyclic Aromatic Hydrocarbons and Selected Soil Properties
3.3. Possible Sources of Polycyclic Aromatic Hydrocarbons
3.4. Ecotoxicological and Human Health Risk Assessment
4. Conclusions
Author Contributions
Funding
Conflicts of Interest
Appendix A

| 0–10 cm Depth | |||||||||||
|---|---|---|---|---|---|---|---|---|---|---|---|
| Samples | Compounds | ||||||||||
| Nap | Acy | Ace | Flr | Phe | Ant | Flu | Pyr | BaA | Chr | BaP | |
| S1 | 0.94 | 4.24 | 5.58 | 5.76 | 3.39 | 1.63 | 1.88 | 4.61 | 6.07 | 0.63 | 7.52 |
| S2 | 1.77 | 6.17 | 18.63 | 20.74 | 7.65 | 10.98 | 2.67 | 5.95 | 3.73 | 0.67 | 14.03 |
| S3 | 0.06 | 4.70 | 16.36 | 12.66 | 5.13 | 7.96 | 7.70 | 19.40 | 4.69 | 2.38 | 21.13 |
| S4 | 0.19 | 0.34 | 0.70 | 2.69 | 1.35 | 1.93 | 0.05 | 0.86 | 1.82 | 0.00 | 12.22 |
| S5 | 0.00 | 2.97 | 12.70 | 19.80 | 6.58 | 0.00 | 4.23 | 10.68 | 2.40 | 6.77 | 37.40 |
| S6 | 14.20 | 12.33 | 37.41 | 30.42 | 15.26 | 2.72 | 9.14 | 23.50 | 5.00 | 6.48 | 25.32 |
| S7 | 5.08 | 14.74 | 47.14 | 34.04 | 19.71 | 4.64 | 30.98 | 18.62 | 8.91 | 15.64 | 57.69 |
| S8 | 5.33 | 12.81 | 55.95 | 27.69 | 13.36 | 1.35 | 9.14 | 23.00 | 1.04 | 0.42 | 0.00 |
| S9 | 0.00 | 4.40 | 18.78 | 16.39 | 3.38 | 0.00 | 10.33 | 14.56 | 5.88 | 9.36 | 33.35 |
| S10 | 0.93 | 2.53 | 9.88 | 13.07 | 17.19 | 0.00 | 1.46 | 8.04 | 0.23 | 6.47 | 22.67 |
| S11 | 19.65 | 15.11 | 44.81 | 31.93 | 20.58 | 19.27 | 12.00 | 27.20 | 2.75 | 22.03 | 114.95 |
| S12 | 4.99 | 14.82 | 45.73 | 33.22 | 17.55 | 3.87 | 12.85 | 35.16 | 6.71 | 4.58 | 69.95 |
| S13 | 1.56 | 9.60 | 39.86 | 26.71 | 18.57 | 5.48 | 20.63 | 15.77 | 8.98 | 12.25 | 28.10 |
| S14 | 0.26 | 2.58 | 16.01 | 8.91 | 4.14 | 0.00 | 2.28 | 10.11 | 0.68 | 0.37 | 27.67 |
| S15 | 2.23 | 7.81 | 24.13 | 13.85 | 5.67 | 0.08 | 3.41 | 20.48 | 1.16 | 2.72 | 25.07 |
| S16 | 7.03 | 4.43 | 7.78 | 17.30 | 11.16 | 13.67 | 4.38 | 14.52 | 0.82 | 0.00 | 38.65 |
| S17 | 5.01 | 11.52 | 38.25 | 29.15 | 12.42 | 0.85 | 3.37 | 11.54 | 1.13 | 6.17 | 20.26 |
| S18 | 1.60 | 4.03 | 33.84 | 11.91 | 7.64 | 9.73 | 2.79 | 10.91 | 1.07 | 0.00 | 56.16 |
| Ave | 3.93 | 7.51 | 26.31 | 19.79 | 10.59 | 4.68 | 7.74 | 15.27 | 3.51 | 5.39 | 34.01 |
| 10–20 cm Depth | |||||||||||
| S1 | 1.88 | 6.58 | 31.63 | 29.39 | 20.02 | 3.94 | 14.80 | 43.53 | 19.20 | 14.50 | 22.98 |
| S2 | 2.72 | 12.33 | 39.43 | 35.56 | 18.17 | 18.73 | 12.96 | 33.83 | 2.97 | 17.50 | 1.04 |
| S3 | 0.00 | 3.47 | 19.04 | 23.91 | 7.94 | 0.00 | 2.67 | 10.26 | 11.39 | 0.91 | 0.18 |
| S4 | 1.44 | 3.17 | 14.08 | 20.94 | 7.92 | 7.70 | 1.45 | 8.80 | 0.46 | 5.55 | 72.44 |
| S5 | 4.47 | 23.03 | 44.77 | 54.92 | 27.64 | 33.33 | 19.40 | 45.01 | 6.83 | 9.30 | 125.88 |
| S6 | 3.95 | 12.31 | 31.93 | 33.84 | 18.48 | 4.96 | 8.18 | 25.48 | 2.61 | 23.06 | 18.41 |
| S7 | 4.70 | 8.81 | 19.18 | 32.59 | 42.72 | 2.33 | 11.73 | 29.21 | 1.76 | 1.25 | 0.00 |
| S8 | 0.09 | 0.35 | 2.29 | 1.69 | 3.49 | 1.25 | 0.60 | 1.61 | 2.84 | 0.00 | 0.00 |
| S9 | 0.00 | 1.85 | 12.93 | 14.54 | 6.11 | 8.94 | 1.59 | 5.37 | 1.26 | 0.94 | 7.99 |
| S10 | 0.00 | 3.93 | 12.56 | 20.39 | 5.77 | 6.88 | 1.94 | 8.55 | 3.40 | 8.67 | 4.87 |
| S11 | 0.00 | 3.21 | 18.34 | 18.25 | 5.44 | 9.07 | 0.76 | 6.04 | 1.69 | 0.00 | 0.00 |
| S12 | 1.78 | 8.48 | 18.73 | 19.28 | 8.53 | 0.73 | 1.83 | 9.57 | 0.17 | 1.76 | 55.76 |
| S13 | 1.98 | 4.70 | 20.54 | 32.88 | 18.42 | 25.09 | 12.87 | 36.93 | 7.18 | 12.31 | 36.02 |
| S14 | 4.33 | 15.07 | 41.48 | 46.93 | 16.68 | 22.56 | 10.38 | 35.65 | 4.27 | 5.45 | 22.52 |
| S15 | 2.99 | 3.76 | 7.75 | 8.04 | 8.21 | 9.24 | 4.25 | 17.53 | 0.87 | 0.61 | 0.22 |
| S16 | 0.01 | 5.58 | 13.09 | 32.27 | 12.76 | 18.78 | 25.97 | 14.22 | 3.20 | 0.61 | 11.74 |
| S17 | 0.50 | 14.20 | 31.49 | 40.66 | 48.22 | 4.44 | 14.12 | 16.65 | 10.65 | 10.98 | 49.30 |
| S18 | 1.58 | 12.72 | 40.25 | 57.18 | 18.79 | 23.28 | 4.12 | 16.17 | 3.64 | 0.00 | 2.35 |
| Ave | 1.80 | 7.98 | 23.31 | 29.07 | 16.41 | 11.18 | 8.31 | 20.24 | 4.69 | 6.30 | 23.98 |
| Nap | Acy | Ace | Flr | Phe | Ant | Flu | Pyr | BaA | Chr | BaP | TOC | pH | MC | |
|---|---|---|---|---|---|---|---|---|---|---|---|---|---|---|
| Nap | 1 | |||||||||||||
| Acy | 0.540 ** | 1 | ||||||||||||
| Ace | 0.504 ** | 0.862 ** | 1 | |||||||||||
| Flr | 0.315 | 0.832 ** | 0.730 ** | 1 | ||||||||||
| Phe | 0.287 | 0.636 ** | 0.475 ** | 0.690 ** | 1 | |||||||||
| Ant | 0.215 | 0.436 ** | 0.292 | 0.615 ** | 0.257 | 1 | ||||||||
| Fla | 0.235 | 0.589 ** | 0.544 ** | 0.577 ** | 0.543 ** | 0.345 * | 1 | |||||||
| Pyr | 0.399 * | 0.687 ** | 0.630 ** | 0.679 ** | 0.562 ** | 0.500 ** | 0.577 ** | 1 | ||||||
| BaA | −0.053 | 0.239 | 0.279 | 0.337 * | 0.351 * | 0.033 | 0.505 ** | 0.439 ** | 1 | |||||
| Chr | 0.402 * | 0.481 ** | 0.468 ** | 0.426 ** | 0.412 * | 0.198 | 0.507 ** | 0.520 ** | 0.379 * | 1 | ||||
| BaP | 0.460 ** | 0.507 ** | 0.380 * | 0.319 | 0.272 | 0.346 * | 0.335 * | 0.366 * | 0.101 | 0.396 * | 1 | |||
| TOC | −0.271 | −0.214 | −0.328 | −0.066 | −0.202 | 0.137 | −0.221 | −0.068 | −0.038 | −0.029 | 0.191 | 1 | ||
| pH | 0.011 | −0.317 | −0.234 | −0.134 | −0.206 | 0.008 | −0.191 | −0.177 | −0.004 | 0.079 | −0.059 | 0.102 | 1 | |
| MC | −0.291 | −0.164 | −0.087 | 0.022 | −0.099 | 0.139 | −0.094 | −0.059 | 0.099 | −0.028 | −0.002 | 0.525 ** | 0.084 | 1 |
| Sites | Ave | Adults | Children | ||||||
|---|---|---|---|---|---|---|---|---|---|
| Ingestion | Dermal | Inhalation | Total ILCR | Ingestion | Dermal | Inhalation | Total ILCR | ||
| S1 | 11.40 | 1.78 × 10⁻⁸ | 3.05 × 10⁻⁶ | 1.42 × 10⁻¹² | 3.07 × 10⁻⁶ | 1.45 × 10⁻⁶ | 5.57 × 10⁻⁵ | 1.16 × 10⁻¹⁰ | 5.71 × 10⁻⁵ |
| S2 | 13.10 | 2.05 × 10⁻⁸ | 3.51 × 10⁻⁶ | 1.64 × 10⁻¹² | 3.53 × 10⁻⁶ | 1.67 × 10⁻⁶ | 6.40 × 10⁻⁵ | 1.33 × 10⁻¹⁰ | 6.57 × 10⁻⁵ |
| S3 | 8.27 | 1.29 × 10⁻⁸ | 2.22 × 10⁻⁶ | 1.03 × 10⁻¹² | 2.23 × 10⁻⁶ | 1.05 × 10⁻⁶ | 1.62 × 10⁻⁵ | 8.4 × 10⁻¹¹ | 1.72 × 10⁻⁵ |
| S4 | 7.55 | 1.18 × 10⁻⁸ | 2.02 × 10⁻⁶ | 9.44 × 10⁻¹³ | 2.03 × 10⁻⁶ | 9.62 × 10⁻⁷ | 9.22 × 10⁻⁵ | 7.69 × 10⁻¹¹ | 9.32 × 10⁻⁵ |
| S5 | 22.64 | 3.54 × 10⁻⁸ | 6.06 × 10⁻⁶ | 2.83 × 10⁻¹² | 6.10 × 10⁻⁶ | 2.88 × 10⁻⁶ | 2.77 × 10⁻⁴ | 2.31 × 10⁻¹⁰ | 2.80 × 10⁻⁴ |
| S6 | 16.59 | 2.60 × 10⁻⁸ | 4.44 × 10⁻⁶ | 2.07 × 10⁻¹² | 4.47 × 10⁻⁶ | 2.11 × 10⁻⁶ | 2.03 × 10⁻⁴ | 1.70 × 10⁻¹⁰ | 2.05 × 10⁻⁴ |
| S7 | 18.70 | 2.93 × 10⁻⁸ | 5.01 × 10⁻⁶ | 2.34 × 10⁻¹² | 5.04 × 10⁻⁶ | 2.38 × 10⁻⁶ | 2.28 × 10⁻⁴ | 1.90 × 10⁻¹⁰ | 2.31 × 10⁻⁴ |
| S8 | 7.47 | 1.17 × 10⁻⁸ | 2.00 × 10⁻⁶ | 9.34 × 10⁻¹³ | 2.01 × 10⁻⁶ | 9.51 × 10⁻⁶ | 9.12 × 10⁻⁵ | 7.60 × 10⁻¹¹ | 9.23 × 10⁻⁵ |
| S9 | 8.09 | 1.27 × 10⁻⁸ | 2.17 × 10⁻⁶ | 1.01 × 10⁻¹² | 2.18 × 10⁻⁶ | 1.03 × 10⁻⁶ | 9.88 × 10⁻⁵ | 8.23 × 10⁻¹¹ | 9.98 × 10⁻⁵ |
| S10 | 7.25 | 1.13 × 10⁻⁸ | 1.94 × 10⁻⁶ | 9.06 × 10⁻¹³ | 1.95 × 10⁻⁶ | 9.23 × 10⁻⁷ | 8.85 × 10⁻⁵ | 7.38 × 10⁻¹¹ | 8.95 × 10⁻⁵ |
| S11 | 17.87 | 2.80 × 10⁻⁸ | 4.79 × 10⁻⁶ | 2.23 × 10⁻¹² | 4.81 × 10⁻⁶ | 2.28 × 10⁻⁶ | 2.18 × 10⁻⁴ | 1.82 × 10⁻¹⁰ | 2.21 × 10⁻⁴ |
| S12 | 17.09 | 2.67 × 10⁻⁸ | 4.58 × 10⁻⁶ | 2.14 × 10⁻¹² | 4.61 × 10⁻⁶ | 2.18 × 10⁻⁶ | 8.35 × 10⁻⁵ | 6.96 × 10⁻¹¹ | 8.57 × 10⁻⁵ |
| S13 | 18.02 | 2.82 × 10⁻⁸ | 4.83 × 10⁻⁶ | 2.25 × 10⁻¹² | 4.86 × 10⁻⁶ | 2.30 × 10⁻⁶ | 3.52 × 10⁻⁵ | 7.34 × 10⁻¹¹ | 3.75 × 10⁻⁵ |
| S14 | 13.56 | 2.12 × 10⁻⁸ | 3.63 × 10⁻⁶ | 1.70 × 10⁻¹² | 3.65 × 10⁻⁶ | 1.73 × 10⁻⁶ | 2.65 × 10⁻⁵ | 1.38 × 10⁻¹⁰ | 2.82 × 10⁻⁵ |
| S15 | 7.73 | 1.21 × 10⁻⁸ | 2.07 × 10⁻⁶ | 9.66 × 10⁻¹³ | 2.08 × 10⁻⁶ | 9.85 × 10⁻⁷ | 3.78 × 10⁻⁵ | 7.87 × 10⁻¹¹ | 3.88 × 10⁻⁵ |
| S16 | 11.73 | 1.83 × 10⁻⁸ | 3.14 × 10⁻⁶ | 1.47 × 10⁻¹² | 3.16 × 10⁻⁶ | 1.49 × 10⁻⁶ | 2.29 × 10⁻⁵ | 4.78 × 10⁻¹¹ | 2.44 × 10⁻⁵ |
| S17 | 17.31 | 2.71 × 10⁻⁸ | 4.64 × 10⁻⁶ | 2.16 × 10⁻¹² | 4.66 × 10⁻⁶ | 2.21 × 10⁻⁶ | 8.46 × 10⁻⁵ | 1.76 × 10⁻¹⁰ | 8.68 × 10⁻⁵ |
| S18 | 14.53 | 2.27 × 10⁻⁸ | 3.89 × 10⁻⁶ | 1.82 × 10⁻¹² | 3.92 × 10⁻⁶ | 1.85 × 10⁻⁶ | 7.10 × 10⁻⁵ | 1.48 × 10⁻¹⁰ | 7.29 × 10⁻⁵ |
| Sum | 238.9 | 3.74 × 10⁻⁷ | 6.40 × 10⁻⁵ | 3.00 × 10⁻¹¹ | 3.5 × 10⁻⁶ | 3.04 × 10⁻⁵ | 1.79 × 10⁻³ | 2.15 × 10⁻⁹ | 1.01 × 10⁻⁴ |
References
- Salem, D.M.S.A.; Khaled, A.; Nemr, A.E. Assessment of pesticides and polychlorinated biphenyls (PCBs) in sediments of the Egyptian Mediterranean Coast. Egypt J. Aquat. Res. 2013, 39, 141–152. [Google Scholar] [CrossRef]
- Ragab, S.; Sikaily, A.E.; Nemr, A.E.; Sea, R. Concentrations and sources of pesticides and PCBs in surficial sediments of the Red Sea coast, Egypt. Egypt J. Aquat. Res. 2016, 42, 365–374. [Google Scholar] [CrossRef]
- Zhu, Y.; Yang, Y.; Liu, M.; Zhang, M.; Wang, J. Concentration, Distribution, Source, and Risk Assessment of PAHs and Heavy Metals in Surface Water from the Three Gorges Reservoir, China. Hum. Ecol. Risk Assess. 2015, 21, 1593–1607. [Google Scholar] [CrossRef]
- Iwegbue, C.M.A.; Obi, G.; Aganbi, E.; Ogala, J.E.; Omo-Irabor, O.O.; Martincigh, B.S. Concentrations and Health Risk Assessment of Polycyclic Aromatic Hydrocarbons in Soils of an Urban Environment in the Niger Delta. Toxicol. Environ. Health Sci. 2016, 8, 221–233. [Google Scholar] [CrossRef]
- Akyüz, M.; Çabuk, H. Gas-particle partitioning and seasonal variation of polycyclic aromatic hydrocarbons in the atmosphere of Zonguldak, Turkey. Sci. Total Environ. 2010, 408, 5550–5558. [Google Scholar] [CrossRef] [PubMed]
- Abdel-Shafy, H.I.; Mansour, M.S.M. A review on polycyclic aromatic hydrocarbons: Source, environmental impact, effect on human health and remediation. Egypt J. Pet. 2016, 25, 107–123. [Google Scholar] [CrossRef]
- Lima, A.L.C.; Farrington, J.W.; Reddy, C.M. Combustion-derived polycyclic aromatic hydrocarbons in the environment—A review. Environ. Forensics 2005, 6, 109–131. [Google Scholar] [CrossRef]
- Wang, G.; Mielke, H.W.; Quach, V.; Gonzales, C.; Zhang, Q. Determination of polycyclic aromatic hydrocarbons and trace metals in New Orleans soils and sediments. Soil Sediment Contam. 2004, 13, 313–327. [Google Scholar] [CrossRef]
- Wang, L.; Zhang, S.; Wang, L.; Zhang, W.; Shi, X.; Lu, X.; Li, X.; Li, X. Concentration and Risk Evaluation of Polycyclic Aromatic Hydrocarbons in Urban Soil in the Typical Semi-Arid City of Xi’an in Northwest China. Int. J. Environ. Res. Public Health 2018, 15, 607. [Google Scholar] [CrossRef] [PubMed]
- Wilcke, W. Polycyclic Aromatic Hydrocarbons (PAHs) in Soil—A Review. J. Plant Nutr. Soil Sci. 2000, 163, 229–248. [Google Scholar] [CrossRef]
- Yang, Y.; Woodward, L.A.; Li, Q.X.; Wang, J. Concentrations, Source and Risk Assessment of Polycyclic Aromatic Hydrocarbons in Soils from Midway Atoll, North Pacific Ocean. PLoS ONE 2014, 9, e86441. [Google Scholar] [CrossRef] [PubMed]
- Samburova, V.; Zielinska, B.; Khlystov, A. Do 16 Polycyclic Aromatic Hydrocarbons Represent PAH Air Toxicity? Toxics 2017, 5, 17. [Google Scholar] [CrossRef] [PubMed]
- Doick, K.J.; Klingelmann, E.V.A.; Burauel, P.; Jones, K.C.; Semple, K.T. Long-Term Fate of Polychlorinated Biphenyls and Polycyclic Aromatic Hydrocarbons in an Agricultural Soil. Environ. Sci. Technol. 2005, 39, 3663–3670. [Google Scholar] [CrossRef] [PubMed]
- Kumar, R.; Routh, J.; Ramanathan, A.L.; Klump, J.V. Organic Geochemistry Polycyclic aromatic hydrocarbon fingerprints in the Pichavaram mangrove—Estuarine sediments, southeastern India. Org. Geochem. 2012, 53, 88–94. [Google Scholar] [CrossRef]
- Liu, M.X.; Yang, Y.Y.; Yun, X.Y.; Zhang, M.M.; Wang, J. Occurrence, sources, and cancer risk of polycyclic aromatic hydrocarbons and polychlorinated biphenyls in agricultural soils from the Three Gorges Dam region, China. J. Soil Water Conserv. 2016, 71, 327–334. [Google Scholar] [CrossRef]
- Olver, P.J. Chapter 5. Finite Differences. In Introduction to Partial Differential Equations; Springer International Publishing: Cham, Switzerland, 2013; Volume 234, 38p. [Google Scholar]
- Van Zuydam, C.S. Determination of Polycyclic Aromatic Hydrocarbons (PAHs) Resulting from Wood Stoprage and Wood Treatment Facilities for Electricity Transmission in Swaziland. Master Thesis, University of South Africa, Pretoria, South Africa, June 2007; p. 112. [Google Scholar]
- Grimalt, J.O.; Van Drooge, B.L.; Ribes, A.; Fernández, P.; Appleby, P. Polycyclic aromatic hydrocarbon composition in soils and sediments of high altitude lakes. Environ Pollut. 2004, 131, 13–24. [Google Scholar] [CrossRef] [PubMed]
- Pribylova, P.; Kares, R.; Boruvkova, J.; Cupr, P.; Prokes, R.; Kohoutek, J.; Holoubek, I.; Klanova, J. Levels of persistent organic pollutants and polycyclic aromatic hydrocarbons in ambient air of Central and Eastern Europe. Atmos. Pollut. Res. 2012, 3, 494–505. [Google Scholar] [CrossRef]
- Nekhavhambe, T.J.; van Ree, T.; Fatoki, O.S. Determination and distribution of polycyclic aromatic hydrocarbons in rivers, surface runoff, and sediments in and around Thohoyandou, Limpopo Province, South Africa. Water SA 2014, 40, 415–424. [Google Scholar] [CrossRef]
- Vennemo, H.; Aunan, K.; Lindhjem, H.; Seip, H.M. Environmental Pollution in China: Status and Trends. Rev. Environ. Econ. Policy 2009, 3, 209–230. [Google Scholar] [CrossRef]
- Dai, L. Tackling Diffuse Water Pollution from Agriculture in China: Drawing Inspiration from the European Union. Utrecht Law Rev. 2014, 10, 136–154. [Google Scholar] [CrossRef]
- Lu, Y.; Song, S.; Wang, R.; Liu, Z.; Meng, J.; Sweetman, A.J.; Jenkinsd, A.; Ferriere, R.C.; Licd, H.; Luo, W.; et al. Impacts of soil and water pollution on food safety and health risks in China. Environ. Int. 2015, 77, 5–15. [Google Scholar] [CrossRef] [PubMed] [Green Version]
- Tottie, O. Evaluation of Sludge Management in Wuhan, China. Master Thesis, Swedish University of Agricultural Science, Uppsala, Sweden, January 2008. [Google Scholar]
- Yun, X.; Yang, Y.; Liu, M.; Zhang, M.; Wang, J. Distribution, Seasonal Variations, and Ecological Risk Assessment of Polycyclic Aromatic Hydrocarbons in the East Lake, China. Clean Soil Air Water. 2016, 44, 506–514. [Google Scholar] [CrossRef]
- He, J.; Yu, Y.; Liu, Y. Research on the decision-making model of land-use spatial optimization. In Proceedings of the International Symposium on Spatial Analysis, Spatial-Temporal Data Modeling, and Data Mining, Wuhan, China, 21 October 2009. 74924X. [Google Scholar]
- Wuhan Statistical Yearbook; China Statistical Publishing House: Beijing, China, 2010.
- Qi, Y.; Owino, A.A.; Makokha, V.A.; Shen, Y.; Zhang, D.; Wang, J. Occurrence and risk assessment of polycyclic aromatic hydrocarbons in the Hanjiang River Basin and the Danjiangkou Reservoir, China. Hum. Ecol. Risk Assess. 2016, 22, 1183–1196. [Google Scholar] [CrossRef]
- Xu, J.; Yu, Y.; Wang, P.; Guo, W.; Dai, S.; Sun, H. Polycyclic aromatic hydrocarbons in the surface sediments from Yellow River, China. Chemosphere 2007, 67, 1408–1414. [Google Scholar] [CrossRef] [PubMed]
- Shi, B.; Wu, Q.; Ouyang, H.; Liu, X.; Ma, B.; Zuo, W.; Chen, S. Distribution and Source Apportionment of Polycyclic Aromatic Hydrocarbons in Soils and Leaves from High-Altitude Mountains in Southwestern China. J. Environ. Qual. 2014, 43, 1942–1952. [Google Scholar] [CrossRef] [PubMed]
- Liu, X.; Bai, Z.; Yu, Q.; Cao, Y.; Zhou, W. Polycyclic aromatic hydrocarbons in the soil profiles (0–100 cm) from the industrial district of a large open-pit coal mine, China. RSC Adv. 2017, 7, 28029–28037. [Google Scholar] [CrossRef] [Green Version]
- Kampire, E.; Rubidge, G. Characterization of polychlorinated biphenyls in surface sediments of the North End Lake, Port Elizabeth, South Africa. Water SA 2017, 43, 646–654. [Google Scholar] [CrossRef]
- Tongo, I.; Ogbeide, O.; Ezemonye, L. Human health risk assessment of polycyclic aromatic hydrocarbons (PAHs) in smoked fish species from markets in Southern Nigeria. Toxicol. Rep. 2017, 4, 55–61. [Google Scholar] [CrossRef]
- Al-Busaidi, A.; Cookson, P.; Yamamoto, T. Methods of pH determination in calcareous soils: Use of electrolytes and suspension effect. Aust. J. Soil Res. 2005, 43, 541–545. [Google Scholar] [CrossRef]
- Crommentuijn, T.; Sijm, D.; De Bruijn, J.; Van Leeuwen, K.; Van de Plassche, E. Maximum permissible and negligible concentrations for some organic substances and pesticides. J. Environ. Manag. 2000, 58, 297–312. [Google Scholar] [CrossRef]
- Kalf, D.F.; Crommentuijn, T.; van de Plassche, E.J. Environmental quality objectives for 10 polycyclic aromatic hydrocarbons (PAHs). Ecotoxicol. Environ. Saf. 1997, 36, 89–97. [Google Scholar] [CrossRef] [PubMed]
- Cao, Z.; Liu, J.; Luan, Y.; Li, Y.; Ma, M.; Xu, J.; Han, S. Distribution and ecosystem risk assessment of polycyclic aromatic hydrocarbons in the Luan River, China. Ecotoxicology 2010, 19, 827–837. [Google Scholar] [CrossRef] [PubMed]
- Sun, H.; Qi, Y.; Zhang, D.; Li, Q.X.; Wang, J. Concentrations, distribution, sources and risk assessment of organohalogenated contaminants in soils from Kenya, Eastern Africa. Environ. Pollut. 2016, 209, 177–185. [Google Scholar] [CrossRef]
- Kumar, V.; Kothiyal, N.C.; Saruchi Mehra, R.; Parkash, A.; Sinha, R.R.; Tayagi, S.K.; Gaba, R. Determination of some carcinogenic PAHs with toxic equivalency factor along roadside soil within a fast developing northern city of India. J. Earth Syst. Sci. 2014, 123, 479–489. [Google Scholar] [CrossRef]
- Guo, J.Y.; Wu, F.C.; Zhang, L.; Liao, H.Q.; Zhang, R.Y.; Li, W.; Zhao, X.-L.; Chen, S.-J.; Mai, B.-X. Screening level of PAHs in sediment core from Lake Hongfeng, Southwest China. Arch. Environ. Contam Toxicol. 2011, 60, 590–596. [Google Scholar] [CrossRef] [PubMed]
- Mai, B.; Qi, S.; Zeng, E.Y.; Yang, Q.; Zhang, G.; Fu, J.; Sheng, G.; Peng, P.; Wang, Z. Distribution of polycyclic aromatic hydrocarbons in the coastal region off Macao. Environ. Sci. Technol. 2003, 37, 4855–4863. [Google Scholar] [CrossRef] [PubMed]
- Liu, F.; Liu, J.; Chen, Q.; Wang, B.; Cao, Z. Pollution characteristics, ecological risk and sources of polycyclic aromatic hydrocarbons (PAHs) in surface sediment from Tuhai-Majia River system, China. Procedia Environ. Sci. 2012, 13, 1301–1314. [Google Scholar] [CrossRef]
- Ma, W.-L.; Liu, L.-Y.; Qi, H.; Zhang, Z.-F.; Song, W.-W.; Shen, J.-M.; Chen, Z.L.; Ren, N.Q.; Grabuski, J.; Li, Y.F. Polycyclic aromatic hydrocarbons in water, sediment and soil of the Songhua River Basin, China. Environ. Monit. Assess. 2013, 185, 8399–8409. [Google Scholar] [CrossRef] [PubMed]
- Cai, J.; Gao, S.; Zhu, L.; Jia, X.; Zeng, X.; Yu, Z. Occurrence and source apportionment of polycyclic aromatic hydrocarbons in soils and sediment from Hanfeng Lake, Three Gorges, China. J. Environ. Sci. Health Part A Toxic Hazard. Subst. Environ. Eng. 2017, 52, 1226–1232. [Google Scholar] [CrossRef] [PubMed]
- Xiao, R.; Bai, J.; Wang, J.; Lu, Q.; Zhao, Q.; Cui, B.; Liu, X. Polycyclic aromatic hydrocarbons (PAHs) in wetland soils under different land uses in a coastal estuary: Toxic levels, sources and relationships with soil organic matter and water-stable aggregates. Chemosphere 2014, 110, 8–16. [Google Scholar] [CrossRef] [PubMed]
- Kafilzadeh, F. Distribution and sources of polycyclic aromatic hydrocarbons in water and sediments of the Soltan Abad River, Iran. Egypt J. Aquat. Res. 2015, 41, 227–231. [Google Scholar] [CrossRef]
- Plachá, D.; Raclavská, H.; Matýsek, D.; Rümmeli, M.H. The polycyclic aromatic hydrocarbon concentrations in soils in the Region of Valasske Mezirici, the Czech Republic. Geochem. Trans. 2009, 10, 1–21. [Google Scholar] [CrossRef] [PubMed] [Green Version]
- Bourotte, C.; Forti, M.C.; Lucas, Y.; Melfi, A.J. Comparison of Polycyclic Aromatic Hydrocarbon (PAHs) concentrations in urban and natural forest soils in the Atlantic Forest (São Paulo State). An. Acad. Brasil. Cienc. 2009, 81, 127–136. [Google Scholar] [CrossRef] [Green Version]
- Nam, J.J.; Song, B.H.; Eom, K.C.; Lee, S.H.; Smith, A. Distribution of polycyclic aromatic hydrocarbons in agricultural soils in South Korea. Chemosphere 2003, 50, 1281–1289. [Google Scholar] [CrossRef]
- Zhang, K.; Wang, J.Z.; Liang, B.; Zeng, E.Y. Occurrence of polycyclic aromatic hydrocarbons in surface sediments of a highly urbanized river system with special reference to energy consumption patterns. Environ. Pollut. 2011, 159, 1510–1515. [Google Scholar] [CrossRef] [PubMed] [Green Version]
- Yunker, M.B.; Macdonald, R.W.; Vingarzan, R.; Mitchell, R.H.; Goyette, D.; Sylvestre, S. PAHs in the Fraser River basin: A critical appraisal of PAH ratios as indicators of PAH source and composition. Org. Geochem. 2002, 33, 489–515. [Google Scholar] [CrossRef]
- Sun, C.; Zhang, J.; Ma, Q.; Chen, Y.; Ju, H. Polycyclic aromatic hydrocarbons (PAHs) in water and sediment from a river basin: Sediment–water partitioning, source identification and environmental health risk assessment. Environ. Geochem. Health 2017, 39, 63–74. [Google Scholar] [CrossRef] [PubMed]
- Bobak, D.M. Polycyclic Aromatic Hydrocarbon Characterization in Otter Creek, Northwest Ohio. Master Thesis, University of Toledo, Toledo, OH, USA.
- Heywood, E.; Wright, J.; Wienburg, C.L.; Black, H.I.J.; Long, S.M.; Osborn, D.; Spurgeon, D.J. Supporting information: Factors Influencing the National Distribution of Polycyclic Aromatic Hydrocarbons and Polychlorinated Biphenyls in British Soils. Eviron. Sci. Technol. 2006, 40, 7629–7635. [Google Scholar] [CrossRef]
- Nieuwoudt, C.; Pieters, R.; Quinn, L.P.; Kylin, H.; Borgen, A.R.; Bouwman, H. Polycyclic aromatic hydrocarbons (PAHs) in soil and sediment from industrial, residential, and agricultural areas in central South Africa: An initial assessment. Soil Sediment. Contam. 2011, 20, 188–204. [Google Scholar] [CrossRef]
- Magi, E.; Bianco, R.; Ianni, C.; Di Carro, M. Distribution of polycyclic aromatic hydrocarbons in the sediments of the Adriatic Sea. Environ. Pollut. 2002, 119, 91–98. [Google Scholar] [CrossRef]
- Yang, C.; Zhang, G.; Wang, Z.; Yang, Z.; Hollebone, B.; Landriault, M.; Shah, K.; Brown, C.E. Development of a methodology for accurate quantitation of alkylated polycyclic aromatic hydrocarbons in petroleum and oil contaminated environmental samples. Anal. Methods 2014, 6, 7760–7771. [Google Scholar] [CrossRef]
- Wang, Z.; Yang, C.; Brown, C.; Hollebone, B.; Landriault, M. A Case Study: Distinguishing Pyrogenic Hydrocarbons From Petrogenic Hydrocarbons. In Proceedings of the International Oil Spill Conference, Savannah, GA, USA, 4–8 May 2008; pp. 311–320. [Google Scholar] [CrossRef]
- Orecchio, S. Contamination from polycyclic aromatic hydrocarbons (PAHs) in the soil of a botanic garden localized next to a former manufacturing gas plant in Palermo (Italy). J. Hazard. Mater. 2010, 180, 590–601. [Google Scholar] [CrossRef] [PubMed] [Green Version]
- Fisner, M.; Taniguchi, S.; Moreira, F.; Bícego, M.C.; Turra, A. Polycyclic aromatic hydrocarbons (PAHs) in plastic pellets: Variability in the concentration and composition at different sediment depths in a sandy beach. Mar. Pollut. Bull. 2013, 70, 219–226. [Google Scholar] [CrossRef] [PubMed]
- Cui, S.; Fu, Q.; Li, Y.-F.; Li, T.-X.; Liu, D.; Dong, W.-C.; Wang, M.; Li, K.-Y. Spatial-temporal variations, possible sources and soil-air exchange of polychlorinated biphenyls in urban environments in China. RSC Adv. 2017, 7, 14797–14804. [Google Scholar] [CrossRef]
- Farooq, S.; Ali-Musstjab-Akber-Shah Eqani, S.; Malik, R.N.; Katsoyiannis, A.; Zhang, G.; Zhang, Y.; Li, J.; Xiang, L.; Jones, K.C.; Shinwari, Z.K. Occurrence, finger printing and ecological risk assessment of polycyclic aromatic hydrocarbons (PAHs) in the Chenab River, Pakistan. J. Environ. Monit. 2011, 13, 3207–3215. [Google Scholar] [CrossRef] [PubMed]
- Bay, B. Assessment of polycyclic aromatic hydrocarbons (PAHs) ecological risk in surface seawater from Assessment of polycyclic aromatic hydrocarbons (PAHs) ecological risk in surface seawater from the west Bohai Bay. IOP Conf. Ser. Earth Environ. Sci. 2017, 82, 012040. [Google Scholar]
- Frédéric, O.; Yves, P. Pharmaceuticals in hospital wastewater: Their ecotoxicity and contribution to the environmental hazard of the effluent. Chemosphere 2014, 115, 31–39. [Google Scholar] [CrossRef] [PubMed]
- Sun, C.; Zhang, J.; Ma, Q.; Chen, Y. Human health and ecological risk assessment of 16 polycyclic aromatic hydrocarbons in drinking source water from a large mixed-use reservoir. Int. J. Environ. Res. Public Health 2015, 12, 13956–13969. [Google Scholar]
- Canadian Council of Ministers of the Environment. Canadian Soil Quality Guidelines for the Protection of Environmental and Human Health—Polycyclic Aromatic Hydrocarbons. In Canadian Environmental Quality Guidelines; Canadian Council of Ministers of the Environment: Winnipeg, MB, Canada, 2010; p. 19. Available online: st-ts.ccme.ca/?lang=en&factsheets=186#soil_agricultural_concentration (accessed on 26 August 2018).

| Individual PAHs | ∑PAHs | ||||
|---|---|---|---|---|---|
| Risk Grade | RQ(NCs) | RQ(MPCs) | Risk Grade | RQ∑PAHs (NCs) | RQ∑PAHs (MPCs) |
| Lower risk | <1 | <1 | Risk-free | <1 | <1 |
| Medium risk | ≥1 | <1 | Low risk | ≥1; <800 | <1 |
| High risk | ≥1 | ≥1 | Medium risk 1 | ≥800 | <1 |
| Medium risk 2 | <800 | ≥1 | |||
| High risk | ≥800 | ≥1 | |||
| PAHs | Number of Rings | DL | LQ | 0–10 cm Depth | 10–20 cm Depth | ||||
|---|---|---|---|---|---|---|---|---|---|
| Range | Mean | SD | Range | Mean | SD | ||||
| Nap | 2 | 7.6 × 10⁻³ | 2.5 × 10⁻² | Nd–19.65 | 3.93 | 5.30 | Nd–4.7 | 1.80 | 1.71 |
| Acy | 3 | 4.8 × 10⁻² | 1.6 × 10⁻¹ | 0.34–15.11 | 7.51 | 4.90 | 0.35–23.03 | 7.98 | 5.90 |
| Ace | 3 | 2.2 × 10⁻² | 7.4 × 10⁻² | 0. 70–55.95 | 26.31 | 16.71 | 2.29–44.77 | 23.31 | 12.68 |
| Flr | 3 | 3.3 × 10⁻² | 1.1 × 10⁻¹ | 2.69–34.04 | 19.79 | 9.89 | 1.69–57.18 | 30.56 | 13.80 |
| Phe | 3 | 42 × 10−2 | 1.3 × 10⁻¹ | 1.35–20.58 | 10.60 | 6.37 | 3.49–48.22 | 16.41 | 12.49 |
| Ant | 3 | 1.5 × 10⁻² | 5.0 × 10⁻² | Nd–19.5 | 4.88 | 5.59 | 0.16–33.57 | 11.41 | 9.91 |
| ΣLMW | 5.08–164.83 | 73.02 | 48.76 | 7.98–211.47 | 91.46 | 56.49 | |||
| Flu | 4 | 1.9 × 10⁻² | 6.3 × 10⁻² | 0.05–30.98 | 7.74 | 7.80 | 0.60–25.97 | 8.31 | 7.38 |
| Pyr | 4 | 4.8 × 10⁻² | 1.6 × 10⁻¹ | 0.86–35.16 | 15.27 | 8.62 | 8.04–225.06 | 20.25 | 13.91 |
| BaA | 4 | 1.7 × 10⁻¹ | 5.6 × 10⁻¹ | 0.23–8.98 | 3.50 | 2.86 | 0.84–96.01 | 4.69 | 4.85 |
| Chr | 4 | 5.7 × 10⁻² | 1.9 × 10⁻¹ | Nd–22.03 | 5.39 | 6.18 | Nd–115.31 | 6.30 | 7.01 |
| BaP | 5 | 1.3 × 10⁻¹ | 4.3 × 10⁻¹ | Nd–114.95 | 34.01 | 26.98 | Nd–629.41 | 23.98 | 33.59 |
| ΣHMW | 1.14–212.10 | 65.91 | 52.44 | 2.38–239.12 | 63.53 | 66.74 | |||
| ΣPAHs | 6.22–376.93 | 138.93 | 101.20 | 10.36–450.59 | 154.99 | 123.23 | |||
| Land-Use Type | Sites | Mean (0–10 cm) | Mean (10–20 cm) | SD (0–10 cm) | SD (10–20 cm) | Range (0–10 cm) | Range (10–20 cm) | Sum (0–10 cm) | Sum (10–20 cm) |
|---|---|---|---|---|---|---|---|---|---|
| Farmland (FL) | S3 | 9.31 | 7.27 | 7.07 | 8.19 | 0.06–21.13 | Nd–23.91 | 102.17 | 79.77 |
| S12 | 20.80 | 12.04 | 21.17 | 16.52 | Nd–69.95 | 0.17–55.76 | 249.43 | 126.62 | |
| S15 | 9.71 | 7.72 | 9.50 | 8.77 | 0.32–25.07 | 0.22–29.31 | 106.61 | 63.47 | |
| S16 | 10.91 | 12.59 | 10.78 | 10.25 | Nd–38.65 | 0.01–32.27 | 119.74 | 138.23 | |
| ∑PAHs FL | 50.73 | 39.62 | 12.13 | 10.93 | 0.38–154.8 | 0.4–141.25 | 577.95 | 408.09 | |
| Pooled mean and sum | 45.18 | 493.02 | |||||||
| Paddy field (PF) | S9 | 10.60 | 5.61 | 9.84 | 5.04 | Nd–33.35 | Nd–14.54 | 116.43 | 61.52 |
| S10 | 7.50 | 7.02 | 7.59 | 5.64 | Nd–22.67 | Nd–20.39 | 82.47 | 76.96 | |
| S13 | 17.07 | 19.01 | 11.25 | 12.50 | 1.56–39.86 | 1.98–36.93 | 187.51 | 208.92 | |
| S14 | 6.65 | 20.50 | 8.64 | 15.08 | 0.13–27.67 | 4.27–46.93 | 73.01 | 225.32 | |
| S18 | 12.72 | 16.39 | 17.22 | 18.17 | Nd–56.16 | Nd–57.18 | 139.68 | 180.08 | |
| ∑PAHs PF | 54.54 | 68.53 | 10.91 | 11.29 | 1.69–179.71 | 6.3–175.97 | 599.10 | 752.80 | |
| Pooled mean and sum | 61.54 | 675.95 | |||||||
| Plastic greenhouse (PGH) | S4 | 2.03 | 13.11 | 3.50 | 20.60 | Nd–12.22 | 0.46–72.44 | 22.15 | 143.95 |
| S5 | 9.42 | 35.89 | 11.01 | 34.16 | Nd–37.40 | 4.5–125.88 | 103.53 | 394.58 | |
| S6 | 16.54 | 16.68 | 11.19 | 11.11 | 2.95–37.41 | 2.61–33.84 | 181.78 | 183.21 | |
| S17 | 12.72 | 21.95 | 12.01 | 17.42 | 1.09–38.25 | 0.50–49.30 | 139.67 | 241.21 | |
| ∑PAHs PGH | 40.71 | 87.63 | 9.43 | 20.82 | 4.04–125.28 | 8.0–281.46 | 447.13 | 962.95 | |
| Pooled mean and sum | 64.17 | 705.04 | |||||||
| Barren land (BL) | S1 | 3.86 | 18.97 | 2.32 | 12.61 | 0.63–7.52 | 1.88–43.53 | 42.25 | 208.45 |
| S2 | 8.48 | 17.77 | 6.82 | 13.50 | 0.67–20.74 | 1.04–39.43 | 92.99 | 195.24 | |
| S7 | 23.40 | 14.05 | 17.24 | 14.79 | 4.87–57.69 | Nd–42.72 | 257.19 | 154.28 | |
| S8 | 13.67 | 1.31 | 16.82 | 1.21 | Nd–55.95 | Nd–3.49 | 150.09 | 14.21 | |
| S11 | 30.04 | 5.73 | 30.17 | 6.89 | 2.75–114.95 | 4.27–46.93 | 330.28 | 62.80 | |
| ∑PAHs BL | 79.45 | 57.83 | 14.67 | 9.8 | 8.92–256.85 | 7.19–176.1 | 872.80 | 634.98 | |
| Pooled mean and sum | 68.64 | 753.89 | |||||||
| Places | Environmental Component | Number of PAHs determined | Range | Mean | References |
|---|---|---|---|---|---|
| Huangpi, China | Soil (0–10 cm) | 11 | 6.22–376.93 | 138.93 | This study |
| Soil (10–20 cm) | 10.36–450.59 | 154.99 | |||
| Hanfeng Lake, Three Gorges, China | Bank soils | 15 | 79.7–473 | [45] | |
| Luan River, China | Sediments | 16 | 20.9–287 | 115.3 | [37] |
| Bank soils | 36.9–378 | 141.4 | |||
| Soltan Abad River, Iran | Sediments | 16 | 180.3–36 | 264.55 | [47] |
| Open-pit coal mine, soil, China | 0–20 cm | 16 | 2160–335 | 11,940 | [31] |
| 20–50 cm | 16 | 230–369 | 9210 | ||
| 50–100 cm | 16 | 60–36,460 | 6590 | ||
| Czech Republic | Agricultural soil | 16 | 861–10,840 | 5527 | [48] |
| Forest soils | 7657–79,385 | 25,510 | |||
| Forest of the São Paulo State, Brazil | Cunha | 16 | 180 | [49] | |
| PEFI | 818 | ||||
| Agricultural soils, South Korea | Paddy soil | 16 | 38.3–1057 | 209 | [50] |
| Upland soil | 23.3–2834 | 270 | |||
| Three Gorges Dam region, China | Agricultural soils | 16 | 277.79–3217.20 | 1023.48 | [15] |
| East Lake, China | Sediments | 16 | 10.9–2478.10 | 685.8 | [31] |
| Dongjiang River, China | Sediments | 16 | 100–3400 | 880 | [51] |
| North Pacific Ocean | Surface soils | 16 | 3.55–3200 | 198 | [11] |
| Samples | Phe/Ant | BaA/Chr | BaA/BaA+Chr | Flu/Pyr | Ant/Ant+Phe | Flu/Flu+Pyr | ∑other PAHs | ∑LMW PAH | PI (LMW/HMW) | TI |
|---|---|---|---|---|---|---|---|---|---|---|
| 1 | 3.88 | 1.67 | 0.63 | 0.35 | 0.20 | 0.26 | 31.77 | 10.71 | 0.34 | 5.82 |
| 2 | 0.86 | 0.37 | 0.27 | 0.39 | 0.54 | 0.28 | 62.39 | 30.84 | 0.49 | 7.44 |
| 3 | 1.56 | 4.89 | 0.83 | 0.35 | 0.39 | 0.26 | 82.17 | 20.23 | 0.25 | 8.70 |
| 4 | 0.92 | 0.41 | 0.29 | 0.15 | 0.52 | 0.13 | 18.15 | 4.23 | 0.23 | 7.01 |
| 5 | 1.02 | 0.57 | 0.36 | 0.42 | 0.50 | 0.30 | 70.44 | 33.15 | 0.47 | 7.53 |
| 6 | 4.14 | 0.26 | 0.20 | 0.35 | 0.19 | 0.26 | 115.64 | 66.35 | 0.57 | 3.62 |
| 7 | 8.39 | 0.63 | 0.39 | 0.89 | 0.11 | 0.47 | 182.95 | 74.46 | 0.41 | 4.18 |
| 8 | 5.49 | 9.23 | 0.90 | 0.40 | 0.15 | 0.28 | 103.53 | 46.80 | 0.45 | 6.76 |
| 9 | 1.01 | 0.69 | 0.41 | 0.60 | 0.50 | 0.37 | 87.52 | 29.13 | 0.33 | 7.96 |
| 10 | 3.23 | 0.24 | 0.19 | 0.21 | 0.24 | 0.17 | 44.81 | 37.67 | 0.84 | 3.76 |
| 11 | 0.90 | 0.20 | 0.17 | 0.38 | 0.53 | 0.28 | 236.33 | 94.18 | 0.40 | 6.79 |
| 12 | 5.14 | 1.08 | 0.52 | 0.33 | 0.16 | 0.25 | 189.32 | 60.33 | 0.32 | 4.84 |
| 13 | 1.19 | 0.66 | 0.40 | 0.64 | 0.46 | 0.39 | 128.66 | 59.08 | 0.46 | 7.52 |
| 14 | 0.91 | 0.85 | 0.46 | 0.28 | 0.52 | 0.22 | 59.46 | 13.68 | 0.23 | 8.08 |
| 15 | 1.42 | 0.61 | 0.38 | 0.20 | 0.41 | 0.17 | 82.37 | 24.47 | 0.30 | 6.45 |
| 16 | 0.73 | 6.59 | 0.87 | 1.06 | 0.58 | 0.51 | 84.48 | 35.49 | 0.42 | 11.42 |
| 17 | 10.52 | 0.69 | 0.41 | 0.62 | 0.09 | 0.38 | 87.16 | 52.74 | 0.61 | 3.86 |
| 18 | 0.79 | 4.84 | 1.00 | 0.26 | 0.56 | 0.20 | 118.78 | 21.14 | 0.18 | 11.10 |
| Sum | 52.09 | 34.49 | 8.68 | 7.87 | 6.5 | 5.19 | 1785.9 | 714.67 | 7.29 | 122.8 |
| PAHs | PAH Quality Values | 0–10 cm | 10–20 cm | ||||||||
|---|---|---|---|---|---|---|---|---|---|---|---|
| NCs µg kg−1 | MPCs µg kg−1 | TEF | AvCPAHs µg kg−1 | RQ(NCs) | RQ(MPCs) | TEQ | AvCPAHs µg kg−1 | RQ(NCs) | RQ(MPCs) | TEQ | |
| Nap | 1.4 | 140 | 0.001 | 3.93 | 2.81 | 0.028 | 0.004 | 1.80 | 1.29 | 0.013 | 0.002 |
| Acy | 1.2 | 120 | 0.001 | 7.51 | 6.26 | 0.063 | 0.008 | 7.98 | 6.65 | 0.066 | 0.008 |
| Ace | 1.2 | 120 | 0.001 | 26.31 | 21.92 | 0.219 | 0.026 | 23.31 | 19.42 | 0.194 | 0.023 |
| Flr | 2.6 | 260 | 0.001 | 19.79 | 0.76 | 0.008 | 0.020 | 30.56 | 1.18 | 0.012 | 0.031 |
| Phe | 5.1 | 510 | 0.001 | 10.59 | 2.08 | 0.021 | 0.011 | 16.41 | 3.22 | 0.032 | 0.016 |
| Ant | 1.2 | 120 | 0.01 | 4.88 | 4.07 | 0.041 | 0.049 | 11.41 | 9.51 | 0.095 | 0.114 |
| Flu | 2.6 | 260 | 0.001 | 7.74 | 0.30 | 0.003 | 0.008 | 8.31 | 0.32 | 0.003 | 0.008 |
| Pyr | 1.2 | 120 | 0.001 | 15.27 | 12.73 | 0.127 | 0.015 | 20.24 | 16.87 | 0.169 | 0.020 |
| BaA | 2.5 | 250 | 0.1 | 3.51 | 1.40 | 0.014 | 0.351 | 4.69 | 1.88 | 0.019 | 0.469 |
| Chr | 107 | 10,700 | 0.01 | 5.39 | 0.50 | 0.001 | 0.054 | 6.30 | 0.59 | 0.001 | 0.063 |
| BaP | 2.6 | 260 | 1 | 34.01 | 13.08 | 0.131 | 34.01 | 23.98 | 9.22 | 0.092 | 23.98 |
| Sum | 128.6 | 12,860 | 1.127 | 138.92 | 65.90 | 0.655 | 34.55 | 154.99 | 70.13 | 0.696 | 24.74 |
© 2018 by the authors. Licensee MDPI, Basel, Switzerland. This article is an open access article distributed under the terms and conditions of the Creative Commons Attribution (CC BY) license (http://creativecommons.org/licenses/by/4.0/).
Share and Cite
Gereslassie, T.; Workineh, A.; Liu, X.; Yan, X.; Wang, J. Occurrence and Ecological and Human Health Risk Assessment of Polycyclic Aromatic Hydrocarbons in Soils from Wuhan, Central China. Int. J. Environ. Res. Public Health 2018, 15, 2751. https://0-doi-org.brum.beds.ac.uk/10.3390/ijerph15122751
Gereslassie T, Workineh A, Liu X, Yan X, Wang J. Occurrence and Ecological and Human Health Risk Assessment of Polycyclic Aromatic Hydrocarbons in Soils from Wuhan, Central China. International Journal of Environmental Research and Public Health. 2018; 15(12):2751. https://0-doi-org.brum.beds.ac.uk/10.3390/ijerph15122751
Chicago/Turabian StyleGereslassie, Tekleweini, Ababo Workineh, Xiaoning Liu, Xue Yan, and Jun Wang. 2018. "Occurrence and Ecological and Human Health Risk Assessment of Polycyclic Aromatic Hydrocarbons in Soils from Wuhan, Central China" International Journal of Environmental Research and Public Health 15, no. 12: 2751. https://0-doi-org.brum.beds.ac.uk/10.3390/ijerph15122751