The Impacts of Transportation Infrastructure on Sustainable Development: Emerging Trends and Challenges

Abstract
:1. Introduction
2. Transportation Infrastructure
2.1. The Definition and Characteristics of Transportation Infrastructure
2.2. The Multiple Impact of Transportation Infrastructure
3. Method
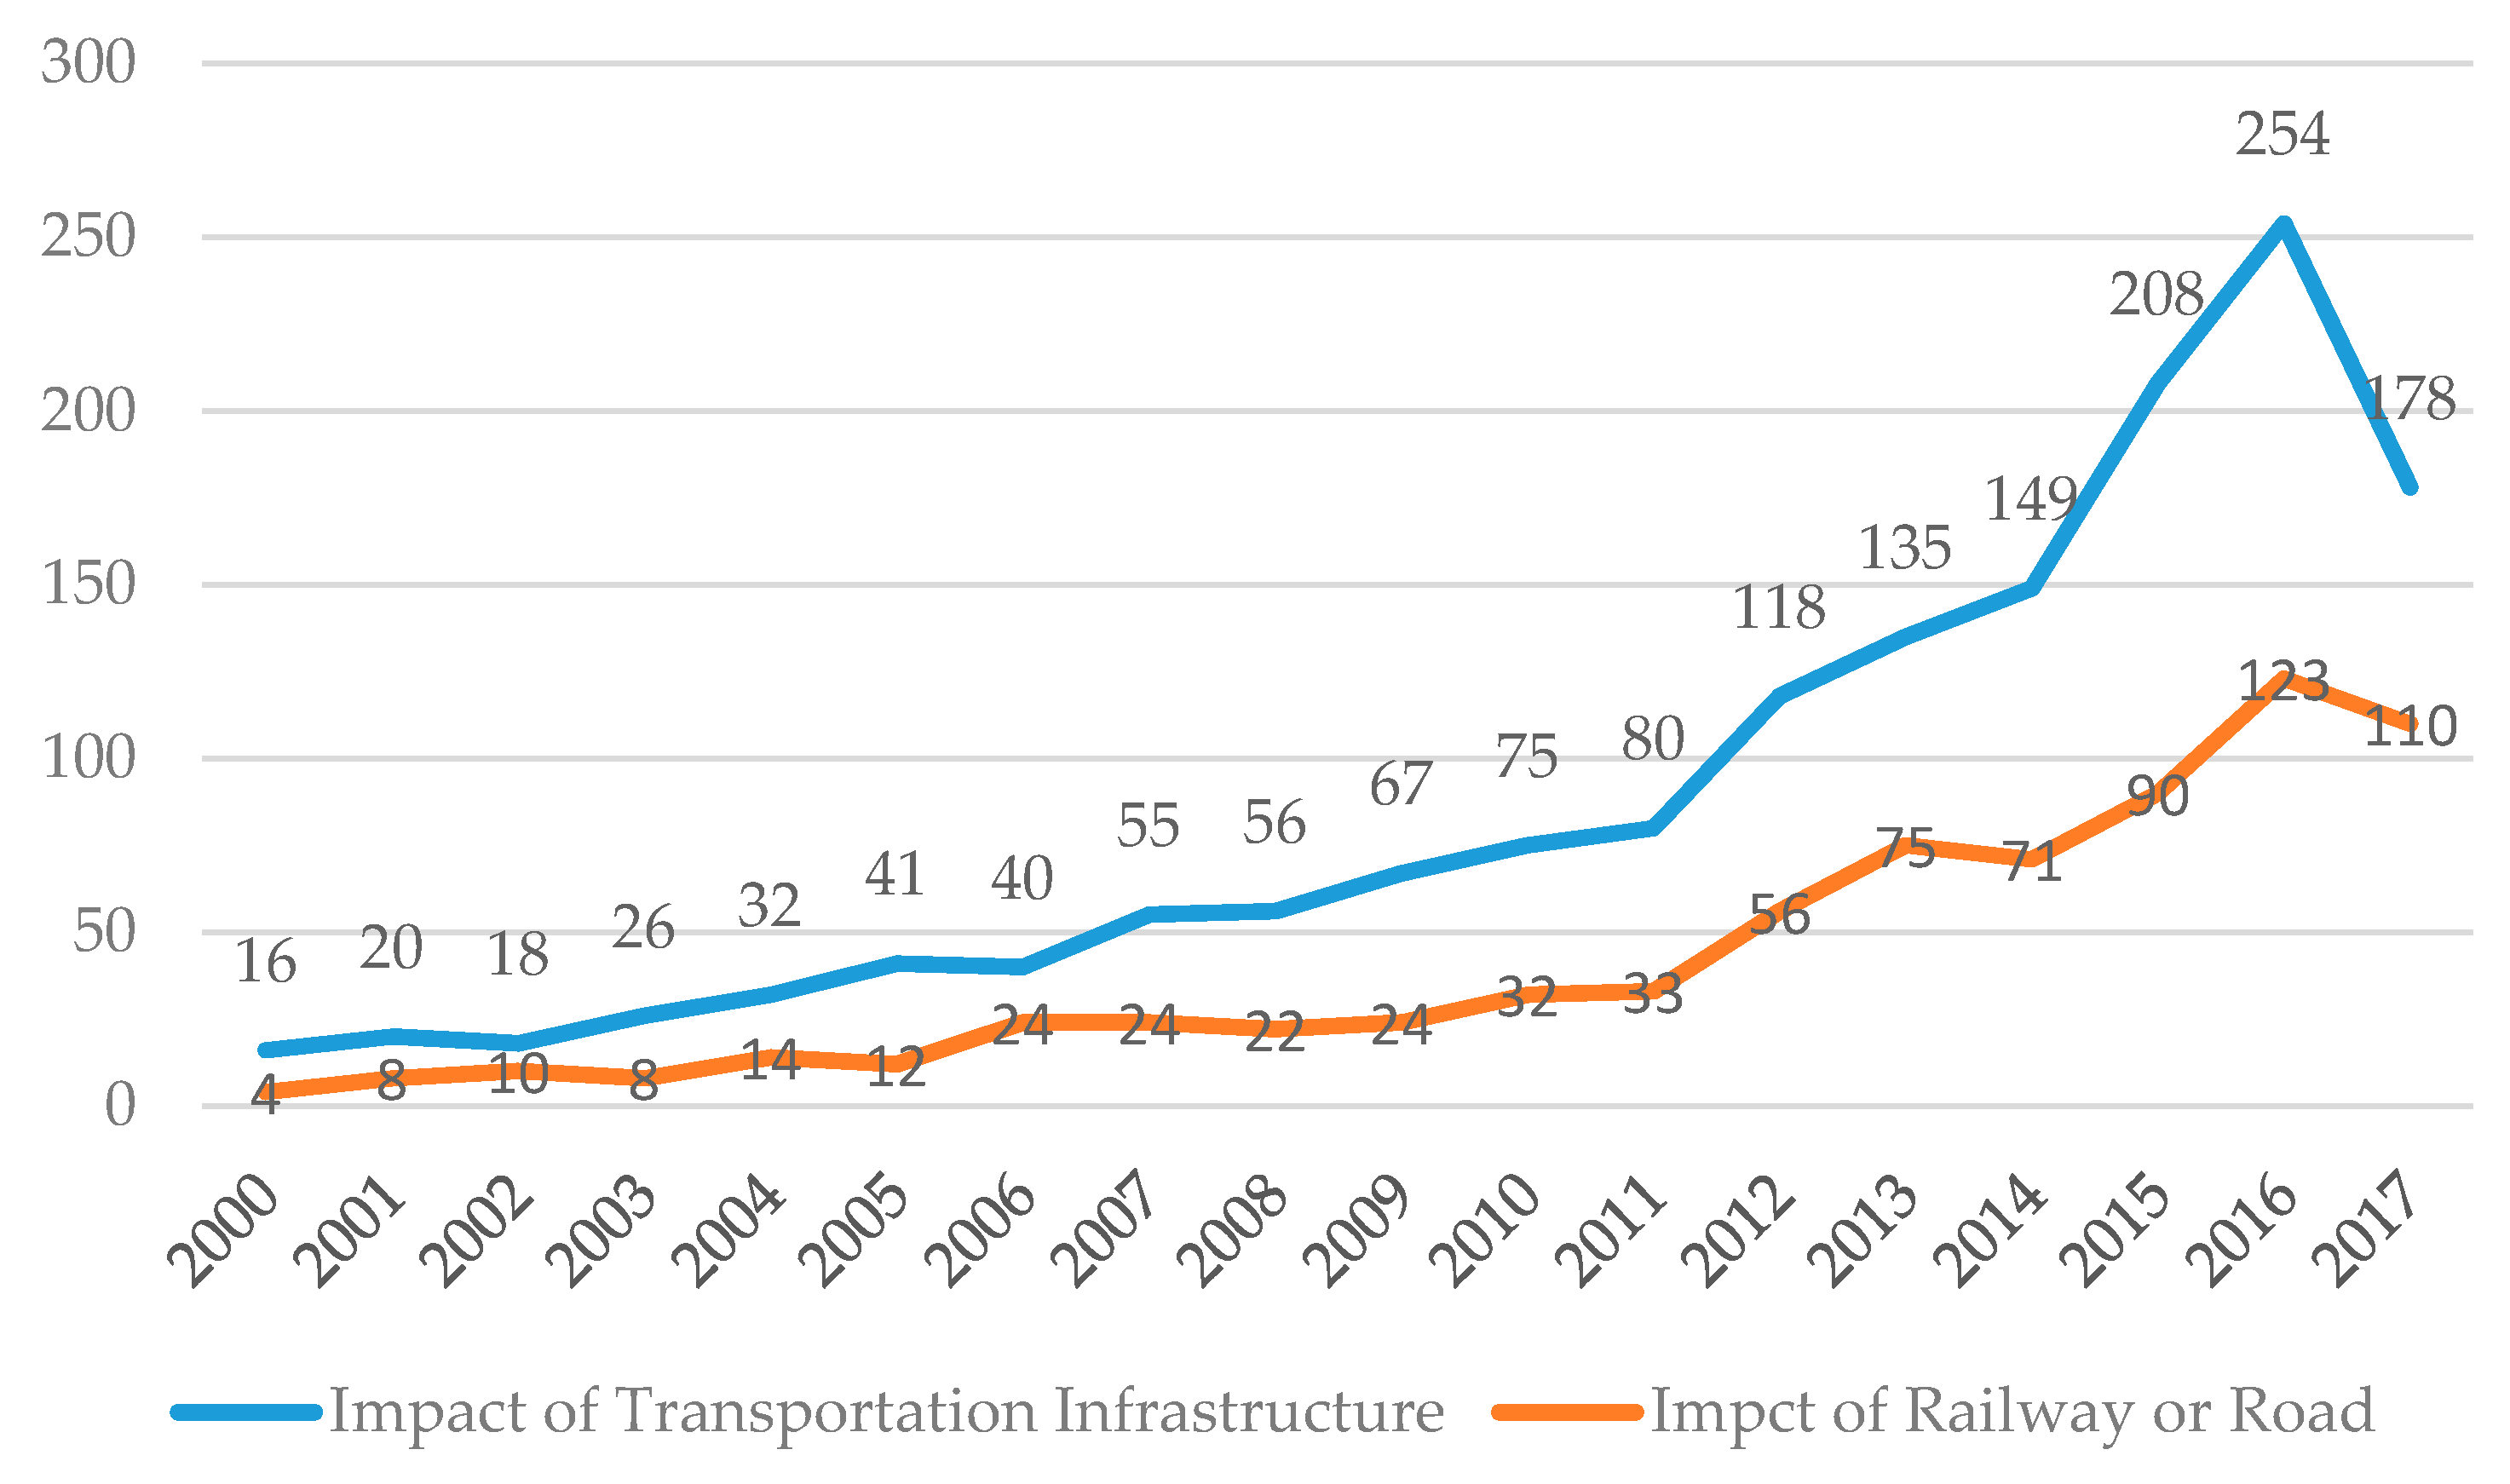
3.1. Data Overview
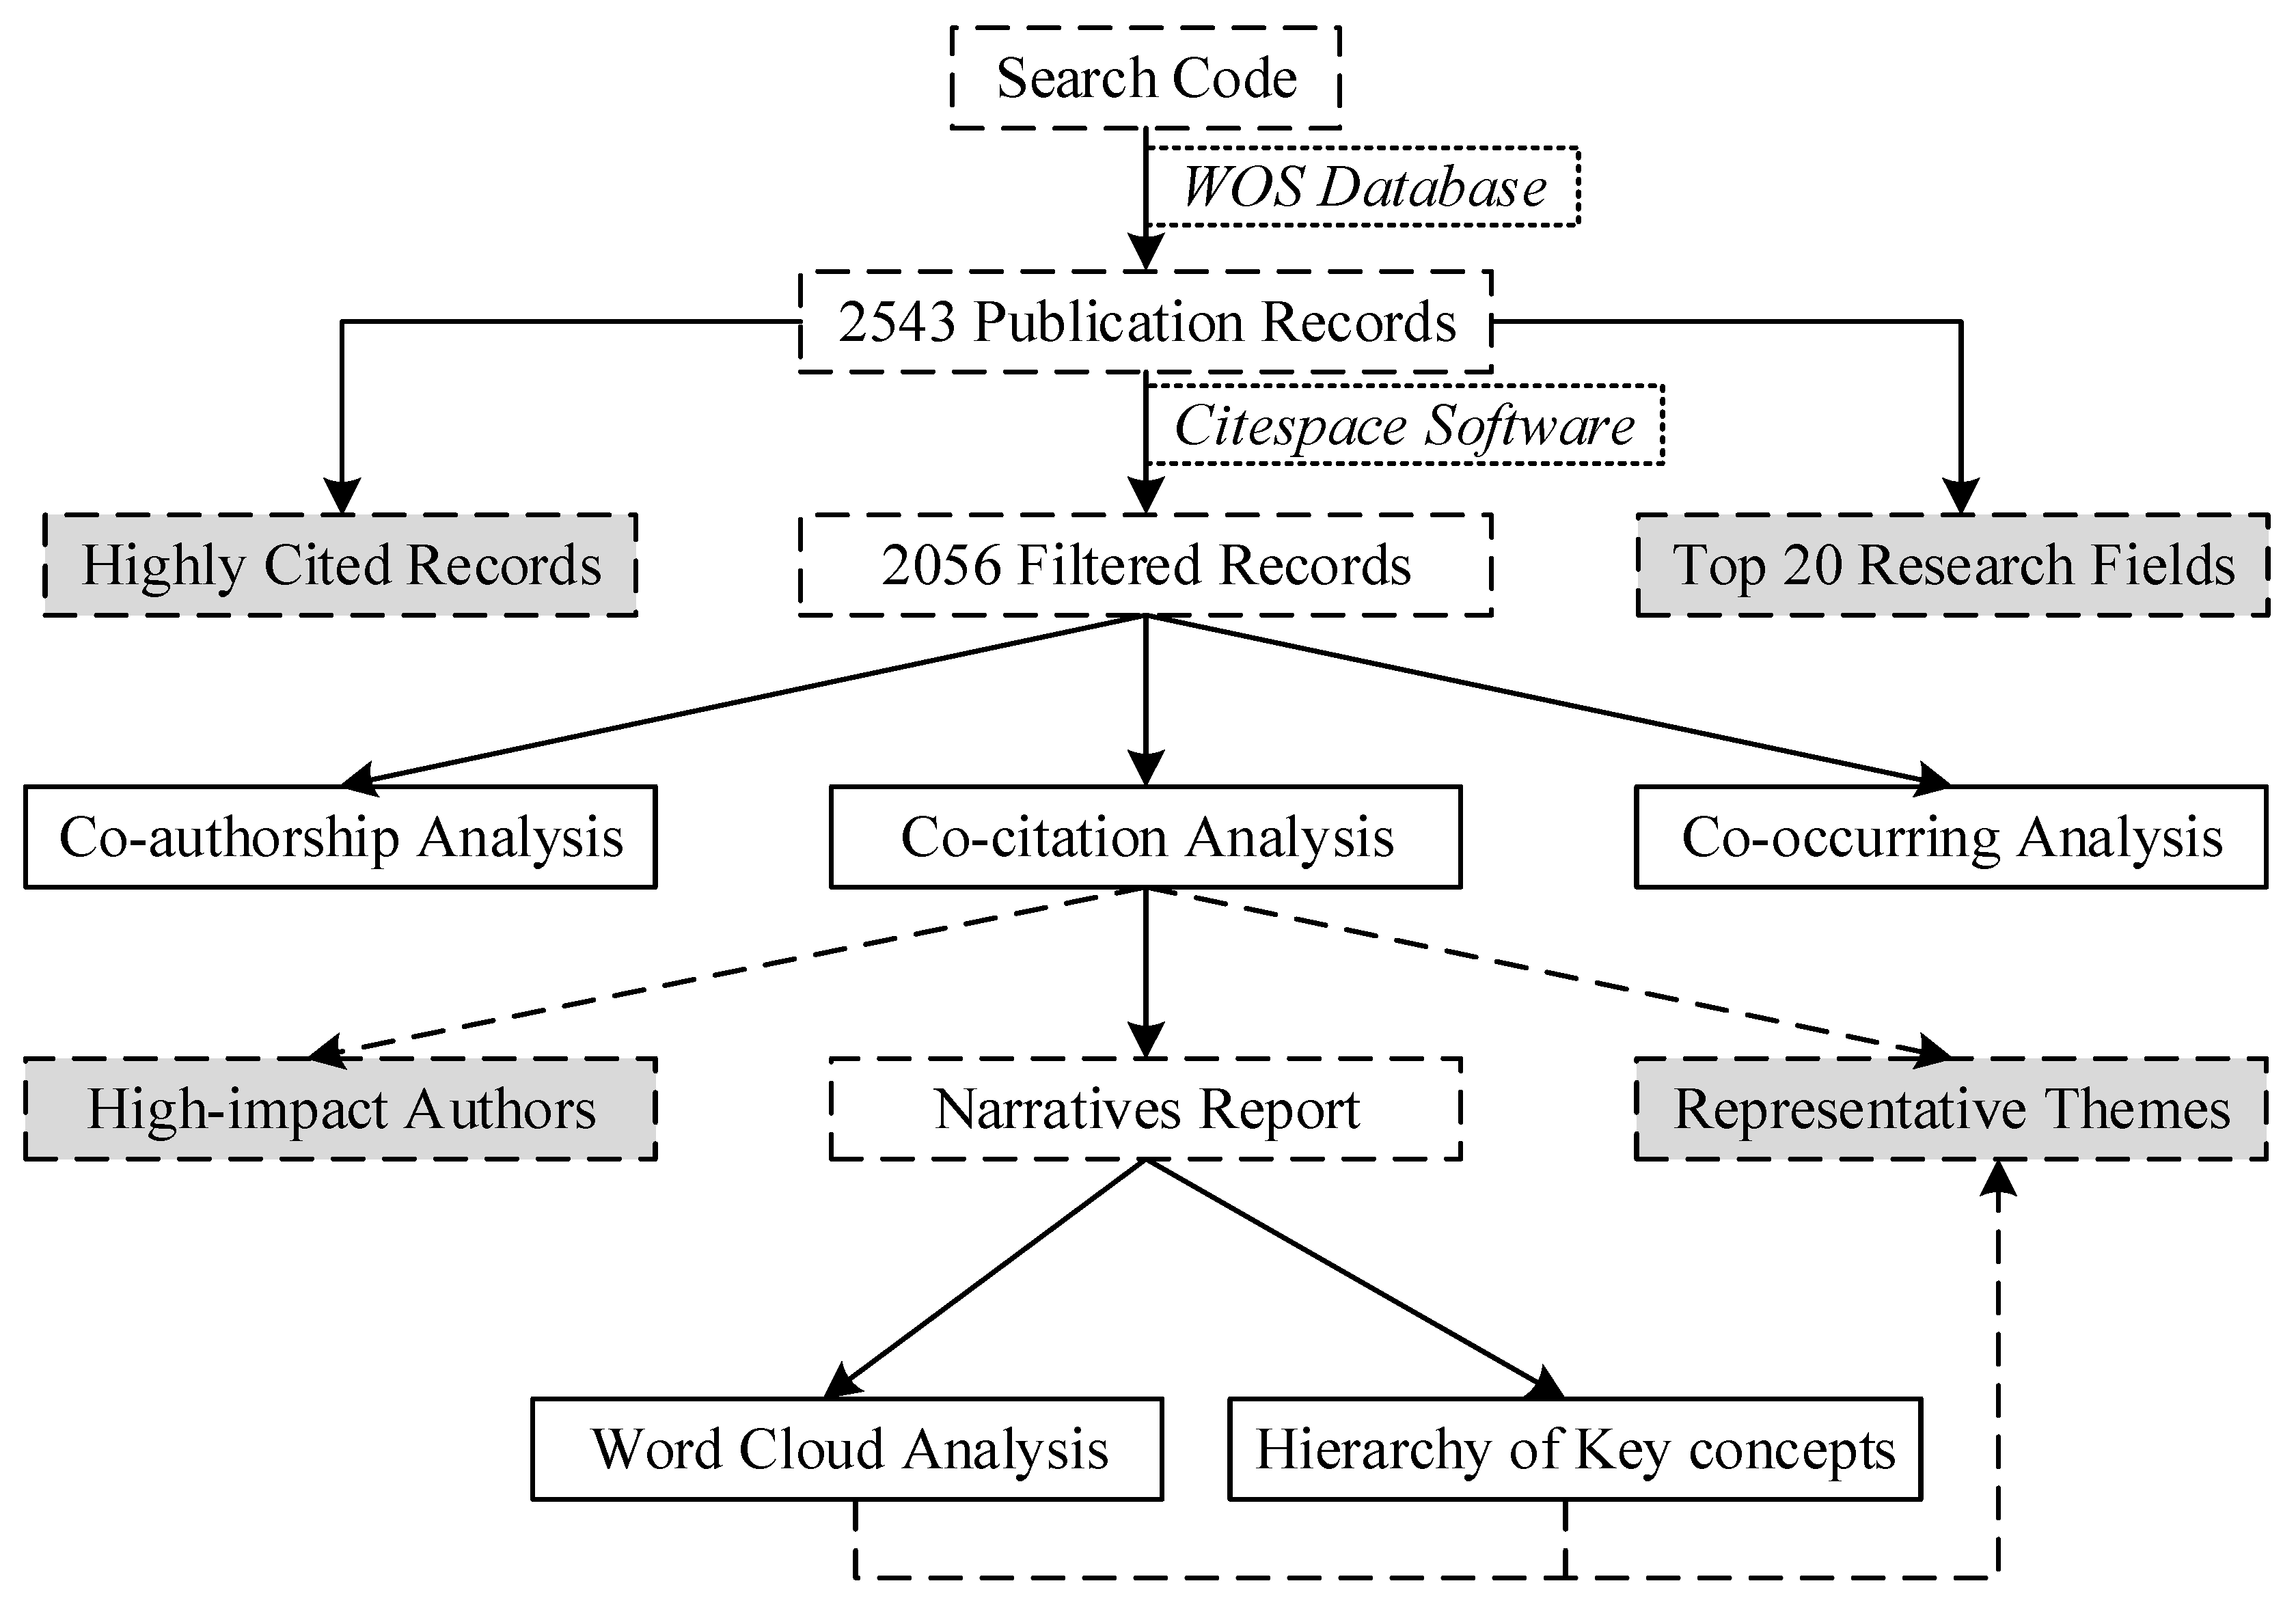
3.2. Scientometric Method
4. Results and Discussion
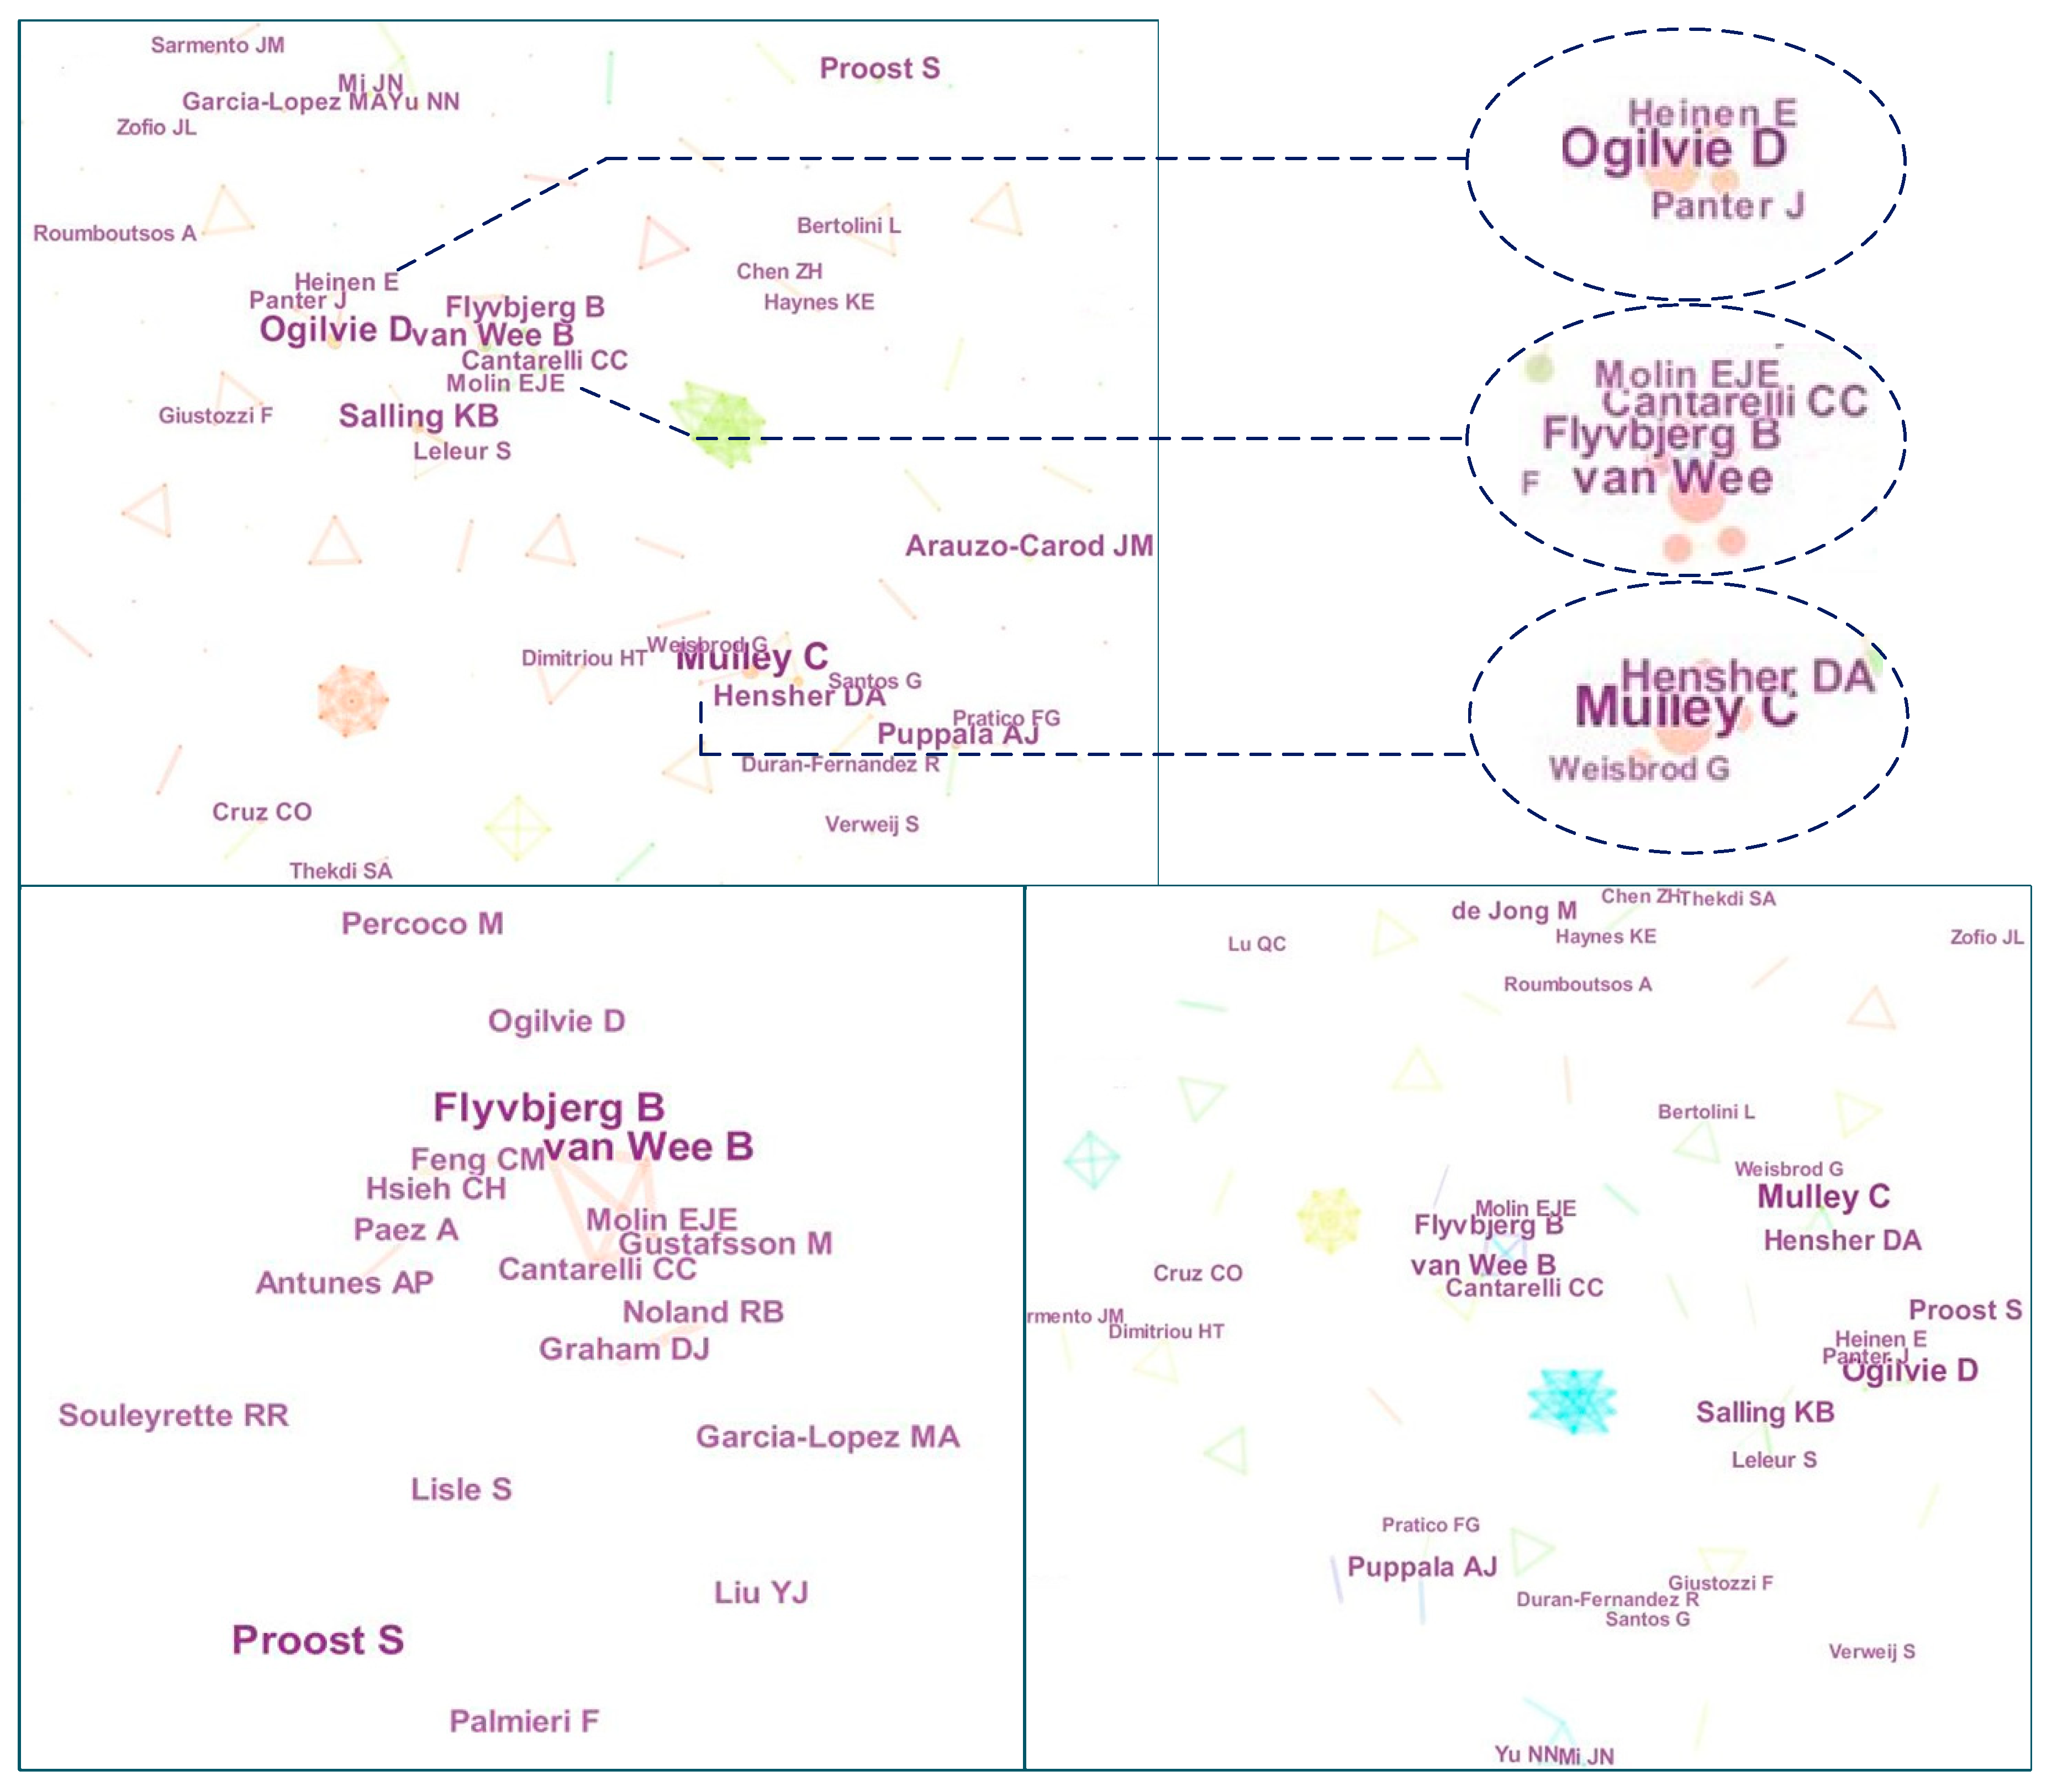
4.1. Co-Authorship Analysis
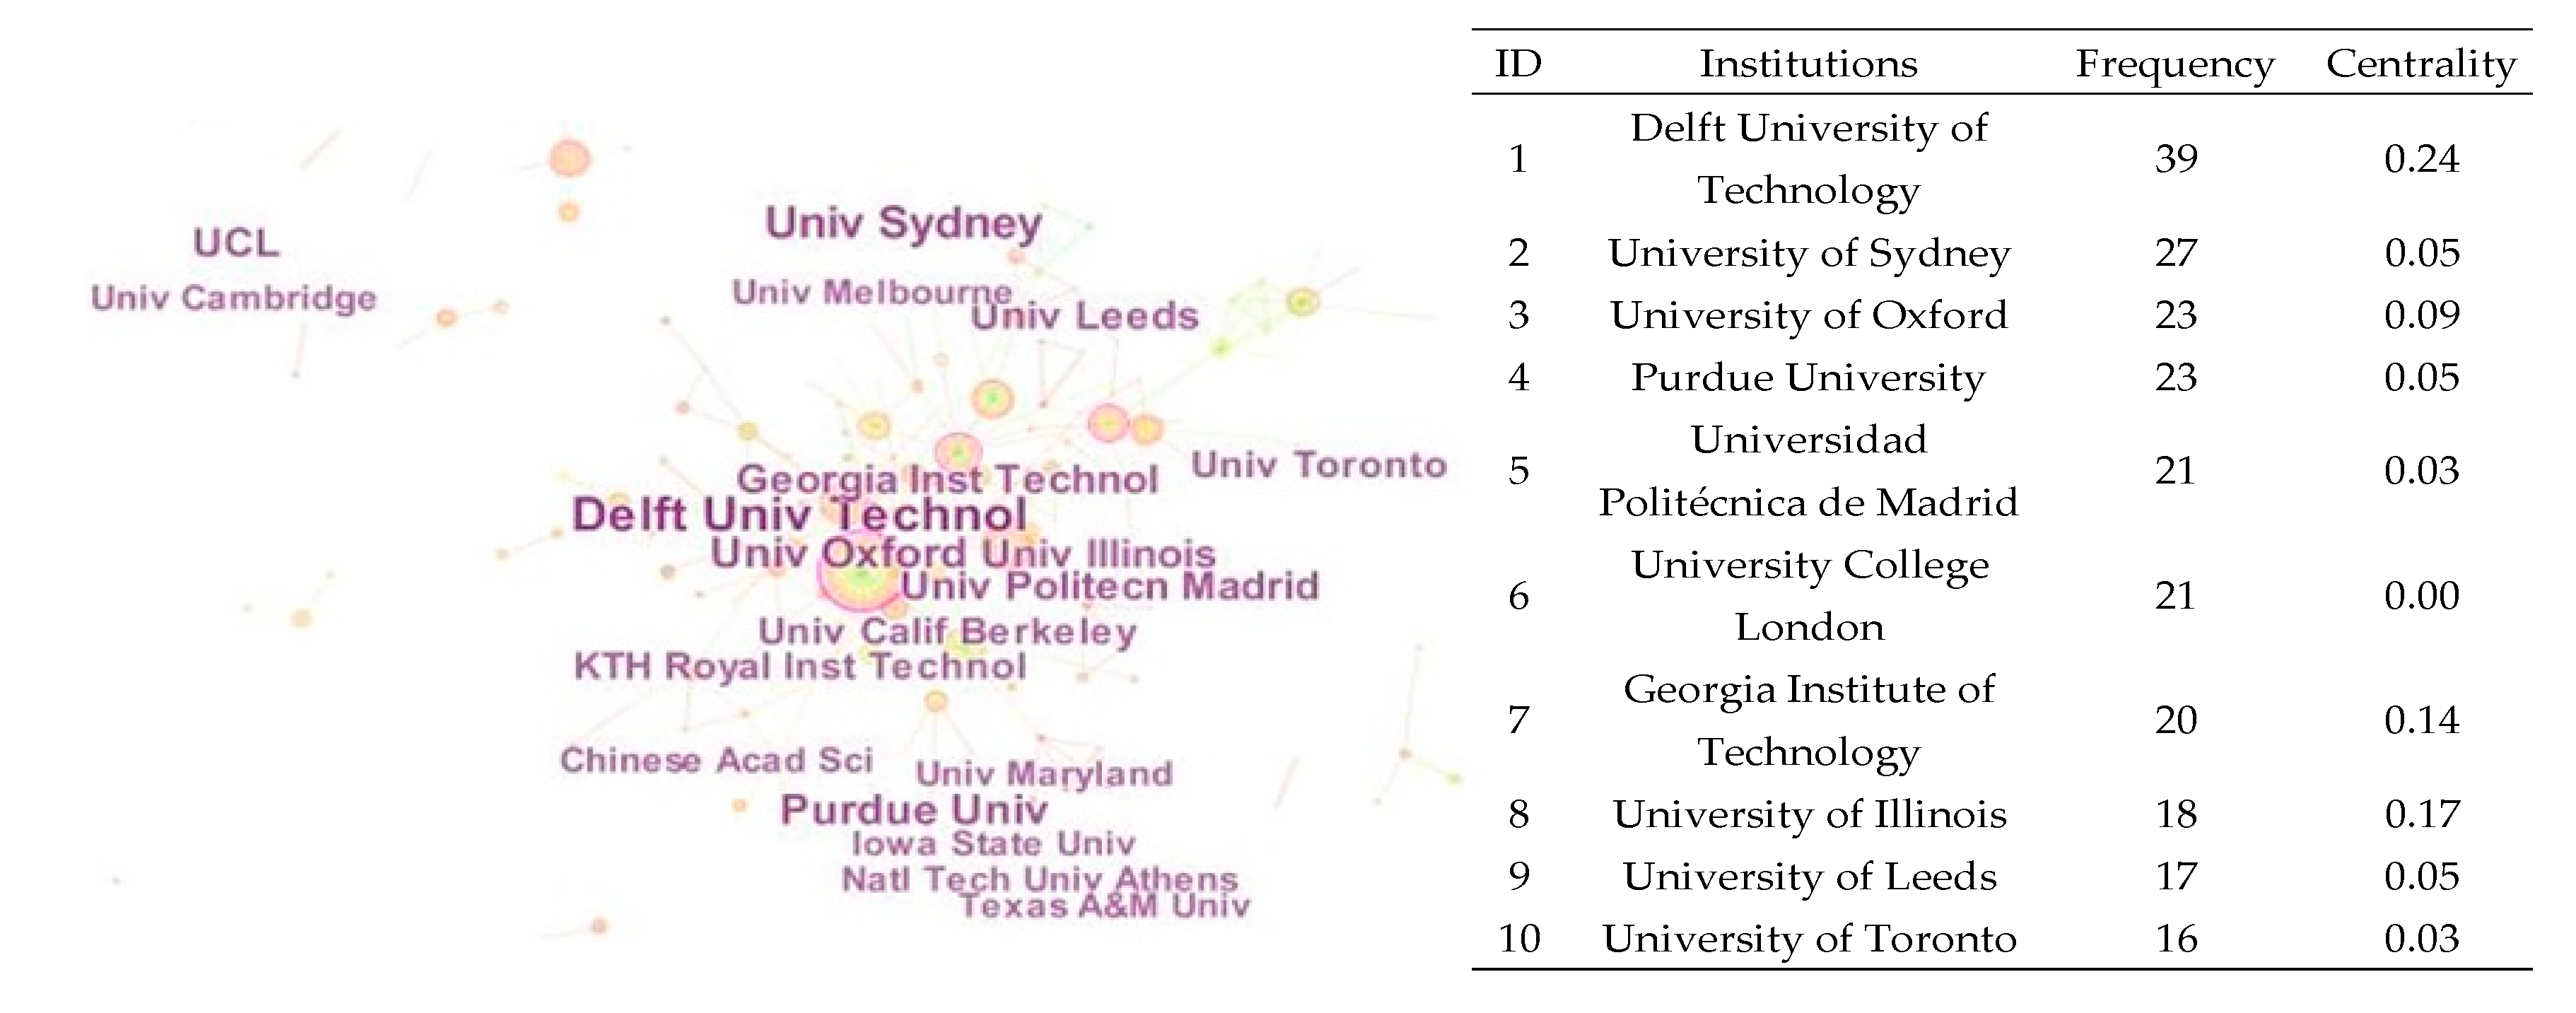
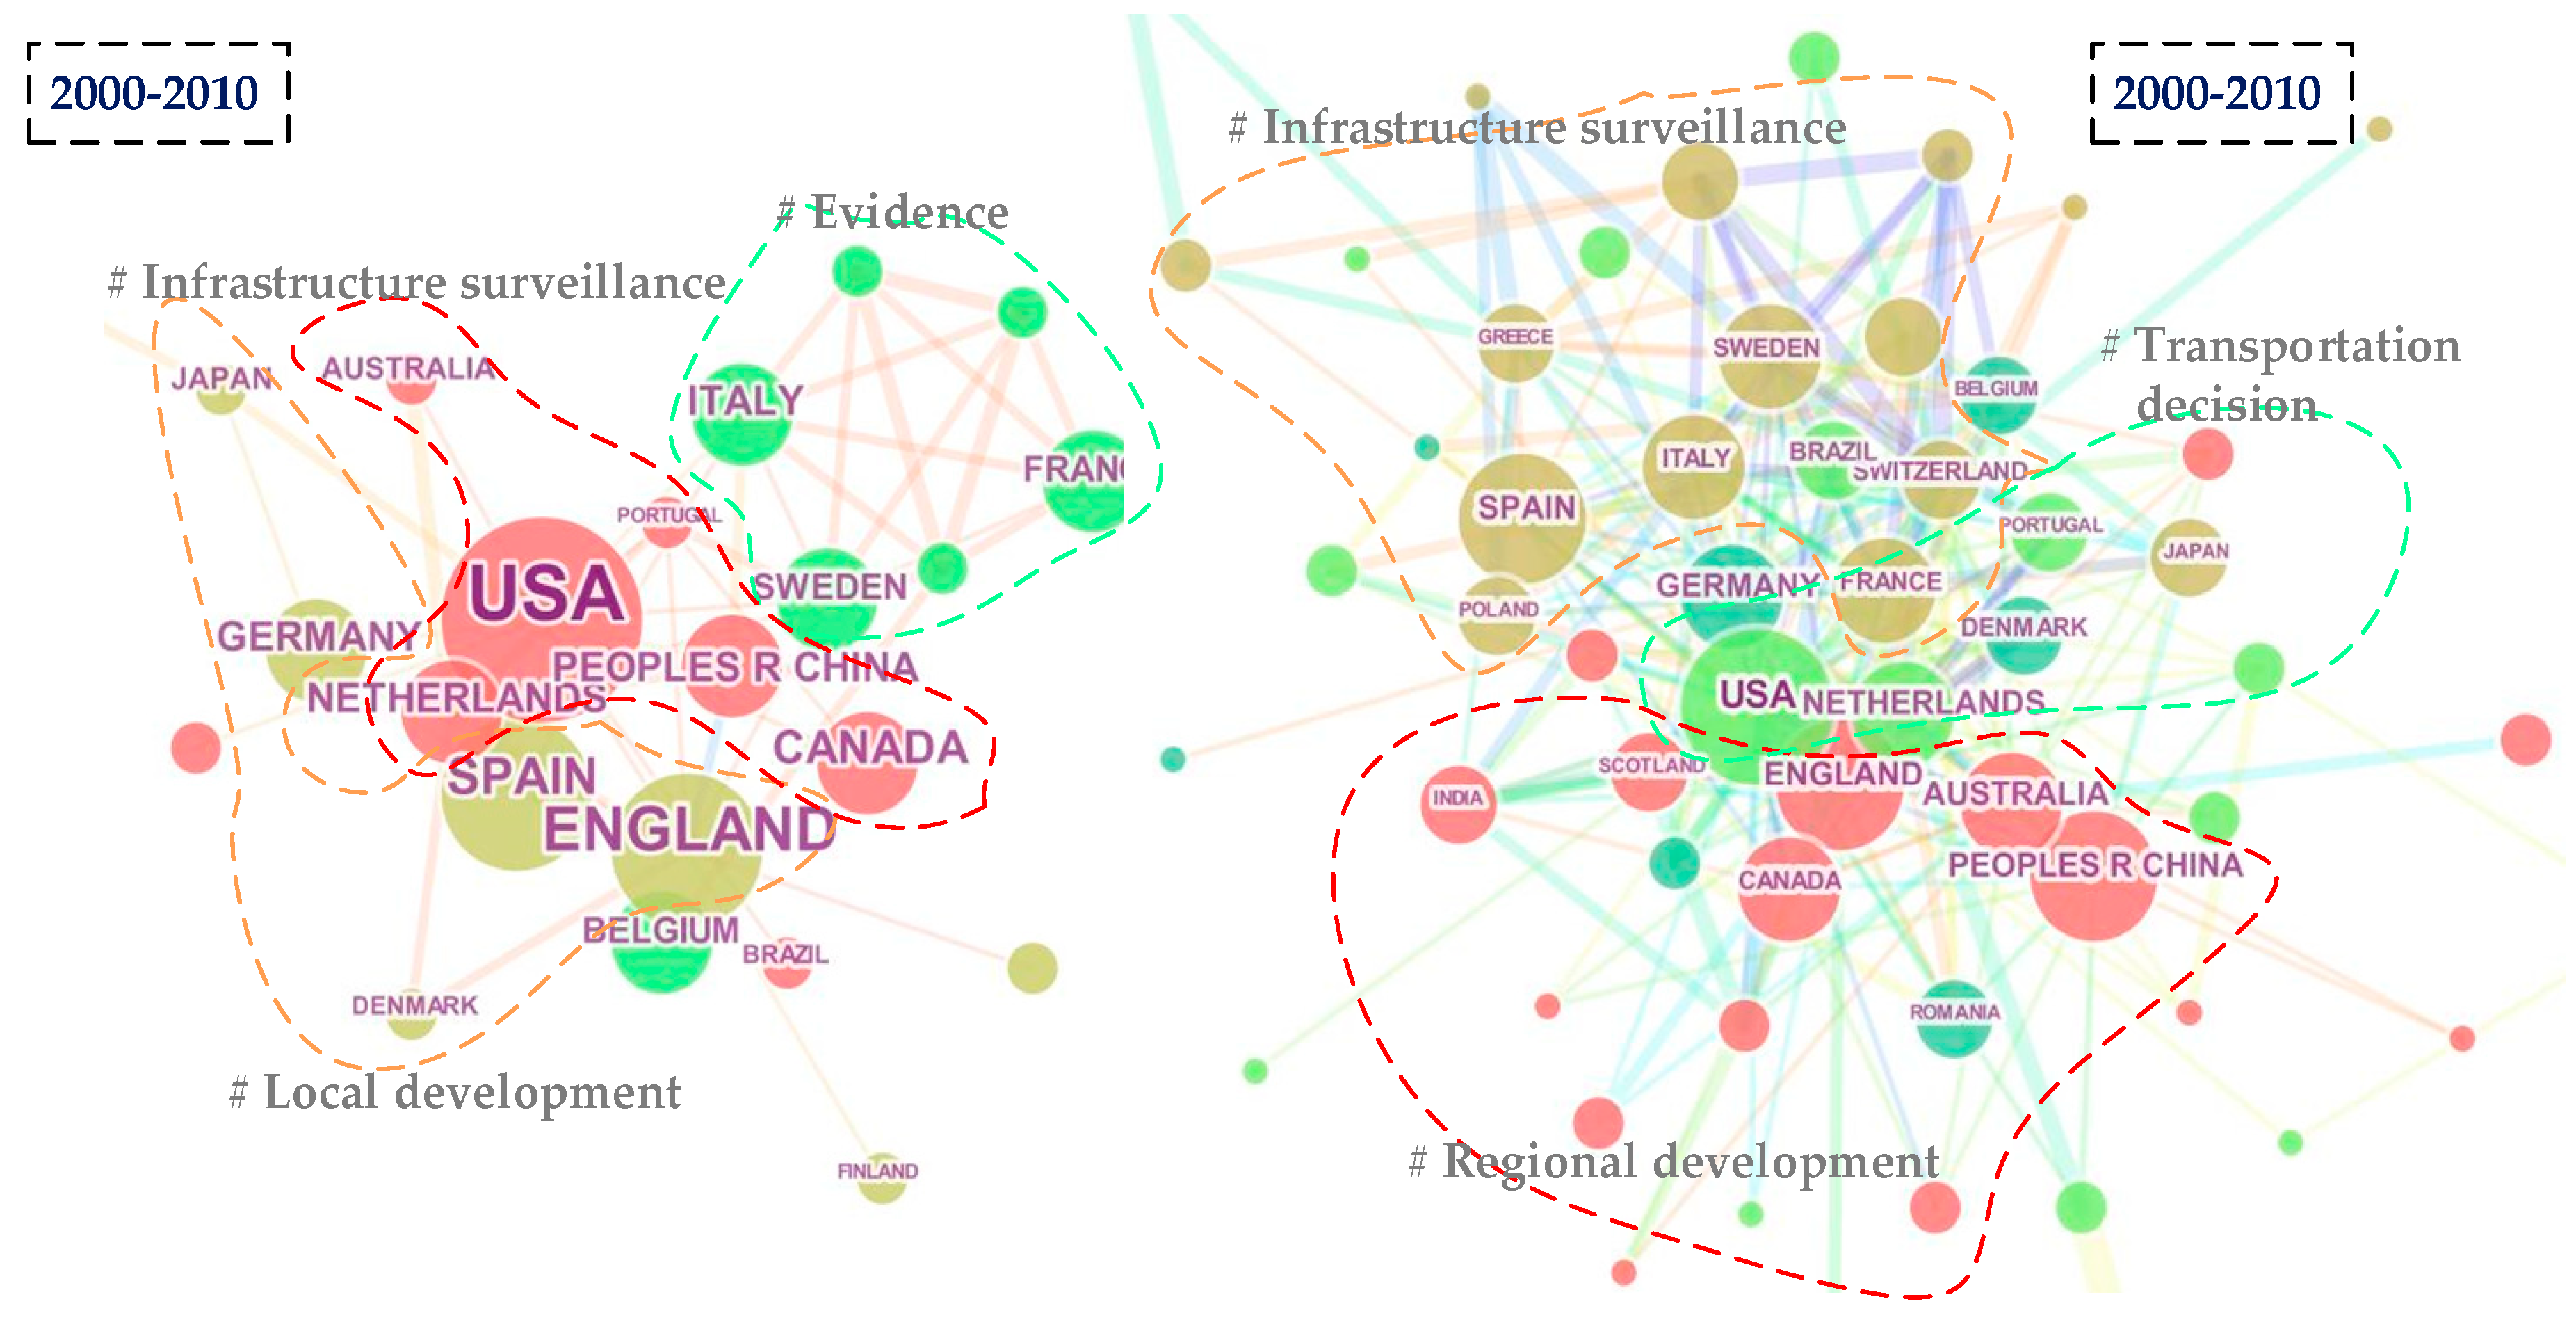
4.2. Co-Author’s Institution and Country Analysis
4.3. Co-Occurring ANALYSIS
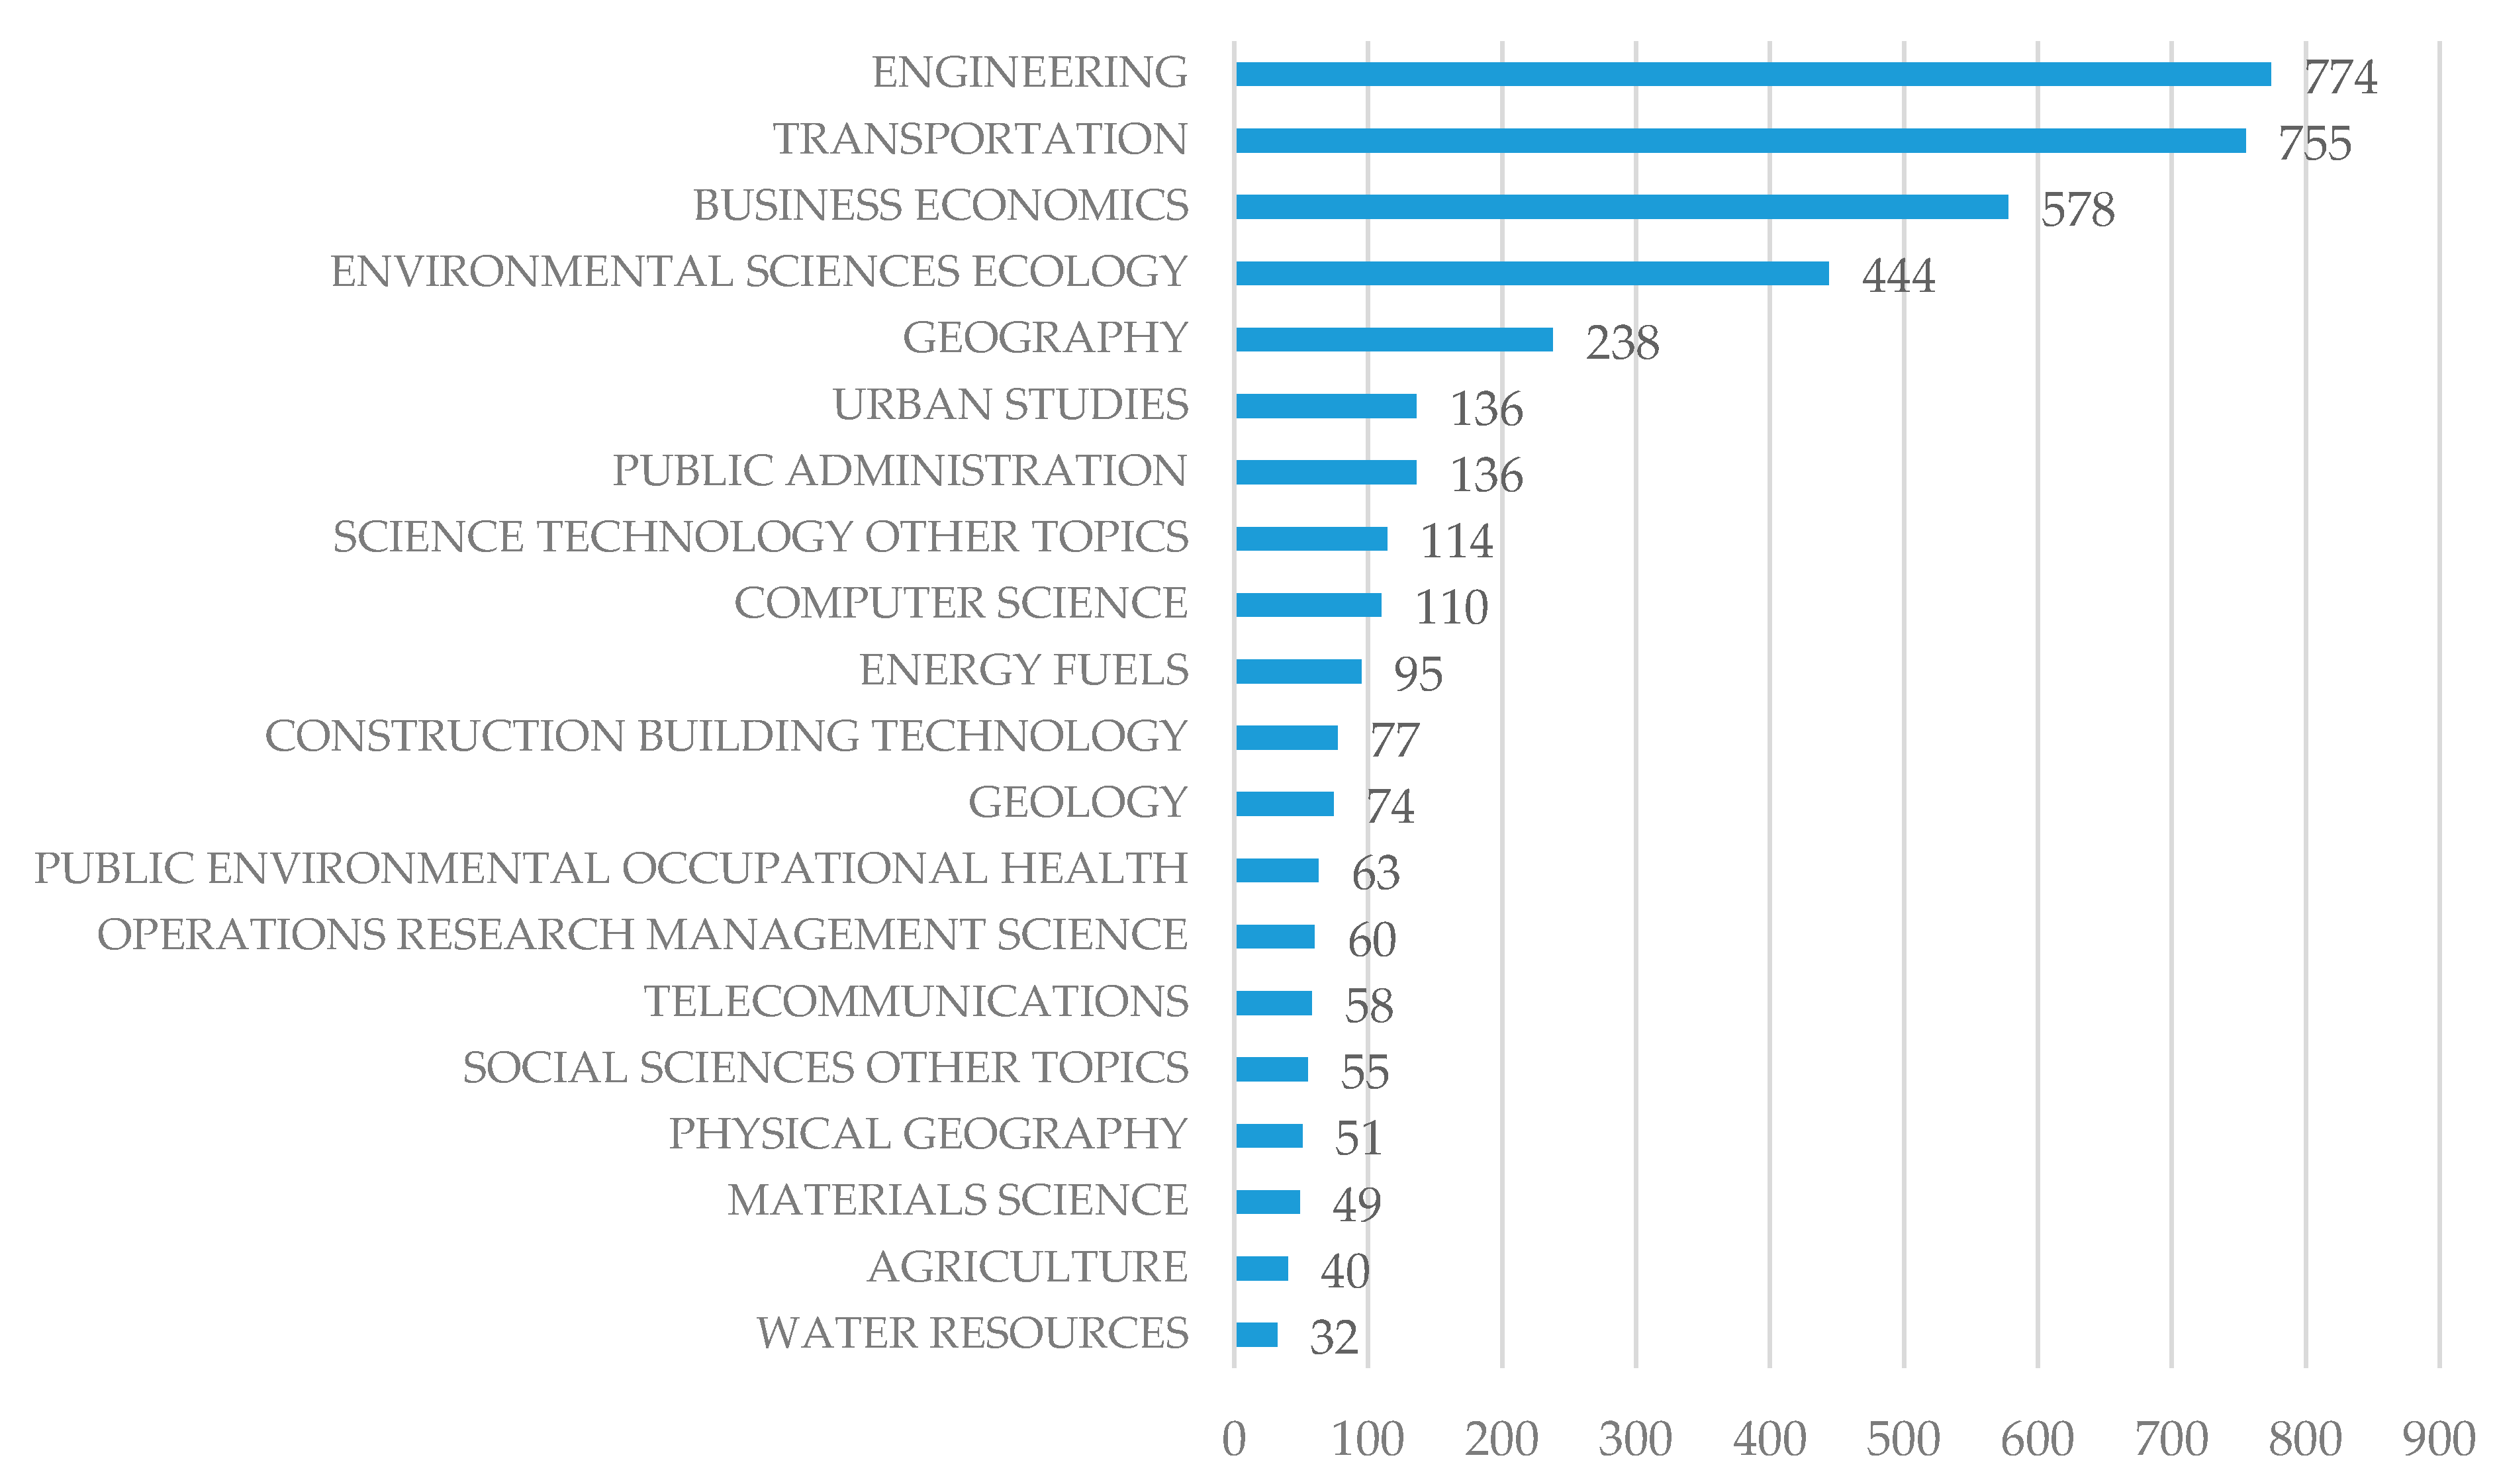
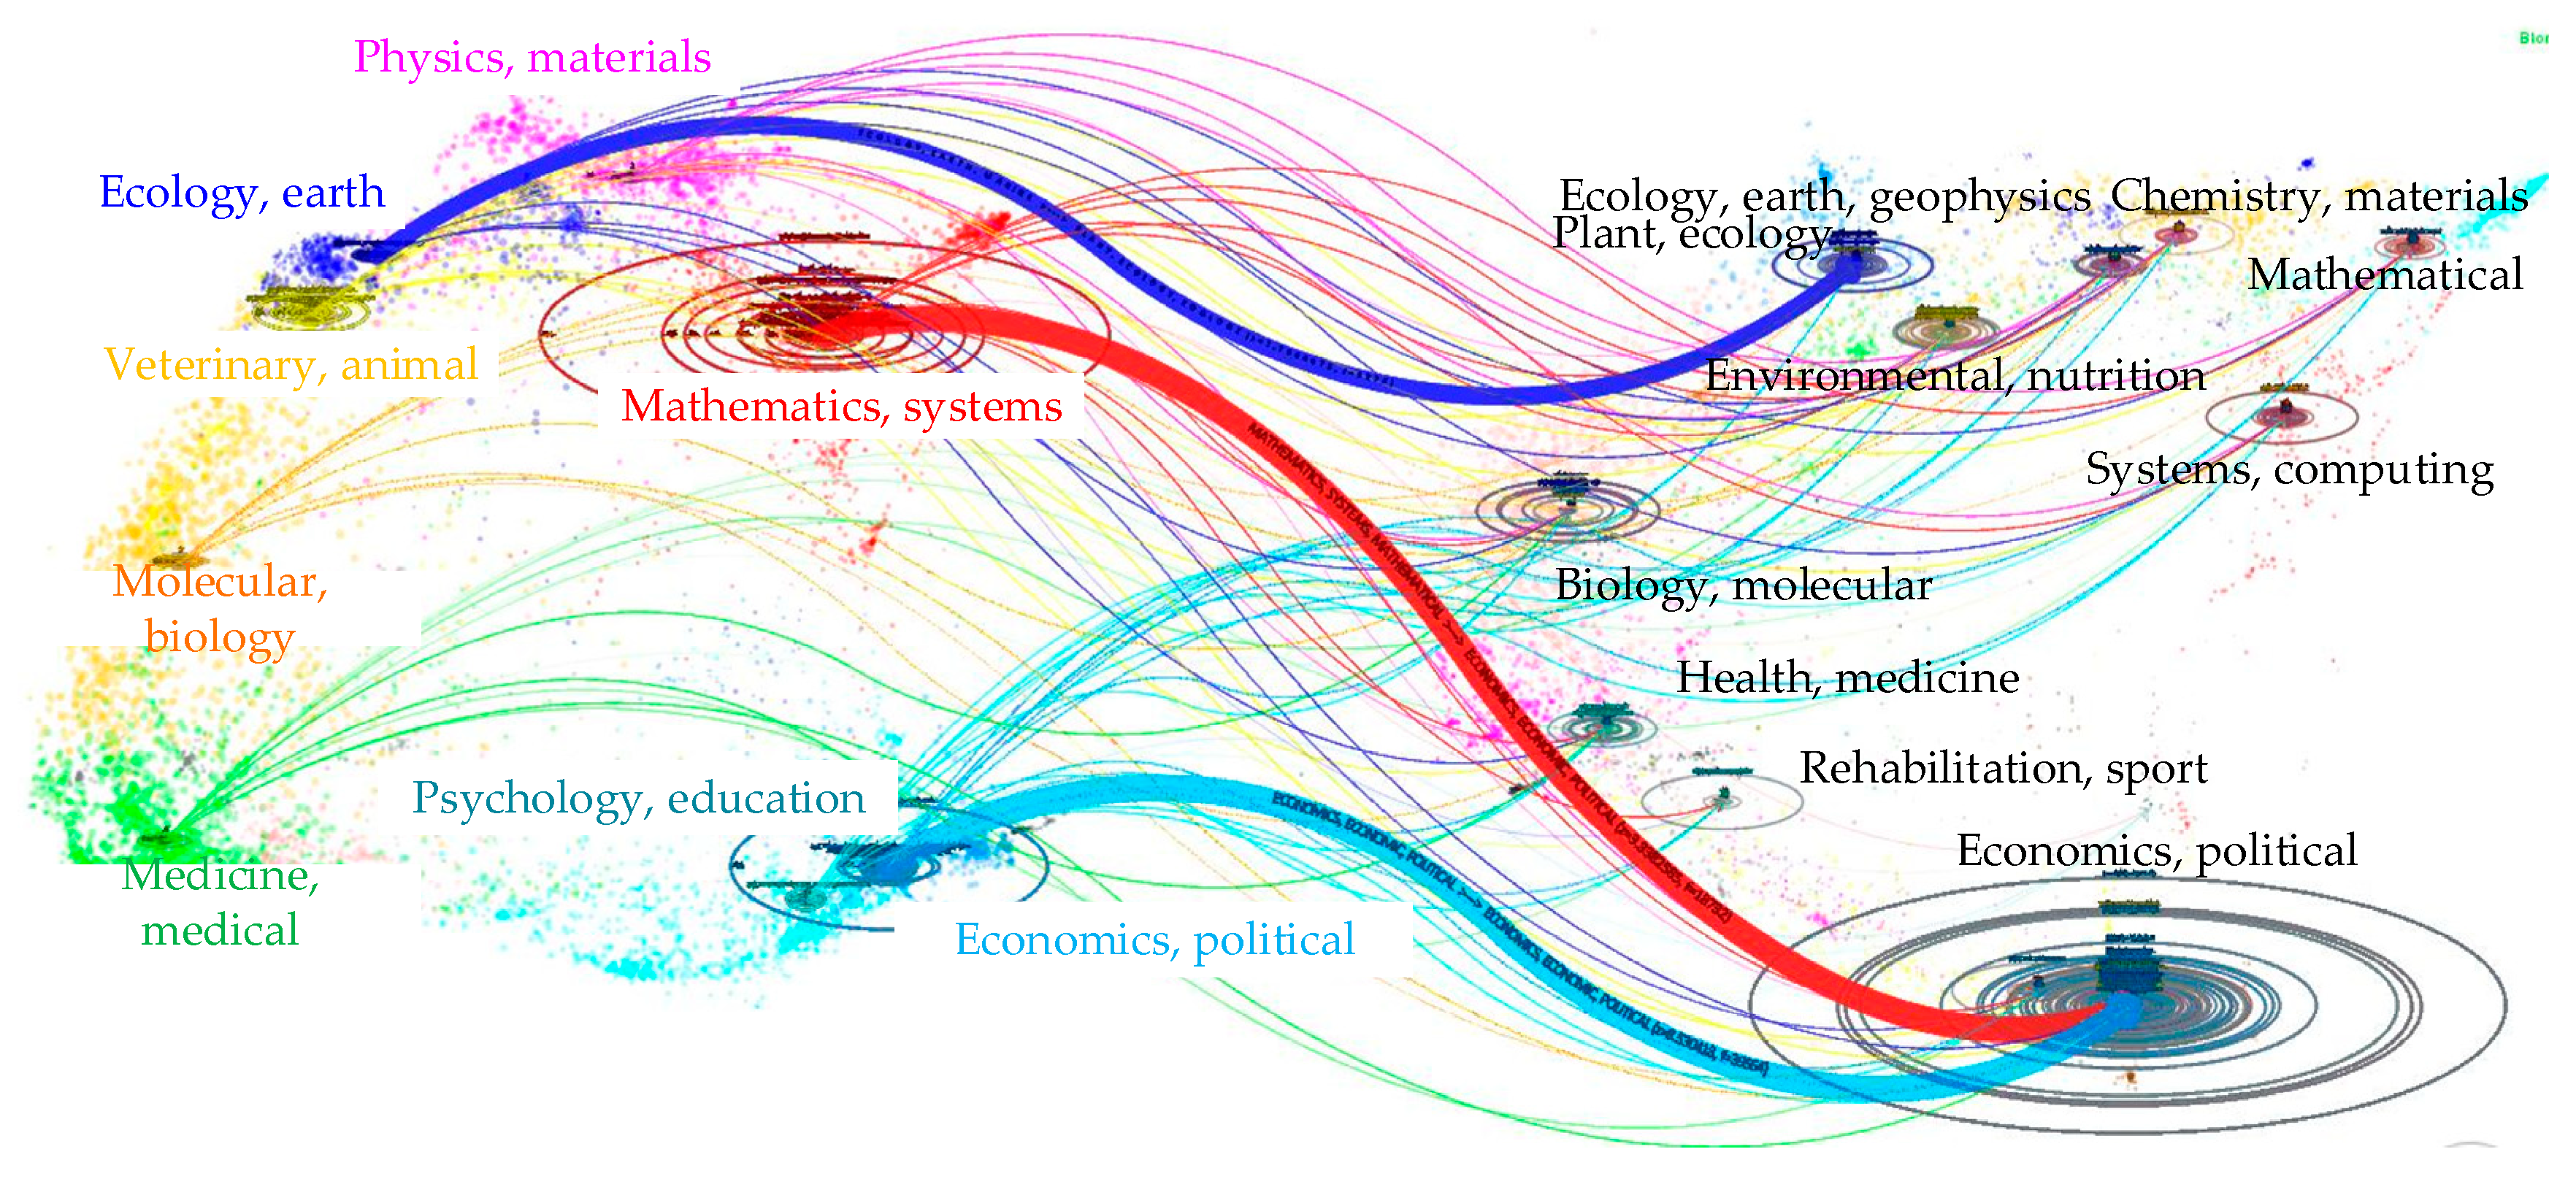
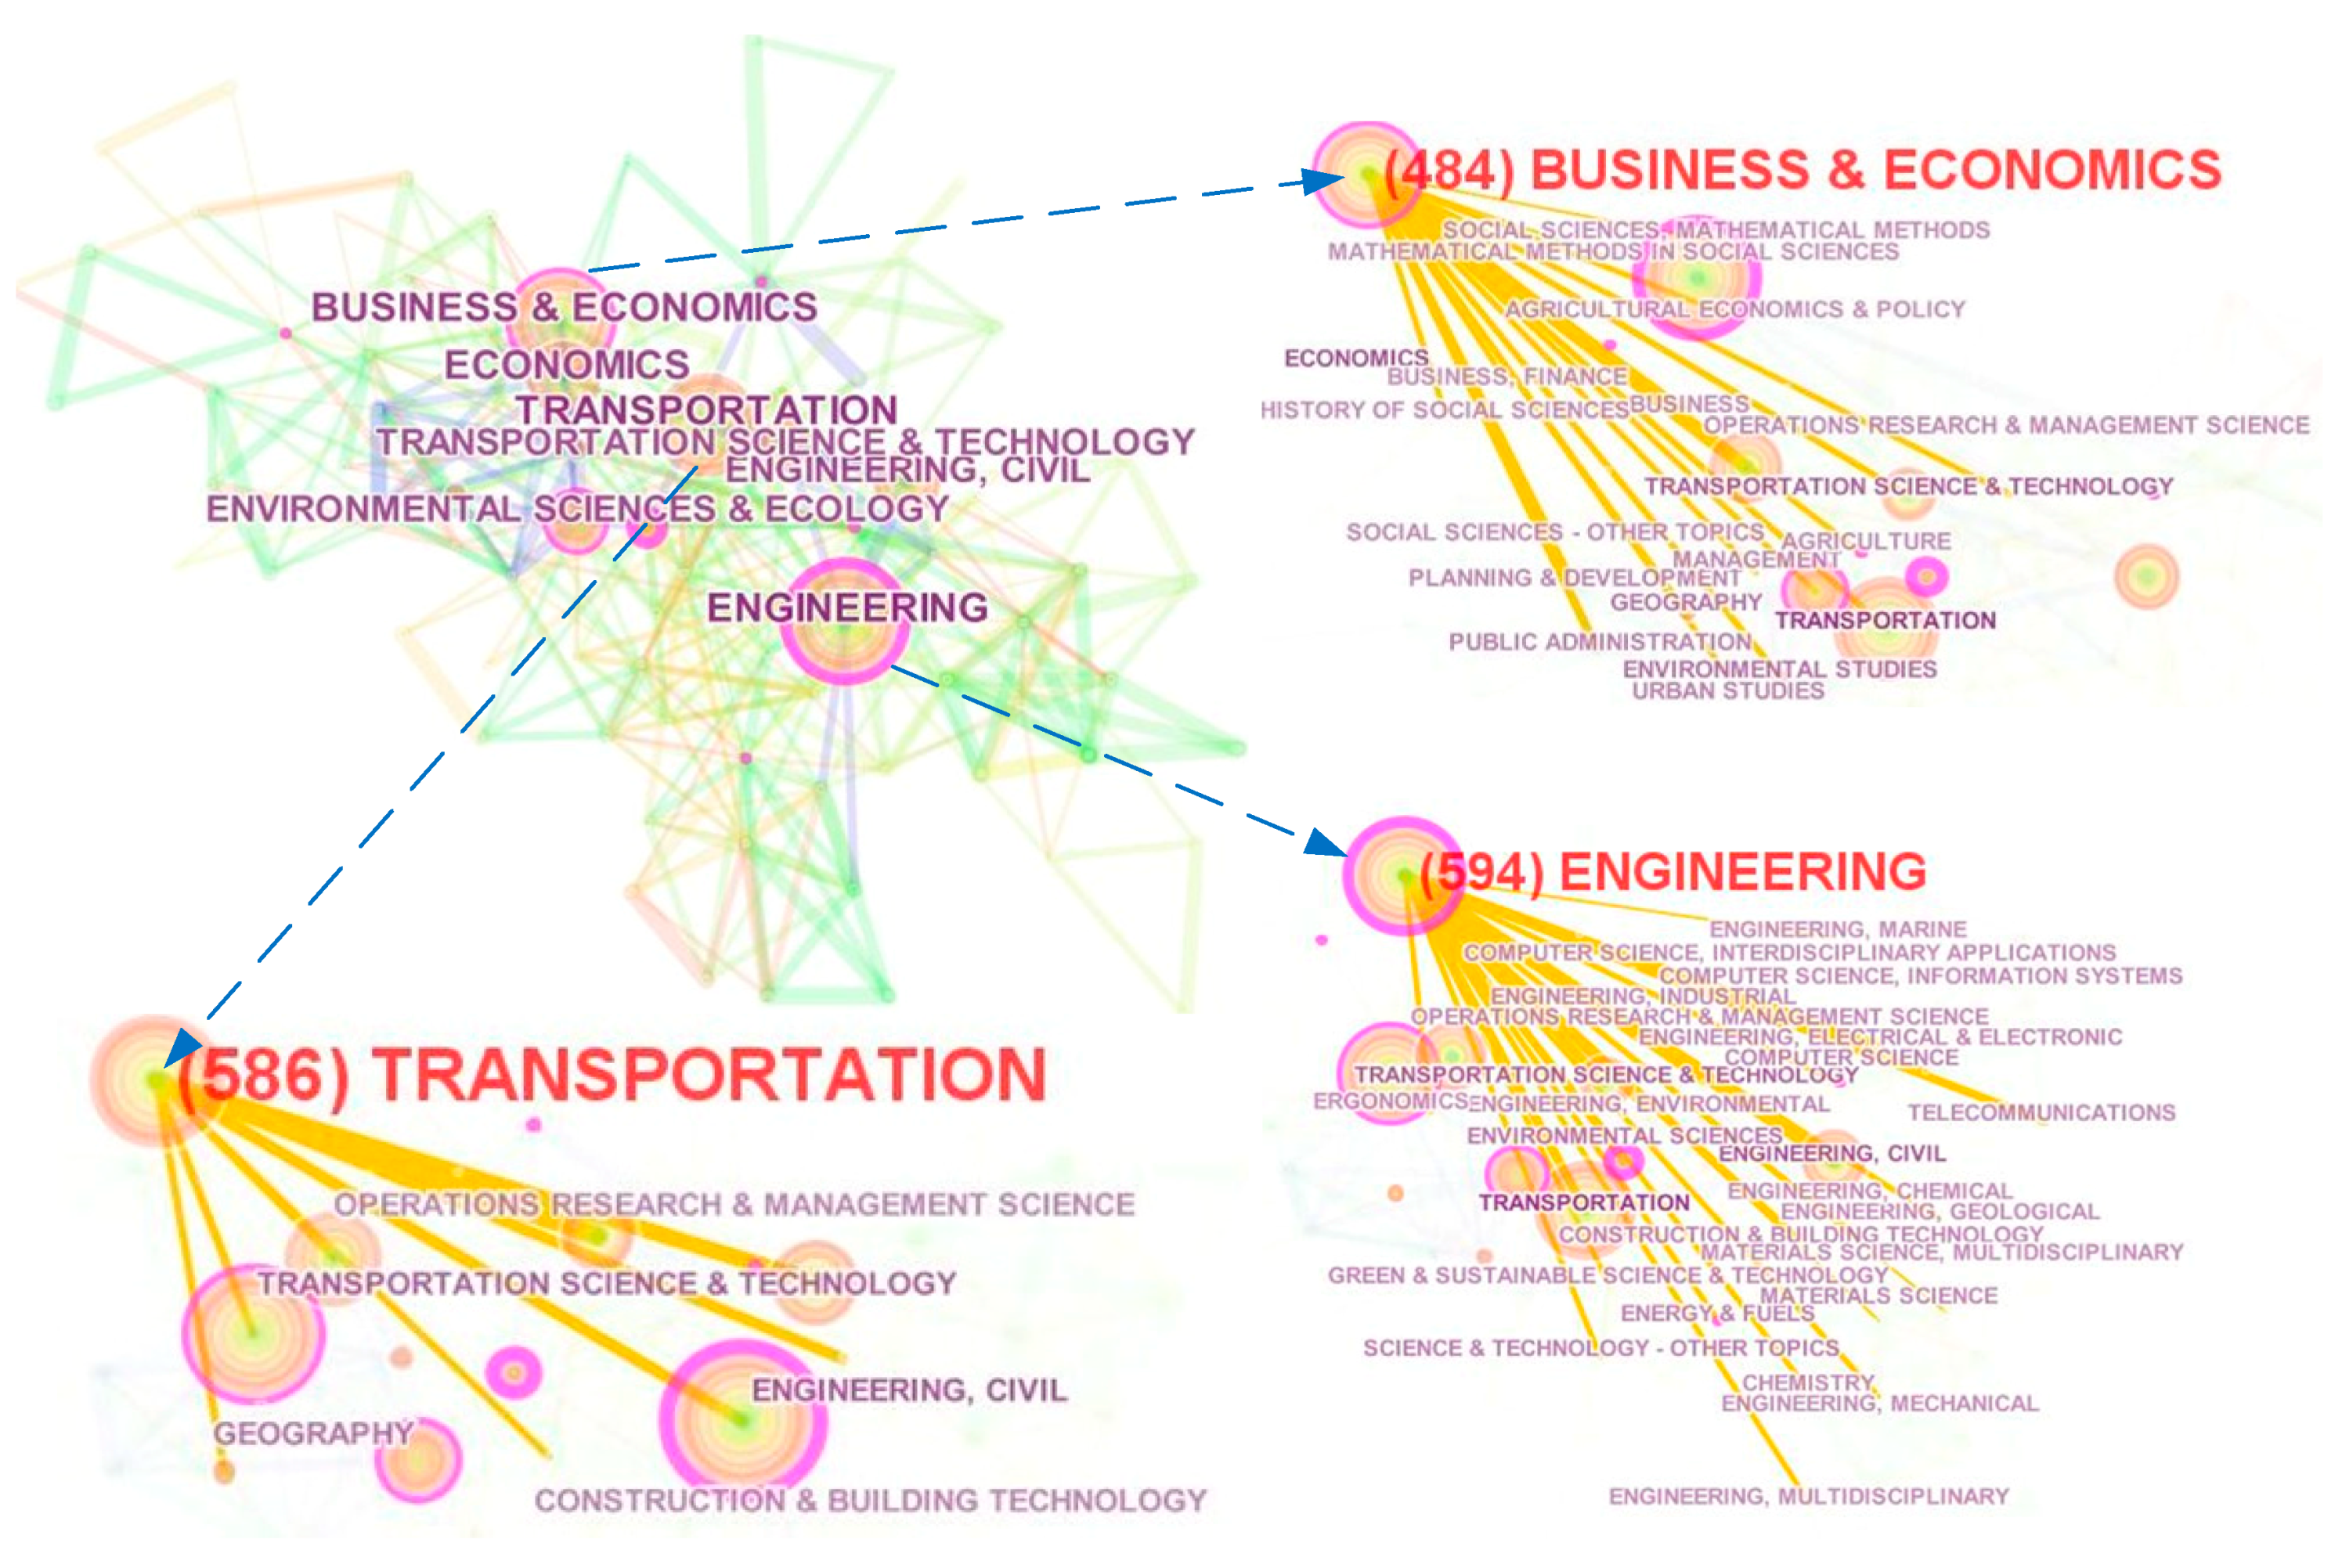
4.3.1. Discipline Analysis
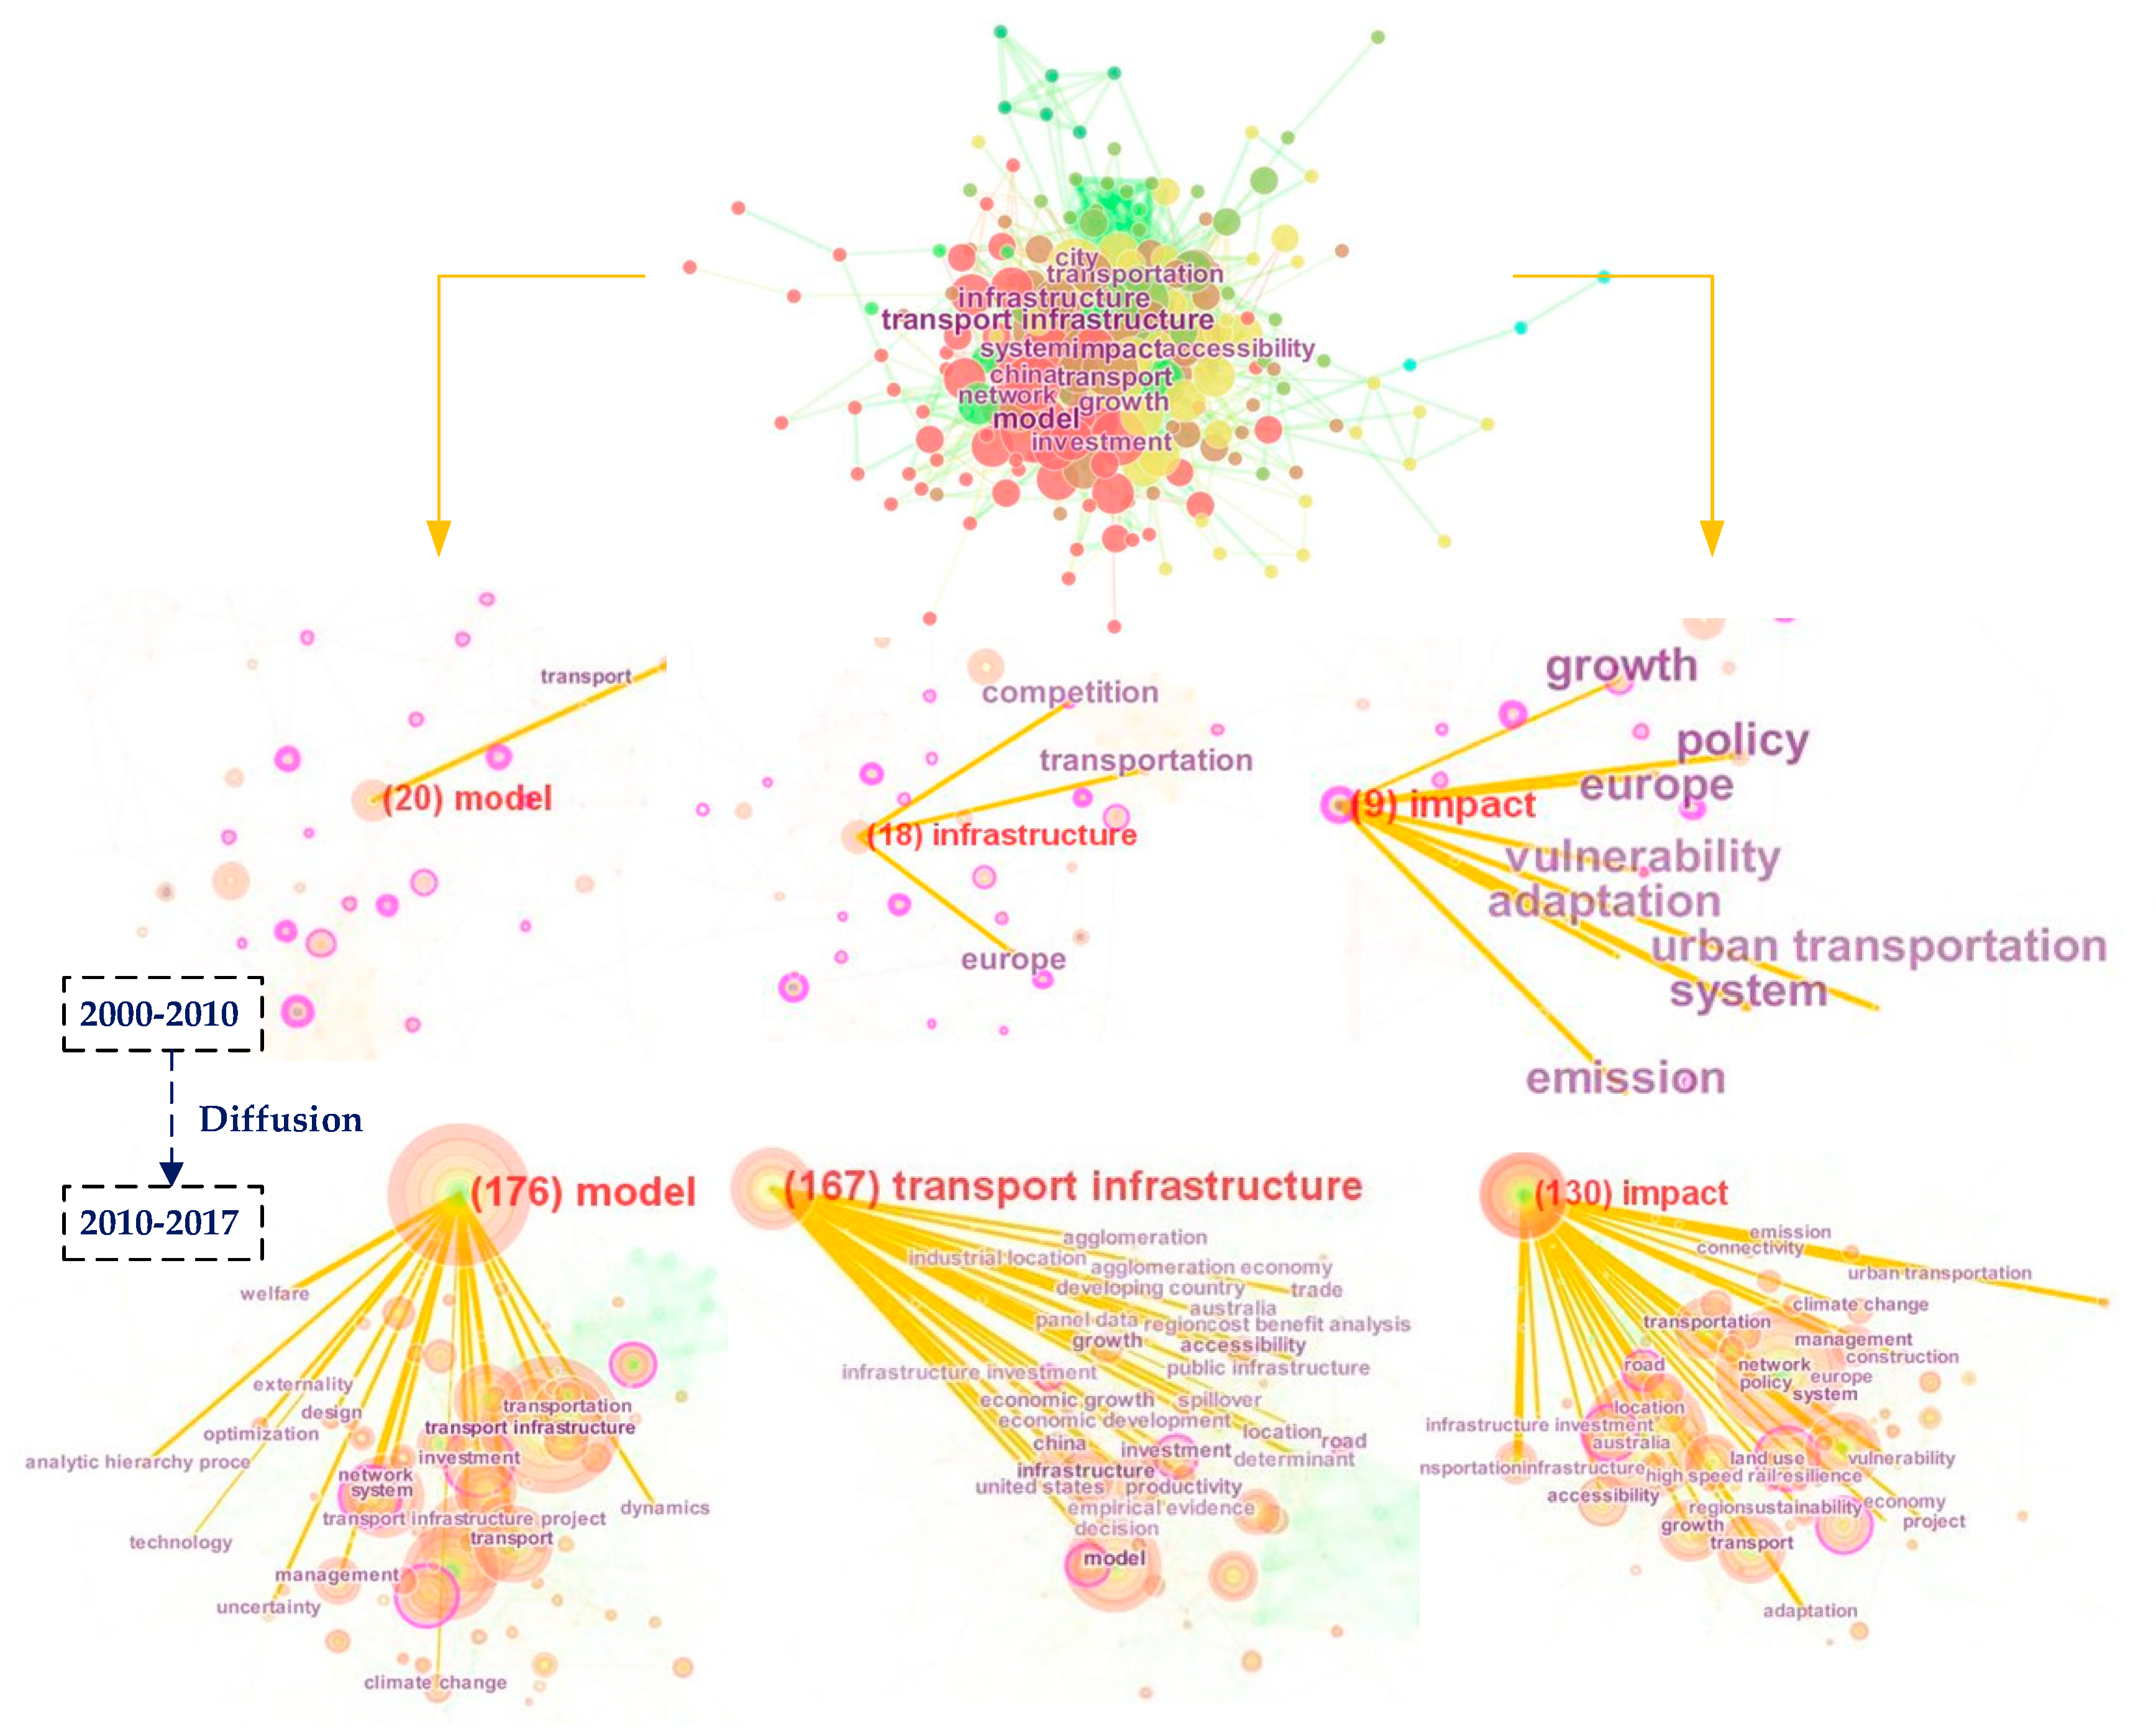
4.3.2. Co-Occurring Keyword Analysis
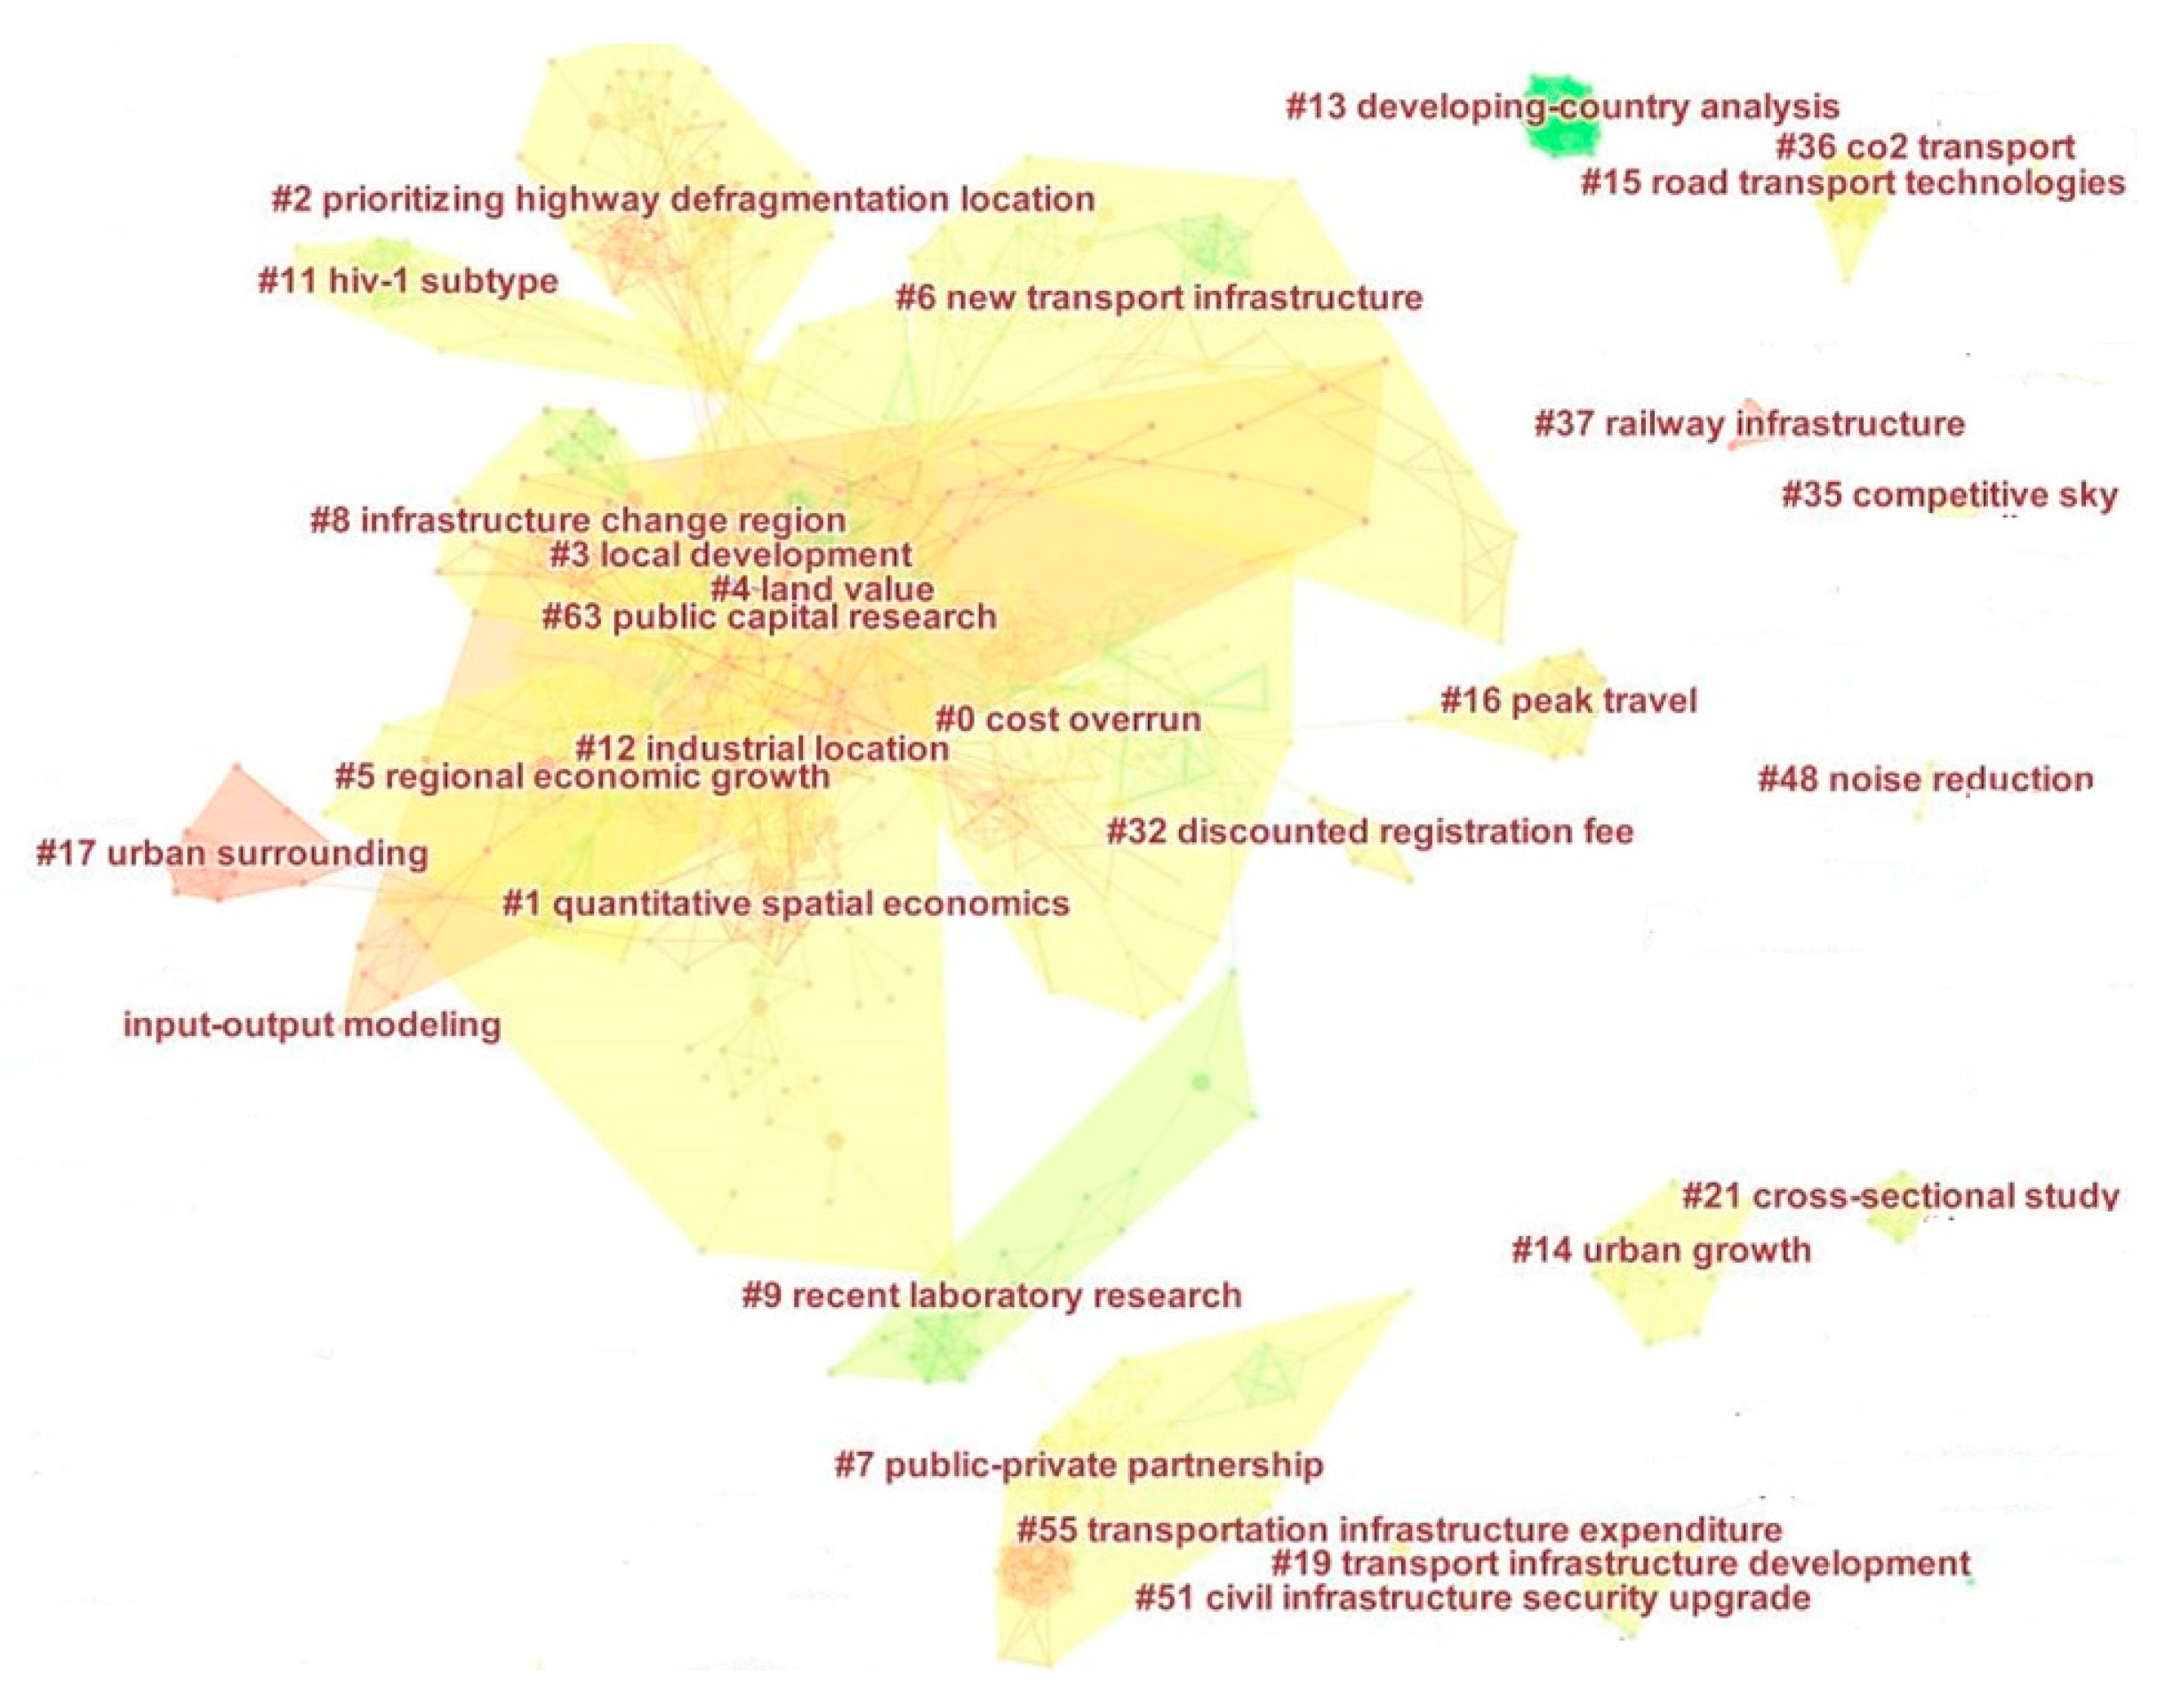
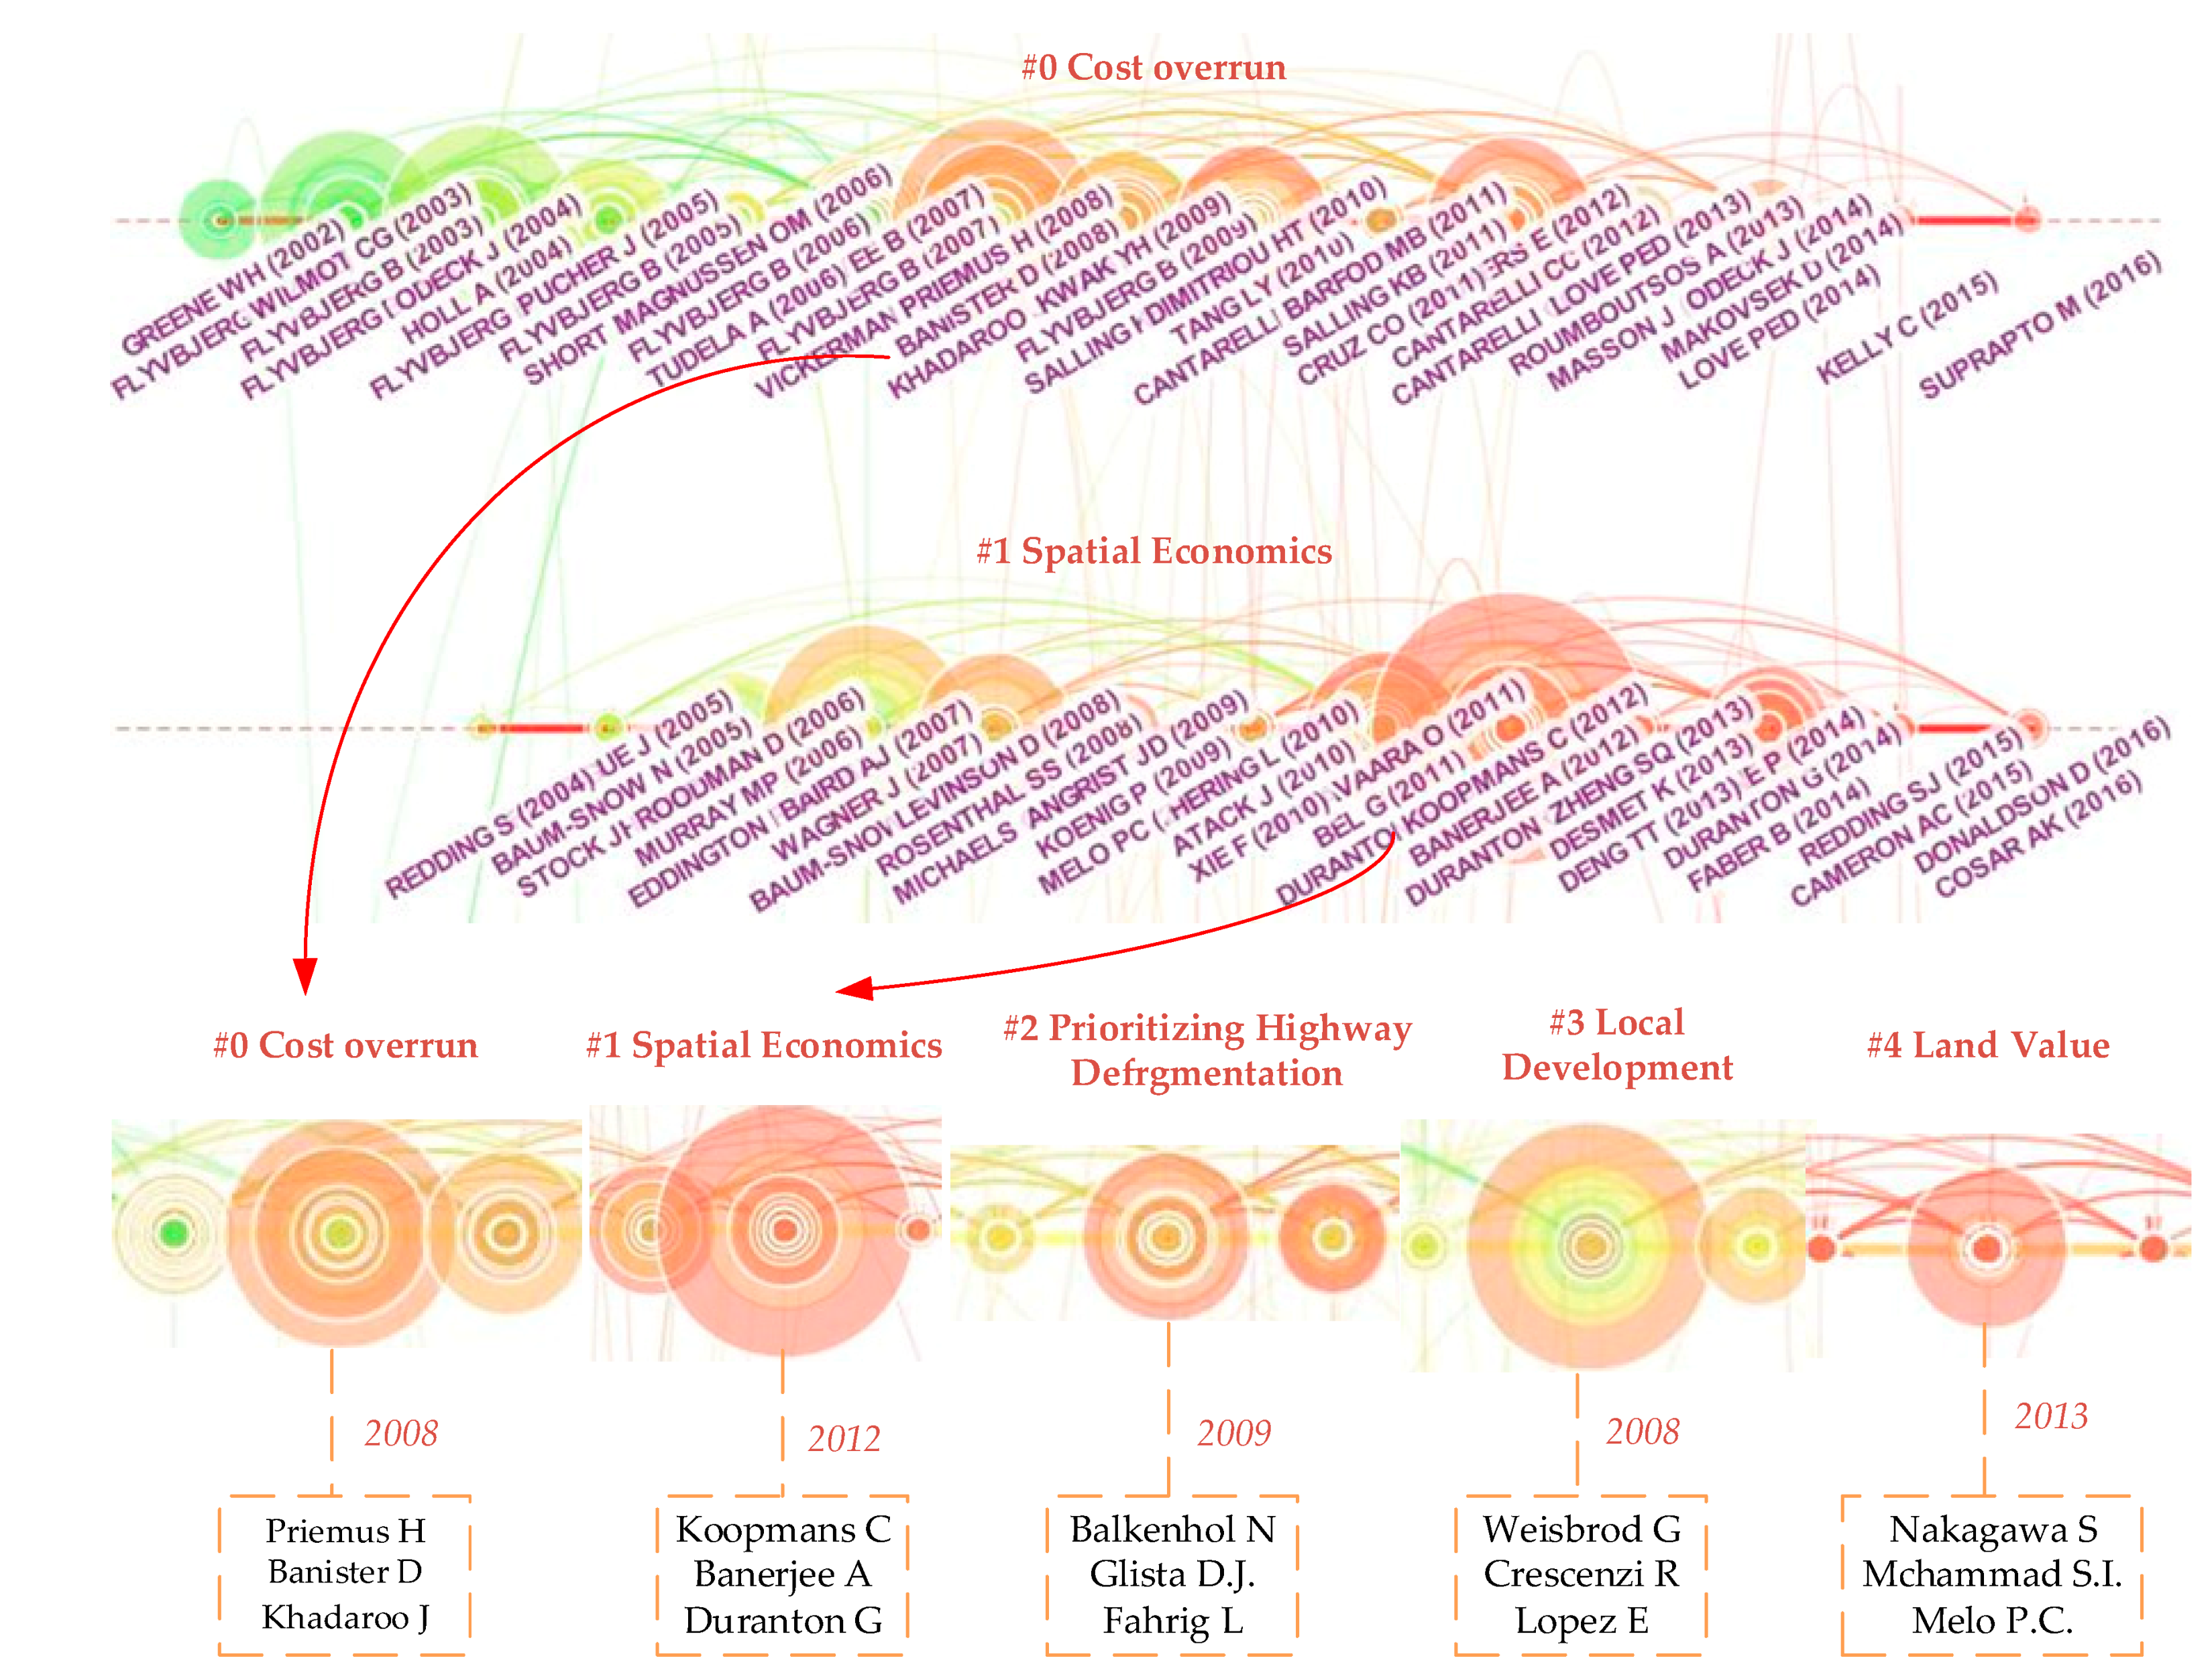
4.4. Co-Citation Analysis
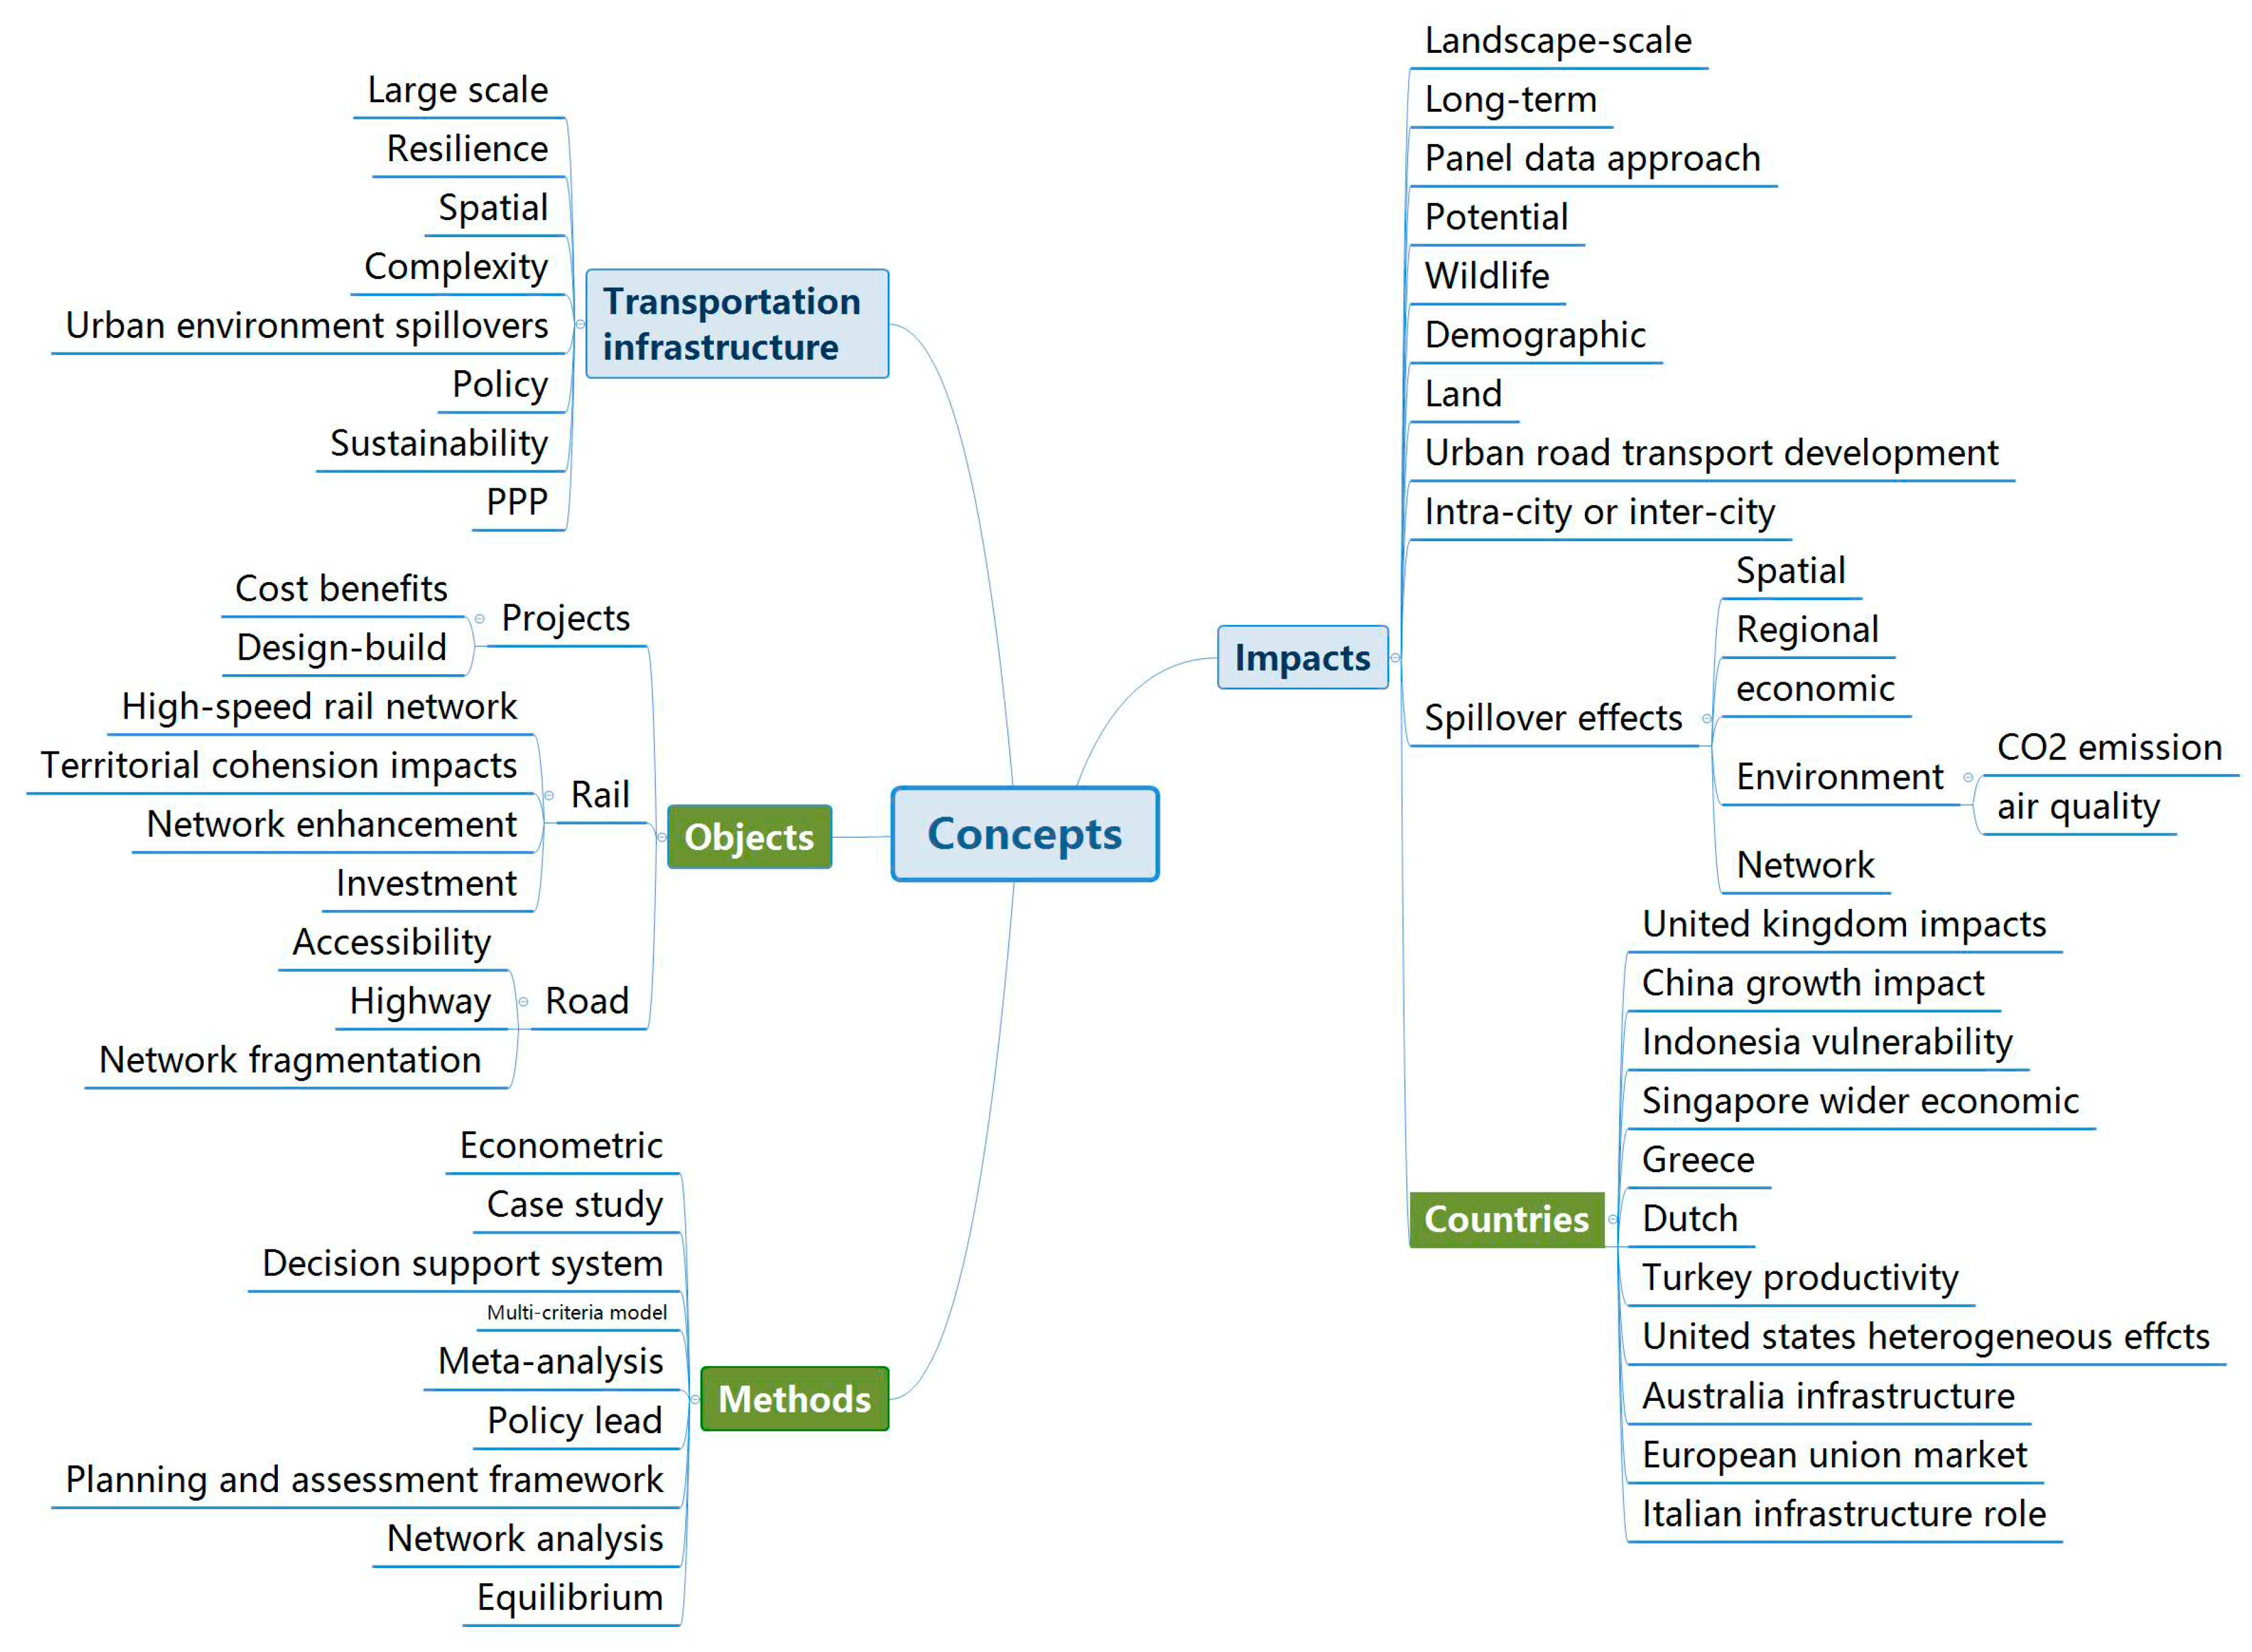
4.5. Hierarchy Analysis of Key Concepts
5. Conclusions
Author Contributions
Acknowledgments
Conflicts of Interest
Appendix A
| ID | Label | ID | Label | ID | Label |
| 0 | Cost overrun | 21 | Cross-sectional study | 42 | Forecasting infrastructure resilience |
| 1 | Quantitative spatial economics | 22 | Spatial structure | 43 | Price-difference approach |
| 2 | Prioritizing highway defragmentation | 23 | Critical transportation infrastructure | 44 | Sustainable development |
| 3 | Local development | 24 | Panel data evidence | 45 | Retail travel pattern |
| 4 | Land value | 25 | Massive non-orthogonal multiple access | 46 | Traveler characteristics |
| 5 | Regional economic growth | 26 | Low-volume roads | 47 | Operational effect |
| 6 | New transport infrastructure | 27 | Planning transport infrastructure | 48 | Noise reduction |
| 7 | Public-private partnership | 28 | Comparative evaluation | 49 | Changing transport system |
| 8 | Infrastructure change region | 29 | Transportation infrastructure asset | 50 | Mega region economic development |
| 9 | Recent laboratory research | 30 | Temporal effect | 51 | Civil infrastructure security upgrade |
| 10 | Microbial engineering | 31 | Infrastructure network | 52 | Political volatility |
| 11 | hiv-1 subtype | 32 | Discounted registration fee | 53 | Greenhouse gas emissions reduction |
| 12 | Industrial location | 33 | Environmental benefit | 54 | Spatiotemporal variation |
| 11 | Developing-country analysis | 34 | Service delivery | 55 | Transportation infrastructure expenditure |
| 14 | Urban growth | 35 | Competitive sky | 56 | Resource allocation |
| 15 | Road transport technologies | 36 | CO2 transport technologies | 57 | Transport infrastructure investment |
| 16 | Peak travel | 37 | Railway infrastructure | 58 | Transport policies |
| 17 | Urban surrounding | 38 | Long-range transportation | 59 | International evidence |
| 18 | biomass-derived acid | 39 | Decoupling urban transport | 60 | Occupancy model |
| 19 | Transport infrastructure development | 40 | Complex urban infrastructure deformation monitoring | 61 | Solar energy |
| 20 | transport infrastructure slope | 41 | Integrated approach | 62 | Public investment research |
Appendix B
| ID | Label | Most Active Citer |
| 0 | Cost overrun | Cantarelli, C.C. (2010) cost overruns in large-scale transportation infrastructure projects: explanations and their theoretical embeddedness |
| 1 | Quantitative spatial economics | Redding, S.J. (2017) quantitative spatial economics |
| 2 | Prioritizing highway defragmentation | Gurrutxaga, M. (2014) prioritizing highway defragmentation locations for restoring landscape connectivity. |
| 3 | Local development | Gutierrez, J. (2010) using accessibility indicators and gis to assess spatial spillovers of transport infrastructure investment. |
| 4 | Land value | Brey, R. (2017) is the widespread use of urban land for cycling promotion policies cost effective? A cost-benefit analysis of the case of seville. |
| 5 | Regional economic growth | Deng, T.T. (2013) impacts of transport infrastructure on productivity and economic growth: recent advances and research challenges. |
| 6 | New transport infrastructure | Ogilvie, D. (2010) commuting and health in cambridge: a study of a ‘natural experiment’ in the provision of new transport infrastructure. |
| 7 | Public-private partnership | Sarmento, J.M. (2016) anatomy of public-private partnerships: their creation, financing and renegotiations. |
| 8 | Infrastructure change region | Chen, C.L. (2017) can transport infrastructure change regions’ economic fortunes? Some evidence from Europe and China. |
| 9 | Recent laboratory research | Butler, E. (2011) a review of recent laboratory research and commercial developments in fast pyrolysis and upgrading. |
| 10 | Microbial engineering | Peralta-Yahya, P.P. (2012) microbial engineering for the production of advanced biofuels. |
| 11 | hiv-1 subtype | Tatem, A.J. (2012) spatial accessibility and the spread of hiv-1 subtypes and recombinants. |
| 12 | Industrial location | Arauzo-Carod, J.M. (2013) location determinants of new firms: does skill level of human capital really matter? |
| 11 | Developing-country analysis | Fare, R. (2009) optimal investment in transportation infrastructure when middlemen have market power: a developing-country analysis. |
| 14 | Urban growth | Aljoufie, M. (2013) urban growth and transport infrastructure interaction in jeddah between 1980 and 2007. |
| 15 | Road transport technologies | Streimikiene, D. (2013) comparative assessment of road transport technologies. |
| 16 | Peak travel | Garceau, T.J. (2014) peak travel and the decoupling of vehicle travel from the economy a synthesis of the literature. |
| 17 | Urban surrounding | Chatziioannou, I. (2017) evaluation of the urban transportation infrastructure and its urban surroundings in the iztapalapa county: a geotechnology approach about its management. |
| 18 | biomass-derived acid | Serrano-Ruiz, J.C. (2012) catalytic transformations of biomass-derived acids into advanced biofuels. |
| 19 | Transport infrastructure development | De Jong, M. (2012) the pros and cons of confucian values in transport infrastructure development in China. |
| 20 | transport infrastructure slope | Smethurst, J.A. (2017) current and future role of instrumentation and monitoring in the performance of transport infrastructure slopes. |
Appendix C. High-Impact Number in Top 10 Clusters
| Clusters | Year | Authors | Clusters | Year | Authors |
| #0 Cost overrun | 2008 | Priemus H | #3 Local development | 2008 | Weisbrod G |
| Banister D | Crescenzi R | ||||
| Khadaroo J | Lopez E | ||||
| 2010 | Dimitriou HT | 2010 | Lopez E | ||
| Tang LY | Brocker J | ||||
| Cantarelli CC | Gutierrez J | ||||
| 2012 | Beukers E | 2012 | Nensher DA | ||
| Cantarelli CC | Levinson DM | ||||
| Cantarelli CC | Crescenzi R | ||||
| #1 Quantitative spatial economics | 2012 | Koopmans C | #4 Land value | 2013 | Nakagawa S |
| Banerjee A | Mchammad SI | ||||
| Duranton G | Melo PC | ||||
| 2007 | Baird AJ | 2010 | Percoco M | ||
| Wagner J | Cohen JP | ||||
| Baum-snow N | Munoz-Raskin R | ||||
| 2014 | Kline P | 2015 | Bensassi S | ||
| Duranton G | Mattsson LG | ||||
| Faber B | Reggiani A | ||||
| #2 Prioritizing highway defragmentation location | 2009 | Balkenhol N | #5 regional economic | 2011 | Banister D |
| Glista DJ | Hong JJ | ||||
| Fahrig L | Lakshmanan TR | ||||
| 2010 | Landguth EL | 2009 | Jiwattanakulpaisarn P | ||
| Benitez-Lopez A | Bronzini R | ||||
| Holderogger R | Lesage J | ||||
| 2012 | Zeller KA | 2013 | Na ky | ||
| Hepenstrick D | Yu NN |
References
- Rodrigue, J.-P.; Comtois, C.; Slack, B. The Geography of Transport Systems; Taylor & Francis: Abingdon, UK, 2016. [Google Scholar]
- Liu, J.; Mooney, H.; Hull, V.; Davis, S.J.; Gaskell, J.; Hertel, T.; Lubchenco, J.; Seto, K.C.; Gleick, P.; Kremen, C.; et al. Systems integration for global sustainability. Science 2015, 347, 1258832. [Google Scholar] [CrossRef] [PubMed]
- Kammen, D.M.; Sunter, D.A. City-integrated renewable energy for urban sustainability. Science 2016, 352, 922–928. [Google Scholar] [CrossRef] [PubMed] [Green Version]
- Jiang, X.; Zhang, L.; Xiong, C.; Wang, R. Transportation and regional economic development: Analysis of spatial spillovers in china provincial regions. Netw. Spat. Econ. 2016, 16, 769–790. [Google Scholar] [CrossRef]
- Chen, Z.; Haynes, K.E. Transportation infrastructure and economic growth in china: A meta-analysis. In Socioeconomic Environmental Policies and Evaluations in Regional Science; Springer: Berlin, Germany, 2017; pp. 339–357. [Google Scholar]
- Doyle, M.W.; Havlick, D.G. Infrastructure and the environment. Annu. Rev. Environ. Resour. 2009, 34, 349–373. [Google Scholar] [CrossRef]
- Tasic, I.; Porter, R.J. Modeling spatial relationships between multimodal transportation infrastructure and traffic safety outcomes in urban environments. Saf. Sci. 2016, 82, 325–337. [Google Scholar] [CrossRef]
- Camp, J.; Abkowitz, M.; Hornberger, G.; Benneyworth, L.; Banks, J.C. Climate change and freight-transportation infrastructure: Current challenges for adaptation. J. Infrastruct. Syst. 2013, 19, 363–370. [Google Scholar] [CrossRef]
- Müller, D.B.; Liu, G.; Løvik, A.N.; Modaresi, R.; Pauliuk, S.; Steinhoff, F.S.; Brattebø, H. Carbon emissions of infrastructure development. Environ. Sci. Technol. 2013, 47, 11739–11746. [Google Scholar] [CrossRef] [PubMed]
- Laurance, W.F.; Cochrane, M.A.; Bergen, S.; Fearnside, P.M.; Delamônica, P.; Barber, C.; D’angelo, S.; Fernandes, T. The future of the Brazilian Amazon. Science 2001, 291, 438–439. [Google Scholar] [CrossRef] [PubMed]
- Laurance, W.F.; Goosem, M.; Laurance, S.G. Impacts of roads and linear clearings on tropical forests. Trends Ecol. Evol. 2009, 24, 659–669. [Google Scholar] [CrossRef] [PubMed] [Green Version]
- Cohen, J.P. The broader effects of transportation infrastructure: Spatial econometrics and productivity approaches. Transp. Res. Part E Logist. Transp. Rev. 2010, 46, 317–326. [Google Scholar] [CrossRef]
- Cantos, P.; Gumbau-Albert, M.; Maudos, J. Transport infrastructures, spillover effects and regional growth: Evidence of the Spanish case. Transp. Rev. 2005, 25, 25–50. [Google Scholar] [CrossRef] [Green Version]
- Ming, Y.T.; Yi, J.L. Scientometric analysis of transport phenomenon literature, 1900–2007. Malays. J. Libr. Inf. Sci. 2009, 14, 35–58. [Google Scholar]
- Heilig, L.; Voss, S. A scientometric analysis of public transport research. J. Public Transp. 2015, 18, 111–141. [Google Scholar] [CrossRef]
- Holl, A. Manufacturing location and impacts of road transport infrastructure: Empirical evidence from Spain. Reg. Sci. Urban Econ. 2004, 34, 341–363. [Google Scholar] [CrossRef]
- Correia, A.G.; Winter, M.G.; Puppala, A.J. A review of sustainable approaches in transport infrastructure geotechnics. Transp. Geotech. 2016, 7, 21–28. [Google Scholar] [CrossRef] [Green Version]
- Durango-Cohen, P.L.; Sarutipand, P. Capturing interdependencies and heterogeneity in the management of multifacility transportation infrastructure systems. J. Infrastruct. Syst. 2007, 13, 115–123. [Google Scholar] [CrossRef]
- Grimsey, D.; Lewis, M.K. Evaluating the risks of public private partnerships for infrastructure projects. Int. J. Proj. Manag. 2002, 20, 107–118. [Google Scholar] [CrossRef]
- Flyvbjerg, B. What you should know about megaprojects and why: An overview. Proj. Manag. J. 2014, 45, 6–19. [Google Scholar] [CrossRef]
- Flyvbjerg, B. The Oxford Handbook of Megaproject Management; Oxford University Press: Oxford, UK, 2017. [Google Scholar]
- Lakshmanan, T.R. The broader economic consequences of transport infrastructure investments. J. Transp. Geogr. 2011, 19, 1–12. [Google Scholar] [CrossRef]
- Achour, H.; Belloumi, M. Investigating the causal relationship between transport infrastructure, transport energy consumption and economic growth in Tunisia. Renew. Sustain. Energy Rev. 2016, 56, 988–998. [Google Scholar] [CrossRef]
- Banister, D.; Berechman, Y. Transport investment and the promotion of economic growth. J. Transp. Geogr. 2001, 9, 209–218. [Google Scholar] [CrossRef]
- Paul, S. Effects of public infrastructure on cost structure and productivity in the private sector. Econ. Rec. 2003, 79, 446–461. [Google Scholar] [CrossRef]
- Youngson, A.J. Britain’s Economic Growth 1920–1966; Routledge: Abingdon, UK, 2013. [Google Scholar]
- Ni, P.; Kamiya, M.; Ding, R. Cities Network along the Silk Road: The Global Urban Competitiveness Report 2017; Springer: Singapore, 2017. [Google Scholar]
- Muller, M.; Biswas, A.; Martin-Hurtado, R.; Tortajada, C. Built infrastructure is essential. Science 2015, 349, 585–586. [Google Scholar] [CrossRef] [PubMed]
- Laurance, W.F.; Clements, G.R.; Sloan, S.; O’connell, C.S.; Mueller, N.D.; Goosem, M.; Venter, O.; Edwards, D.P.; Phalan, B.; Balmford, A. A global strategy for road building. Nature 2014, 513, 229–232. [Google Scholar] [CrossRef] [PubMed]
- Meng, F.; Fan, L.; Zhou, P.; Zhou, D. Measuring environmental performance in China’s industrial sectors with non-radial dea. Math. Comput. Model. 2013, 58, 1047–1056. [Google Scholar] [CrossRef]
- Nilsson, C.; Reidy, C.A.; Dynesius, M.; Revenga, C. Fragmentation and flow regulation of the world’s large river systems. Science 2005, 308, 405–408. [Google Scholar] [CrossRef] [PubMed]
- Palmer, M.A. Water resources: Beyond infrastructure. Nature 2010, 467, 534–535. [Google Scholar] [CrossRef] [PubMed]
- Tullos, D. Assessing the influence of environmental impact assessments on science and policy: An analysis of the three gorges project. J. Environ. Manag. 2009, 90 (Suppl. 3), S208–S223. [Google Scholar] [CrossRef] [PubMed]
- Dahiya, S.; Singh, B.; Gaur, S.; Garg, V.; Kushwaha, H. Analysis of groundwater quality using fuzzy synthetic evaluation. J. Hazard. Mater. 2007, 147, 938–946. [Google Scholar] [CrossRef] [PubMed]
- Pirrone, N.; Trombino, G.; Cinnirella, S.; Algieri, A.; Bendoricchio, G.; Palmeri, L. The Driver-Pressure-State-Impact-Response (DPSIR) approach for integrated catchment-coastal zone management: Preliminary application to the Po catchment-Adriatic sea coastal zone system. Reg. Environ. Chang. 2005, 5, 111–137. [Google Scholar] [CrossRef]
- Strogen, B.; Horvath, A. Greenhouse gas emissions from the construction, manufacturing, operation, and maintenance of us distribution infrastructure for petroleum and biofuels. J. Infrastruct. Syst. 2012, 19, 371–383. [Google Scholar] [CrossRef]
- Costanza, R.; d’Arge, R.; De Groot, R.; Farber, S.; Grasso, M.; Hannon, B.; Limburg, K.; Naeem, S.; O’neill, R.V.; Paruelo, J.; et al. The value of the world’s ecosystem services and natural capital. Nature 1997, 387, 253–260. [Google Scholar] [CrossRef]
- Matten, D.; Moon, J. “Implicit” and “explicit” CSR: A conceptual framework for a comparative understanding of corporate social responsibility. Acad. Manag. Rev. 2008, 33, 404–424. [Google Scholar] [CrossRef]
- McWilliams, A.; Siegel, D. Corporate social responsibility: A theory of the firm perspective. Acad. Manag. Rev. 2001, 26, 117–127. [Google Scholar] [CrossRef]
- Buchanan, J.M.; Stubblebine, W.C. Externality. In Classic Papers in Natural Resource Economics; Springer: Berlin, Germany, 1962; pp. 138–154. [Google Scholar]
- Mendler, S.; Odell, W. The Hok Guidebook to Sustainable Design; John Wiley & Sons: Hoboken, NJ, USA, 2000. [Google Scholar]
- Rajak, S.; Parthiban, P.; Dhanalakshmi, R. Sustainable transportation systems performance evaluation using fuzzy logic. Ecol. Indic. 2016, 71, 503–513. [Google Scholar] [CrossRef]
- Loo, B.P.Y.; Banister, D. Decoupling transport from economic growth: Extending the debate to include environmental and social externalities. J. Transp. Geogr. 2016, 57, 134–144. [Google Scholar] [CrossRef]
- Griggs, D.; Stafford-Smith, M.; Gaffney, O.; Rockström, J.; Öhman, M.C.; Shyamsundar, P.; Steffen, W.; Glaser, G.; Kanie, N.; Noble, I. Policy: Sustainable development goals for people and planet. Nature 2013, 495, 305–307. [Google Scholar] [CrossRef] [PubMed]
- Rotolo, D.; Rafols, I.; Hopkins, M.M.; Leydesdorff, L. Strategic intelligence on emerging technologies: Scientometric overlay mapping. J. Assoc. Inf. Sci. Technol. 2017, 68, 214–233. [Google Scholar] [CrossRef]
- Fan, X.; Gao, Y.; Ma, B.; Xia, Z. Chinese academic contribution to burns: A comprehensive bibliometrics analysis from 1985 to 2014. Burns 2016, 42, 1463–1470. [Google Scholar] [CrossRef] [PubMed]
- Pullannagari, D. Bibliography Data Mining and Data Visualization. Master’s Thesis, San Jose State University, San Jose, CA, USA, 2008. [Google Scholar]
- Van Meeteren, M.; Poorthuis, A.; Derudder, B.; Witlox, F. Pacifying babel’s tower: A scientometric analysis of polycentricity in urban research. Urb. Stud. 2016, 53, 1278–1298. [Google Scholar] [CrossRef]
- Pouris, A.; Pouris, A. Scientometrics of a pandemic: HIV/AIDS research in South Africa and the world. Scientometrics 2010, 86, 541–552. [Google Scholar] [CrossRef]
- Song, J.; Zhang, H.; Dong, W. A review of emerging trends in global PPP research: Analysis and visualization. Scientometrics 2016, 107, 1111–1147. [Google Scholar] [CrossRef]
- Keathley-Herring, H.; Van Aken, E.; Gonzalez-Aleu, F.; Deschamps, F.; Letens, G.; Orlandini, P.C. Assessing the maturity of a research area: Bibliometric review and proposed framework. Scientometrics 2016, 109, 927–951. [Google Scholar] [CrossRef]
- Hjørland, B.; Albrechtsen, H. Toward a new horizon in information science: Domain-analysis. J. Assoc. Inf. Sci. Technol. 1995, 46, 400–425. [Google Scholar] [CrossRef]
- Chen, C. Citespace II: Detecting and visualizing emerging trends and transient patterns in scientific literature. J. Assoc. Inf. Sci. Technol. 2006, 57, 359–377. [Google Scholar] [CrossRef]
- Chen, C. Citespace: A Practical Guide for Mapping Scientific Literature; Nova Science Publishers, Incorporated: Hauppauge, NY, USA, 2016. [Google Scholar]
- Zheng, X.; Le, Y.; Chan, A.P.; Hu, Y.; Li, Y. Review of the application of Social Network Analysis (SNA) in construction project management research. Int. J. Proj. Manag. 2016, 34, 1214–1225. [Google Scholar] [CrossRef]
- White, H.D. Pathfinder networks and author cocitation analysis: A remapping of paradigmatic information scientists. J. Assoc. Inf. Sci. Technol. 2003, 54, 423–434. [Google Scholar] [CrossRef]
- Chen, C.; Morris, S. In Visualizing evolving networks: Minimum spanning trees versus pathfinder networks. In Proceedings of the IEEE Symposium on Information Visualization (INFOVIS 2003), Seattle, WA, USA, 19–21 October 2003; pp. 67–74. [Google Scholar]
- Chen, C.; Leydesdorff, L. Patterns of connections and movements in dual-map overlays: A new method of publication portfolio analysis. J. Assoc. Inf. Sci. Technol. 2014, 65, 334–351. [Google Scholar] [CrossRef]
- Small, H. Co-citation in the scientific literature: A new measure of the relationship between two documents. J. Assoc. Inf. Sci. Technol. 1973, 24, 265–269. [Google Scholar] [CrossRef]
- Deerwester, S.; Dumais, S.T.; Furnas, G.W.; Landauer, T.K.; Harshman, R. Indexing by latent semantic analysis. J. Am. Soc. Inf. Sci. 1990, 41, 391. [Google Scholar] [CrossRef]


| Title | Cited | Year | Sustainable Dimensions | ||
|---|---|---|---|---|---|
| Economy | Environment | Society | |||
| Microbial engineering for the production of advanced biofuels | 409 | 2012 | ✓ | ✓ | |
| Grasping at the routes of biological invasions: a framework for integrating pathways into policy | 361 | 2008 | ✓ | ||
| Catalytic routes for the conversion of biomass into liquid hydrocarbon transportation fuels | 336 | 2011 | ✓ | ✓ | |
| Liquid-phase chemical hydrogen storage materials | 294 | 2012 | ✓ | ✓ | |
| Plug-in Vehicles and Renewable Energy Sources for Cost and Emission Reductions | 287 | 2011 | ✓ | ||
| Adults’ Sedentary Behavior Determinants and Interventions | 269 | 2011 | ✓ | ||
| From roadkill to road ecology: A review of the ecological effects of roads | 259 | 2007 | ✓ | ||
| Urban green space, public health, and environmental justice: The challenge of making cities ‘just green enough’ | 203 | 2014 | ✓ | ✓ | |
| Urban sprawl in the Mediterranean? Patterns of growth and change in the Barcelona Metropolitan Region 1993–2000 | 170 | 2008 | ✓ | ||
| Robust alternative technology choices are required in the paradigm shift from the current crude oil-reliant transport fuel platform to a sustainable, more flexible transport infrastructure. | 162 | 2011 | ✓ | ✓ | ✓ |
| Impacts of urbanization on urban structures and energy demand: What can we learn for urban energy planning and urbanization management? | 101 | 2011 | ✓ | ✓ | |
| Route Infrastructure and the Risk of Injuries to Bicyclists: A Case-Crossover Study | 66 | 2012 | ✓ | ||
| Changes in mode of travel to work: a natural experimental study of new transport infrastructure | 17 | 2015 | ✓ | ✓ | |
| Impact of New Transport Infrastructure on Walking, Cycling, and Physical Activity | 12 | 2016 | ✓ | ✓ | |
| Author | Institution | Count | Research Field |
|---|---|---|---|
| Flyvbjerg Bent | University of Oxford | 15 | Transportation, Business Economics, Public Administration, Urban Studies, Environment Sciences Ecology, Geography |
| Mulley Corinne | University of Sydney | 13 | Transportation, Business Economics, Geography, Engineering, Environmental Sciences Ecology |
| De Jong Martin | Delft University of Technology | 12 | Transportation, Business Economics, Government Law, Public Administration, Geography |
| Ogilvie David | University of Cambridge | 12 | Public Environmental Occupational Health, Nutrition Dietetics, Physiology |
| Proost Stef | Katholieke Universiteit Leuven | 12 | Transportation, Business Economics, Engineering, Operations Research Management Science, Environmental Sciences Ecology, Geography |
| Salling Kim Bang | Technical University of Denmark | 11 | Transportation, Business Economics |
| Van Wee Bert | Delft University of Technology | 11 | Transportation, Business Economics |
| Durango-Cohen Pablo | Northwestern University | 10 | Engineering, Transportation, Business Economics, Operations Research Management Science |
| Hensher David A | University of New South Wales | 10 | Transportation, Business Economics, Engineering, Geography |
| Manuel Vassallo Jose | Universidad Politécnica de Madrid | 10 | Transportation, Engineering, Business Economics |
| Cluster | Size | Silhouette | Mean (Year) | Theme | Alternative Themes |
|---|---|---|---|---|---|
| 0 | 96 | 0.886 | 2008 | Cost overruns | Transportation infrastructure project |
| 1 | 59 | 0.825 | 2010 | Quantitative spatial economics | Infrastructure spatial framework |
| 2 | 57 | 0.976 | 2009 | Prioritizing highway defragmentation location | Impacts approach |
| 3 | 55 | 0.762 | 2007 | Local development | Public transport investment |
| 4 | 54 | 0.91 | 2012 | Land value | Property value |
| 5 | 52 | 0.903 | 2008 | Regional economic growth | Regional economic growth |
© 2018 by the authors. Licensee MDPI, Basel, Switzerland. This article is an open access article distributed under the terms and conditions of the Creative Commons Attribution (CC BY) license (http://creativecommons.org/licenses/by/4.0/).
Share and Cite
Wang, L.; Xue, X.; Zhao, Z.; Wang, Z. The Impacts of Transportation Infrastructure on Sustainable Development: Emerging Trends and Challenges. Int. J. Environ. Res. Public Health 2018, 15, 1172. https://0-doi-org.brum.beds.ac.uk/10.3390/ijerph15061172
Wang L, Xue X, Zhao Z, Wang Z. The Impacts of Transportation Infrastructure on Sustainable Development: Emerging Trends and Challenges. International Journal of Environmental Research and Public Health. 2018; 15(6):1172. https://0-doi-org.brum.beds.ac.uk/10.3390/ijerph15061172
Chicago/Turabian StyleWang, Luqi, Xiaolong Xue, Zebin Zhao, and Zeyu Wang. 2018. "The Impacts of Transportation Infrastructure on Sustainable Development: Emerging Trends and Challenges" International Journal of Environmental Research and Public Health 15, no. 6: 1172. https://0-doi-org.brum.beds.ac.uk/10.3390/ijerph15061172