Article

Does the Effort Meet the Challenge in Promoting Low-Carbon City?—A Perspective of Global Practice

1
School of Construction Management and Real Estate, International Research Center for Sustainable Built Environment, Chongqing University, Chongqing 400045, China
2
Department of Building and Real Estate, Hong Kong Polytechnic University, Hong Kong 999077, China
3
Center of International Cooperation Research, Central University of Finance and Economics, Beijing 100081, China
*
Author to whom correspondence should be addressed.
Int. J. Environ. Res. Public Health 2018, 15(7), 1334; https://0-doi-org.brum.beds.ac.uk/10.3390/ijerph15071334
Submission received: 30 March 2018 / Revised: 14 May 2018 / Accepted: 18 June 2018 / Published: 25 June 2018

Abstract

:
Global warming caused by carbon emissions has been recognized as a challenge to human sustainable development, and low-carbon city development is widely considered as an effective strategy to address this challenge. Numerous emission reduction measures have been implemented, and considerable efforts have been devoted in promoting low-carbon city. This paper examines whether sufficient efforts have been paid to these typical emission sectors, including Building, Industry, Energy Transformation, and Transportation by referring to the shared responsibility of each sector. The shared responsibility of individual emission sector is calculated by applying energy consumption data in 2014 World Energy Balance. The efforts contributed in emission reduction by each sector are examined by analyzing the low-carbon city work plans of 24 representative sample cities, which are selected globally. The research results demonstrate that sufficient emission reduction efforts have been paid in the Building sector and Transportation sector. But the Industry sector and Energy Transformation sector are less-attended in addressing emission reduction. The reason for the sufficient efforts paid in the Building sector and Transportation sector is considered as that the efforts for emission reduction in these two sectors can bring more co-benefits. However, emission reduction in Industrial sector is generally considered to have the effects of holding back economic growth, and the emission reduction in the sector of Energy Transformation will need enormous investment for advanced technologies. Policy for emission reduction in the Industry sector and Energy Transformation sector is indispensable to promote low-carbon city. This study appeals that (1) low-carbon city can be effectively implemented only if carbon reduction policy is adopted to all industrial activities; (2) multiple channels of financial resources should be established to support cities to mitigate carbon emissions in Industry sector; (3) cooperation on the development of clean energy technology between cities should be promoted; and (4) efforts should be paid to reduce carbon emission from using traditional energy transformation equipment by improving their efficiency.

1. Introduction

Sustainable development is confronted with a great challenge from global warming. It has been widely reported that global warming has become increasingly severe particularly in recent years [1]. The consequence of global warming has caused multiple repercussions on the environment, natural resource, and human well-being [2,3,4,5,6,7]. For example, one of the most serious consequences of global warming is sea level rise [8], which causes the submergence of coastal land. Thus, many countries and cities are in the danger of disappearing. It was reported that Kiribati has already purchased land to move its entire population [9]. Another serious consequence of global warming is the warming ocean [10], which increases the frequency and intensity of storms and other weather events. It was reported that over 600,000 people died and 4.1 billion people wounded in weather-related events over the last two decades, inducing economic costs in excess of $1.9 trillion [11]. Therefore, tackling global warming is one of the most important and urgent issues for human sustainable development.
Scientists have almost unanimously concluded that the only way of effectively forestalling global warming in the long run is to reduce the emissions of greenhouse gases, chief among which is carbon dioxide [12]. Emissions of carbon dioxide are largely from the burning of fossil fuels in cities [13], which is ubiquitous in all sectors including the industry, transportation, and domestic sectors of economies. With this recognition, international conferences on carbon emission reduction have been organized continuously since 1979, when the first global climate change conference took place in Geneva. Various guidelines for mitigating carbon emissions have been promulgated by international agencies, such as World Bank (WB), World Resources Institute (WRI), C40 Cities Climate Leadership Group (C40), United Nations Human Settlement Programme (UN-Habitat), and United Nations Environment Programme (UNEP). Researchers have contributed considerable efforts in finding out solutions for emission reduction. In practice, an increasing number of cities at global level have been formulating policies to reduce the carbon emissions. According to the report by C40 [14], 91 major cities have joined C40 cities, which contribute to 25% of global GDP. Many cities have defined low-carbon city mission in their cities’ development blueprints, for example, 1050 cities in the United States, 40 cities in India, 100 cities in China, and 83 cities in Japan, as reported by Gomi, Shimada, & Matsuoka [15]. These cities have started to implement various low-carbon programs in the sectors of building, industry, and others.
However, it appears unclear whether we have done what we should do in promoting low-carbon city and whether sufficient efforts are given to these sectors which release more emissions in practice. It is generally considered that the major emission sectors in a city have more potential to reduce carbon emissions [16,17], and they should give more efforts to reduce emissions [18]. Without sound examining whether efforts are properly and sufficiently given, cities will not only be unable to achieve the low-carbon city goal, but also waste resources invested [19]. It is therefore essential to find out whether the efforts are sufficient in each emission sector to tackle carbon emissions. This understanding will enable city governments to formulate effective measures to reduce carbon emissions in these major emission sectors which not give sufficient efforts.
The existing research works in the context of low-carbon city practice can be classified as empirical studies of individual cities, case-based studies of various cities, and evaluation on low-carbon city performance. In referring to the city of Bangkok as an empirical case study, Phdungsilp [20] analyzed 16 proposed carbon reduction policies, and the results demonstrate that the most significant carbon reduction policies are in the transport sector. Lo [21] found the reasons for poor performance in carbon reduction in referring to the empirical study of Changchun, including poorly designed evaluation system, loosely defined reduction targets, and the lack of reliable statistics on energy consumption. Liu and Qin [22] decomposed low-carbon city policies into three elements: goal, contents, and instruments through archival analysis on official documents and field interviews across 10 Chinese cities. Based on the carbon emission status of 30 Chinese cities, Lynn et al. [23] proposed a low-carbon indicator system for China. Zhou et al. [24] evaluated 36 global cities on the performance of carbon reduction by using the DPSIR (Driving forces-Pressures-State-Impacts-Responses) causal-effect framework. Wu et al. [25] evaluated 284 Chinese cities on the performance of carbon emissions and classified these cities into four types, including low-carbon city, relatively low-carbon city, relatively high-carbon city, and high-carbon city.
There are two limitations noted in the existing studies. First, little research is conducted from a global perspective. In fact, the emission problem threatens all human beings, and mitigating emissions requires global efforts. It is therefore essential to examine low-carbon city practice from a global perspective [24]. Second, there is little research on whether the major emission sectors are effectively addressed with sufficient efforts. In other words, it is unknown whether the major emission sectors have been put on sufficient emission reduction measures. Only these major emission sectors from all cities participate in the mission of low-carbon city practice and contribute sufficient efforts, the emission reduction can be achieved globally. Therefore, the aim of this study is to identify those less-attended emission sectors where more efforts should be paid.
The remainder of this paper is organized as follows: Section 2 introduces the methods used in this study. Section 3 classifies carbon emission sectors. Section 4 calculates shared responsibility between individual emission sectors. Section 5 investigates the efforts contributed in emission reduction between emission sectors. Discussion and policy implication of the research findings are provided in Section 6, followed by the conclusion section.

2. Research Framework and Methods

In order to achieve the aim of this study, the following research works are planned:
(1)
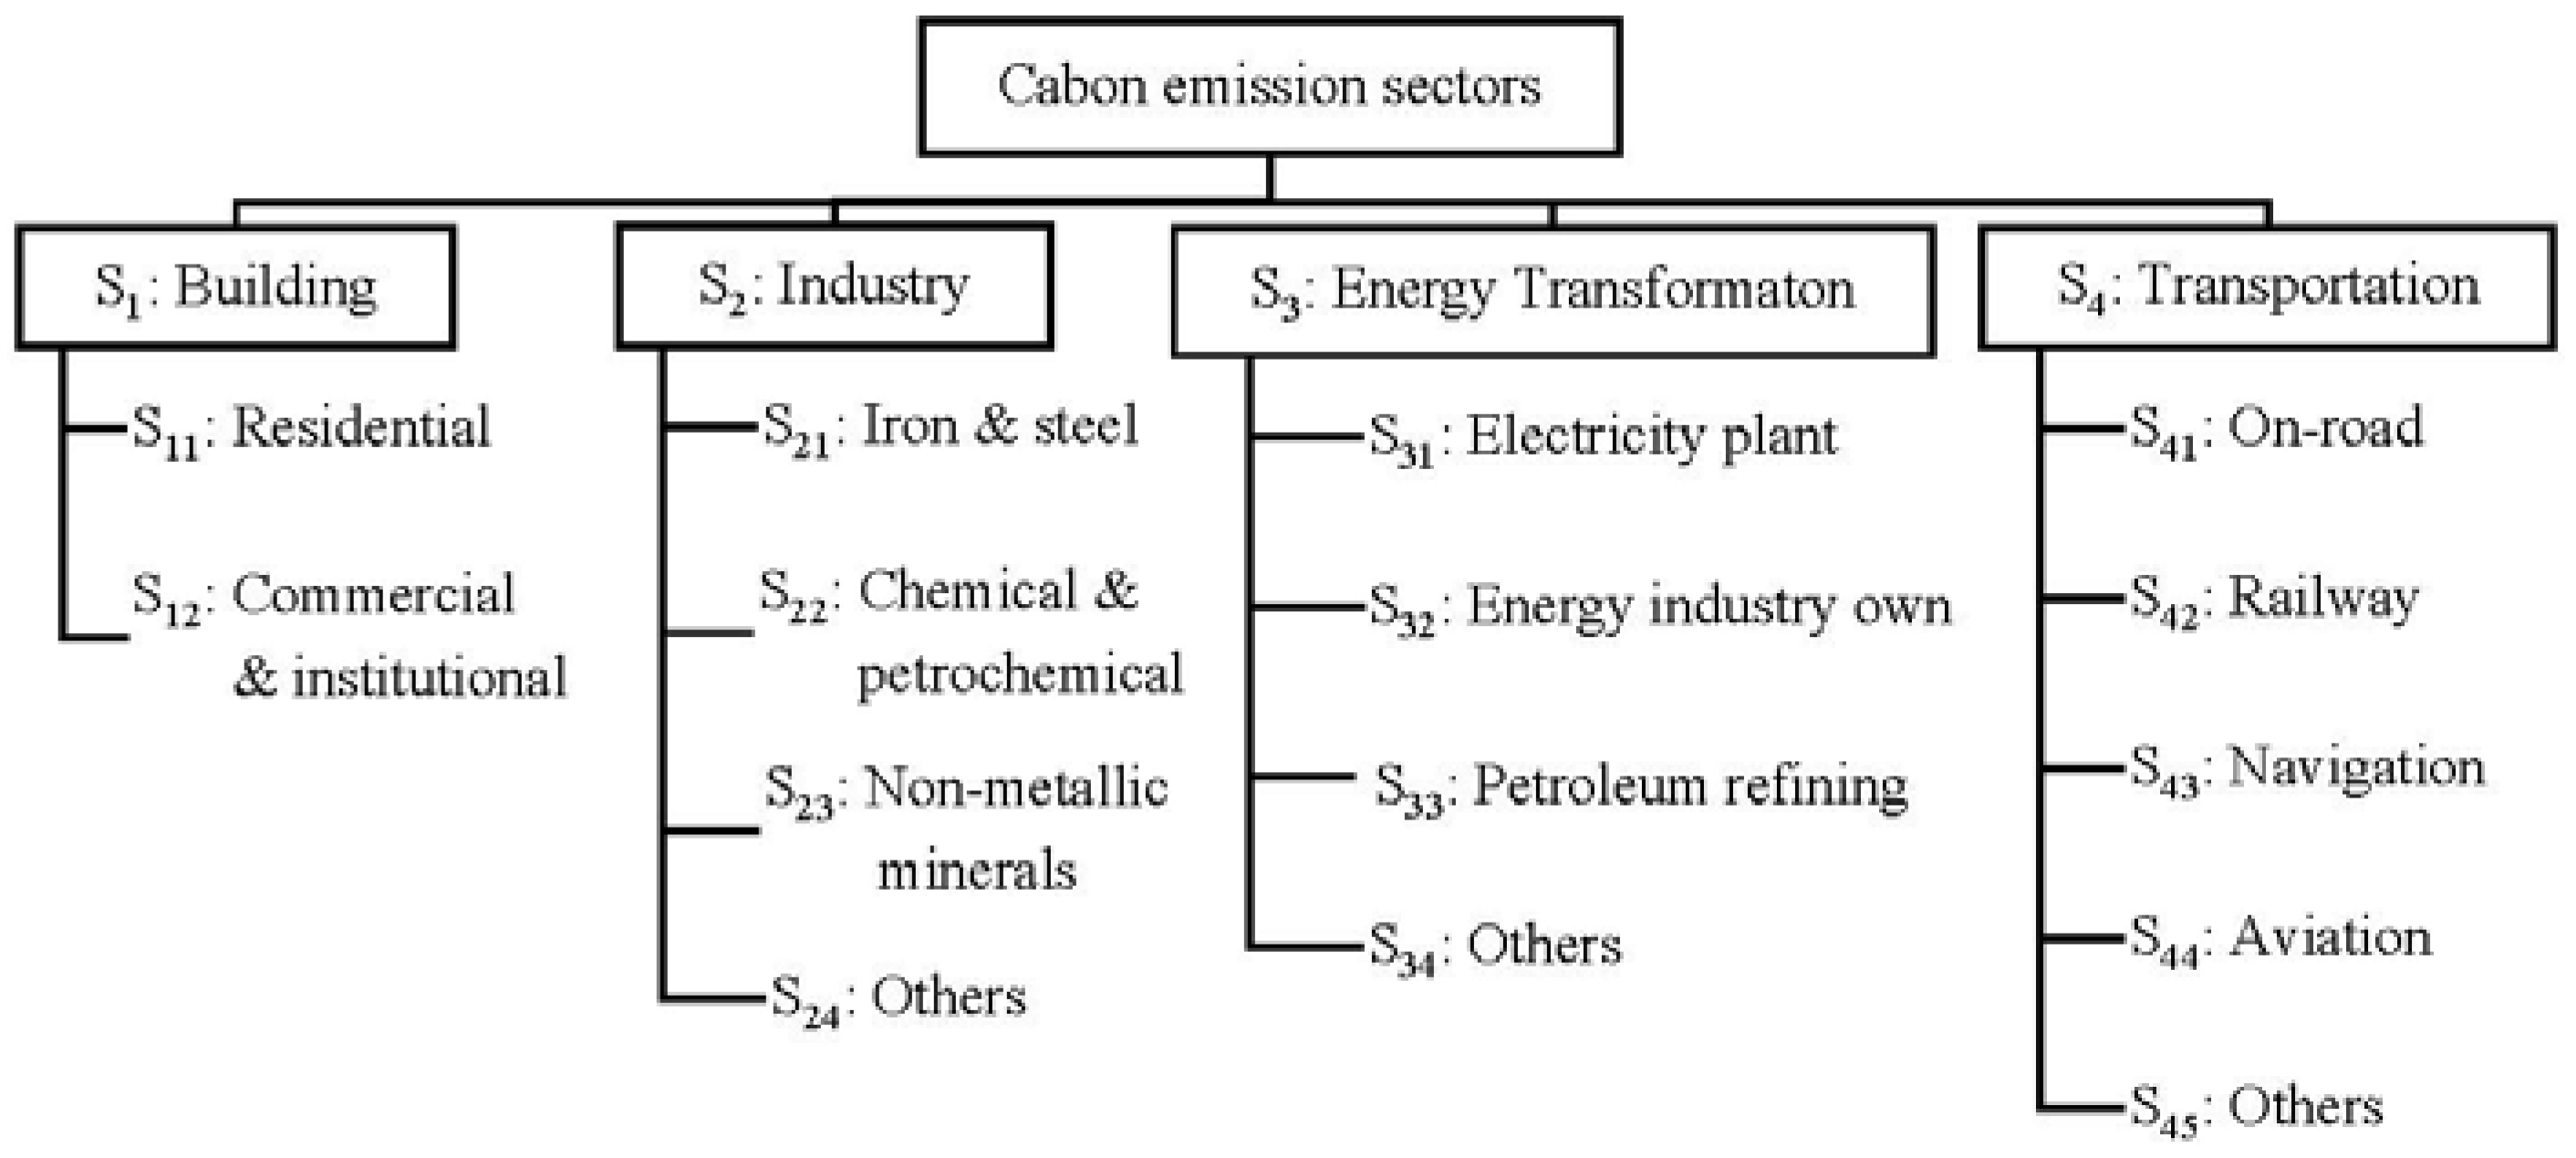
Carbon emission sectors will be classified as a basis to examine the practice of low-carbon city;
(2)
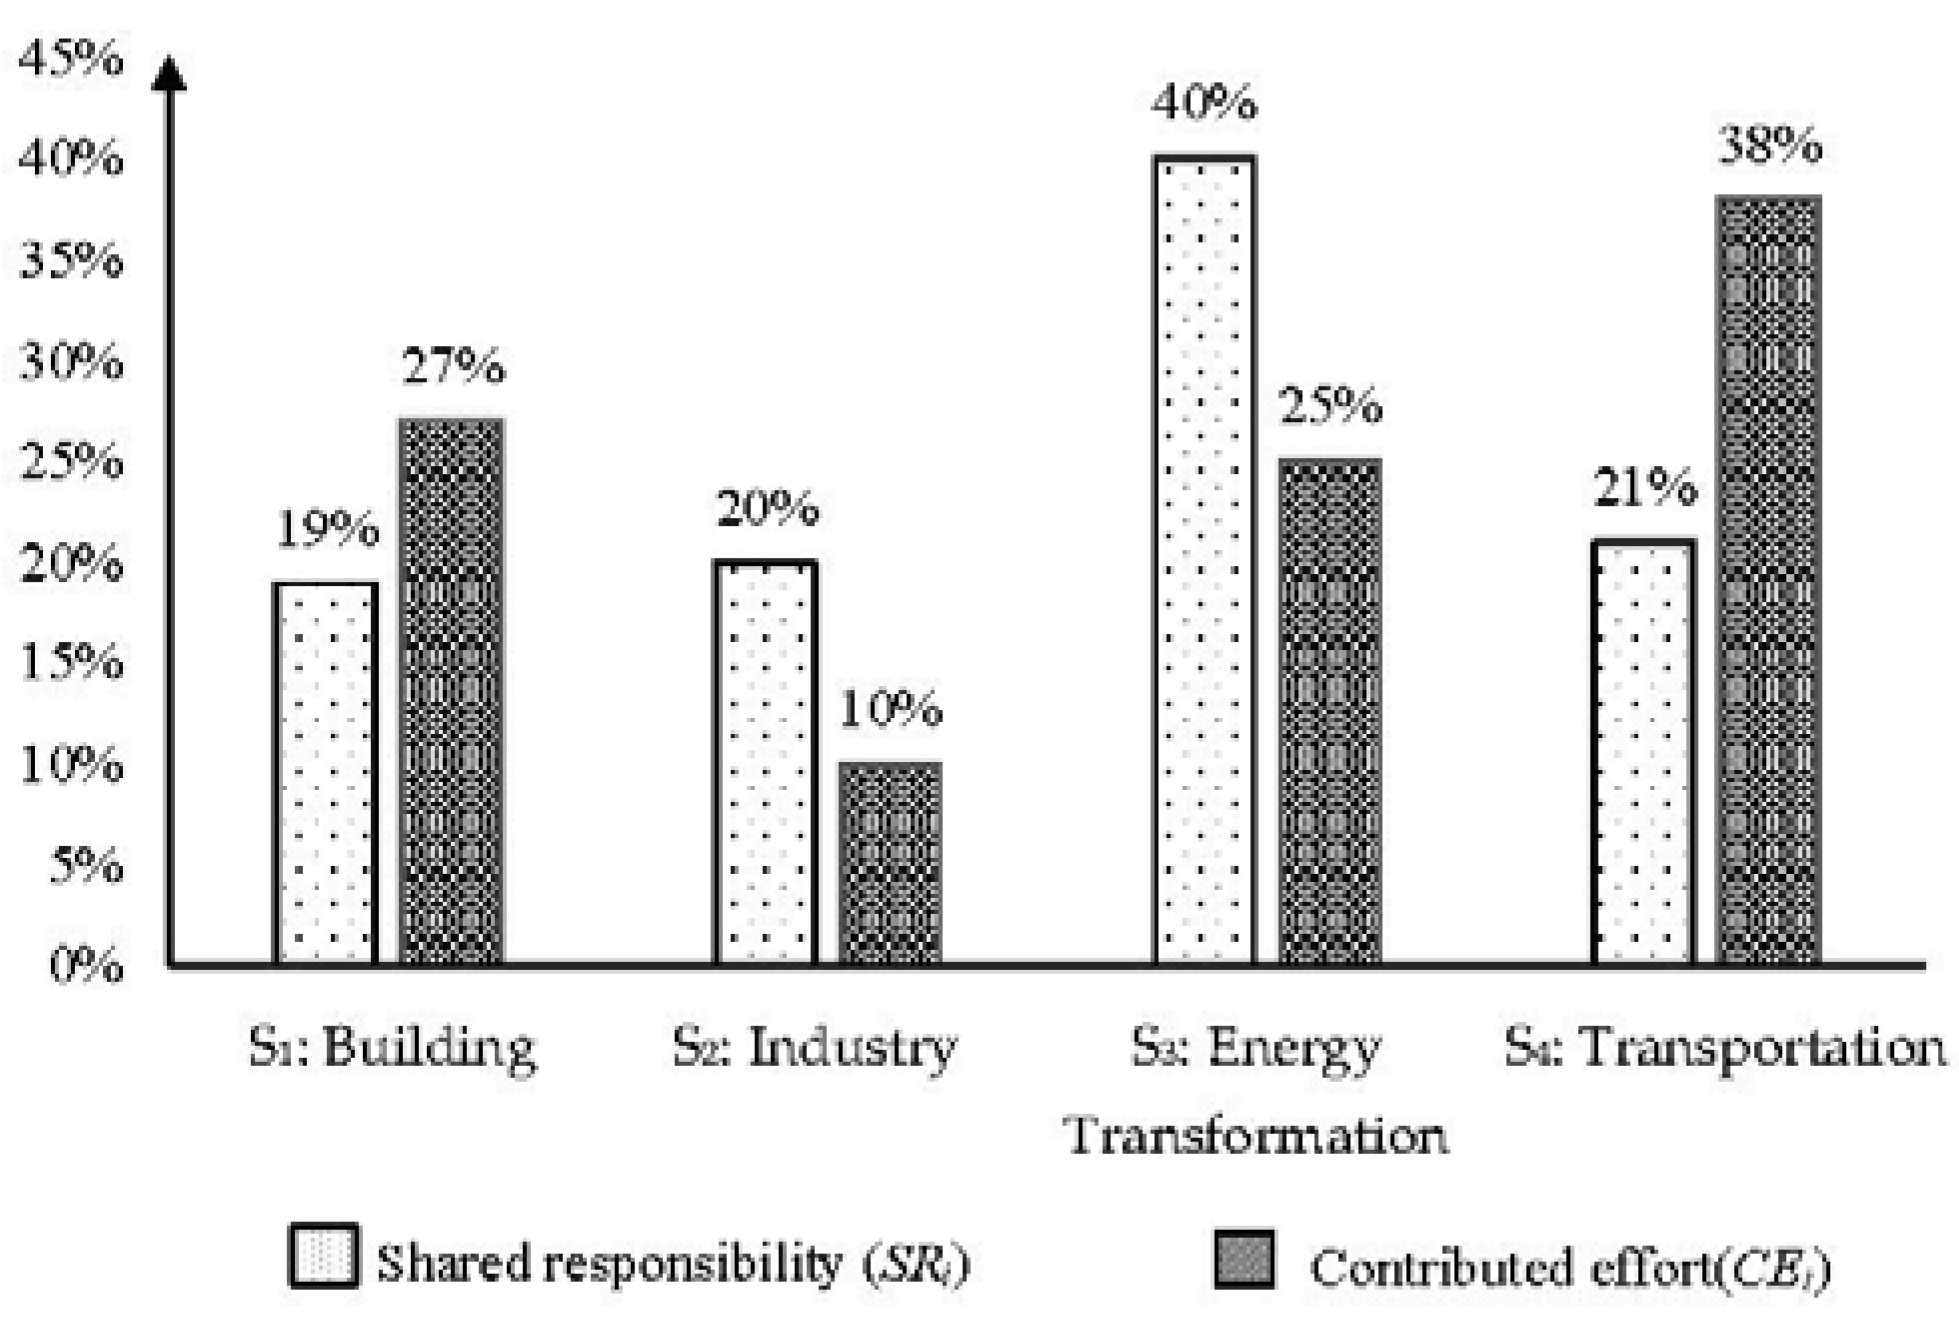
The shared responsibility of individual emission sector is calculated to determine the level of efforts each sector should contribute;
(3)
The contributed efforts by individual emission sector is analyzed to figure out whether the efforts are sufficient.
The procedures of these research works can be presented graphically, as shown in Figure 1.
Carbon emission sectors will be classified through conducting comprehensive literature review. As this research aims to examine the implementation practice of low-carbon cities from a global perspective, it is important that the classification of carbon emission sectors is adaptable globally. Therefore, literature and global guidance for carbon emission reduction will be referred for the classification of these sectors.
Secondly, the shared responsibility of emission sector i (SRi) is calculated according to formula (1).
  S R i = C i i = 1 m C i   i = 1 ,   2 ,   3 ,     m
It assumed that there are m emission sectors. Ci is the carbon emissions released by sector i, which is calculated based on the method provided by Intergovernmental Panel on Climate Change (IPCC). This method is widely used by researchers to calculate carbon emissions from the perspective of energy consumption [26,27,28,29]. The method is expressed in the following formula:
  C i = 44 12 j = 1 k K j × E i j   i = 1 ,   2 ,   3 ,     m  
In applying this method, it is assumed that there are k types of energy. For a specific emission sector i, the consumption on energy j is Eij, which needs to be converted to standard coal equivalent in applying model (2). The expression 44 12 in the formula (2) represents the molar ratio of carbon dioxide to carbon atom. Kj is the carbon emission factor of energy j. In the third part of this research, efforts contributed in emission reduction by individual sector i will be obtained through examining the emission reduction policies adopted within the sector. These policies can be identified from examining literatures and official documents. In this study, a group of sample cities are selected globally. It is considered that major policies will be included in these city plans for promoting low-carbon city. These plans include various emission reduction policies, which are specified in implementation measures and terms in various sectors, such as building and transportation. Based on the identification of the emission reduction policies designed for each emission sector, the efforts contributed by a concerned sector will be evaluated from three perspectives, namely, the number of policies designed for the sector, the enforcement degree of a specific policy, and the number of cities that adopt the policy. The contributed efforts by sector i (CEi) can therefore be evaluated through the following formula:
  C E i = C E i ' i = 1 m C E i '   i = 1 ,   2 ,   3   m
  C E i ' = j = 1 n D i j × N i j   i = 1 ,   2 ,   3     m
where n represents the total number of emission reduction policies introduced for emission sector i. Nij represents the number of cities adopting the policy j in their work plans for emission sector i. Dij represents the enforcement degree of the policy j in sector i. Dij can be classified into three levels according to the principle of policy instrument and the references provided by the World Bank (WB) and the Organization for Economic Co-operation and Development (OECD) [30,31], as shown in Figure 2.
In the enforcement framework, Mandatory Administration Policy (MP) is taken by the government departments, which leads to carbon emission reductions directly. Economic Incentive Policy (IP) is issued by government departments, which stimulates organizations and public to reduce carbon emissions by receiving economic compensation or penalty. Voluntary Scheme Policy (VP) is proposed by government departments as reference guidelines to promote carbon emission reduction in a society. In using this framework, the value of Dij is designed by considering that a higher enforcement degree will request for more efforts, and vice versa. According to this analogy, Dij is given with a value of 3 if a concerned policy is Mandatory Administration Policy, a value of 2 if the policy is Economic Incentive Policy, and a value of 1 if the policy is Voluntary Scheme Policy.
For examining whether the contributed efforts are sufficient in each emission sector to promote low-carbon city, the comparison will be conducted between the shared responsibility of individual emission sector i, SRi, in formula (1) and the contributed efforts by the sector, CEi, in formula (3).

3. Carbon Emission Sectors

The existing research works have presented different types of classifications of carbon emission sectors. In analyzing the distribution of emission reduction potentials, Akimoto et al. [32] identified six carbon emission sectors, including power, industries, transportation, residential & commercial, agriculture, and waste. The study by Alcantara and Padilla [33] presents five major emission sectors, including building, domestic transport, chemical, food, and restaurants and hotels. Lynn et al. [23] proposed a classification of carbon emission sectors based on energy end-user, including industry, residential, commercial, transport, and electric power. Whilst the sources of carbon emissions are multiple, they can be classified into two categories: emissions from energy consumption and that from non-energy consumption activities. Energy consumption includes the consumption on coal, oil, natural gas, nuclear power etc. These consumptions will generate carbon emissions, called energy consumption emissions. On the other hand, there are non-energy consumption activities that can also generate emissions, such as chemical or physical transformation of material, disposal of waste, and the respiration of plants and animals. It is commonly appreciated that energy consumption is the dominant source of carbon emissions, whilst non-energy consumption emissions have limited reduction potential [34,35,36]. Therefore, the carbon emission sectors referred in this study are classified from the perspective of energy consumption.
Classification of emission sectors has been addressed in various indicator systems introduced for guiding the practice of low-carbon city by various international organizations. For example, the United Nations Human Settlements Program issued the Planning for Climate Change [37]. The International Energy Agency issued the World Energy Balance [38]. The World Resources Institute, C40 Cities, and the International Council for Local Environmental Initiatives jointly issued the Global Protocol for Community-Scale Greenhouse Gas Emission Inventories [39]. In referring to these international guidelines, four carbon emission sectors are classified, including Building, Industry, Energy Transformation, and Transportation, with each composing of a number of sub-sectors. Figure 3 presents a framework of emission sectors, which will be used as a basis for analysis in this study.
In Figure 3, the carbon emission in Building sector is generated by residential buildings, commercial and institutional buildings. Industry emission sector is specified by sub-sectors as listed in the International Standard Industrial Classification of All Economic Activities (ISIC) [40]. Energy Transformation comprises the conversion of primary forms of energy to secondary and further transformation (e.g., coking coal to coke, crude oil to oil products, and fuel oil to electricity). Transport sector refers to all types of transport activities (in mobile engines) across all economic sectors.

4. Shared Responsibility of Individual Emission Sectors

The shared responsibility of individual emission sector i will be calculated by applying the formulas (1) and (2). For conducting the calculation, the data of the consumption on various types of energy by all individual sectors listed in Figure 3 need to be collected, which can be calculated according to the 2014 World Energy Balance (WEB) report. In WEB, there are 37 sectors related to this research, and their energy consumption data have also been provided, as shown in the Appendix Table A1. These 37 sectors are aggregated into 15 sectors as shown in Figure 3 according to the principle of industry combination [41,42]. The details of the aggregation are shown in Table 1.
By referring to the data in Table A1 and Table 1, the energy consumption data about all the aggregated sectors can be calculated, as shown in Table 2.
It is noted in Table 2 that there are negative values in the sectors S31, S33, and S34. This is because these sectors not only consume energy, including coal, crude oil, natural gas, and biofuels, but also generate energy, including oil products, heat, and electricity. The emissions from energy consumptions are offset by the energy generated.
The carbon emission factors for energy in Table 2 are quoted from the research by Wang and Ye [29]. However, the emission factors of oil products and biofuels are not offered in the reference [29] and will be calculated indirectly. In fact, emission factors of oil products and biofuels are given in the 2006 IPCC Guidelines for National Greenhouse Gas Inventories [43] but are measured in different calculation units. Therefore, a conversion coefficient will be used to convert the values of the emission factors given in [43] to the values in line with the reference [29]. For obtaining the conversion coefficient, a product (for example, crude oil) for which its emission factor is available both in [29] and [43] needs to be referred. In this case, the emission factor of crude oil in [29] is 0.5857 tC/tce, and that in [43] is 73.3 tC/TJ. It can be seen the calculation units in the two references are different. The conversion coefficient between the value offered in [29] and that in [43] can be calculated: 73.3/0.5857 = 125.1 (tce/TJ). In other words, the conversion coefficient for converting the values of the emission factors measured in IPCC [43] to the value in line with the reference [29] is 125.1 tce/TJ. With this conversion coefficient, the emission factors of oil products and biofuels can be obtained.
There are 13 major types of oil products and 10 types of biofuels [38], as presented in Table 2. The emission factors for these individual types of products are available in IPCC [43]. The emission factor of oil products can be measured by the average value of the 13 kinds of oil products, which is 71.0 tC/TJ. Similarly, the emission factor of biofuels is measured by the average value of 10 biofuels [38], which is 80.4 tC/TJ. These two values now can be converted to the values measured in the way adopted in the reference [29], with the results of 71.0/125.1 = 0.5675 tC/tce and 80.4/125.1= 0.6427 tC/tce, respectively. These two values, together with other values for all types of energy in [29] will be used for further analysis, as shown in Table 3.
By applying the data in Table 2 and Table 3 to formula (2), carbon emissions released by various sectors can be obtained, as shown in Table 4,
By applying the data in Table 4 to formula (1), the shared responsibility between four emission sectors can be obtained, as shown in Table 5.
The shared responsibility between sub-sectors within each emission sector can also be calculated by using the same method defined in formula (1), and the results are shown in Table 6. The data in Table 5 and Table 6 can be further presented graphically, as shown in Figure 4.
As shown in Figure 4, the shared responsibilities in the sectors of Building (S1), Industry (S2), Energy Transformation (S3), and Transportation (S4) are distributed in 19%, 20%, 40%, and 21%, respectively. S3 accounts for the largest shared responsibility. This is because that the conversion of primary forms of energy to secondary or further energy forms consumes huge amount of energy and produces a vast amount of carbon emissions. Therefore, exploring appropriate carbon reduction policies in the sector S3 (Energy Transformation) is considered very important to achieve carbon abatement globally. In particular, the policy for carbon reduction in the process of producing electricity should be adopted, as it can be seen from Figure 4 that electricity plants (S31) is the major component of S3.
Figure 4 shows that S1 (Building) is another major emission sector. Within this sector, the subsectors Residential (S11) and Commercial & institutional (S12) account for 79% and 21% respectively, suggesting that carbon emissions of residential building are much more than that of commercial & institutional building. Therefore, reducing energy consumption in residential building deserves more efforts.
Figure 4 also demonstrates that S2 (Industry) is another significant emission sector, contributed by Iron and Steel (S21), Chemical and Petrochemical (S22), Non-Metallic Minerals (S23), and Others (S24), as shown in Figure 4. It can be seen that all industrial sectors have a share to the emission generation. Therefore, policies for reducing emissions in conducting all industrial activities should be explored.
In referring to the emission sector S4 (Transportation), the subcomponent of on-road (S41) is the biggest emitter. On-road transportation generally includes cars, taxis, electric bicycles and buses, and measures for reducing emissions generated from on-road transportation should be taken.

5. Contributed Effort by Individual Emission Sectors

The efforts contributed in emission reduction by the four classified emission sectors (S1, S2, S3, S4) will be analyzed in this section. The data used for the analysis are retrieved from examining sample cities’ low-carbon work plans.

5.1. Selection of Sample Cities

The sample cities are selected from these main carbon emission countries and regions, including China, the United States, the European Union, India, the Russian Federation, and Japan. It was reported that the carbon emissions from these countries and regions was more than 65% of the whole world carbon emission since 2004 [44], with the data in Table 7. Therefore, it is considered that carbon emission reduction in these countries will make significant contribution to the total emission reduction globally.
As there are many cities engaging low-carbon practice in these referred countries, the selection of sample cities is based on two criteria: (1) those on the C40 list where all members have been actively practicing low-carbon city development and (2) those cities where relevant data are publically available. As a result, 24 cities are selected, as shown in Table 8. It is realized that the time frames of the work plans for different cities are different, some even like historical data. But, cities promulgate their work plans in different years and update the work plan in different intervals. These data in Table 8 are the most updated work plans obtainable in this study.
Generally, all the work plans from different nations have covered all four emission sectors, namely, Building, Industry, Energy Transformation, and Transportation. However, different nations have different issues to focus. For example, cities in developing countries put more weights on Industrial sectors, whereas the cities in developed countries give more concern to Building and Transportation.

5.2. Contributed Efforts

According to the research method described in the Section 2, contributed efforts between various emission sectors will be analyzed by examining to what extent the emission reduction policies introduced are actually adopted in cities’ work plans. The typical emission reduction policies are defined in various guidelines issued by international organization and researchers. These guidelines are listed in Table 9.
A cluster of carbon reduction policies against four categories of emission sectors are retrieved from the guidelines specified in Table 9. The classification for a specific emission reduction policy between Mandatory Administration Policy (MP), Economic Incentive Policy (EP), or Voluntary Scheme Policy (VP) is drawn according to the method defined in Figure 2. For example, the policy of energy efficiency performance standards in new building for Building sector is a mandatory policy MP, because efficiency performance standards must be promulgated and executed by relevant government departments. As a result, three types of carbon reduction policies (MP, EP, VP) against four categories of emission sectors are retrieved, summarized in Table 10.
The number of cities that adopt the specific policies is counted by examining these sample cities’ work plans listed in Table 8. First, this counting process is conducted by individual research team members. In the case where the expression of a specific policy is not consistent between the policy specification by cities and that specified in Table 10, group discussion is organized to reach consensus. The results of the calculation are shown in Table 11, indicating the number of cities in applying specific emission reduction policies in their city work plan.
The contributed efforts in various sectors can be evaluated by applying the data in Table 11 to formulas (3) and (4), and the results are shown in Table 12 and Figure 5.
Furthermore, according to the information in Table 11, the extent of applications of the three kinds of carbon reduction policies by four emission sectors can be obtained, as shown in Table 13 and Figure 6.
It can be observed from Figure 5 that the contributed efforts by sector S4 (Transportation) accounts for much more than that for other sectors. In other words, the policies adopted for addressing emission reduction in Transportation sector account for large proportion. It can be seen from Table 13 and Figure 6 that the total number of policies adopted for reducing emission in S4 is 177. The reasons for this are not only because of the large number of policies available for this sector, but also because of the enforcement of policy application. Those popular enforced policies among sample cities are S4-MP1 (Transit-oriented transportation planning), S4-MP10 (Standards of vehicle fuel using efficiency), and S4-MP13 (Improving walk and bicycle path environment), as shown in Table 11.
Figure 5 also demonstrates that the contributed efforts by S1 (Building) and S3 (Energy Transformation) accounts for significant proportions, which are 27%, 25% respectively. This indicates that a reasonable number of policies for these two sectors have been adopted. Although the total number of policies adopted for reducing emission in S3 is smaller than that in S1, there are more Mandatory Administration Policies (MPs) adopted in S3, as shown in Figure 6. Therefore, the efforts contributed in S1 and S3 are both relatively good.
It is interesting to note that the efforts contributed by sector S2 (Industry) accounts for a small proportion. In referring to Table 10, there are a number of emission reduction policies available for S2, but the number of cities that adopt these policies is small.

6. Discussion and Policy Implications

Comparative discussions will be conducted between the shared responsibilities and contributed efforts in referring to individual emission sectors. The purpose of the comparison is to demonstrate whether the efforts contributed by each emission sector are sufficient in promoting low-carbon city. By using the data in Table 5 and Table 12, the gaps between the shared responsibility (SRi) and contributed efforts (CEi) across four emission sectors can be obtained, as shown in Figure 7.
Figure 7 tells that the efforts contributed in sector S1 and S4 are more than their responsibilities, whist the efforts by S2 and S3 are less than their corresponding responsibilities. Based on the information in Figure 7, the level of efforts sufficiency, denoted as τ , between four emission sectors can be found, as shown in Figure 8.
It can be observed from Figure 8 that S1 (Building) and S4 (Transportation) are well attended sectors in terms of the level of efforts sufficiency. However, S2 (Industry) and S3 (Energy Transformation) are less-attended.

6.1. Attended Emission Sectors

Figure 8 demonstrates that S4 (Transportation) is a significantly attended sector with a high positive value of τ . The reason why emission reduction in Transportation sector is favored is that the improvement of emission reduction in this sector can produce more co-benefits in achieving both climatic and other environmental goals simultaneously [76,77]. Furthermore, development of low-carbon transport system, for example walking track and biking, will improve walkability and mobility throughout the community. In this way, people can save time from congested roadways, and accident-related injuries can be reduced as well [78,79]. Therefore, emission reduction in transport system has been given with priority by governments through adopting more effective policies.
Furthermore, it appears that the effectiveness of emission reduction policies in S4 can be observed in short time. For example, “Transit-oriented transportation planning (S4-MP1),” “Standards of vehicle fuel using efficiency (S4-MP10),” “Improving walk and bicycle path environment (S4-MP13),” and “Parking fees (S4-EP2)” are all considered effective in many sample cities. Some cities have contributed great efforts in addressing emission reduction in transport system. For example, New York introduced 11 types of emission reduction measures in Transport sector for the aim of reducing 363.3 million metric tons carbon emissions from 2011 to 2030 [50]. Amsterdam has been promoting renewable-energy vehicles with the aim of powering 60 to 90% vehicles with green electricity generated by windmills, solar panels, and biomass power stations [61].
According to Figure 8, S1 (Building) is another attended sector in terms of emission reduction. It is widely appreciated that improving energy efficiency in Building sector can achieve a diverse set of community co-benefits, including reduction of pollutant emissions, increase of home value, and better security in energy appliances [52]. Typical carbon reduction policies aimed at energy saving in Building sector include S1-EP4 (Subsidies and tax credits for weatherization), S1-EP5 (Subsidies for purchasing energy-efficient equipment), and S1-VP6 (Encourage solar installation). Application of these energy saving policies can lead to the reduction of energy consumption and cost saving, thus the application can be supported and participated by citizens.
The significance of co-benefits from emission reduction policies has also been appreciated in previous studies. For example, Kousky and Schneider [76] pointed out that implementation of emission reduction policies is not driven primarily by public pressure, nor wholly for climate protection, but instead, by perceived co-benefits and cost savings.

6.2. Less-Attended Emission Sectors

Figure 8 demonstrates that sectors S2 (Industry) and S3 (Energy Transformation) are less-attended with negative values of τ . There are various reasons why the efforts for emission reduction in Industry sector is not sufficiently given in comparing to the shared responsibility by the sector. Industry sector involves a complex chain of activities, such as iron and steel, mining and quarrying, food and tobacco, and textile and leather. As different industrial activities have different production processes, it is more difficult to introduce mandatory reduction targets across all industrial activities. Usually, governments tend to focus on high-emission industries. For example, Beijing eliminated more than 3,000 high-emission industrial companies during 2010 to 2015 [45] with the aim of improving air quality. However, it is far from sufficient by only addressing emission produce among the high emission industrial activities. The efforts need to be contributed to all types of industry activities. For example, policies such as carbon tax relief (S2-EP1) and carbon trading (S2-EP3) can be introduced to all types of industrial activities to encourage emission reduction.
On the other hand, as the development of industry is one of the driving forces for economy growth particularly to developing countries, emission reduction in industrial production process usually is not positioned as priority. Other research works have also appreciated that countries in general focus more on the domestic interests of economic development instead of the global issue of carbon emission reduction [80]. There are a few cities which have contributed efforts in reducing emissions emitted from industrial activities, such as carbon cap-and-trade program in Tokyo [67], Shenzhen [48]. To encourage more cities to contribute efforts in industrial carbon reduction at global level, collaboration programs should be established. For example, the financial supports from developed countries and cities to those less developed countries for improving technologies in operating industrial activities.
Figure 8 also tells that sector S3 (Energy Transformation) is a significant less-attended emission sector. In fact, the contributed efforts by this sector is reasonably significant, as shown in Figure 7. However, the shared responsibility by this sector is much larger than that by the other sectors. The reason for the large shared responsibility by S3 is that emission generation from energy transformation is the major emission source. On the other hand, the room for contributing efforts in implementing policies to improve energy transformation in a specific city is limited, because the change of energy transformation mainly for electricity generation to clean-energy transformation will cost huge capital, which is not viable for many local governments. For example, the cost of wind power generation would be well over $1.3 billion to provide less than 1.5% of Hong Kong’s total electricity consumed [47], which cannot be afforded by many developing countries or cities. Therefore, cooperation is needed to develop clean energy between cities at global level.
It is good to note that many cities have been devoting efforts in developing clean energy instead of fossil fuels for electricity generation, such as solar energy and wind power. For example, among the 24 sample cities, 19 cities have launched solar power generation program, 16 cities have launched wind power generation program. Nevertheless, the efficiency improvement of traditional power plants is neglected to a large extent. For example, only four cities among the 24 sample cities have the program of improving power generation efficiency for reducing emissions. It is appreciated the improvement of Energy Transformation by replacing fossil fuels with clean energy requires more investment, and its effectiveness will be realized in a long time [81]. It is therefore considered that the practice of energy transformation dominated by fossil fuels will not be changed in a short time. However, the immediate emission reduction can be obtained through improving the efficiency of traditional power plants. Therefore, more efforts in applying policies to develop clean-energy power generation and improve efficiency of traditional power plants should be promoted collectively in order to achieve emission reduction in the sector of Energy Transformation.

7. Conclusions

The findings from this study show that, from a global perspective, the biggest carbon emitting sector is Energy Transformation, followed by Transport, Industry, and Building. The best effort contributor in addressing emission reduction is Transportation, followed by Building, Energy Transformation, and Industry. The sector of Building and Transport are well attended as the efforts contributed in these two sectors are more than their shared responsibilities. The emission sectors of Industry and Energy Transformation are less-attended as there are not sufficient efforts given in comparing to their shared responsibilities.
The findings provide important reference for governments to adopt effective reduction policies. The experience gained in the two good performers—namely, Building and Transport—can be promoted among cities or countries within global context. Less-attended sectors—namely, Energy Transformation and Industry—should be given more attention in order to achieve global carbon reduction. The lessons and difficulties encountered in the two poor performers should be surmounted in collaboration between cities.
The innovation and contribution of this study mainly lie in the following aspects. First, it provides a comprehensive understanding of global carbon emission composition, which is helpful to figure out which sectors should contribute more efforts in addressing emission reduction. Second, the holistic examination on low-carbon city policies provides governments with options on effective carbon reduction policies. Furthermore, the identification of less-attended emission sectors demonstrates the areas where should be contributed more efforts in order to achieve the mission of emission reduction. One typical limitation of this study is that the data obtained from IPCC, WEB, and the work plans of the sample cities in the study are not most updated. The further study is recommended when more updated data are available. Furthermore, investigating benchmarks for examining the performance of low-carbon city practice in referring to specific cities under different circumstances can be conducted in further research.

Author Contributions

L.S. conceived the study and contributed substantially to revising the manuscript. Y.L. analyzed the data and drafted the manuscript. Z.H. and Y.W. contributed to revising the manuscript. H.L. and G.L. contributed to polishing the article.

Funding

This research was funded by [National Social Science Foundation of China] grant number [15AZD025], and [17ZDA062].

Conflicts of Interest

The authors declare no conflict of interest.

Appendix A

Table A1. Energy consumption by various sectors from WEB.
SectorSub-SectorCoalCrude OilOil ProductsNatural GasBiofuelsHeatElectricity
Transformation Process and Energy industryE1. Transfers0.67292.66−330.350.000.000.000.00
E2. Statistical differences31.30−0.17−6.44−20.97−0.230.640.61
E3. Electricity plants3018.6058.03288.421101.55135.761.03−2174.81
E4. CHP plants235.160.0124.39439.3482.04−211.88−256.73
E5. Heat plants186.180.9718.84112.6016.36−256.680.54
E6. Blast furnaces299.780.000.540.230.070.000.00
E7. Gas works15.600.003.90−7.260.130.000.00
E8. Coke/pat.fuel/BKB/PB plants108.930.004.000.010.170.000.00
E9. Oil refinries0.005890.16−5785.260.000.000.000.00
E10. Petrochemical plants0.00−47.1446.600.000.000.000.00
E11. Liquefaction plants13.81−20.040.0024.890.000.000.00
E12. Other transformation0.61−14.390.7416.97118.431.040.00
E13. Energy industry own use145.3716.31293.28416.7119.9149.73203.14
E14. Losses5.5612.710.9331.100.2727.97241.85
TransportE15. World aviation bunkers0.000.00240.690.000.000.000.00
E16. Domestic aviation0.000.00153.600.000.000.000.00
E17. Road0.000.002663.8454.43104.460.000.31
E18. Rail4.010.0042.370.000.360.0023.22
E19. Pipeline transport0.000.000.5084.290.000.003.89
E20. World marine bunkers0.000.00278.060.000.110.000.00
E21. Domestic navigation0.000.0076.220.160.610.000.00
E22. Non-specified0.070.0010.991.000.010.004.41
IndustryE23. Iron and steel470.900.001.0179.065.0022.10118.02
E24. Chemical and petrochemical142.000.0978.57172.952.3371.77117.34
E25. Non-ferrous metals34.690.007.1024.000.094.79113.76
E26. Non-metallic minerals346.610.0159.2978.2212.964.4660.27
E27. Transport equipment5.190.002.9417.040.075.7733.70
E28. Machinery20.560.0010.3036.730.237.64112.25
E29. Mining and quarrying14.690.0032.8710.290.243.3042.17
E30. Food and tobacco46.000.0115.6064.6044.0315.7357.87
E31. Paper pulp and printing27.190.006.3933.2187.4017.0048.46
E32. Wood and wood products5.190.002.964.1410.842.8914.57
E33. Construction6.940.0041.169.700.471.9121.46
E34. Textile and leather19.930.015.748.910.399.9441.02
E35. Non-specified86.579.59147.02101.90112.428.44188.19
OtherE36.Residential107.220.00295.83599.531210.75150.45535.91
E37.Commercial and public services49.960.00122.15259.6134.9950.36437.94

References

  1. Burck, J.; Marten, F.; Bals, C. The Climate Change Performance Index Results 2018. 2017. Available online: https://germanwatch.org/en/14639 (accessed on 5 January 2018).
  2. World Bank. World Bank Group Climate Change Action Plan; World Bank: Washington, DC, USA, 2016. [Google Scholar]
  3. Haeberli, W. WGMS (World Glacier Monitoring Service); Springer: Dordrecht, The Netherlands, 2011; p. 1227. [Google Scholar]
  4. Jakob, M.; Steckel, J.C. How climate change mitigation could harm development in poor countries. Wiley Interdiscip. Rev. Clim. Chang. 2013, 5, 161–168. [Google Scholar] [CrossRef]
  5. Cornwall, W. CLIMATE SCIENCE. Efforts to link climate change to severe weather gain ground. Science 2016, 351, 1249–1250. [Google Scholar] [CrossRef] [PubMed]
  6. Shuai, C.; Chen, X.; Shen, L.; Jiao, L.; Wu, Y.; Tan, Y. The turning points of carbon kuznets curve: Evidences from panel and time-series data of 164 countries. J. Clean. Prod. 2017, 162, 1031–1047. [Google Scholar] [CrossRef]
  7. Chang, H.H.; Zhou, J.; Fuentes, M. Impact of Climate Change on Ambient Ozone Level and Mortality in Southeastern United States. Int. J. Environ. Res. Public Health 2010, 7, 2866–2880. [Google Scholar] [CrossRef] [PubMed] [Green Version]
  8. Meehl, G.A.; Washington, W.M.; Collins, W.D.; Arblaster, J.M.; Hu, A.; Buja, L.E.; Strand, W.G.; Teng, H. How Much More Global Warming and Sea Level Rise? Science 2005, 307, 1769–1772. [Google Scholar] [CrossRef] [PubMed] [Green Version]
  9. Hermann, E.; Kempf, W. Climate Change and the Imagining of Migration: Emerging Discourses on Kiribati's Land Purchase in Fiji. Contemp. Pac. 2017, 29, 231–263. [Google Scholar] [CrossRef]
  10. Keeling, R.E.; Körtzinger, A.; Gruber, N. Ocean deoxygenation in a warming world. Annu. Rev. Mar. Sci. 2010, 2, 199–229. [Google Scholar] [CrossRef] [PubMed]
  11. N Cummingbruce. Tallies Toll of Climate Extremes; in 2 Decades, 600,000 Died in Weather-Related Events Affecting 4.1 Billion. New York Times, 25 November 2015. [Google Scholar]
  12. Cooper, R.N. Climate Change 1995: Economic and Social Dimensions of Climate Change. Glob. Environ. Chang. 1996, 7, 189–190. [Google Scholar] [CrossRef]
  13. Gustavsson, L.; Börjesson, P.; Johansson, B.; Svenningsson, P. Reducing CO2 emissions by substituting biomass for fossil fuels. Energy 1995, 20, 1097–1113. [Google Scholar] [CrossRef]
  14. C40 Cities Climate Leadership Group. 2018. Available online: www.c40.org/cities (accessed on 5 January 2018).
  15. Gomi, K.; Shimada, K.; Matsuoka, Y. A low-carbon scenario creation method for a local-scale economy and its application in Kyoto city. Energy Policy 2010, 38, 4783–4796. [Google Scholar] [CrossRef]
  16. Zuo, J.; Read, B.; Pullen, S.; Shi, Q. Achieving carbon neutrality in commercial building developments—Perceptions of the construction industry. Habitat Int. 2012, 36, 278–286. [Google Scholar] [CrossRef]
  17. Xiao, H.; Wei, Q.; Wang, H. Marginal abatement cost and carbon reduction potential outlook of key energy efficiency technologies in China’s building sector to 2030. Energy Policy 2014, 69, 92–105. [Google Scholar] [CrossRef]
  18. Shuai, C.; Shen, L.; Jiao, L.; Wu, Y.; Tan, Y. Identifying key impact factors on carbon emission: Evidences from panel and time-series data of 125 countries from 1990 to 2011. Appl. Energy 2017, 187, 310–325. [Google Scholar] [CrossRef]
  19. Gilmore, E.A.; Clair, T.S. Budgeting for climate change: Obstacles and opportunities at the US state level. Clim. Policy 2017, 1–13. [Google Scholar] [CrossRef]
  20. Phdungsilp, A. Integrated energy and carbon modeling with a decision support system: Policy scenarios for low-carbon city development in Bangkok. Energy Policy 2010, 38, 4808–4817. [Google Scholar] [CrossRef]
  21. Lo, K. China’s low-carbon city initiatives: The implementation gap and the limits of the target responsibility system. Habitat Int. 2014, 42, 236–244. [Google Scholar] [CrossRef]
  22. Liu, W.; Qin, B. Low-carbon city initiatives in China: A review from the policy paradigm perspective. Cities 2016, 51, 131–138. [Google Scholar] [CrossRef]
  23. Lynn, P.; Zhou, N.; Fridley, D.; Ohshita, S.; Lu, S.; Zheng, N.; Fino-Chen, C. Development of a low-carbon indicator system for China. Habitat Int. 2013, 37, 4–21. [Google Scholar] [Green Version]
  24. Zhou, G.; Singh, J.; Wu, J.; Sinha, R.; Laurenti, R.; Frostell, B. Evaluating low-carbon city initiatives from the DPSIR framework perspective. Habitat Int. 2015, 50, 289–299. [Google Scholar] [CrossRef]
  25. Wu, J.; Xu, N.; Zhang, X. Evaluation of low-carbon city and spatial pattern analysis in China. Prog. Geogr. 2016, 35, 204–213. [Google Scholar]
  26. Cheng, Y.; Wang, Z.; Ye, X.; Wei, Y.D. Spatiotemporal dynamics of carbon intensity from energy consumption in China. J. Geogr. Sci. 2014, 24, 631–650. [Google Scholar] [CrossRef]
  27. Meng, L.; Graus, W.; Worrell, E.; Huang, B. Estimating CO2 (carbon dioxide) emissions at urban scales by DMSP/OLS (Defense Meteorological Satellite Program’s Operational Linescan System) nighttime light imagery: Methodological challenges and a case study for China. Energy 2014, 71, 468–478. [Google Scholar] [CrossRef]
  28. Su, Y.; Chen, X.; Li, Y.; Liao, J.; Ye, Y.; Zhang, H.; Huang, N.; Kuang, Y. China’s 19-year city-level carbon emissions of energy consumptions, driving forces and regionalized mitigation guidelines. Renew. Sustain. Energy Rev. 2014, 35, 231–243. [Google Scholar] [CrossRef]
  29. Wang, Z.; Ye, X. Re-examining environmental Kuznets curve for China’s city-level carbon dioxide (CO2 mathContainer Loading Mathjax) emissions. Spat. Stat. 2016, 21, 377–389. [Google Scholar] [CrossRef]
  30. Opschoor, J.B. Managing the Environment: The Role of Economic Instruments. Fuel Energy Abstr. 1995, 36, 373. [Google Scholar]
  31. World Bank. Five Years after Rio: Innovations in Environmental Policy. 1997. Available online: http://documents.worldbank.org/curated/en/209081468739294734/pdf/multi-page.pdf (accessed on 5 January 2018).
  32. Akimoto, K.; Sano, F.; Homma, T.; Oda, J.; Nagashima, M.; Kii, M. Estimates of GHG emission reduction potential by country, sector, and cost. Energy Policy 2010, 38, 3384–3393. [Google Scholar] [CrossRef]
  33. Alcántara, V.; Padilla, E. “Key” sectors in final energy consumption: An input–output application to the Spanish case. Energy Policy 2003, 31, 1673–1678. [Google Scholar] [CrossRef]
  34. Intergovernmental Panel on Climate Change. IPCC Fourth Assessment Report: Climate Change 2007; Intergovernmental Panel on Climate Change: Geneva, Switzerland, 2007; pp. 1340–1356. [Google Scholar]
  35. Zhang, W.; Li, K.; Zhou, D.; Zhang, W.; Gao, H. Decomposition of intensity of energy-related CO2 emission in Chinese provinces using the LMDI method. Energy Policy 2016, 92, 369–381. [Google Scholar] [CrossRef]
  36. Duan, N.; Guo, J.P.; Xie, B.C. Is there a difference between the energy and CO2 emission performance for China’s thermal power industry? A bootstrapped directional distance function approach. Appl. Energy 2016, 162, 1552–1563. [Google Scholar] [CrossRef]
  37. UN-HABITAT. Planning for Climate Change: A Strategic, Values-Based Approach for Urban Planners; UN-HABITAT: Nairobi, Kenya, 2014. [Google Scholar]
  38. International Energy Agency. World Energy Balances. 2016. Available online: www.iea.org (accessed on 5 January 2018).
  39. World Resources Institute. Global Protocol for Community-Scale Greenhouse Gas Emission Inventories. 2014. Available online: http://www.wri.org/events/2014/12/launch-global-protocol-community-scale-greenhouse-gas (accessed on 5 January 2018).
  40. Statistics Division, United Nations. International Standard Industrial Classification of All Economic Activities (ISIC), Rev. 4; United Nations: New York, NY, USA, 1990; pp. 273–276. [Google Scholar]
  41. Geng, Y.; Zhao, H.; Liu, Z.; Xue, B.; Fujita, T.; Xi, F. Exploring driving factors of energy-related CO2 emissions in Chinese provinces: A case of Liaoning. Energy Policy 2013, 60, 820–826. [Google Scholar] [CrossRef]
  42. Liang, S.; Zhang, T. What is driving CO emissions in a typical manufacturing center of South China? The case of Jiangsu Province. Energy Policy 2011, 39, 7078–7083. [Google Scholar] [CrossRef]
  43. Intergovernmental Panel on Climate Change. IPCC Guidelines for National Greenhouse Gas Inventories. 2006. Available online: http://www.ipcc-nggip.iges.or.jp/public/2006gl/chinese/index.html (accessed on 5 January 2018).
  44. World Bank. The World Development Indicators 2015 (WDI) Database. 2015. Available online: https://www.mendeley.com/research-papers/world-development-indicators-2015-wdi-database/ (accessed on 5 January 2018).
  45. Beijing Municipal Government. Energy Conservation and Climate Action Plan; Beijing Municipal Government: Beijing, China, 2016.
  46. Shanghai Municipal Government. Thirteenth Five-Year Plan of Economic and Social Development; Shanghai Municipal Government: Shanghai, China, 2016.
  47. Hong Kong Environment Bureau. Hong Kong’s Climate Action Plan 2030; Hong Kong Environment Bureau: Hong Kong, China, 2017.
  48. Shenzhen Development and Reform Commission. Mid-Long Term Plans of Low-Carbon Development; Shenzhen Development and Reform Commission: Shenzhen, China, 2012.
  49. Wuhan Municipal Government. Action Plan of Low-Carbon City Pilot; Wuhan Municipal Government: Wuhan, China, 2013.
  50. New York State Climate Action Council. Climate Action Plan Interim Report. 2010. Available online: https://www.dec.ny.gov/energy/80930.html (accessed on 5 January 2018).
  51. San Francisco Department of the Environment, San Francisco Public Utilities Commission. Climate Action Plan for San Francisco; San Francisco Public Utilities Commission: San Francisco, CA, USA, 2004.
  52. County of Los Angeles, Department of Regional Planning. Unincorporated Los Angeles County Community Climate Action Plan 2020; County of Los Angeles, Department of Regional Planning: Los Angeles, CA, USA, 2014.
  53. City of Chicago. Chicago Climate Action Plan. 2008. Available online: https://www.cityofchicago.org/city/en/progs/env/climateaction.html (accessed on 5 January 2018).
  54. City of Philadelphia, Sustainability Working Group. Local Action Plan for Climate Change; City of Philadelphia, Sustainability Working Group: Philadelphia, PA, USA, 2007.
  55. City of Austin, Office of Sustainability. Austin Community Climate Plan; City of Austin, Office of Sustainability: Austin, TX, USA, 2014.
  56. Seattle Office of Sustainability & Environment. Seattle Climate Action Plan; Seattle Office of Sustainability & Environment: Seattle, WA, USA, 2013.
  57. City of Portland. Climate Action Plan; City of Portland: Portland, OR, USA, 2015.
  58. London Sustainable Development Commission. A Low-Carbon London: Now and Beyond; London Sustainable Development Commission: London, UK, 2012.
  59. Senate Department for Urban Development and the Environment. Climate-Neutral Berlin 2050; Senate Department for Urban Development and the Environment: Berlin, Germany, 2016. [Google Scholar]
  60. Municipality of Milan Council of Environment. Sustainable Energy and Climate Action Plan Municipality of Milan; Municipality of Milan Council of Environment: Milan, Italy, 2009. [Google Scholar]
  61. City of Amsterdam. Amsterdam: A Different Energy; City of Amsterdam: Amsterdam, The Netherlands, 2007. [Google Scholar]
  62. City of Rotterdam. Rotterdam Program on Sustainability and Climate Change 2015–2018; City of Rotterdam: Rotterdam, The Netherlands, 2014. [Google Scholar]
  63. City of Copenhagen. Technical and Environmental Administration. In Copenhagen Climate Plan; City of Copenhagen. Technical and Environmental Administration: Copenhagen, Denmark, 2009. [Google Scholar]
  64. Environment and Health Department. Stockholm Action Plan for Climate and Energy 2010–2020; Environment and Health Department: Stockholm, Sweden, 2009. [Google Scholar]
  65. Energy Agency of Madrid. City of Madrid Energy and Climate Change Action Plan; Energy Agency of Madrid: Madrid, Spain, 2013. [Google Scholar]
  66. Chief Secretary Delhi. Climate Change Agenda for Delhi 2009–2012. 2009. Available online: http://www.indiaenvironmentportal.org.in/content/275919/climate-change-agenda-for-delhi-2009-2012/ (accessed on 5 January 2018).
  67. Tokyo Metropolitan Government. Tokyo Climate Change Strategy: Progress Report and Future Vision; Tokyo Metropolitan Government: Tokyo, Japan, 2010.
  68. Yokohama Climate Change Policy Headquarters. Yokohama City Action Plan for Global Warming Countermeasures; Yokohama Climate Change Policy Headquarters: Yokohama, Japan, 2014. [Google Scholar]
  69. World Bank. Convenient Solutions to an Inconvenient Truth: Approaches to Climate Change June 2009; World Bank: Washington, DC, USA, 2009. [Google Scholar]
  70. World Bank. The Low Carbon City Development Program (LCCDP) Guidebook: A Systems Approach to Low Carbon Development in Cities; World Bank: Washington, DC, USA, 2015. [Google Scholar]
  71. Dhar, S.; Pathak, M.; Shukla, P.R. Low Carbon City: A Guidebook for City Planners and Practitioners; Springer: New York, NY, USA, 2013; pp. 321–331. [Google Scholar]
  72. Dodman, D. Developing Local Climate Change Plans: A Guide for Cities in Developing Countries; UN-HABITAT: Nairobi, Kenya, 2012. [Google Scholar]
  73. European Climate Foundation. Roadmap 2050—A Practical Guide to a Prosperous, Low-Carbon Europe: Policy Recommendations. 2010. Available online: www.roadmap2050.eu/attachments/files/Roadmap2050-AllData-MinimalSize.pdf (accessed on 5 January 2018).
  74. Price, L.; Zhou, N.; Fridley, D.; Ohshita, S.; Khanna, N. Low-Carbon City Policy Databook: 72 Policy Recommendations for Chinese Cities from the Benchmarking and Energy Savings Tool for Low Carbon Cities; University of San Francisco: San Francisco, CA, USA, 2016. [Google Scholar]
  75. Barker, T. Mitigation from a Cross-Sectoral Perspective; Climate Change Mitigation Contribution of Working Group III to the Fourth Assessment Report of the Intergovernmental Panel on Climate Change; 2007. Available online: https://www.ipcc.ch/pdf/assessment-report/ar4/wg3/ar4-wg3-chapter11.pdf (accessed on 5 January 2018).
  76. Kousky, C.; Schneider, S.H. Global climate policy: Will cities lead the way? Clim. Policy 2003, 3, 359–372. [Google Scholar] [CrossRef]
  77. Mayrhofer, J.P.; Gupta, J. The science and politics of co-benefits in climate policy. Environ. Sci. Policy 2016, 57, 22–30. [Google Scholar] [CrossRef]
  78. Wesołowska, K.; Czarkowska-Pączek, B. Increasing the amount of walking may help prevent cardiovascular disease. Kardiol. Polska 2013, 71, 318–319. [Google Scholar] [CrossRef] [PubMed]
  79. Maizlish, N.; Woodcock, J.; Co, S.; Ostro, B.; Fanai, A.; Fairley, D. Health cobenefits and transportation-related reductions in greenhouse gas emissions in the San Francisco Bay area. Am. J. Public Health 2013, 103, 703–709. [Google Scholar] [CrossRef] [PubMed]
  80. Tørstad, V.; Sælen, H. Fairness in the climate negotiations: What explains variation in parties’ expressed conceptions? Clim. Policy 2017, 18, 642–654. [Google Scholar] [CrossRef]
  81. Moriarty, P. Why Renewable Energy Cannot Replace Fossil Fuels. Int. J. Glob. Energy Issues 2015, 13. [Google Scholar] [CrossRef]
Figure 1. Research framework.
Ijerph 15 01334 g001
Figure 2. The degree of policy enforcement by government.
Ijerph 15 01334 g002
Figure 3. Classification framework of emission sectors.
Ijerph 15 01334 g003
Figure 4. Shared responsibility between various emission sectors.
Ijerph 15 01334 g004
Figure 5. Distribution of contributed efforts in various emission sectors.
Ijerph 15 01334 g005
Figure 6. The number of the three kinds of carbon reduction policies adopted in four emission sectors.
Ijerph 15 01334 g006
Figure 7. Gaps between shared responsibility and contributed effort.
Ijerph 15 01334 g007
Figure 8. Level of efforts sufficiency.
Ijerph 15 01334 g008
Table 1. Aggregation of emission sectors.
Sector No.Aggregated SectorsSectors in WEB
S11Residential E36
S12Commercial & institutional E37
S21Iron & steelE23
S22Chemical & petrochemicalE24
S23Non-metallic mineralsE26
S24OthersE25, E27–E35
S31Electricity plantE3
S32Energy industry ownE13
S33Petroleum refiningE9, E10
S34OthersE1, E2, E4–E8, E11, E12, E14
S41On-roadE17
S42RailwaysE18
S43Waterborne navigationE20, E21
S44AviationE15, E16
S45OthersE19, E22
Table 2. Energy consumption in various sectors (Eij).
Sector No.CoalCrude OilOil ProductsNatural GasBiofuelsHeatElectricity
S11107.220.00295.83599.531,210.75150.45535.91
S1249.960.00122.15259.6134.9950.36437.94
S21470.900.001.0179.065.0022.10118.02
S22142.000.0978.57172.952.3371.77117.34
S23346.610.0159.2978.2212.964.4660.27
S24266.939.62272.08310.53256.1877.42548.70
S313018.6058.03288.421101.55135.761.03−2174.81
S32145.3716.31293.28416.7119.9149.73203.14
S330.004090.03−4016.980.000.000.000.00
S34897.602024.75−2005.13596.91217.25−438.89−11.19
S410.000.002663.8454.43104.460.000.31
S424.010.0042.370.000.360.0023.22
S430.000.00354.290.160.730.000.00
S440.000.00394.290.000.000.000.00
S450.070.0011.4984.390.010.003.60
Unit: million tonnes coal equivalent (The unit of electricity is 104 million tonnes kWh); Data resource: International Energy Agency (IEA) [38].
Table 3. Carbon emission factors (Kj).
Energy Type (k)CoalCrude OilOil ProductsNatural GasBiofuelsHeatElectricity
Emission factor (tC/tce)0.75590.58570.56750.44830.64270.670.272
The unit of carbon emission factor of electricity is tC/104 kWh.
Table 4. Carbon emissions released by various sectors.
Emission SectorS1: BuildingS2: IndustryS3: Energy TransformationS4: Transportation
S11S12S21S22S23S24S31S32S33S34S41S42S43S44S45
Carbon Emission (Ci) (million tonnes)5656146216211140131431789055210542530685879123739820166
Table 5. Shared responsibility between four emission sectors.
Emission SectorS1S2S3S4
Carbon Emission (Ci) (million tonnes)71187254 14,653 7728
Shared responsibility (SRi)19%20%40%21%
Table 6. The shared responsibility between sub-sectors.
Emission SectorS11S12S21S22S23S24S31S32S33S34S41S42S43S44S45
Carbon Emission (Ci) (million tonnes)5654146216211140131431779054210344630785865123737818166
Shared responsibility (SRi)79%21%22%16%18%44%62%14%3%21%76%2%9%11%2%
Table 7. Proportion of carbon emission in main countries and regions.
Country2004200520062007200820092010201120122013
China18.6%19.7%21.1%21.8%22.4%24.0%26.2%27.9%28.3%28.6%
United States20.3%19.7%18.7%18.6%17.6%16.6%16.1%15.2%14.4%14.5%
European Union14.3%13.7%13.3%12.8%12.2%11.4%11.1%10.2%9.8%9.5%
India4.1%4.2%4.3%4.5%4.9%5.5%5.1%5.3%5.7%5.7%
Russian Federation5.7%5.5%5.5%5.4%5.4%5.0%5.0%5.1%5.2%5.0%
Japan4.5%4.2%4.0%4.0%3.8%3.5%3.5%3.4%3.5%3.5%
Total67.5%67.0%66.9%67.1%66.3%66.0%67.0%67.1%66.9%66.8%
World100.0%100.0%100.0%100.0%100.0%100.0%100.0%100.0%100.0%100.0%
Table 8. Work plan for promoting low-carbon city.
NoSample CityCountryLow-Carbon Work Planthe Authority for Action
1BeijingChinaEnergy conservation and climate action plan [45]Beijing Municipal Government
2ShanghaiChinaThirteenth five-year plan of economic and social development [46]Shanghai Municipal Government
3Hong KongChinaHong Kong’s climate action plan 2030 [47]Hong Kong Environment Bureau
4ShenzhenChinaMid-long term plans of low-carbon development [48]Shenzhen Development and Reform Commission
5WuhanChinaAction plan of low-carbon city pilot [49]Wuhan Municipal Government
6New YorkUnited StatesClimate action plan interim report [50]New York State Climate Action Council
7San FranciscoUnited StatesClimate action plan for San Francisco [51]San Francisco Department of the Environment, San Francisco Public Utilities Commission
8Los AngelesUnited StatesUnincorporated Los Angeles county community climate action plan 2020 [52]County of Los Angeles, Department of Regional Planning
9ChicagoUnited StatesChicago climate action plan [53]City of Chicago
10PhiladelphiaUnited StatesLocal action plan for climate change [54]City of Philadelphia, Sustainability Working Group
11AustinUnited StatesAustin community climate plan [55]City of Austin, Office of Sustainability
12SeattleUnited StatesSeattle climate action plan [56]Seattle Office of Sustainability & Environment
13PortlandUnited StatesClimate action plan [57]City of Portland
14LondonEnglandA low-carbon London: now and beyond [58]London sustainable development commission
15BerlinGermanyClimate-Neutral Berlin 2050 [59]Senate Department for Urban Development and the Environment
16MilanItalySustainable energy and climate action plan municipality of Milan [60]Municipality of Milan Council of Environment
17AmsterdamNetherlandsAmsterdam: a different energy [61]City of Amsterdam
18RotterdamNetherlandsRotterdam program on sustainability and climate change 2015–2018 [62]City of Rotterdam
19CopenhagenDenmarkCopenhagen climate plan [63]City of Copenhagen, Technical and Environmental Administration
20StockholmSwedenStockholm action plan for climate and energy 2010–2020 [64]Environment and Health Department
21MadridSpainCity of Madrid energy and climate change action plan [65]Energy Agency of Madrid
22DelhiIndiaClimate change agenda for Delhi 2009–2012 [66]Chief Secretary Delhi
23TokyoJapanTokyo climate change strategy: progress report and future vision [67]Tokyo Metropolitan Government
24YokohamaJapanYokohama city action plan for global warming countermeasures [68]Yokohama Climate Change Policy Headquarters
Table 9. Guidelines for promoting low-carbon city.
NoGuidelines for Low-Carbon CityIssuing Authority/Authors
1Convenient Solutions to an Inconvenient Truth: Approaches to Climate Change [69]World Bank
2Low-Carbon City Development Program Guidebook: A Systems Approach to Low-Carbon Development in Cities [70]World Bank
3Low-Carbon City: A Guidebook for City Planners and Practitioners [71]UNEP
4Developing Local Climate Change Plans: a Guide for Cities in Developing Countries [72]UN-Habitat
5Roadmap 2050—A Practical Guide to A Prosperous, Low-carbon Europe [73]European Climate Foundation
6Low-Carbon City Policy Data book: 72 Policy Recommendations for Chinese Cities from the Benchmarking and Energy Savings Tool for Low Carbon Cities [74]Price et al.
7Integrated energy and carbon modeling with a decision support system: Policy scenarios for low-carbon city development in Bangkok [20]Phdungsilp
8Marginal abatement cost and carbon reduction potential outlook of key energy efficiency technologies in China’s building sector to 2030 [17]He et al.
9Mitigation from a cross-sectoral perspective [75]Baker et al.
Table 10. Typical carbon reduction policies in different emission sectors.
S1: BuildingS2: IndustryS3: Energy transformationS4: Transportation
MPS1-MP1: Energy efficiency performance standards in new building
S1-MP2: Energy efficiency performance standards of building appliance
S1-MP3: Auditing reports of building energy-efficiency
S1-MP4: Quota management of energy consumption
S1-MP5: Retrofitting public building with energy-saving facility
S1-MP6: Replacement of energy-saving lamp
S1-MP7: Adoption of water cooling towers instead of air-conditioning systems
S1-MP8: Replacement of obsolete water main
S1-MP9: District heating network
S2-MP1: Energy efficiency standards of various industrial sectors
S2-MP2: Application of advanced industrial equipment
S2-MP3: Energy audits and assessments
S2-MP4: Eliminating high-emission industries
S2-MP5: Standards of emission in industrial processes
S2-MP6: Adoption of advanced process technologies
S2-MP7: Emission capture and destruction
S2-MP8: Mandatory carbon reduction targets for industry
S3-MP1: Efficiency standards for power generators
S3-MP2: Mandatory transformer upgrade program
S3-MP3: District heating networking maintenance and upgrade program
S3-MP4: Program of recuperating waste heat
S3-MP5: Distributed electricity generation
S3-MP6: Phasing down coal for electricity generation
S3-MP7: Wind power generation program
S3-MP8: Solar power generation program
S3-MP9: Nuclear electric power generation
S3-MP10: Tidal power Generation
S3-MP11: Hot springs power generation and hot springs heat pump
S3-MP12: Hydroelectric generation
S3-MP13: Solar heating program
S3-MP14: Hydrogen fuel cells
S3-MP15: Bioenergy displace heating fuels
S4-MP1: Transit-oriented transportation planning
S4-MP2: Mixed land uses to minimizes daily transfer distance
S4-MP3: Enhancing the quality of public transport services
S4-MP4: Bus rapid transit network
S4-MP5: Improving complementarity of public transport
S4-MP6: Rationalization of bus routes
S4-MP7: Improving the operation efficiency of tramways
S4-MP8: Developing intercity rail to foster more efficient freight movement
S4-MP9: Extension of rail-lines
S4-MP10: Standards of vehicle fuel using efficiency
S4-MP11: Standards of vehicle carbon emission
S4-MP12: Restriction on private car
S4-MP13: Improving walk and bicycle path environment
S4-MP14: Electronic toll collection system
EPS1-EP1: Energy efficiency market for existing building
S1-EP2: Green building labeling program and information disclosure
S1-EP3: Financial support for energy service companies
S1-EP4: Subsidies and tax credits for weatherization
S1-EP5: Subsidies for purchasing energy-efficient equipment
S1-EP6: Energy efficiency labelling for the major electrical appliances
S1-EP7: Trade-in of energy-saving appliance
S1-EP8: Appliance of smart consumption meters in residential buildings
S1-EP9: Time-zone mechanism for electricity price
S2-EP1: Tax relief on carbon reduction projects
S2-EP2: Provision of loans and funds for improving industrial energy efficiency and adopting innovative technologies
S2-EP3: Carbon cap-and-trade program
S2-EP4: Supporting energy management service companies
S2-EP5: Carbon labelling scheme for industrial products
S2-EP6: Subsidizing energy-efficient equipment
S3-EP1: Subsidies and tax incentives for renewable energy
S3-EP2: Certification system for photovoltaic power generation equipment installers
S4-EP1: Financial incentives for the purchase of low-carbon vehicles.
S4-EP2: Parking fees
S4-EP3: Increase of fuel tax
S4-EP4: Congestion charges
VPS1-VP1: Energy conservation training for building maintenance staff
S1-VP2: Public education on improving building energy efficiency
S1-VP3: Expedited permitting for green buildings
S1-VP4: Encouraging large building participate in climate initiative program
S1-VP5: Demonstrative projects of ultra-low energy consumption building
S1-VP6: Encourage solar installation
S1-VP7: Encourage retrofit buildings with solar photovoltaics
S2-VP1: Encouraging larger companies to optimize manufacturing techniques
S2-VP2: Encouraging companies to upgrade industrial equipment
S2-VP3: Energy-saving technology services to industrial companies
S2-VP4: Workforce training of energy saving in industrial sector
S2-VP5: Demonstrative projects of low-carbon industry parks
S3-VP1: Encouraging larger companies to optimize operation management of power plantS4-VP1: Publicity about saving energy on trip
S4-VP2: Energy saving guidance for transportation companies
S4-VP3: Publicity about clean-fuels vehicles
S4-VP4: Promoting car-sharing programs
S4-VP5: Encouragement of telecommuting work
MP: Mandatory Administration Policy; EP: Economic Incentive Policy; VP: Voluntary Scheme Policy.
Table 11. Number of cities in applying emission reduction policies.
PolicyNijPolicyNijPolicyNijPolicyNij
S1-MP123S2-MP12S3-MP14S4-MP113
S1-MP24S2-MP21S3-MP22S4-MP26
S1-MP37S2-MP32S3-MP32S4-MP311
S1-MP42S2-MP45S3-MP46S4-MP46
S1-MP52S2-MP51S3-MP54S4-MP59
S1-MP612S2-MP62S3-MP66S4-MP62
S1-MP71S2-MP72S3-MP716S4-MP72
S1-MP82S2-MP81S3-MP819S4-MP84
S1-MP94S2-EP11S3-MP92S4-MP96
S1-EP11S2-EP22S3-MP104S4-MP1015
S1-EP22S2-EP34S3-MP112S4-MP114
S1-EP32S2-EP44S3-MP122S4-MP127
S1-EP411S2-EP52S3-MP135S4-MP1318
S1-EP55S2-EP66S3-MP142S4-MP147
S1-EP66S2-VP15S3-MP1511S4-EP19
S1-EP74S2-VP24S3-EP14S4-EP26
S1-EP84S2-VP33S3-EP22S4-EP32
S1-EP94S2-VP44S3-VP12S4-EP46
S1-VP12S2-VP52 S4-VP16
S1-VP218 S4-VP24
S1-VP31 S4-VP315
S1-VP42 S4-VP413
S1-VP51 S4-VP56
S1-VP615
S1-VP77
Table 12. Contributed efforts in four emission sectors.
SectorS1: BuildingS2: IndustryS3: Energy TransformationS4: Transportation
CEi295104275420
CEi27%10%25%38%
Table 13. The number of three kinds of policies adopted in four emission sectors.
SectorMPEPVPTotal
S1: Building573946142
S2: Industry16191853
S3: Energy Transformation876295

