Article

Effects of Highway-Related Pollutant on the Groundwater Quality of Turfy Swamps in the Changbai Mountain Area

Construction Engineering College, Jilin University, Xi Min Zhu Street, Changchun 130026, Jilin, China
*
Author to whom correspondence should be addressed.
Int. J. Environ. Res. Public Health 2018, 15(8), 1652; https://0-doi-org.brum.beds.ac.uk/10.3390/ijerph15081652
Submission received: 10 July 2018 / Revised: 27 July 2018 / Accepted: 2 August 2018 / Published: 3 August 2018

Abstract

:
Transportation activities such as fuel consumption, vehicle wear and road deicing can detrimentally affect the groundwater quality of fragile roadside wetland environments including. Nineteen parameters (Cu, Pb, Zn, Cd, Cr, Ni, Hg, As, pH, TDS, Ca2+, Mg2+, Na+, K+, SO42−, Cl, HCO3, NO3 and F) were determined in groundwater samples from turfy swamps impacted by highway traffic from Jiangyuan (JY), Longquan (LQ), and Huangsongdian (HSD). Our results indicate that the metals Cu, Pb, Zn, Cr, Cd, the ions Na+, K+ and Cl in groundwater were negatively affected by highway transportation, and the maximum affected distance of these pollutants varied from 15 to 100 m. The content of most of these pollutants in roadside groundwater decreased exponentially with the distance from the highway, as did the heavy metal pollution index HPI and Cd. The values of HPI and Cd in these three sites ranged from 46.8 to 78.4 and −4.9 to −2.9, respectively. The low pollution levels of heavy metals are related to the strong adsorption capacity of turfy soil towards metals. In any case, road transport activities increased the Cu, Pb, Zn, Cr, Cd, Na+, K+ and Cl content in roadside groundwater in turfy swamp. With the increase of highway operation time, it will inevitably have a great influence on the groundwater quality of these wetlands. Therefore, the long-term monitoring is necessary to protect the sustainable development of turfy swamp.

1. Introduction

Environmental pollutants from traffic infrastructure are an important subject in ecological and environmental sciences, due to their toxic effects on the biosphere [1,2,3]. It is generally accepted that highway transportation activities such as the combustion of liquid fuels, vehicular component abrasion and the weathering of pavement materials can release fine particles containing Zn, Pb, Cd, Cu and Cr [4,5,6,7]. These particles containing heavy metals are deposited into soil, water and plant near the highway through dry and wet deposition [8]. In addition, some studies have reported that road-salting activities can increase the contents of Na+, K+, Cl and NO3 in roadside groundwater and even cause severe Cl contamination [9,10,11,12]. These highway-related pollutants are persistent and non-degradable, and therefore can remain in the roadside environment for long periods of time. When their accumulations exceed a certain level, they will pose a threat to the microbiota, flora and fauna in turfy swamps [13].
Since the 1970s, concern about highway-related pollutants has spread beyond academia [14,15,16]. Studies of highway-related pollutants have focused on the identification of type of pollutants and their distribution influenced by distance from the roadway [17,18,19]. Zhang et al. [8] discovered that soil concentrations of Zn, Cd, Cu, As and Pb were the most affected by highway transport in the Tibetan plateau. Earon et al. [12] demonstrated that the metals Fe, Al, Zn, Mn, Pb, Ni, Cr, Cd and the ions Ca2+, SO42−, K+, Na+, Mg2+, NO3, and Cl in groundwater are significantly related to road transportation, decreasing exponentially as the distance from the roadside increases. In addition, many monitoring studies have demonstrated Pb, Cu, Cr, Cd and Zn pollution are severe in diverse roadside environments, including Beijing [4], Hong Kong [20], Mexico [21], and Yorkshire, England [22]. However, all these studies were mainly concentrated on roadside soil, with relatively little attention being paid to the effects of traffic pollution on groundwater. As far as we know, environmental pollutant levels in turfy swamp groundwater coming from highways have not been reported.
Wetland ecosystems have strong hydrological dependence, with the healthy water quality and hydrochemical characteristics being a determining factor in their sustainable development [23]. Turfy swamp is a unique natural ecosystem formed by interaction between water and land system [24]. Therefore, groundwater is extremely essential for survival of all living organisms in turfy swamps, which is sensitive to outside influences. Even small-scale human activities can result in significant environmental changes [25,26,27]. In the Changbai Mountain area, most of the turfy swamps are well preserved. However, increasing highway construction activities have caused many environmental problems in turfy swamps in recent decades. For example, Wang et al. [28] reported that metals Zn, Cr, Cu and Cd have reached moderate pollution in roadside soil in turfy swamp areas. However, the effect of highway on the heavy metal and hydrochemical characteristic of groundwater in turfy swamp is not clear. To formulate effective measures for turfy swamp protection, investigating the source and pollution states of highway-related pollutants in groundwater of turfy swamps is crucial.
This paper quantifies the impact of highway transport on groundwater in turfy swamps in the Changbai Mountain area from the two aspects of heavy metal and hydrochemical characteristics. Based on findings from a large-scale field investigation, we identify the types of highway-related pollutants in turfy swamp groundwater, and explore the relationships between highway-related pollutants concentrations and roadside distance, and lastly assess the heavy metal contamination levels of turfy swamp groundwater.

2. Materials and Methods

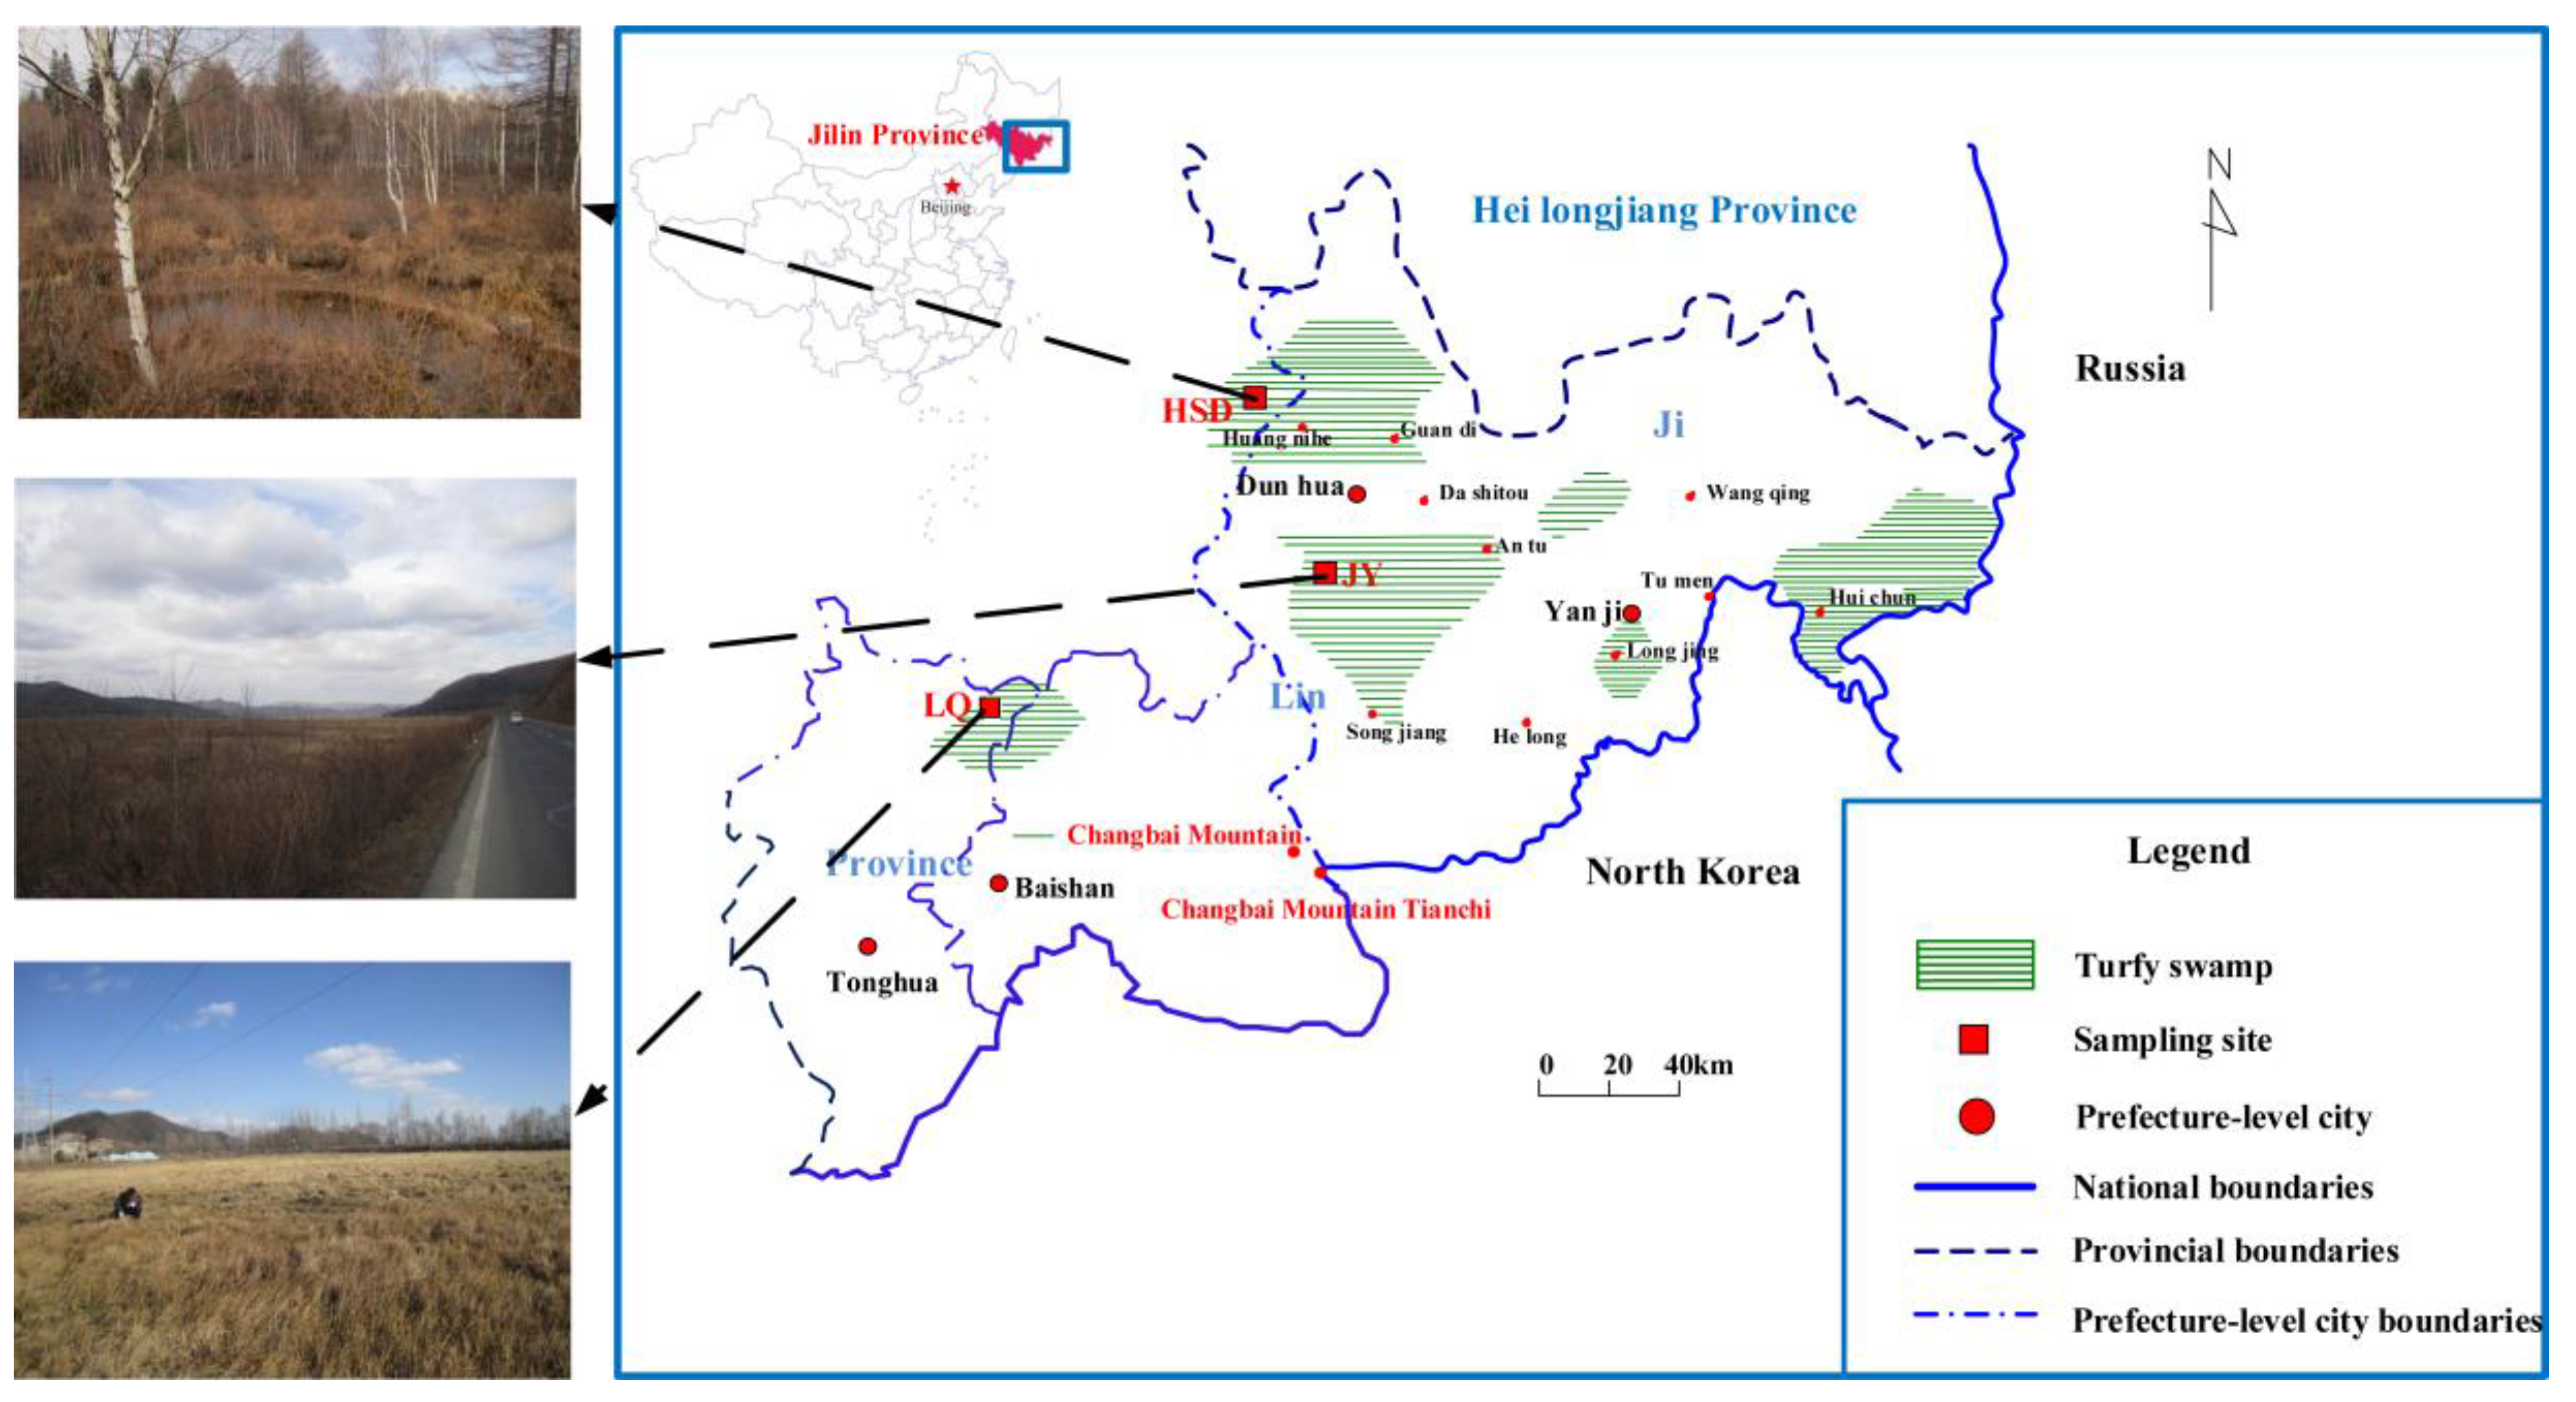
2.1. Site Description

This study was performed in the Changbai Mountain area, where a large variety of turfy swamps can be found. This region is the main headstream of the Mudan River and an important water conservation area in Jilin Province. Three sampling sites without any other confounding anthropogenic pollution sources were selected for collection of groundwater samples: Jiangyuan (JY, N43°7′, E128°1′), Longquan (LQ, N42°25′, E126°36′), and Huangsongdian (HSD, N43°39′, E127°39′) (Figure 1). At the JY site, the climate is cool and humid, with moderate illumination and abundant rainfall; the average annual temperature and precipitation are 2.6 °C and 632 mm. G201 highway with daily traffic volume greater than 2000 invades the edge of the turfy swamps. The climate characteristics at the LQ site are similar to JY site, with average annual temperature 3.7 °C and precipitation 947 mm; the S302 highway with daily traffic volume greater than 1500 invades the middle of the turfy swamp. For HSD, the average annual temperature and precipitation are 3.4 °C and 709 mm; G12 highway passes through the edge of the turfy swamp, with daily traffic volume greater than 1100. Regarding specific information about these three sites, readers may refer to Wang et al. [28].

2.2. Sampling and Experimental Methods

Groundwater samples were collected in July–August 2017 at distances of 5, 15, 50, and 200 m, from the highway, respectively at the three sites. Before sampling, three PVC tubes with a diameter of 160 mm were embedded in the soil at each distance, separated by 100 m, exposing 50 cm above ground and embedding 60 cm underground. Many holes with a diameter of 4 mm were drilled in the PVC tube wall to allow the groundwater to naturally infiltrate into the tube. In order to prevent sediment, branches and rainwater from entering the tubes PVC, the PVC outer wall was covered with gauze, and the tube end was covered with a plastic cloth fixed with a nylon rope. After groundwater samples were collected using the erect water collectors, the samples were filtered using a 0.45 μm filter membrane, and then transported to the laboratory at 2–5 °C in a cooler. Nineteen physical and chemical parameters, including Cu, Pb, Zn, Cd, Cr, Ni, Hg, As, pH, TDS, Ca2+, Mg2+, Na+, K+, SO42−, Cl, HCO3, NO3 and F, were analyzed. The pH and total dissolved solids (TDS) were determined in the field using a portable measuring instrument (HI98195, HANNA, Padua, Italy). All samples were collected and stored according to the standard for detection of groundwater quality (DZ/T 0064.2-1993); the specific preservation and test methods are shown in Table 1. All samples were tested within 15 days after sampling at the Jilin University Testing Center.

2.3. Data Analysis Methods

A regression model was used to describe the relationship between the content of highway-related pollutants and the distance from the roadside using Origin 9.0 software (Origin Lab, Northampton, MA, USA). The high R2 values indicate that this model can well quantify the distribution characteristics of highway-related pollutants contents in groundwater.
To evaluate the pollution level of groundwater in turfy swamp, the heavy metal pollution index HPI and Cd were calculated by the following formulas [29]:
H P I = i = 1 n W i Q i i = 1 n W i
Q i = i = 1 n ( M i ( ) I i ) ( S i I i ) × 100
where Qi and Wi are the subindex and unit weight of the i-th element. n is the number of elements considered. Mi is the measured value of the ith metal, Ii and Si are ideal and standard values of the ith parameter, respectively. The sign (−) indicates the numerical difference of the two values, ignoring the algebraic sign. To calculate Wi the groundwater class III standards (GB/T 14848-2017) were used for Cu, Pb, Zn, Cd, Cr, Ni, Hg and As.
The Cd index indicates the relative contamination of different metals separately and manifests the combined effects of all metals, is calculated as follows:
C d = i = 1 n C f i
C f i = C A i C N i 1
where CAi and CNi are the measured value and upper allowable value of ith metal (N refers to the normative value). CNi is considered as the standard permissible value (Si) formerly introduced in HPI calculation.
The experimental data were subjected to statistical analysis using SPSS 21.0 software (SPSS Inc., Chicago, IL, USA), including the description analysis, K-S test, ANOVA, cluster analysis, factor analysis and Pearson correlation analysis. The ANOVA and LSD test were used to identify the significant differences of the measured parameters among different sites. The correlation analysis was used to explore the relationship between the measured parameters and distance from highway. The cluster analysis and factor analysis was performed to identify the interrelationship among these parameters in groundwater of turfy swamp. Euclidean distance and Ward’s method were used in cluster analysis, and the primary data were standardized using Z score.

3. Results and Discussion

3.1. Concentration of Metals and Hydrochemical Parameters in Groundwater

The basic statistical descriptions of heavy metals contents for different turfy swamp sites in roadside groundwater are summarized in Table 2. The maximum concentrations of all heavy metals in this area are lower than the drinking water quality of China (GB/T 14848-2017). The low contents of metals may be related to turfy soil with high organic matter content. The concentrations of Cu, Pb, Zn, Cr, Cd and Hg (58.3 μg L−1, 26.3 μg L−1, 114.2 μg L−1, 1.8 μg L−1, 5.4 μg L−1) at LQ turfy swamp are the highest among the three sites, while the Ni and As contents (8.9 μg L−1, 8.7 μg L−1) in JY are the highest. The ANOVA results indicated that the contents of most metals at the JY and LQ sites were significantly higher than those at the HSD one (p < 0.05). This finding is in accordance with the traffic volume in these three sites. The daily traffic volume at HSD is lower than that at JY and LQ site as previously reported by Wang et al. [28].
As shown in Table 3, the hydrochemical analysis results indicated that the mean concentrations of TDS (218.9 mg L−1), Ca2+ (29.3 mg L−1), Mg2+(5.8 mg L−1), Na+ (2.9 mg L−1), K+ (1.2 mg L−1), SO42− (11.6 mg L−1), Cl (5.5 mg L−1), HCO3 (179.8 mg L−1), NO3 (0.44 mg L−1), F (0.16 mg L−1) of the entire region were lower than the drinking water quality standards. The ACV% of these measured parameters followed the sequence K+ > Cr > Na+ > Cl > Pb > Cu > Zn > Cd > Mg2+ > pH > As > Ni > NO3 > F > Hg > SO42− > Ca2+ > TDS > HCO3 and the CV% of Cu, Pb, Zn, Cr, Cd, Na+, K+, Cl are significantly higher than those of the remaining parameters in the three sites. This result indicated that the concentrations of Cu, Pb, Zn, Cr, Cd, Na+, K+ and Cl varied greatly in different distances from the highway in turfy swamps, which leads us to speculate that concentrations of Cu, Pb, Zn, Cr, Cd, Na+, K+ and Cl in groundwater were most likely related to human activities along the highway in the turfy swamp areas.

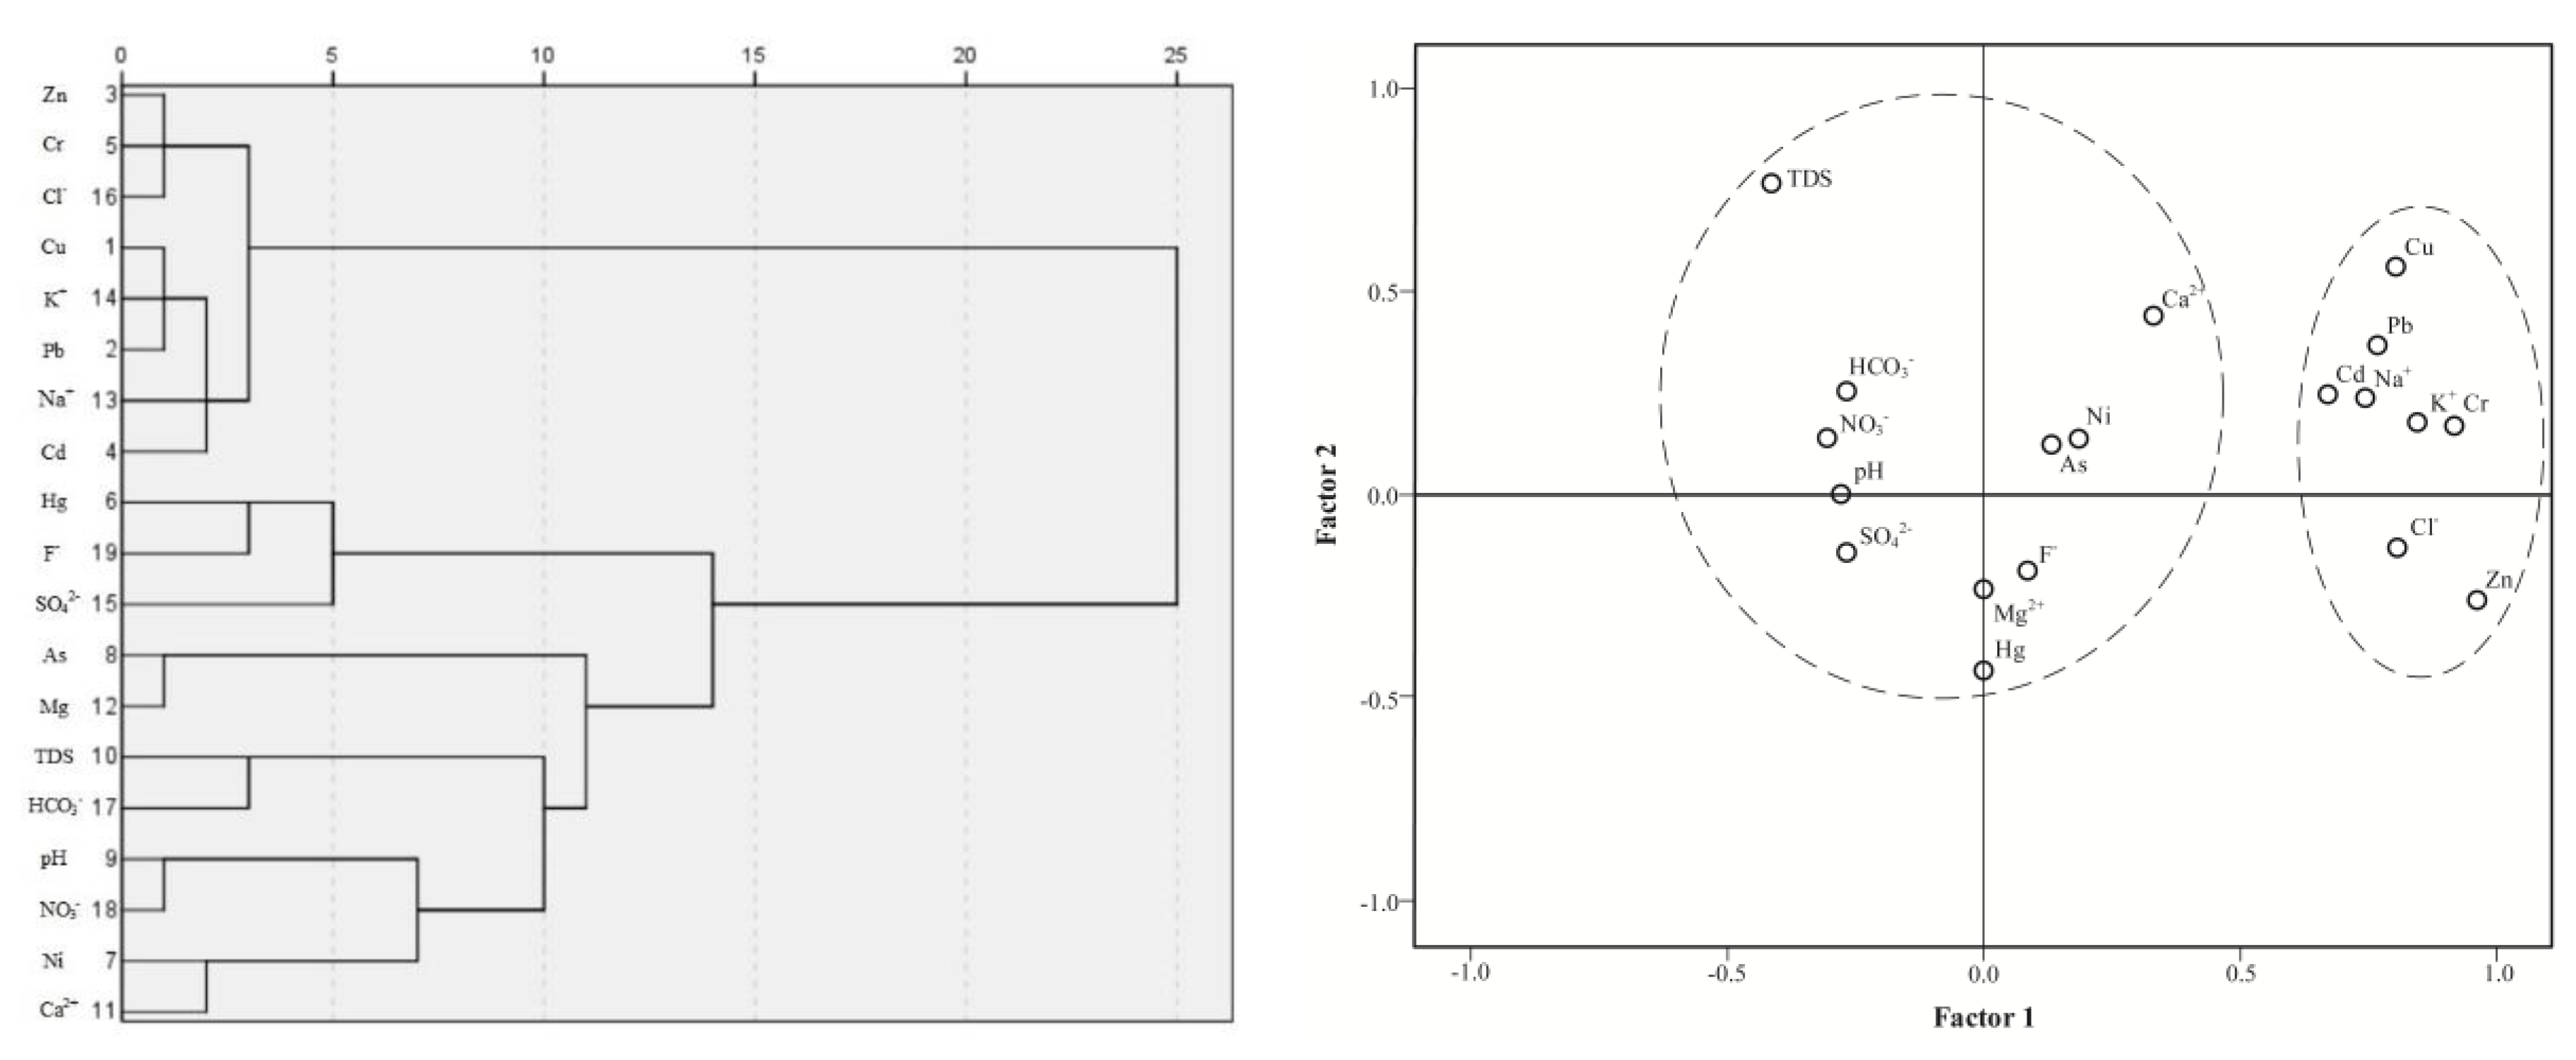
3.2. Interrelationships among Measured Parameters in Groundwater in Turfy Swamp

Cluster analysis and factor analysis were performed on the 19 parameters determined in roadside groundwater to identify a shared source of these parameters in turfy swamps (Figure 2). As previously reported by Lee et al. [30] and Khan et al. [31], elements in the same group are expected to be from a common anthropogenic or natural source and a lower cluster distance indicates a more significant association. Two different cluster groups were presented at the three sites, Cu, Pb, Zn, Cr, Cd, Na+, K+ and Cl with a distance between 5 and 10 indicated that these parameters are from the same source. The remaining parameters are clustered at a high distance criterion between 10 and 15, possibly due to environmental heterogeneity of turfy swamp.
The results of factor analysis indicated that Cu, Pb, Zn, Cr, Cd, Na+, K+ and Cl in groundwater are significantly related to each other. A total of two factors with an eigenvalue >1 were extracted, accounting for 89.00% of the total variance (Figure 2). Factor 1, accounting for 72.91% of the variance, positively related to Cu, Pb, Zn, Cr, Cd, Na+, K+ and Cl. The remaining parameters (pH, TDS, Ni, Hg, As, Mg2+, Ca2+, SO42−, HCO3, NO3 and F) were positively related to factor 2 (16.08%). As a whole, the result of classification based on cluster analysis is consistent with the results from factor analysis.
Many studies have demonstrated that Cu, Pb, Zn, Cr, Cd, Na+, K+ and Cl are indicators of roadside contaminated environment [32,33,34,35]. Although the cluster analysis and factor analysis were inadequate to conclude whether the pollutants originated from highway transport activities, the Cu, Pb, Zn, Cr, Cd, Na+, K+ and Cl appear to have derived from a similar source, which may be related to traffic. Some studies have shown that highway-related pollutants derived from traffic had a significant negative correlation with distance to the highway [5,6,7], As shown in Table 4, there were significant negative correlations between Cu, Pb, Zn, Cr, Cd, Na+, K+, Cl and the distance to the highway through the whole analysis. However, individual indicators did not show significant negative correlations in the different research sites, possibly partly due to the limited number of sampling points. Collectively, the results suggest that Cu, Pb, Zn, Cr, Cd, Na+, K+, Cl in the groundwater were related to traffic activities.

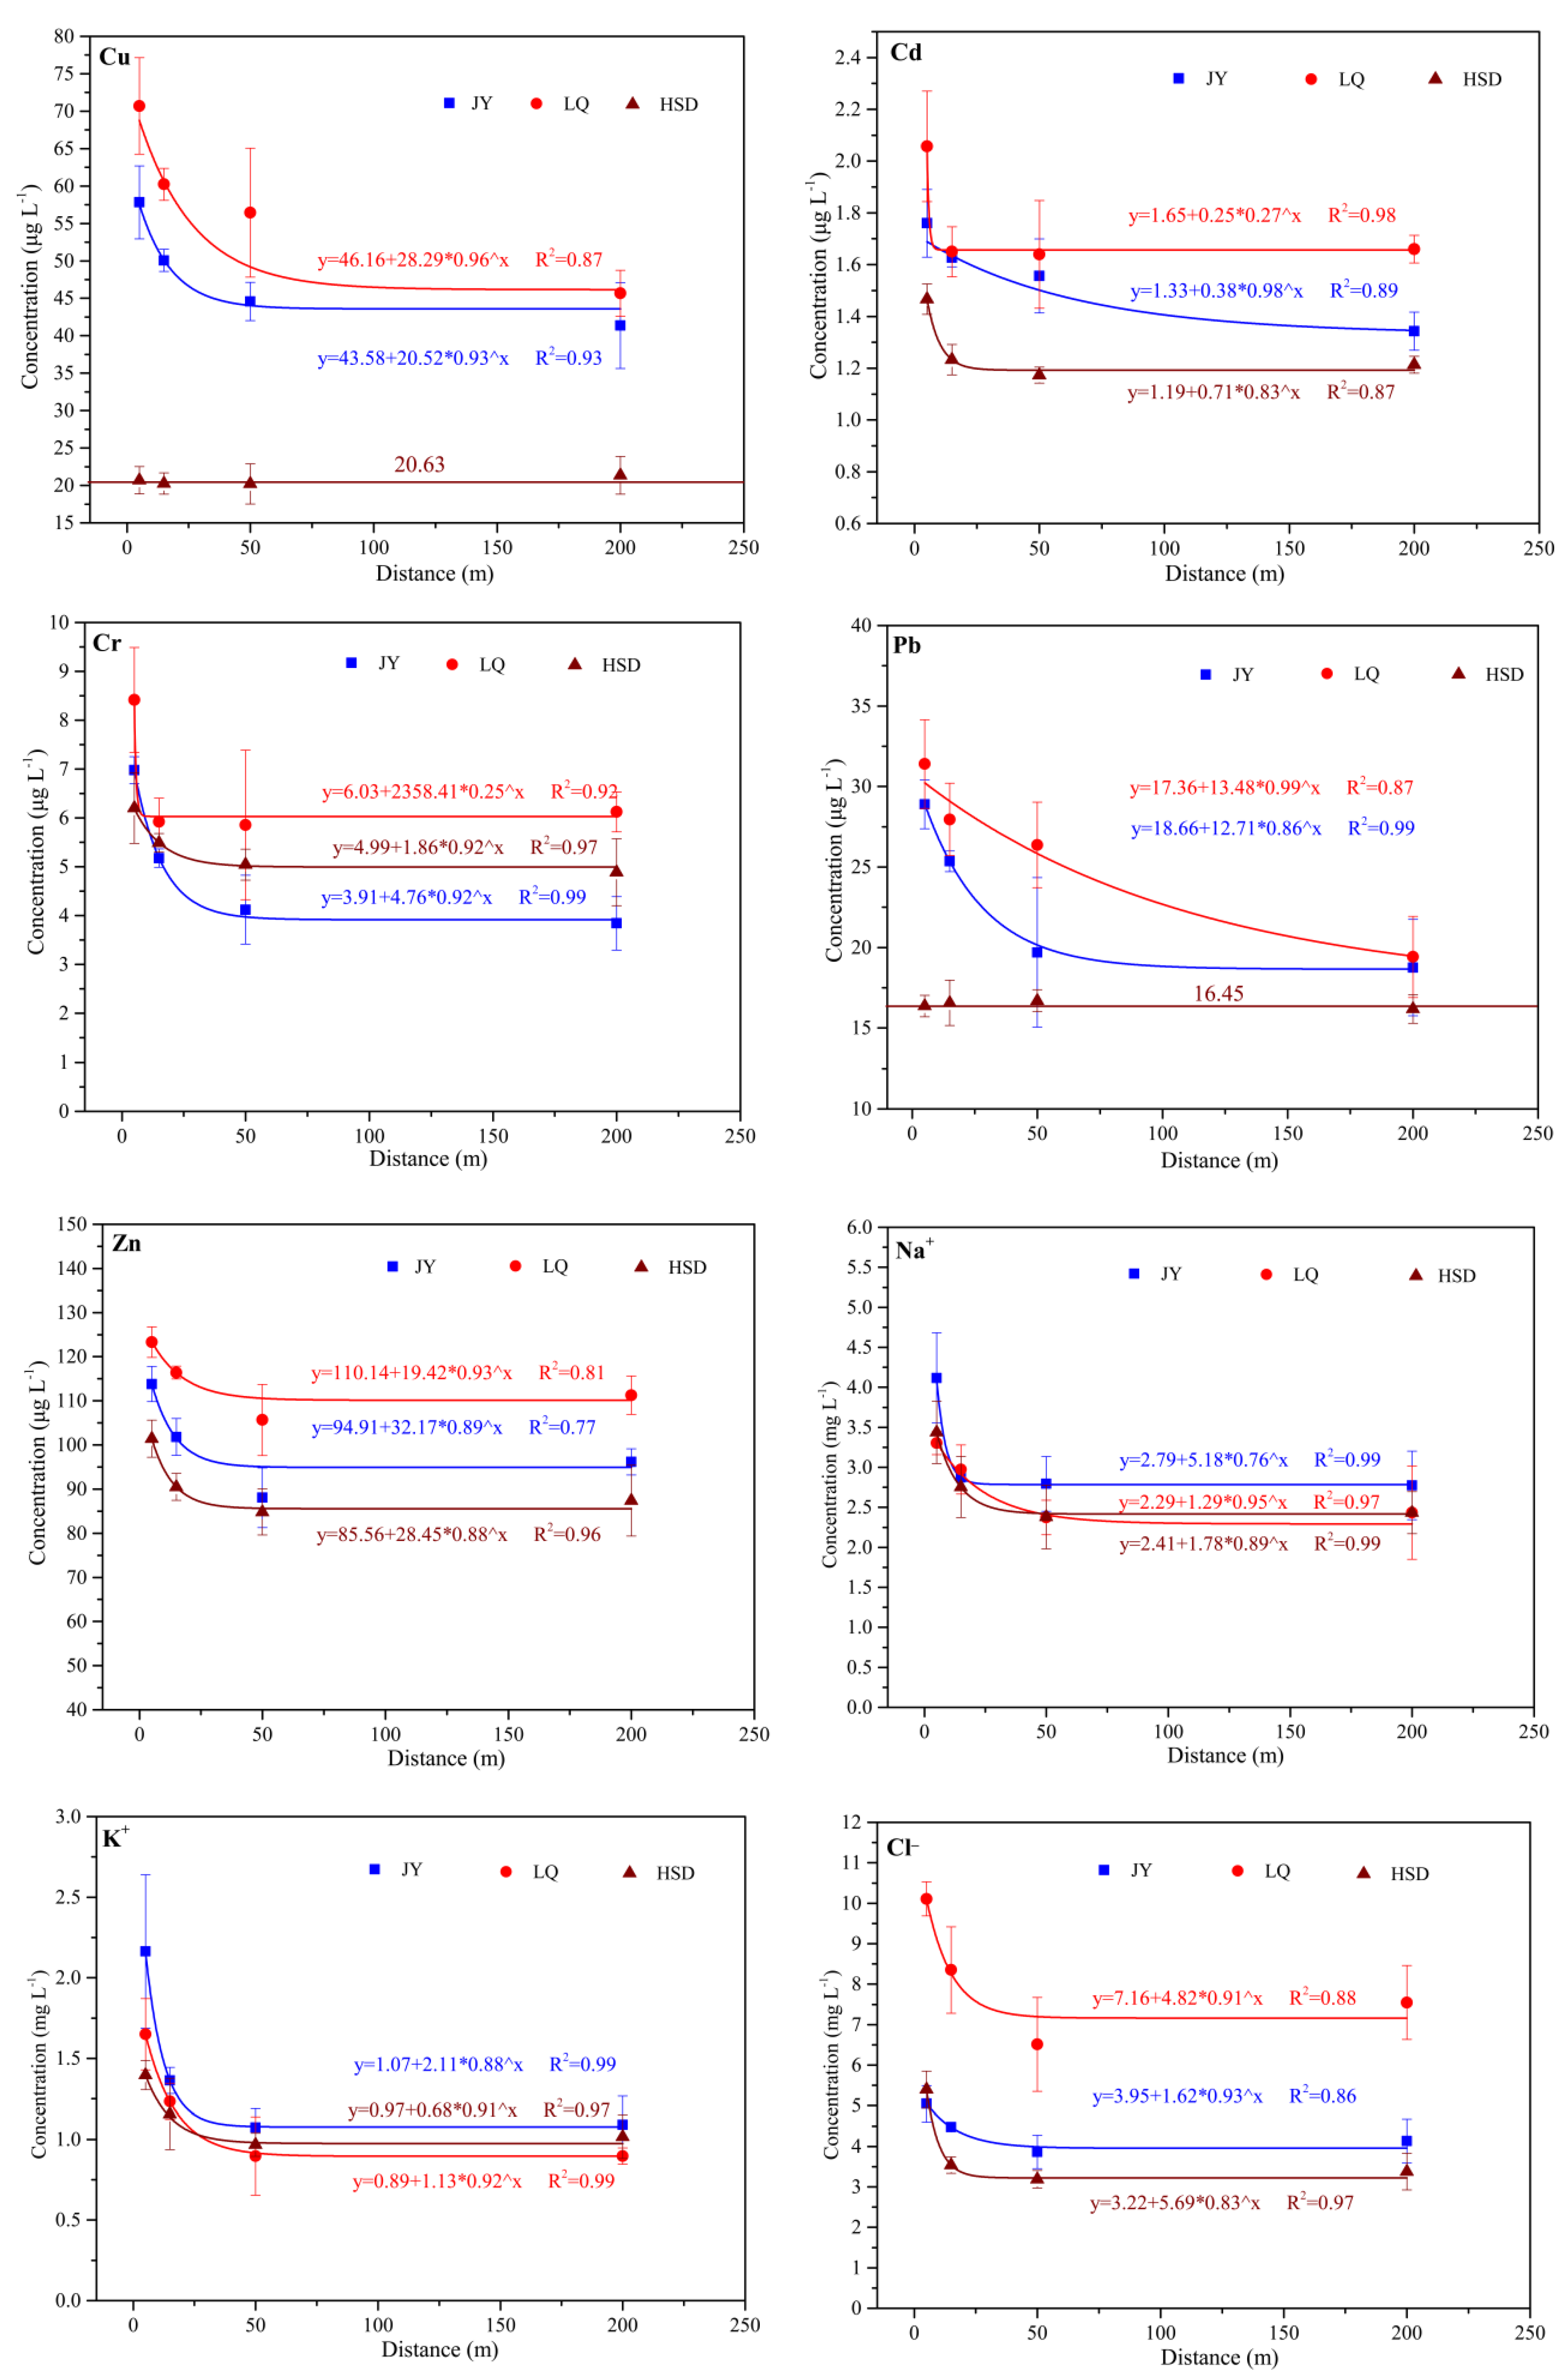
3.3. The Nonlinear Regression Model of Highway-Related Pollutants

The nonlinear regression model (y = a0 + a1 × a2x) was proposed by Wang et al. [36] to describe the distribution characteristics of traffic-related metals contents in turfy swamp soil and plant. As shown in Figure 3, there were two different distribution patterns of the highway-related pollutants in groundwater. The contents of most parameters showed an exponential decline with increasing distance from the road edge in these three sites, whereas the contents of Cu and Pb in HSD site fluctuated with increasing distance from the highway edge. The high R square values showed that this model was also suitable for characterizing the relationship between highway-related pollutants and roadside distance in groundwater.
The maximum affected distance of highway-related pollutants diffusion is an important parameter for formulating corresponding wetland protection measures. As shown in Figure 3, the contents of Cu, Zn, Cr become the background content at 15 to 50 m distance from the road edge in these three sites. However, the range of maximum affected distance for Pb and Cd varied from 15 to 100 m.
The affected distances of Cu, Zn, Cr, Pb and Cd in groundwater are consistent with those in turfy soil as previously reported by Wang et al. [36]. For Na+, K+, and Cl, no other study has reported their contents showed an exponential decrease with increasing distance, and reached background contents at 15 to 50 m distance from road edge. Only Earon et al. [12] reported that Na+, K+ and Cl concentrations gradually decreased in groundwater with increasing distance from the road edge, but they did not give a specific distribution function.
As shown in Table 5, the background contents of Cu, Pb, Zn, Cr, Cd, Na+, K+, Cl at different turfy swamp sites varied, which may be related to the environmental heterogeneity of turfy swamps. In this study, the concentrations of pollutants at all test points were lower than the class III of China Environmental Guidelines, but the concentration of these pollutants in roadside groundwater are obviously higher than the background concentration, which means that the maximum sorption capacity of pollutants is reached and the some pollutants are precipitated from the turfy soil [37,38]. However, this proposal should be interpreted with caution and will require verification during future follow-up studies.

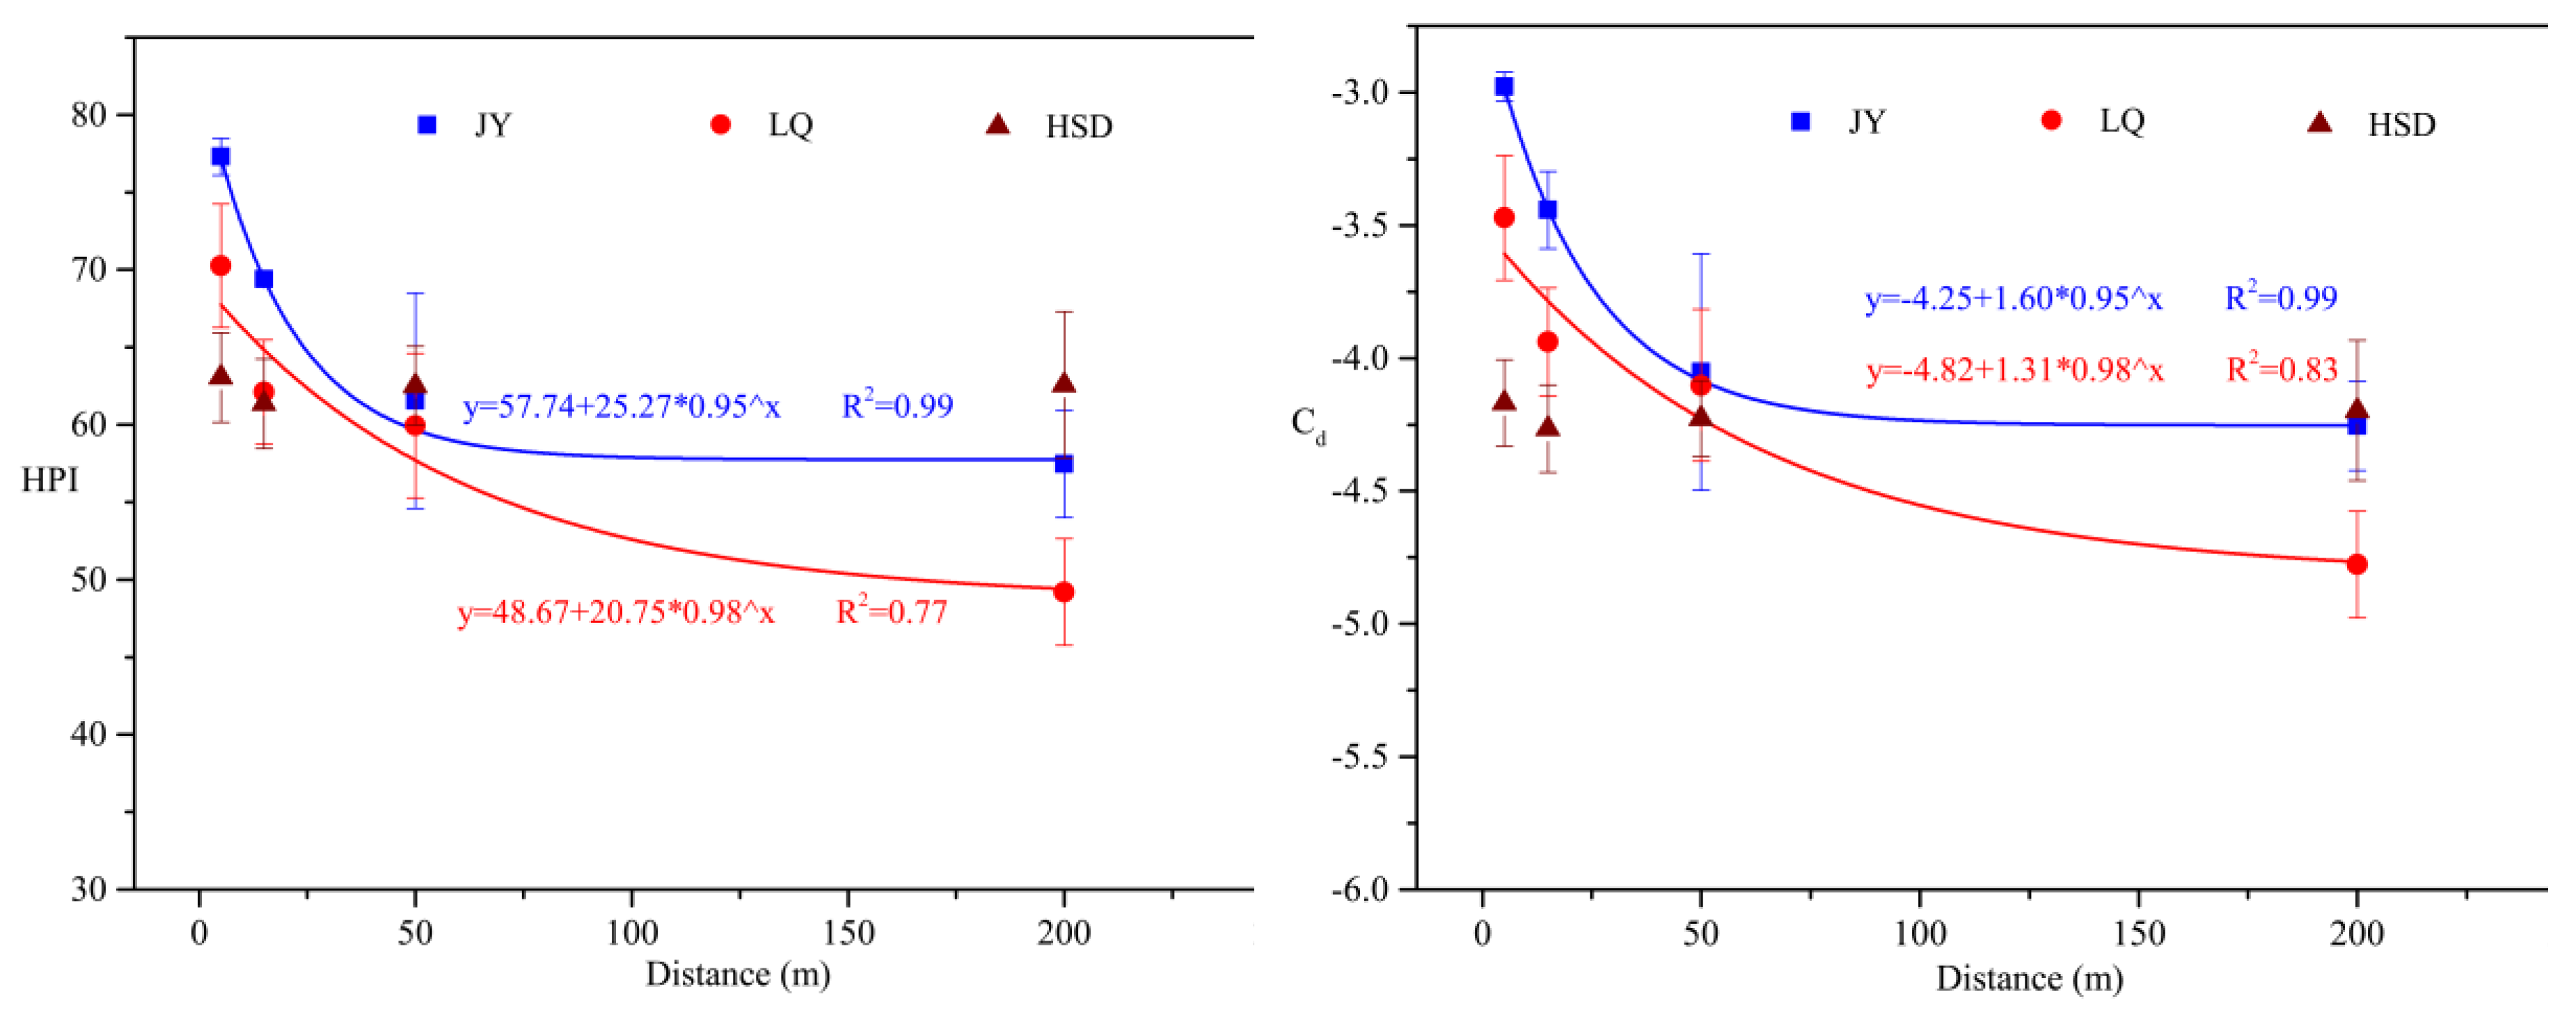
3.4. Identification of Metals Pollution Degree in Groundwater

HPI and Cd are effective tools to evaluate the groundwater pollution because they combines several parameters to obtain a particular value which can be compared with the critical value. In this study, the HPI was calculated in different distances from highway using the class III of the China Environmental Guidelines (GB/T 14848-2017), based on Cu, Pb, Zn, Cd, Cr, Ni, Hg and As. The HPI results are shown in Figure 4. The range and mean values of HPI for the groundwater samples in the three sites were 54.1–78.3 and 66.4 (JY), 46.8–72.9 and 60.4 (LQ), and 57.2–66.2 and 62.4 (HSD), respectively. The results showed that the HPIs for all the samples were below the critical limit of 100 proposed for drinking water by Prasad and Bose [39].
The contamination index (Cd) was used as a reference of estimating the degree of metal pollution [40]. The range and mean values of Cd of the groundwater samples were respectively −4.5–−2.9 and −3.7 (JY), −4.9–−3.3 and −4.1 (LQ), and −4.8–−4.4 and −4.7 (HSD). Cd may be grouped into three classes [41] as follows: high (Cd > 3), medium (Cd = 1–3) and low (Cd < 1). In this study, all analyzed samples do not exceed 0, suggesting that they are below the water quality standards, which is consistent with the results of HPI analysis. As reported previously by Wang et al. [28], the degree of metals in turfy soil reached heavily polluted level. In this study, highway-related metals in groundwater are almost no pollution, which may be explained by the strong sorption capacity of turf soil to heavy metals. Many studies have shown that turfy soil has strong potential for heavy metal remediation, and it can effectively reduce heavy metal content in contaminated soil [42,43,44].
In addition, it is worth noting that the values of HPI and Cd decline exponentially with the increase of distance from the highway at these three sites (Figure 4). There are significant negative correlations between the pollution indexes (HPI and Cd) and distance to highway in the JY and LQ site (Table 6). This result can be explained by the lower traffic volume of HSD compared to JY and LQ. In order to investigate the key metals contributing to the computed indices, correlation analysis was performed between the indices (HPI and Cd) and heavy metal concentrations. In JY and LQ, Cu, Pb Zn, Cd and Cr show significant correlations with all the indices, suggesting that these metals are the major contributory parameters (Table 6). For the HSD site, Zn, Cd and Cr are the main contributors to HPI and Cd. Collectively, these results are consistent with the distribution pattern, suggesting that the pollution level is related to traffic activities.
Although the pollution degree of heavy metals in groundwater of turfy swamp is very low, the concentrations of Cu, Pb, Zn, Cr, Cd, Na+, K+ and Cl in groundwater near the highway edge are obviously higher than the background concentration values. The correlation analysis between the two pollution index (HPI and Cd) and metals also showed that Cu, Pb, Zn, Cr and Cd are the main contributors to the heavy metal pollution in the groundwater, so it cannot be ignored that operation of highways proximal to turfy swamps may produce heavy metal accumulation in groundwater.

4. Conclusions

Nineteen physical and chemical parameters (Cu, Pb, Zn, Cd, Cr, Ni, Hg, As, pH, TDS, Ca2+, Mg2+, Na+, K+, SO42−, Cl, HCO3, NO3 and F) were tested in groundwater to evaluate the impact of highway transportation on groundwater environments of proximal turfy swamps. Cu, Pb, Zn, Cr, Cd, Na+, K+ and Cl were identified as highway-related pollutants. However, neither the concentrations of pollutants, nor the HPI and Cd indexes, exceeded the water quality standard. The concentration of pollutants were greatest at the edge of the highway followed by an exponential decay away from the highway with the affected distances between 15 to 100 m dependent on location and pollutant. Given the sensitivity and vulnerability of turfy swamps, long-term monitoring of pollution in roadside groundwater is important to establish recommendations for minimal distances of roadways from wetlands.

Author Contributions

Data curation, H.W.; Funding acquisition, L.N.; Investigation, H.W.; Methodology, H.W.; Project administration, L.N.; Validation, Y.X., C.D., T.Z. & Y.W.; Writing—review & editing, Y.X.

Funding

This study was financial supported by National Natural Science Foundation of People’s Republic of China (Grant No. 41502272, Grant No. 41572254 and Grant No. 41702300).

Acknowledgments

The authors wish to express their gratitude to Yunchao Zheng, Chao Du, Yuzheng Wang, and Yaolong Huang for their assistance in field sampling and laboratory work. In addition, the authors thank the College of Environment and Resources, Jilin University, for test of physical and chemical indexes of groundwater.

Conflicts of Interest

The authors declare no conflict of interest.

References

  1. Duong, T.T.T.; Lee, B.K. Determining contamination level of heavy metals in road dust from busy traffic areas with different characteristics. J. Environ. Manag. 2011, 92, 554–562. [Google Scholar] [CrossRef] [PubMed]
  2. Sezgin, N.; Ozcan, H.K.; Demir, G.; Nemlioglu, S.; Bayat, C. Determination of heavy metal concentrations in street dusts in Istanbul E-5 highway. Environ. Int. 2004, 29, 979–985. [Google Scholar] [CrossRef]
  3. Zhang, H.; Zhang, Y.; Wang, Z.; Ding, M.; Jiang, Y.; Xie, Z. Traffic-related metal(loid) status and uptake by dominant plants growing naturally in roadside soils in the Tibetan plateau, China. Sci. Total Environ. 2016, 573, 915–923. [Google Scholar] [CrossRef] [PubMed]
  4. Chen, X.; Xia, X.; Zhao, Y.; Zhang, P. Heavy metal concentrations in roadside soils and correlation with urban traffic in Beijing, China. J. Hazard. Mater. 2010, 181, 640–646. [Google Scholar] [CrossRef] [PubMed]
  5. Adachi, K.; Tainosho, Y. Characterization of heavy metal particles embedded in tire dust. Environ. Int. 2004, 30, 1009–1017. [Google Scholar] [CrossRef] [PubMed]
  6. Hjortenkrans, D.; Bergbäck, B.G.; Häggerud, A. Metal emissions from brake linings and tires: Case studies of Stockholm, Sweden 1995/1998 and 2005. Environ. Sci. Technol. 2007, 41, 5224–5230. [Google Scholar] [CrossRef] [PubMed]
  7. Zaharescu, D.G.; Hooda, P.S.; Soler, A.P.; Fernandez, J.; Burghelea, C.I. Trace metals and their source in the catchment of the high altitude Lake Respomuso, Central Pyrenees. Sci. Total Environ. 2009, 407, 3546–3553. [Google Scholar] [CrossRef] [PubMed]
  8. Zhang, H.; Wang, Z.; Zhang, Y.; Ding, M.; Li, L. Identification of traffic-related metals and the effects of different environments on their enrichment in roadside soils along the Qinghai-Tibet highway. Sci. Total Environ. 2015, 521–522, 160–172. [Google Scholar] [CrossRef] [PubMed]
  9. Howard, K.; Haynes, J. Groundwater contamination due to road de-icing chemicals—Salt balance implications. Geosci. Can. 1993, 20, 1–8. [Google Scholar]
  10. Cunningham, M.A.; Snyder, E.; Yonkin, D.; Ross, M.; Elsen, T. Accumulation of deicing salts in soils in an urban environment. Urban Ecosyst. 2008, 11, 17–31. [Google Scholar] [CrossRef]
  11. Blomqvist, G. De-Icing Salt and the Roadside Environment: Air-Borne Exposure, Damage to Norway Spruce and System Monitoring. Ph.D. Thesis, Royal Institute of Technology, Stockholm, Sweden, 2001. [Google Scholar]
  12. Earon, R.; Olofsson, B.; Renman, G. Initial effects of a new highway section on soil and groundwater. Water Air Soil Pollut. 2012, 223, 5413–5432. [Google Scholar] [CrossRef]
  13. Wang, G.; Yan, X.; Zhang, F.; Zeng, C.; Gao, D. Traffic-related trace element accumulation in roadside soils and wild grasses in the Qinghai-Tibet Plateau, China. Int. J. Environ. Res. Public Health 2013, 11, 456–472. [Google Scholar] [CrossRef] [PubMed]
  14. Motto, H.L.; Daines, R.H.; Chilko, D.M.; Motto, C.K. Lead in soils and plants: Its relationship to traffic volume and proximity to highways: discussions follow. Environ. Sci. Technol. 1970, 4, 231–237. [Google Scholar] [CrossRef]
  15. Koeleman, M.; Vd Laak, W.J.; Ietswaart, H. Dispersion of PAH and heavy metals along motorways in the Netherlands—An overview. Sci. Total Environ. 1999, 235, 347–349. [Google Scholar] [CrossRef]
  16. Blomqvist, G.; Johansson, E.L. Airborne spreading and deposition of de-icing salt—A case study. Sci. Total Environ. 1999, 235, 161–168. [Google Scholar] [CrossRef]
  17. Zhang, H.; Wang, Z.; Zhang, Y.; Hu, Z. The effects of the Qinghai-Tibet railway on heavy metals enrichment in soils. Sci. Total Environ. 2012, 439, 240–248. [Google Scholar] [CrossRef] [PubMed]
  18. Yan, X.; Gao, D.; Zhang, F.; Zeng, C.; Xiang, W.; Zhang, M. Relationships between heavy metal concentrations in roadside topsoil and distance to road edge based on field observations in the Qinghai-Tibet Plateau, China. Int. J. Environ. Res. Public Health 2013, 10, 762–775. [Google Scholar] [CrossRef] [PubMed]
  19. Fakayode, S.; Olu-Owolabi, B. Heavy metal contamination of roadside topsoil in Osogbo, Nigeria: Its relationship to traffic density and proximity to highways. Environ. Geol. 2003, 44, 150–157. [Google Scholar] [CrossRef]
  20. Li, X.; Poon, C.; Liu, P.S. Heavy metal concentration of urban soils and street dusts in Hong Kong. Appl. Geochem. 2001, 16, 1361–1368. [Google Scholar] [CrossRef]
  21. Morton-Bermea, O.; Hernández Álvarez, E.; Gaso, I.; Segovia, N. Heavy metal concentrations in surface soils from Mexico City. Bull. Environ. Contam. Toxicol. 2002, 68, 383–388. [Google Scholar] [CrossRef]
  22. Akbar, K.F.; Hale, W.H.G.; Headley, A.D.; Athar, M. Heavy metal contamination of roadside soils of Northern England. Soil Water Res. 2006, 1, 158–163. [Google Scholar]
  23. Carol, E.S.; Kruse, E.E. Hydrochemical characterization of the water resources in the coastal environments of the outer Río de la Plata estuary, Argentina. J. S. Am. Earth Sci. 2012, 37, 113–121. [Google Scholar] [CrossRef]
  24. Nie, L.; Su, Z.D.; Xu, L.N.; Yang, X.R. Formation environment and distribution characteristics of main swamp turfy soil in China. J. Jilin Univ. (Earth Sci. Ed.) 2012, 42, 1477–1484, In Chinese. [Google Scholar] [CrossRef]
  25. Cobbett, C.S. Phytochelatins and their roles in heavy metal detoxification. Plant Physiol. 2000, 123, 825–832. [Google Scholar] [CrossRef] [PubMed]
  26. Schützendübel, A.; Polle, A. Plant responses to abiotic stresses: Heavy metal-induced oxidative stress and protection by mycorrhization. J. Exp. Bot. 2002, 53, 1351–1365. [Google Scholar] [CrossRef] [PubMed]
  27. Kalay, M.; Ay, Ö.; Canli, M. Heavy metal concentrations in fish tissues from the Northeast Mediterranean Sea. Bull. Environ. Contam. Toxicol. 1999, 63, 673–681. [Google Scholar] [CrossRef] [PubMed]
  28. Wang, H.; Nie, L.; Xu, Y.; Lv, Y. The effect of highway on heavy metal accumulation in soil in turfy swamps, Northeastern China. Water Air Soil Pollut. 2017, 228, 292. [Google Scholar] [CrossRef]
  29. Mohan, S.V.; Nithila, P.; Reddy, S.J. Estimation of heavy metals in drinking water and development of heavy metal pollution index. J. Environ. Sci. Health Part A 1996, 31, 283–289. [Google Scholar] [CrossRef]
  30. Lee, C.S.L.; Li, X.; Shi, W.; Cheung, S.C.N.; Thornton, I. Metal contamination in urban, suburban, and country park soils of Hong Kong: A study based on GIS and multivariate statistics. Sci. Total Environ. 2006, 356, 45–61. [Google Scholar] [CrossRef] [PubMed] [Green Version]
  31. Khan, M.N.; Wasim, A.A.; Sarwar, A.; Rasheed, M.F. Assessment of heavy metal toxicants in the roadside soil along the N-5, National Highway, Pakistan. Environ. Monit. Assess. 2011, 182, 587–595. [Google Scholar] [CrossRef] [PubMed]
  32. Ma, J.H.; Chu, C.J.; Li, J.; Song, B. Heavy metal pollution in soils on railroad side of Zhengzhou-Putian section of Longxi-Haizhou railroad. Pedosphere 2009, 19, 121–128. [Google Scholar] [CrossRef]
  33. Eimers, M.C.; Croucher, K.N.; Raney, S.M.; Morris, M.L. Sodium accumulation in calcareous roadside soils. Urban Ecosyst. 2015, 18, 1213–1225. [Google Scholar] [CrossRef]
  34. Bukowiecki, N.; Gehrig, R.; Hill, M.; Lienemann, P.; Zwicky, C.N.; Buchmann, B.; Weingartner, E.; Baltensperger, U. Iron, manganese and copper emitted by cargo and passenger trains in Zürich (Switzerland): Size-segregated mass concentrations in ambient air. Atmos. Environ. 2007, 41, 878–889. [Google Scholar] [CrossRef]
  35. Davila, A.; Rey, D.; Mohamed, K.; Rubio, B.; Guerra, A. Mapping the sources of urban dust in a coastal environment by measuring magnetic parameters of Platanus hispanica leaves. Environ. Sci. Technol. 2006, 40, 3922. [Google Scholar] [CrossRef] [PubMed]
  36. Wang, H.; Nie, L.; Xu, Y.; Li, M.; Lv, Y.; Wang, H. Traffic-emitted metal status and uptake by Carex meyeriana Kunth and Thelypteris palustris var. pubescens Fernald growing in roadside turfy swamp in the Changbai Mountain area, China. Environ. Sci. Pollut. Res. 2018, 19, 18498–18509. [Google Scholar] [CrossRef] [PubMed]
  37. Mishra, S.R.; Chandra, R.; Kaila, A.J.; Darshi, B.S. Kinetics and isotherm studies for the adsorption of metal ions onto two soil types. Environ. Technol. Innov. 2017, 7, 87–101. [Google Scholar] [CrossRef]
  38. Kumpiene, J.; Lagerkvist, A.; Maurice, C. Stabilization of Pb- and Cu-contaminated soil using coal fly ash and peat. Environ. Pollut. 2007, 145, 365–373. [Google Scholar] [CrossRef] [PubMed]
  39. Prasad, B.; Bose, J.M. Evaluation of the heavy metal pollution index for surface and spring water near a limestone mining area of the lower himalayas. Environ. Geol. 2001, 41, 183–188. [Google Scholar] [CrossRef]
  40. Al-Ani, M.Y.; Al-Nakib, S.M.; Ritha, N.M.; Nouri, A.M.; Assima, A. Water quality index applied to the classification and zoning of Al-jaysh canal, Baghdad—Iraq. J. Environ. Sci. Health Part A Environ. Sci. Eng. 1987, 22, 305–319. [Google Scholar] [CrossRef]
  41. Edet, A.E.; Offiong, O.E. Evaluation of water quality pollution indices for heavy metal contamination monitoring: A study case from Akpabuyo-Odukpani area, Lower Cross River Basin (southeastern Nigeria). GeoJouranl 2003, 57, 295–304. [Google Scholar] [CrossRef]
  42. Ruiying, D.; Yanhong, W.; Mingdeng, T.; Mengjun, L.; Shaoying, A. Remediation effects and evaluation of peat amendment on Pb and Cd contaminated in vegetable soil. Ecol. Environ. Sci. 2015, 24, 1893–1897. [Google Scholar] [CrossRef]
  43. Carolin, C.F.; Kumar, P.S.; Saravanan, A.; Joshiba, G.J.; Naushad, M. Efficient techniques for the removal of toxic heavy metals from aquatic environment: A review. J. Environ. Chem. Eng. 2017, 5, 2782–2799. [Google Scholar] [CrossRef]
  44. Dousova, B.; Buzek, F.; Rothwell, J.; Krejcova, S.; Lhotka, M. Adsorption behavior of arsenic relating to different natural solids: Soils, stream sediments and peats. Sci. Total Environ. 2012, 433, 456–461. [Google Scholar] [CrossRef] [PubMed]
Figure 1. Study area and sampling sites in the Changbai Mountain area, Jilin Province.
Ijerph 15 01652 g001
Figure 2. Cluster tree and scatter plots and of the 19 groundwater physicochemical indexes showing interrelationships among them.
Ijerph 15 01652 g002
Figure 3. Regression curves of highway-related pollutants concentrations in groundwater in turfy swamp.
Ijerph 15 01652 g003
Figure 4. Relationship between HPI and Cd values and distance to the highway edge.
Ijerph 15 01652 g004
Table 1. Storage requirements and test methods for groundwater samples.
ParameterSampling VolumeContainer MaterialPreservation MethodTest Method
Cu, Pb, Zn, Cd, Ni500 mLPAdd concentrated HNO3 and adjust pH to 1–2ICP-MS
Cr100 mLPAdd NaOH and adjust pH to 8–9ICP-MS
Hg250 mLBAdd concentrated HNO3 and adjust pH to 1–2Atomic florescence spectrum
As250 mLBAdd concentrated H2SO4 and adjust pH to 1–2ICP-MS
Ca2+, Mg2+, Na+, K+, SO42−, Cl, HCO3, F500 mLPOriginal preservationCa2+, Mg2+, Na+, K+: ICP-AES
Cl, F, SO42−: Ion chromatography method
HCO3: Acid-base titration method
NO3100 mLPOriginal preservationIon chromatography method
P. Polypropylene bottles; B. Borosilicate bottle; Original preservation: After sampling, no chemical reagents are added.
Table 2. Descriptive statistics of heavy metal concentrations (μg L−1) in groundwater of turfy swamps.
CuPbZnCdCrHgNiAs
JY site
Mean48.5a23.2ab100.0ab1.57a5.0a0.7b8.9a8.7a
SD7.45.010.60.181.40.11.00.8
Min35.215.480.31.263.40.57.77.2
Max61.530.5118.31.917.30.810.89.9
CV (%)15.221.510.611.526.86.58.58.6
LQ site
Mean58.3a26.3a114.2a1.75a5.4a0.08b6.9b3.1b
SD10.55.18.00.220.70.0010.80.3
Min43.317.697.31.414.230.075.82.4
Max78.134.1126.82.336.810.088.33.6
CV (%)18.119.217.013.113.03.510.810.2
HSD site
Mean20.6b16.5b91.0b1.27b6.6a3.0a6.9b8.0a
SD1.90.88.10.121.40.10.40.6
Min17.315.379.01.144.12.46.37.3
Max23.618.1106.21.519.23.67.99.7
CV (%)9.35.18.99.9321.28.36.57.6
ACV (%)14.215.312.211.5020.36.18.68.8
Class III100050100055012010
The data with different superscript lower case letters have significant differences (p < 0.05) in the columns; JY. Jingyu site; LQ. Longquan site; HSD. Huangsongdian site; CV. Coefficient of variation; ACV. Average CV; Class III. The water used for the second level reserve of groundwater source for drinking in China.
Table 3. Descriptive statistics of hydrochemical parameters concentrations (mg L−1) in groundwater of turfy swamps.
pHTDSCa2+Mg2+Na+K+SO42−ClHCO3NO3F
JY site
Mean5.6186.815.67.23.11.412.44.4202.10.430.11
SD0.53.10.90.70.70.50.50.63.10.050.02
Min4.4180.014.36.52.30.911.93.4195.20.370.09
Max6.3191.017.38.94.62.613.35.6207.50.520.15
CV (%)9.01.65.99.321.736.24.013.21.612.839.14
LQ site
Mean5.9271.635.75.02.81.211.38.1204.80.560.06
SD0.711.52.20.60.50.40.71.64.60.030.001
Min4.4255.131.94.21.80.710.45.4196.30.440.04
Max6.9296.338.36.53.41.912.310.4210.60.740.07
CV (%)12.54.26.111.918.230.56.219.62.35.017.63
HSD site
Mean6.2198.436.65.22.81.111.13.9132.50.330.31
SD0.44.21.50.70.50.20.71.03.90.020.01
Min5.6189.334.13.61.90.99.43.0126.50.290.29
Max6.7204.038.56.03.71.512.35.7138.30.370.33
CV (%)6.82.14.19.419.518.76.625.12.97.474.35
ACV (%)9.42.75.410.219.828.45.619.32.28.447.04
Total5.9218.929.35.82.91.211.65.5179.80.440.16
Class III6.5–8.51000150 200 250250 201.0
JY. Jingyu site; LQ. Longquan site; HSD. Huangsongdian site; CV. Coefficient of variation; ACV. Average CV; Class III. The water used for the second level reserve of groundwater source for drinking in China.
Table 4. Pearson correlation coefficients between the affected parameters and distances in groundwater.
SiteCuPbZnCdCrNa+K+Cl
JY−0.698 *−0.666 *−0.397 *−0.822 *−0.671 *−0.438−0.528 *−0.407 *
LQ−0.797 **−0.871 **−0.385−0.349 *−0.554−0.541−0.606 *−0.386
HSD0.208−0.160−0.411 *−0.427−0.306−0.488 *−0.476−0.450 *
Whole−0.340 *−0.440 **−0.264 *−0.341 *−0.416 *−0.456 **−0.484 **−0.288 **
* Correlation is significant at the 0.05 level (two-tailed); ** Correlation is significant at the 0.01 level (two-tailed).
Table 5. The background contents of Cu, Pb, Zn, Cr, Cd, Na+, K+, Cl in groundwater in different turfy swamp sites.
SiteCu
(μg L−1)
Pb
(μg L−1)
Zn
(μg L−1)
Cd
(μg L−1)
Cr
(μg L−1)
Na+
(mg L−1)
K+
(mg L−1)
Cl
(mg L−1)
JY43.618.794.91.33.92.81.14.0
LQ46.217.4110.11.76.02.30.97.2
HSD20.616.585.61.25.02.41.03.2
Table 6. Correlation coefficients for the distance and metal concentrations with indices values.
JYLQHSD
HPICdHPICdHPICd
Distance−0.750 *−0.739 *−0.854 **−0.868 **0.0380.047
Cu0.778 **0.798 **0.912 **0.910 **0.2580.221
Pb0.976 **0.976 **0.980 **0.983 **0.599 *0.646 *
Zn0.660 *0.666 *0.621 *0.620 *0.2130.338
Cd0.718 **0.694 *0.642 *0.623 *0.739 **0.608 *
Cr0.821 **0.812**0.621*0.622 *0.612 *0.715 **
Hg0.2030.1830.2890.2820.2910.333
Ni0.1790.256−0.456−0.4600.3070.352
As0.0490.082−0.128−0.1400.5130.562
* Correlation is significant at the 0.05 level (two-tailed); ** Correlation is significant at the 0.01 level (two-tailed).

