Establishing Heat Alert Thresholds for the Varied Climatic Regions of British Columbia, Canada


Abstract
:1. Introduction
2. Materials and Methods
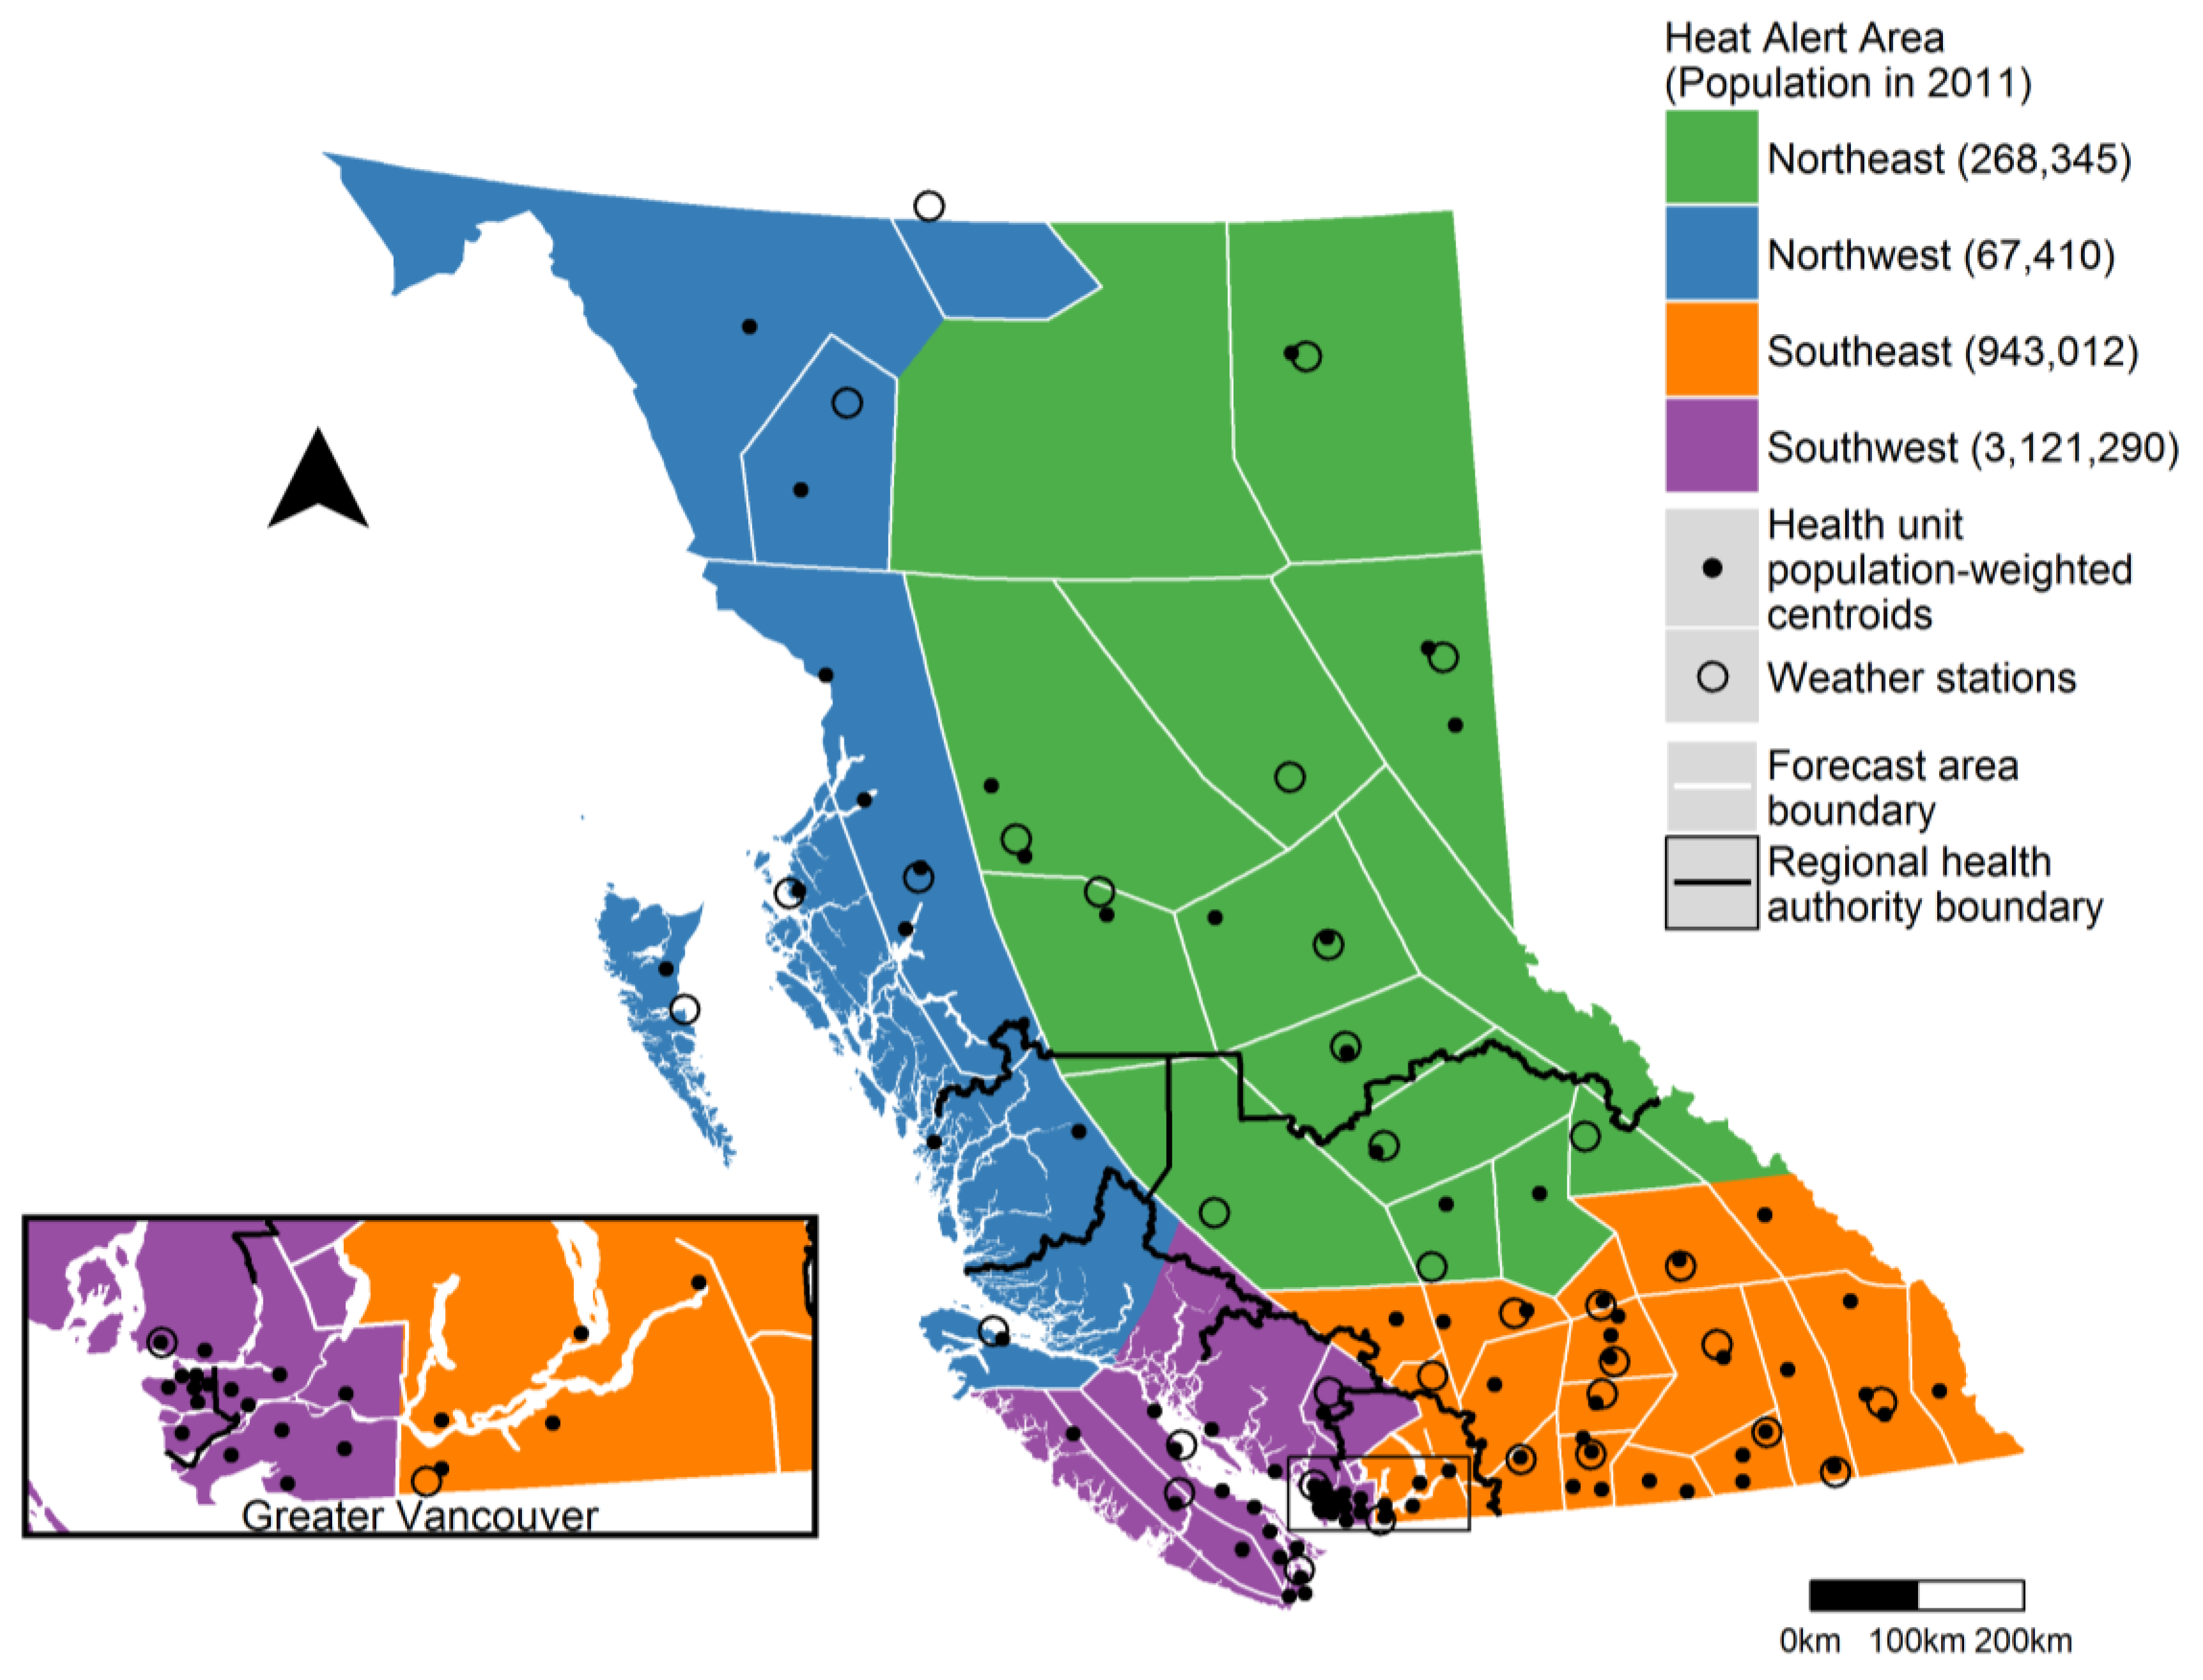
2.1. Study Context
2.2. Heat Alert Areas
2.3. Temperature Forecasts and Observations
2.4. Mortality
2.5. Time-Series Modelling
2.6. Identification of Heat Alert Thresholds
2.7. Sub-Analyses
3. Results
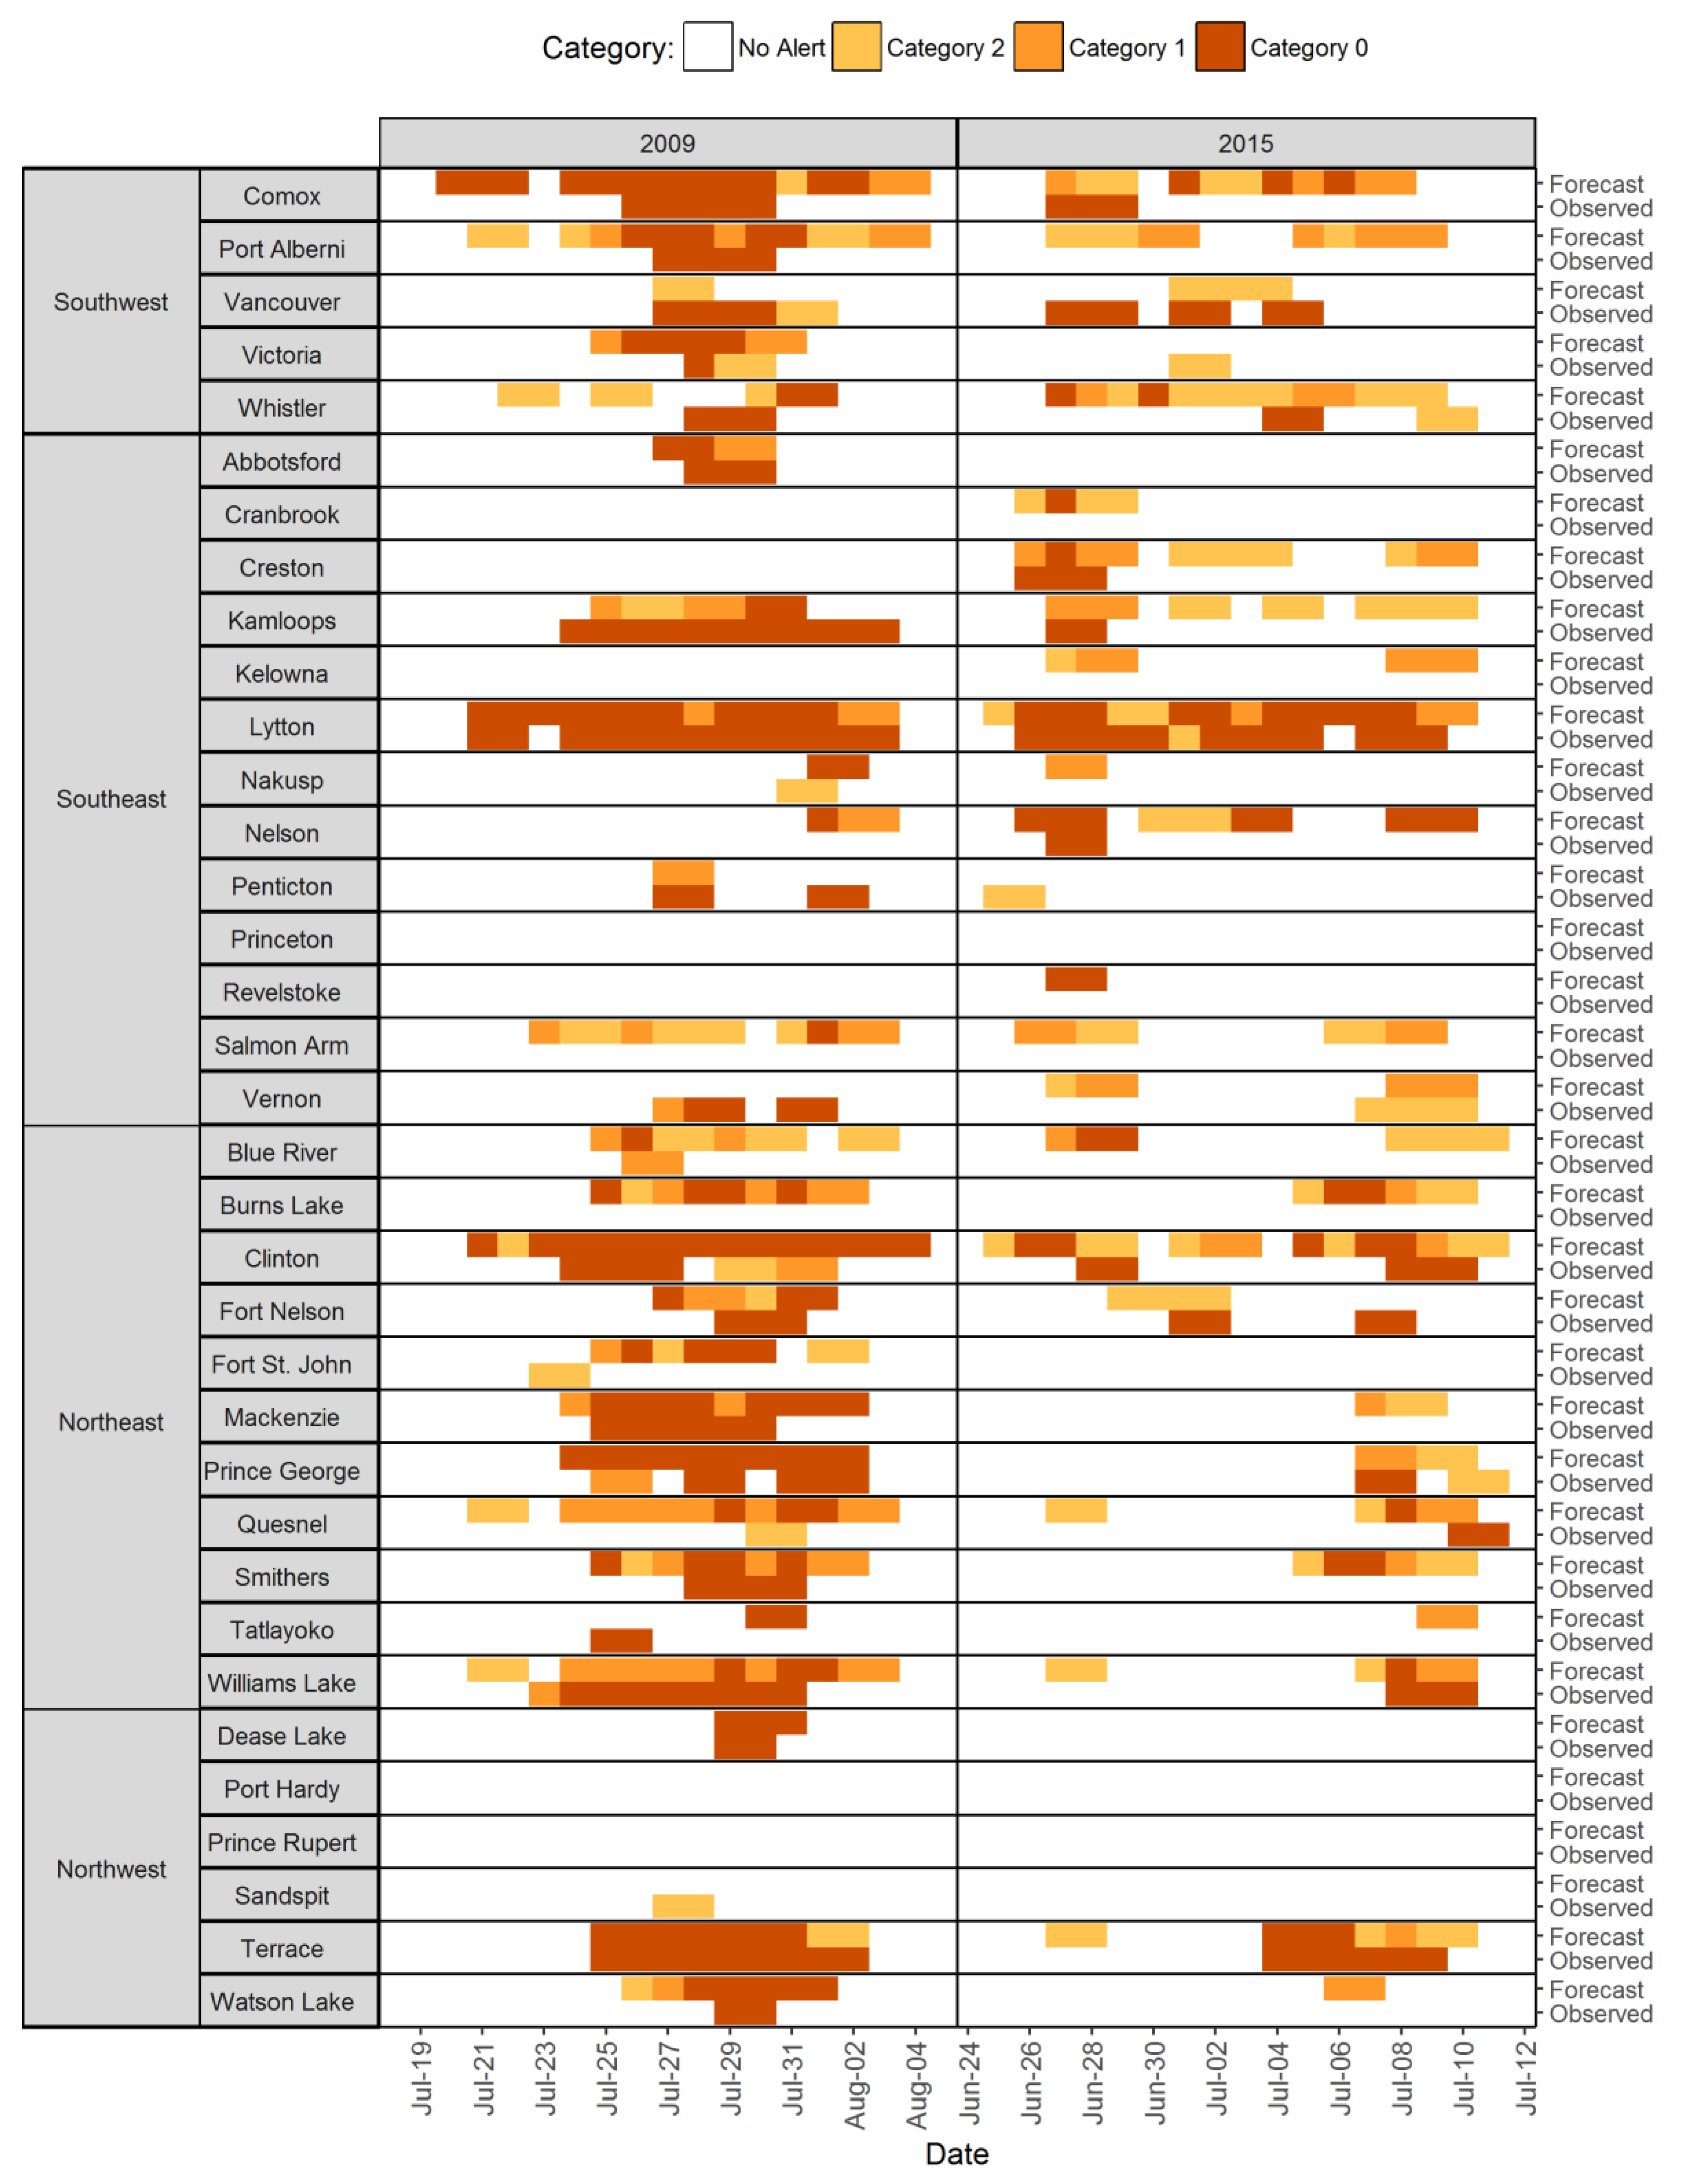
3.1. Observed and Forecasted Temperatures
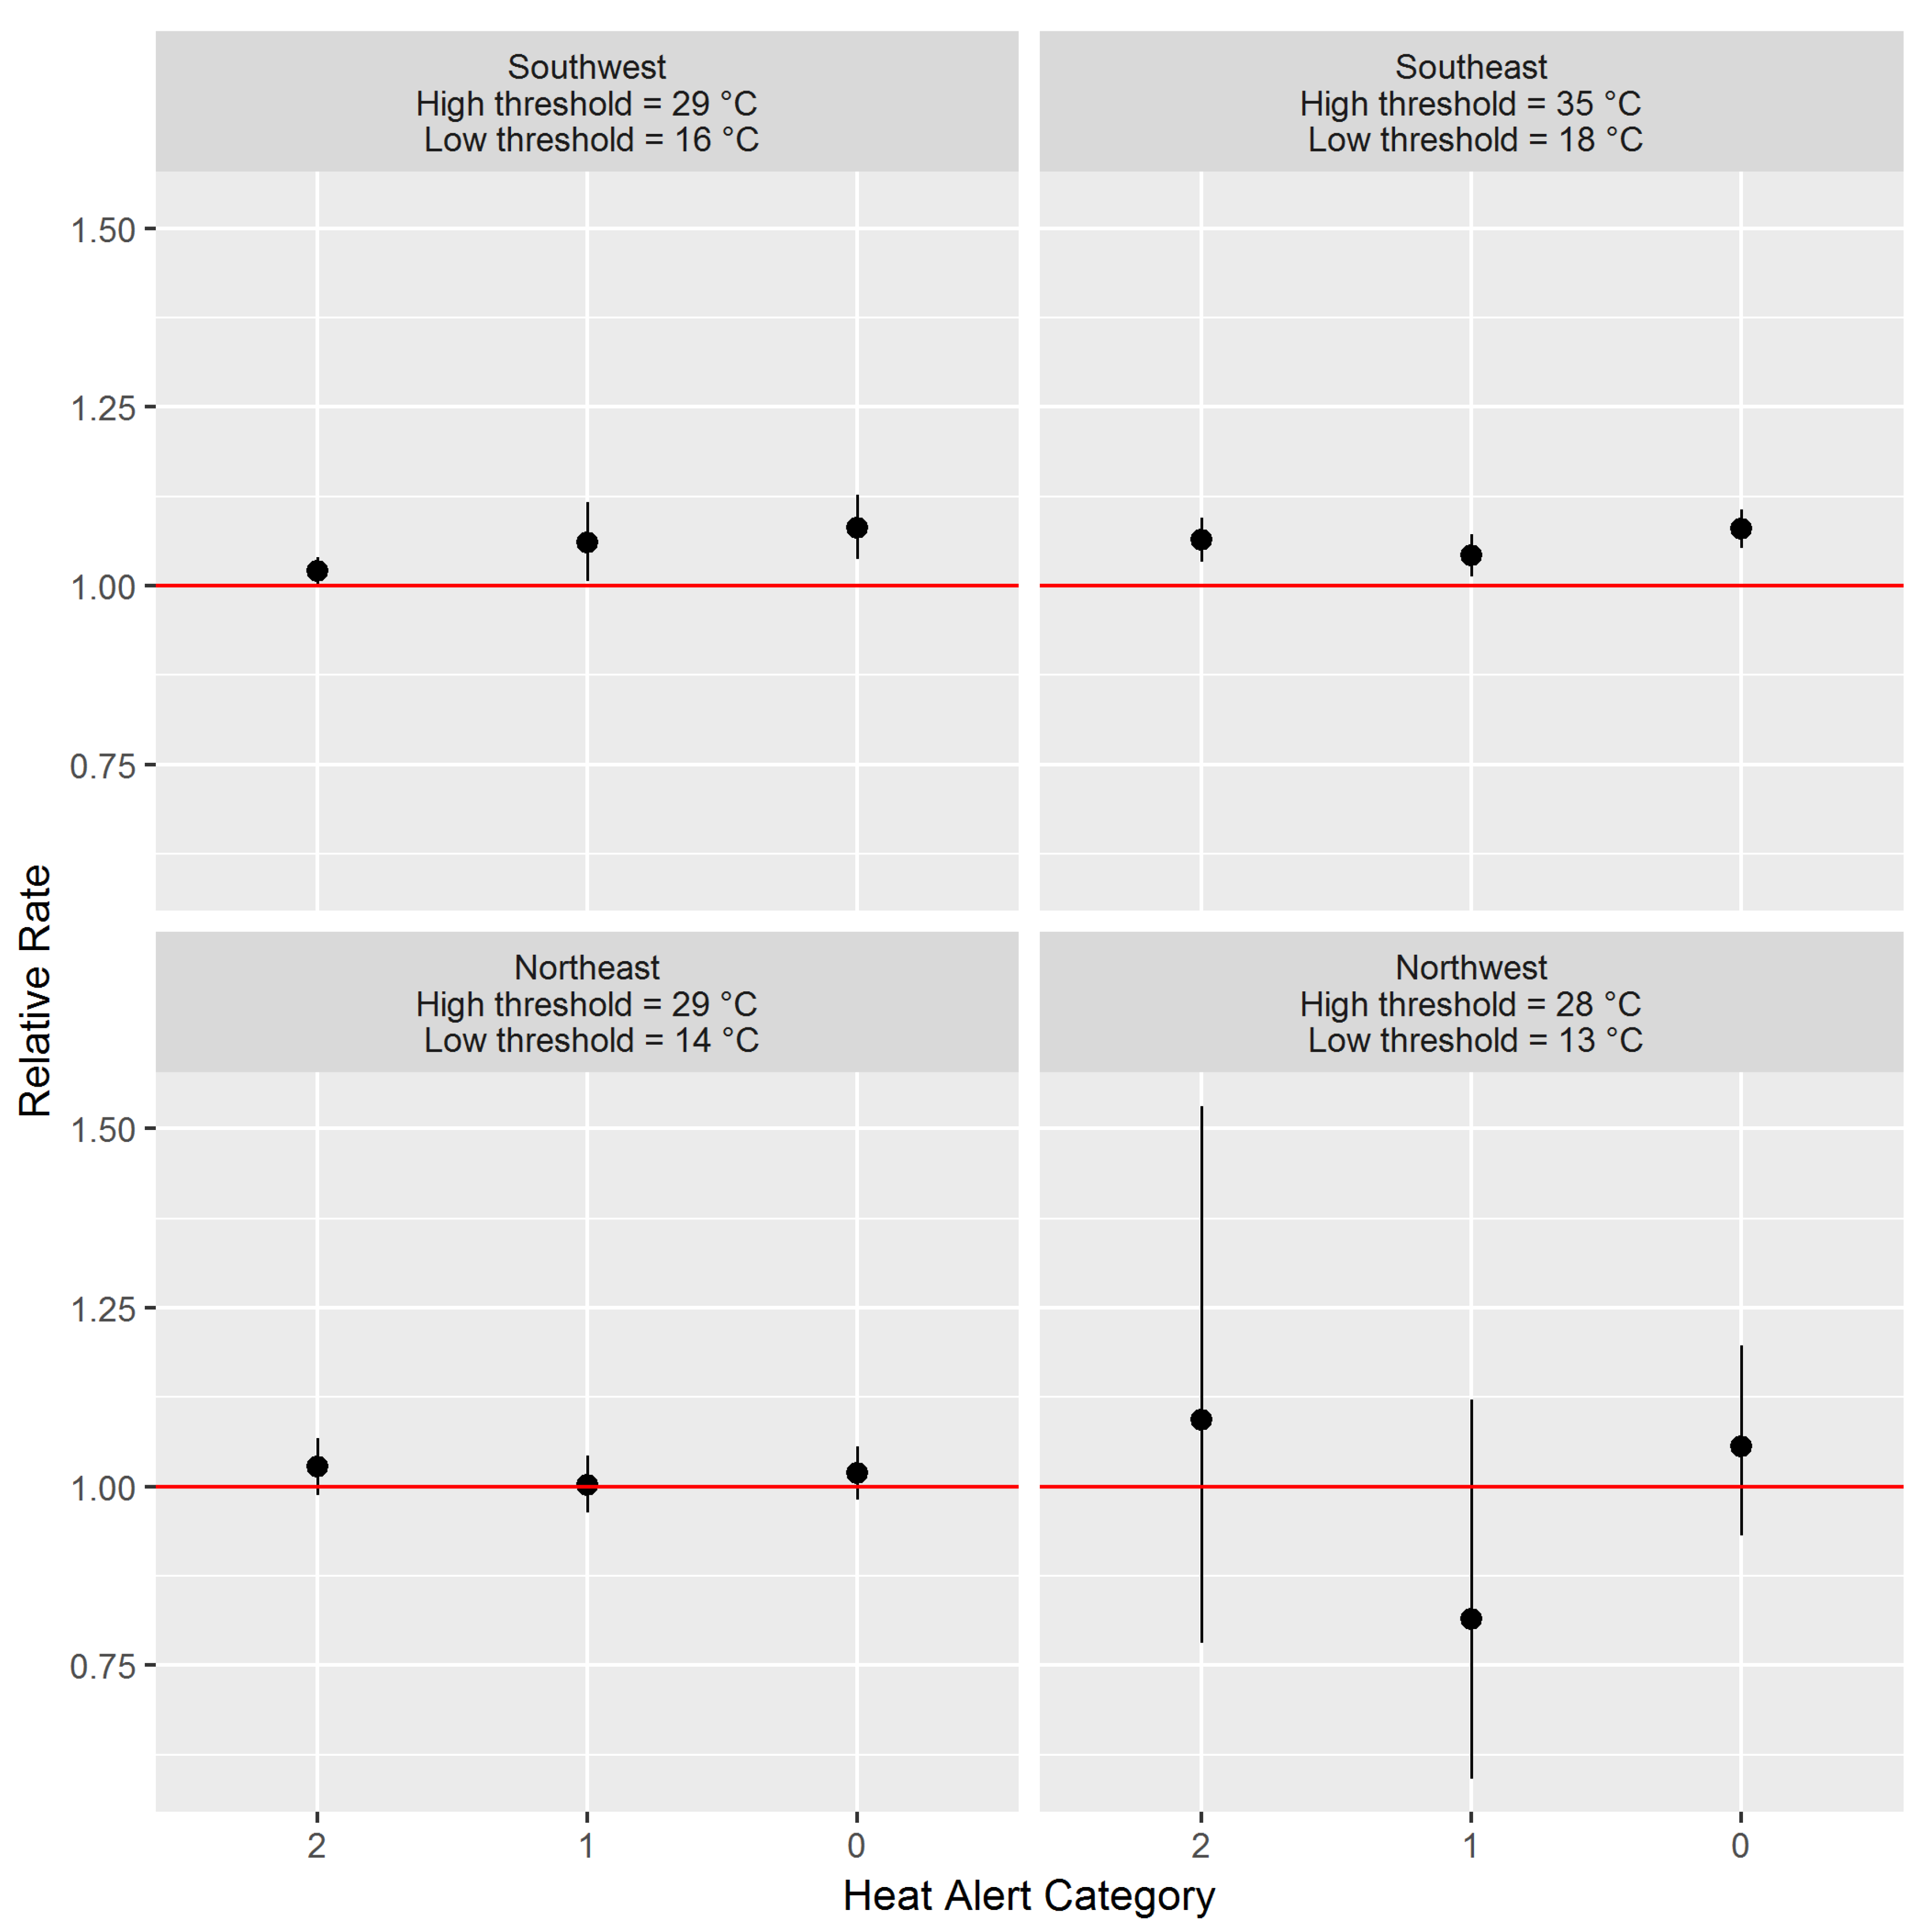
3.2. Heat Alert Thresholds
3.3. Retrospective Heat Alerts Using Forecasted and Observed Temperatures
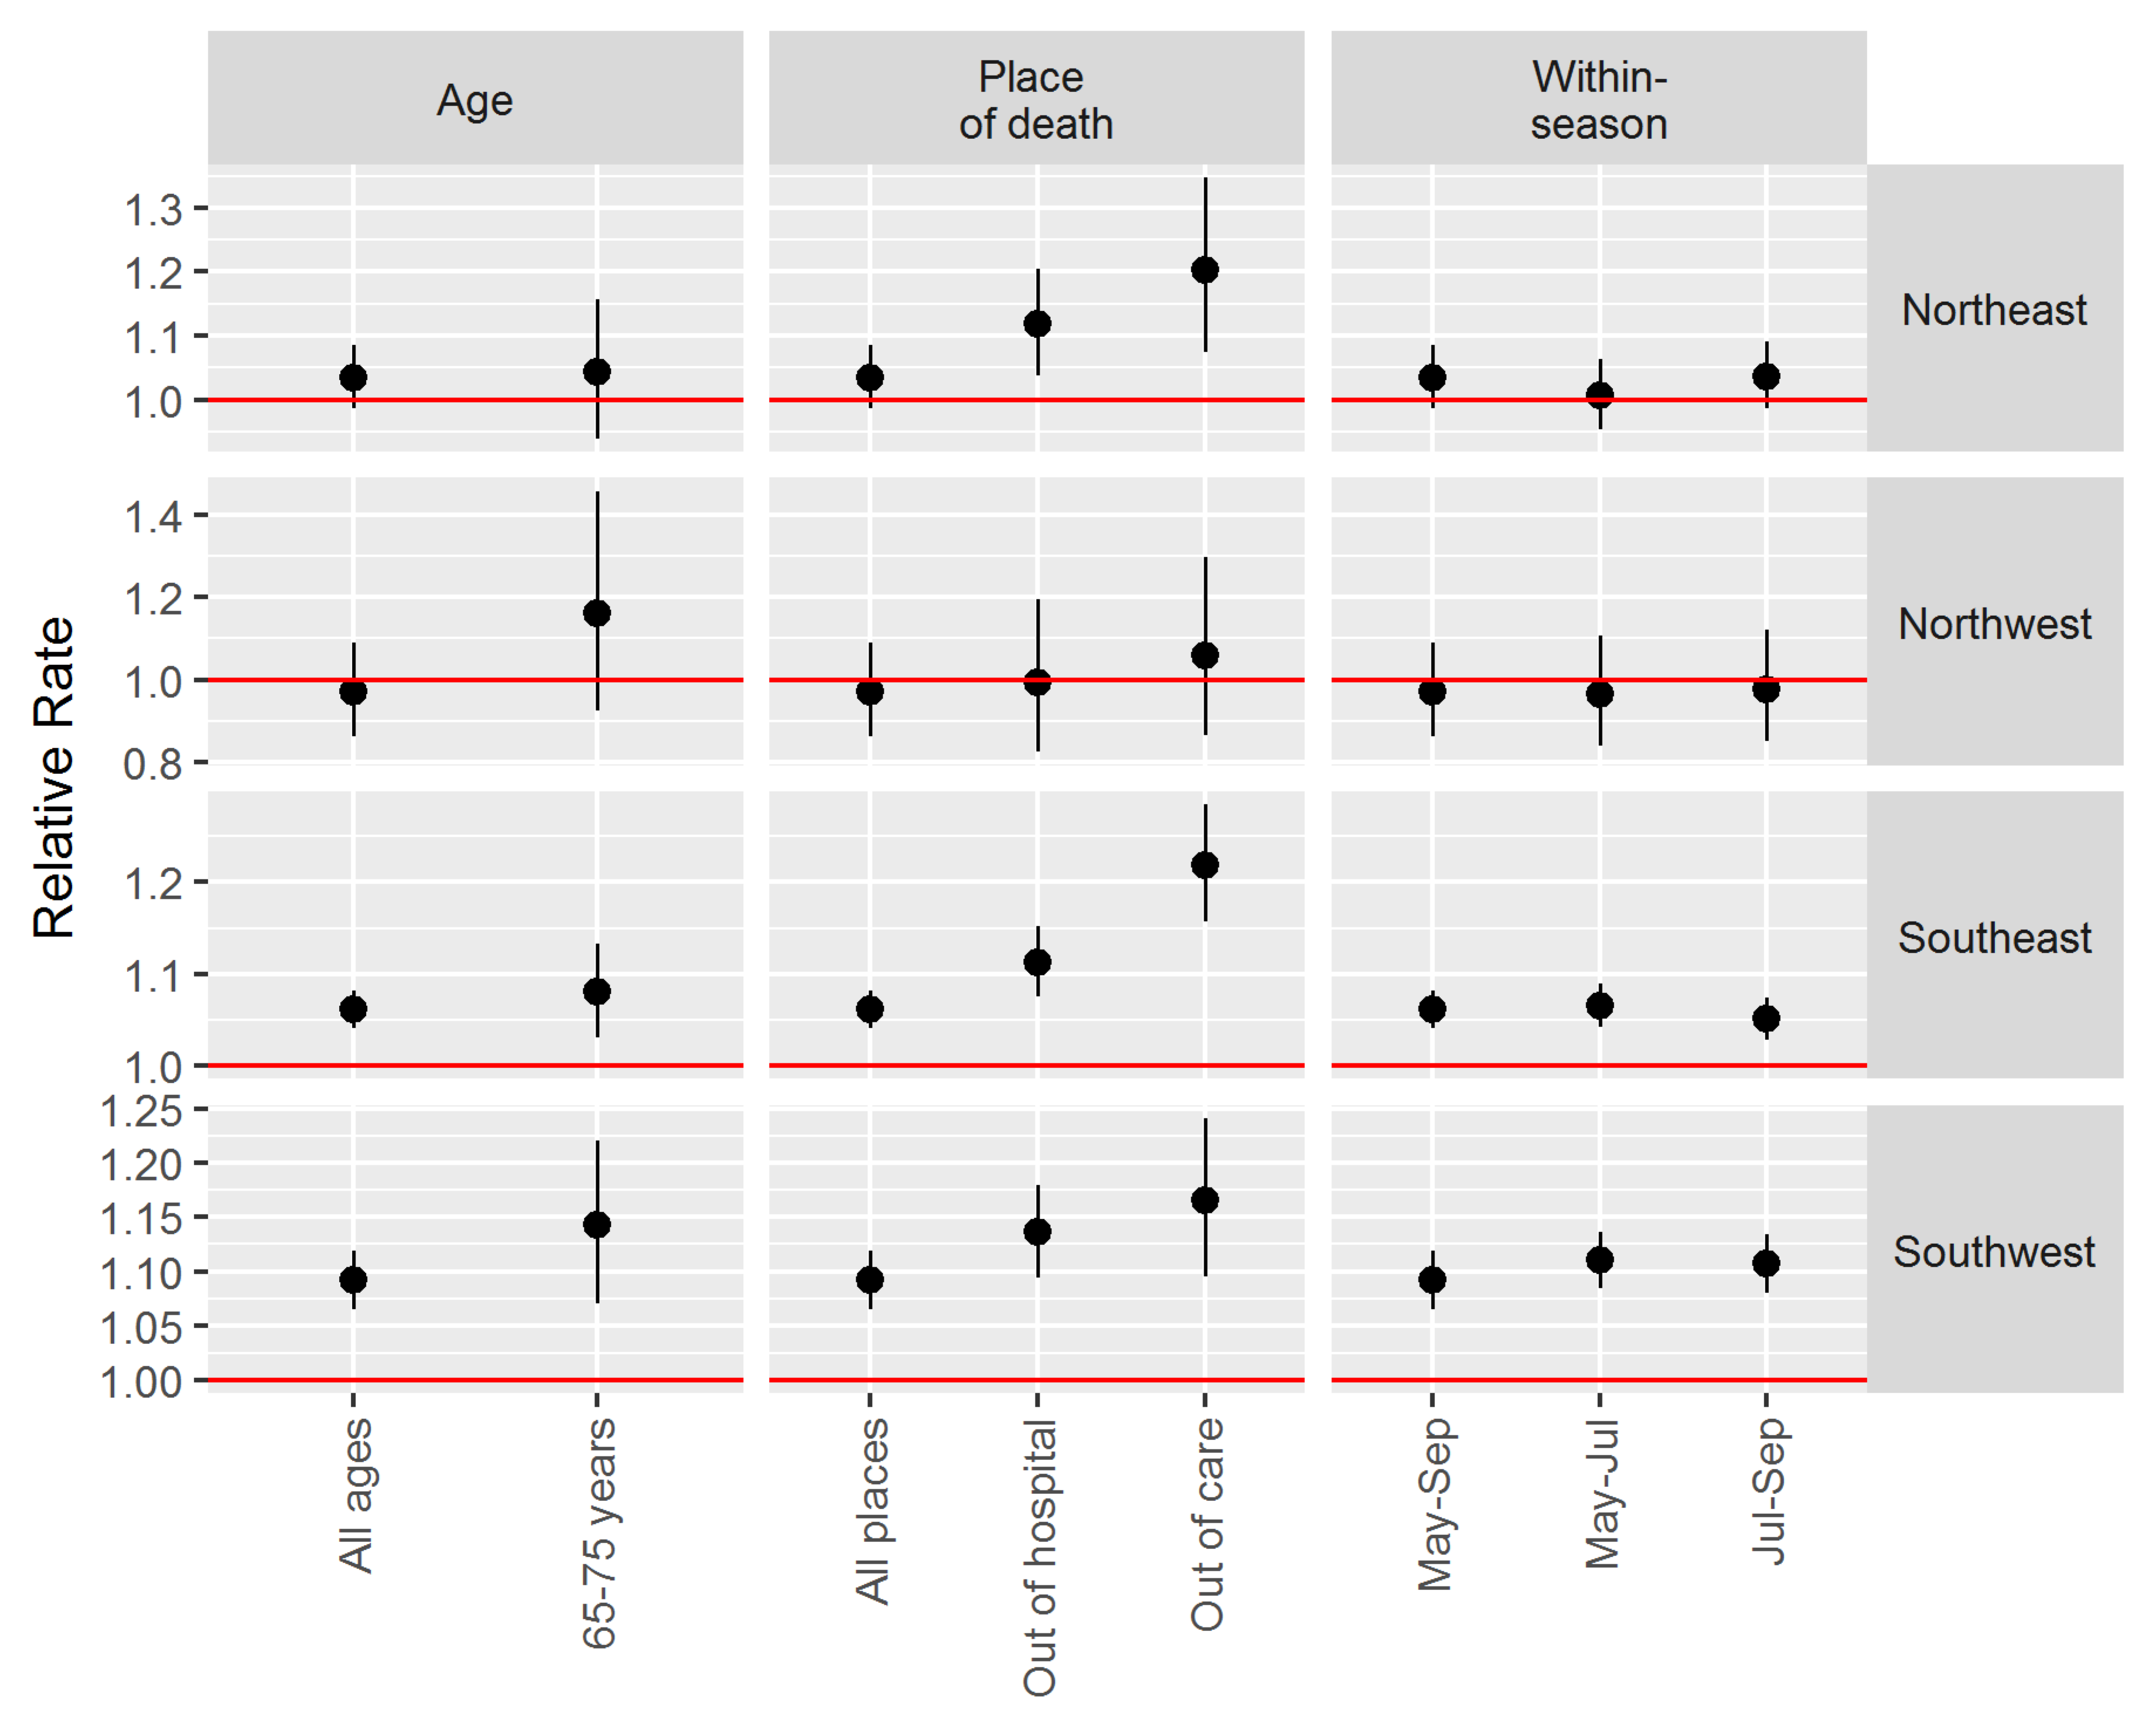
3.4. Sub-Analyses
4. Discussion
5. Conclusions
Supplementary Materials
Author Contributions
Funding
Acknowledgments
Conflicts of Interest
References
- Health Canada. Extreme Heat Events Guidelines: Technical Guide for Health Care Workers. Chemical Policy Bureau, Healthy Environments and Consumer Safety Branch; Health Canada: Ottawa, ON, Canada, 2011; p. 149.
- Bai, L.; Li, Q.; Wang, J.; Lavigne, E.; Gasparrini, A.; Copes, R.; Yagouti, A.; Burnett, R.T.; Goldberg, M.S.; Cakmak, S.; et al. Increased coronary heart disease and stroke hospitalisations from ambient temperatures in Ontario. Heart 2018, 104, 673–679. [Google Scholar] [CrossRef] [PubMed]
- Ordon, M.; Welk, B.; Li, Q.; Wang, J.; Lavigne, E.; Yagouti, A.; Copes, R.; Cakmak, S.; Chen, H. Ambient Temperature and the Risk of Renal Colic: A Population-Based Study of the Impact of Demographics and Comorbidity. J. Endourol. 2016, 30, 1138–1143. [Google Scholar] [CrossRef] [PubMed]
- Booth, G.L.; Luo, J.; Park, A.L.; Feig, D.S.; Moineddin, R.; Ray, J.G. Influence of environmental temperature on risk of gestational diabetes. CMAJ Can. Med. Assoc. J. 2017, 189, E682–E689. [Google Scholar] [CrossRef] [PubMed] [Green Version]
- Auger, N.; Fraser, W.D.; Smargiassi, A.; Kosatsky, T. Ambient Heat and Sudden Infant Death: A Case-Crossover Study Spanning 30 Years in Montreal, Canada. Environ. Health Perspect. 2015, 123, 712–716. [Google Scholar] [CrossRef] [PubMed]
- He, S.; Kosatsky, T.; Smargiassi, A.; Bilodeau-Bertrand, M.; Auger, N. Heat and pregnancy-related emergencies: Risk of placental abruption during hot weather. Environ. Int. 2018, 111, 295–300. [Google Scholar] [CrossRef] [PubMed]
- Auger, N.; Naimi, A.I.; Smargiassi, A.; Lo, E.; Kosatsky, T. Extreme heat and risk of early delivery among preterm and term pregnancies. Epidemiology 2014, 25, 344–350. [Google Scholar] [CrossRef] [PubMed]
- Misset, B.; De Jonghe, B.; Bastuji-Garin, S.; Gattolliat, O.; Boughrara, E.; Annane, D.; Hausfater, P.; Garrouste-Orgeas, M.; Carlet, J. Mortality of patients with heatstroke admitted to intensive care units during the 2003 heat wave in France: A national multiple-center risk-factor study. Crit. Care Med. 2006, 34, 1087–1092. [Google Scholar] [CrossRef] [PubMed]
- Auger, N.; Bilodeau-Bertrand, M.; Labesse, M.E.; Kosatsky, T. Association of elevated ambient temperature with death from cocaine overdose. Drug Alcohol Depend. 2017, 178, 101–105. [Google Scholar] [CrossRef] [PubMed]
- Henderson, S.B.; Gauld, J.S.; Rauch, S.A.; McLean, K.E.; Krstic, N.; Hondula, D.M.; Kosatsky, T. A proposed case-control framework to probabilistically classify individual deaths as expected or excess during extreme hot weather events. Environ. Health 2016, 15, 109. [Google Scholar] [CrossRef] [PubMed]
- Bustinza, R.; Lebel, G.; Gosselin, P.; Bélanger, D.; Chebana, F. Health impacts of the July 2010 heat wave in Québec, Canada. BMC Public Health 2013, 13, 56. [Google Scholar] [CrossRef] [PubMed]
- Cheng, C.S.; Campbell, M.; Li, Q.; Li, G.; Auld, H.; Day, N.; Pengelly, D.; Gingrich, S.; Klaassen, J.; MacIver, D.; et al. Differential and combined impacts of extreme temperatures and air pollution on human mortality in south–central Canada. Part I: Historical analysis. Air Qual. Atmos. Health 2008, 1, 209–222. [Google Scholar] [CrossRef]
- Bassil, K.L.; Cole, D.C.; Moineddin, R.; Lou, W.; Craig, A.M.; Schwartz, B.; Rea, E. The relationship between temperature and ambulance response calls for heat-related illness in Toronto, Ontario, 2005. J. Epidemiol. Community Health 2011, 65, 829–831. [Google Scholar] [CrossRef] [PubMed]
- Bishop-Williams, K.E.; Berke, O.; Pearl, D.L.; Kelton, D.F. A spatial analysis of heat stress related emergency room visits in rural Southern Ontario during heat waves. BMC Emerg. Med. 2015, 15, 17. [Google Scholar] [CrossRef] [PubMed]
- Gasparrini, A.; Guo, Y.; Hashizume, M.; Lavigne, E.; Zanobetti, A.; Schwartz, J.; Tobias, A.; Tong, S.; Rocklöv, J.; Forsberg, B.; et al. Mortality risk attributable to high and low ambient temperature: A multicountry observational study. Lancet 2015, 386, 369–375. [Google Scholar] [CrossRef]
- Henderson, S.B.; Wan, V.; Kosatsky, T. Differences in heat-related mortality across four ecological regions with diverse urban, rural, and remote populations in British Columbia, Canada. Health Place 2013, 23, 48–53. [Google Scholar] [CrossRef] [PubMed]
- Barreca, A.; Clay, K.; Deschenes, O.; Greenstone, M.; Shapiro, J.S. Adapting to Climate Change: The Remarkable Decline in the US Temperature-Mortality Relationship over the Twentieth Century. J. Polit. Econ. 2016, 124, 105–159. [Google Scholar] [CrossRef]
- Environment and Climate Change Canada. Criteria for Public Weather Alerts. Available online: https://www.canada.ca/en/environment-climate-change/services/types-weather-forecasts-use/public/criteria-alerts.html#heat (accessed on 3 July 2018).
- World Meteorological Organization and World Health Organization. Heatwaves and Health: Guidance on Warning-System Development. Available online: http://www.who.int/globalchange/publications/heatwaves-health-guidance/en/ (accessed on 12 June 2018).
- Henderson, S.B.; Kosatsky, T. A data-driven approach to setting trigger temperatures for heat health emergencies. Can. J. Public Health 2012, 103, 227–230. [Google Scholar] [PubMed]
- Sheridan, S.C.; Kalkstein, L.S. Progress in Heat Watch–Warning System Technology. Bull. Am. Meteorol. Soc. 2004, 85, 1931–1942. [Google Scholar] [CrossRef] [Green Version]
- Lowe, D.; Ebi, K.L.; Forsberg, B. Heatwave early warning systems and adaptation advice to reduce human health consequences of heatwaves. Int. J. Environ. Res. Public Health 2011, 8, 4623–4648. [Google Scholar] [CrossRef] [PubMed]
- Hajat, S.; Kosatky, T. Heat-related mortality: A review and exploration of heterogeneity. J. Epidemiol. Community Health 2010, 64, 753–760. [Google Scholar] [CrossRef] [PubMed]
- R Core Team. R: A Language and Environment for Statistical Computing. Available online: https://www.r-project.org/ (accessed on 27 June 2018).
- Schwarzer, G. Meta: An R package for meta-analysis. R News 2007, 7, 40–45. [Google Scholar]
- Kosatsky, T.; Henderson, S.B.; Pollock, S.L. Shifts in mortality during a hot weather event in Vancouver, British Columbia: Rapid assessment with case-only analysis. Am. J. Public Health 2012, 102, 2367–2371. [Google Scholar] [CrossRef] [PubMed]
- Mackie, B. Warning Fatigue: Insights from the Australian Bushfire Context. Ph.D. Thesis, University of Canterbury, Christchurch, New Zealand, 2013. [Google Scholar]
- Province of British Columbia. Sub-Provincial Life Expectancy. Available online: https://www.bcstats.gov.bc.ca/apps/VitalStatistics.aspx (accessed on 9 July 2018).
- Fouillet, A.; Rey, G.; Laurent, F.; Pavillon, G.; Bellec, S.; Guihenneuc-Jouyaux, C.; Clavel, J.; Jougla, E.; Hémon, D. Excess mortality related to the August 2003 heat wave in France. Int. Arch. Occup. Environ. Health 2006, 80, 16–24. [Google Scholar] [CrossRef] [PubMed] [Green Version]
- Medina-Ramón, M.; Zanobetti, A.; Cavanagh, D.P.; Schwartz, J. Extreme temperatures and mortality: Assessing effect modification by personal characteristics and specific cause of death in a multi-city case-only analysis. Environ. Health Perspect. 2006, 114, 1331–1336. [Google Scholar] [CrossRef] [PubMed] [Green Version]
- Health Canada. Heat Alert and Response Systems to Protect Health: Best Practices Guidebook. Available online: https://www.canada.ca/en/health-canada/services/environmental-workplace-health/reports-publications/climate-change-health/heat-alert-response-systems-protect-health-best-practices-guidebook.html (accessed on 26 July 2018).


| Scenarios | Dayt High (Deviation below Threshold) | Overnight Low (Deviation below Threshold) | Dayt+1 High (Deviation below Threshold) | Category (Sum of Deviation below Threshold, Maximum of 3) |
|---|---|---|---|---|
| Example threshold values | 30 | 15 | 30 | - |
| Scenario 1 | 31 (0) | 16 (0) | 34 (0) | 0 |
| Scenario 2 | 30 (0) | 15 (0) | 30 (0) | 0 |
| Scenario 3 | 29 (1) | 16 (0) | 30 (0) | 1 |
| Scenario 4 | 32 (0) | 14 (1) | 32 (0) | 1 |
| Scenario 5 | 31 (0) | 17 (0) | 28 (2) | 2 |
| Scenario 6 | 32 (0) | 14 (1) | 29 (1) | 2 |
| Scenario 7 | 29 (1) | 14 (1) | 29 (1) | 3 |
| Scenario 8 | 28 (2) | 16 (0) | 29 (1) | 3 |
| Scenario 9 | 30 (0) | 15 (0) | 27 (3) | 3 |
| Scenario 10 | 29 (1) | 14 (1) | 28 (2) | 3 |
| Heat Alert Area | Forecast Area | Average Number of Heat Alerts Per Year Based on Forecasted Temperatures | Average Number of Heat Alerts Per Year Based on Observed Temperatures |
|---|---|---|---|
| Southwest | Comox | 2 | 1 |
| Port Alberni | 2 | 0 | |
| Vancouver | 1 | 2 | |
| Victoria | 0 | 1 | |
| Whistler | 2 | 1 | |
| Southeast | Abbotsford | 1 | 0 |
| Cranbrook | 2 | 0 | |
| Creston | 2 | 1 | |
| Kamloops | 1 | 2 | |
| Kelowna | 1 | 0 | |
| Lytton | 3 | 2 | |
| Nakusp | 1 | 0 | |
| Nelson | 2 | 0 | |
| Penticton | 0 | 2 | |
| Princeton | 1 | 0 | |
| Revelstoke | 1 | 0 | |
| Salmon Arm | 2 | 0 | |
| Vernon | 1 | 1 | |
| Northeast | Blue River | 2 | 1 |
| Burns Lake | 2 | 0 | |
| Clinton | 4 | 1 | |
| Fort Nelson | 2 | 1 | |
| Fort St. John | 2 | 1 | |
| Mackenzie | 2 | 0 | |
| Prince George | 2 | 1 | |
| Quesnel | 3 | 1 | |
| Smithers | 2 | 0 | |
| Tatlayoko | 1 | 0 | |
| Williams Lake | 3 | 1 | |
| Northwest | Dease Lake | 0 | 1 |
| Terrace | 3 | 3 | |
| Watson Lake | 2 | 0 | |
| Port Hardy | 1 | 0 | |
| Prince Rupert | 0 | 0 | |
| Sandspit | 0 | 1 |
© 2018 by the authors. Licensee MDPI, Basel, Switzerland. This article is an open access article distributed under the terms and conditions of the Creative Commons Attribution (CC BY) license (http://creativecommons.org/licenses/by/4.0/).
Share and Cite
McLean, K.E.; Stranberg, R.; MacDonald, M.; Richardson, G.R.A.; Kosatsky, T.; Henderson, S.B. Establishing Heat Alert Thresholds for the Varied Climatic Regions of British Columbia, Canada. Int. J. Environ. Res. Public Health 2018, 15, 2048. https://0-doi-org.brum.beds.ac.uk/10.3390/ijerph15092048
McLean KE, Stranberg R, MacDonald M, Richardson GRA, Kosatsky T, Henderson SB. Establishing Heat Alert Thresholds for the Varied Climatic Regions of British Columbia, Canada. International Journal of Environmental Research and Public Health. 2018; 15(9):2048. https://0-doi-org.brum.beds.ac.uk/10.3390/ijerph15092048
Chicago/Turabian StyleMcLean, Kathleen E., Rebecca Stranberg, Melissa MacDonald, Gregory R. A. Richardson, Tom Kosatsky, and Sarah B. Henderson. 2018. "Establishing Heat Alert Thresholds for the Varied Climatic Regions of British Columbia, Canada" International Journal of Environmental Research and Public Health 15, no. 9: 2048. https://0-doi-org.brum.beds.ac.uk/10.3390/ijerph15092048