Analyzing Municipal Solid Waste Treatment Scenarios in Rapidly Urbanizing Cities in Developing Countries: The Case of Dar es Salaam, Tanzania


Abstract
:1. Introduction
2. Materials and Methods
2.1. Basic Data Acquisition
2.2. Scenario Development
2.2.1. Scenario Design
2.2.2. Scenario Selection
2.2.3. Using the Elimination and Choice Expressing Reality (ELECTRE) Method for Scenario Selection
3. Results and Discussion
3.1. Generation Trend of MSW in Dar es Salaam
3.2. Formulated Scenarios for MSW Management in Dar es Salaam Code
3.3. Selected Scenarios for Initial Decision Matrix
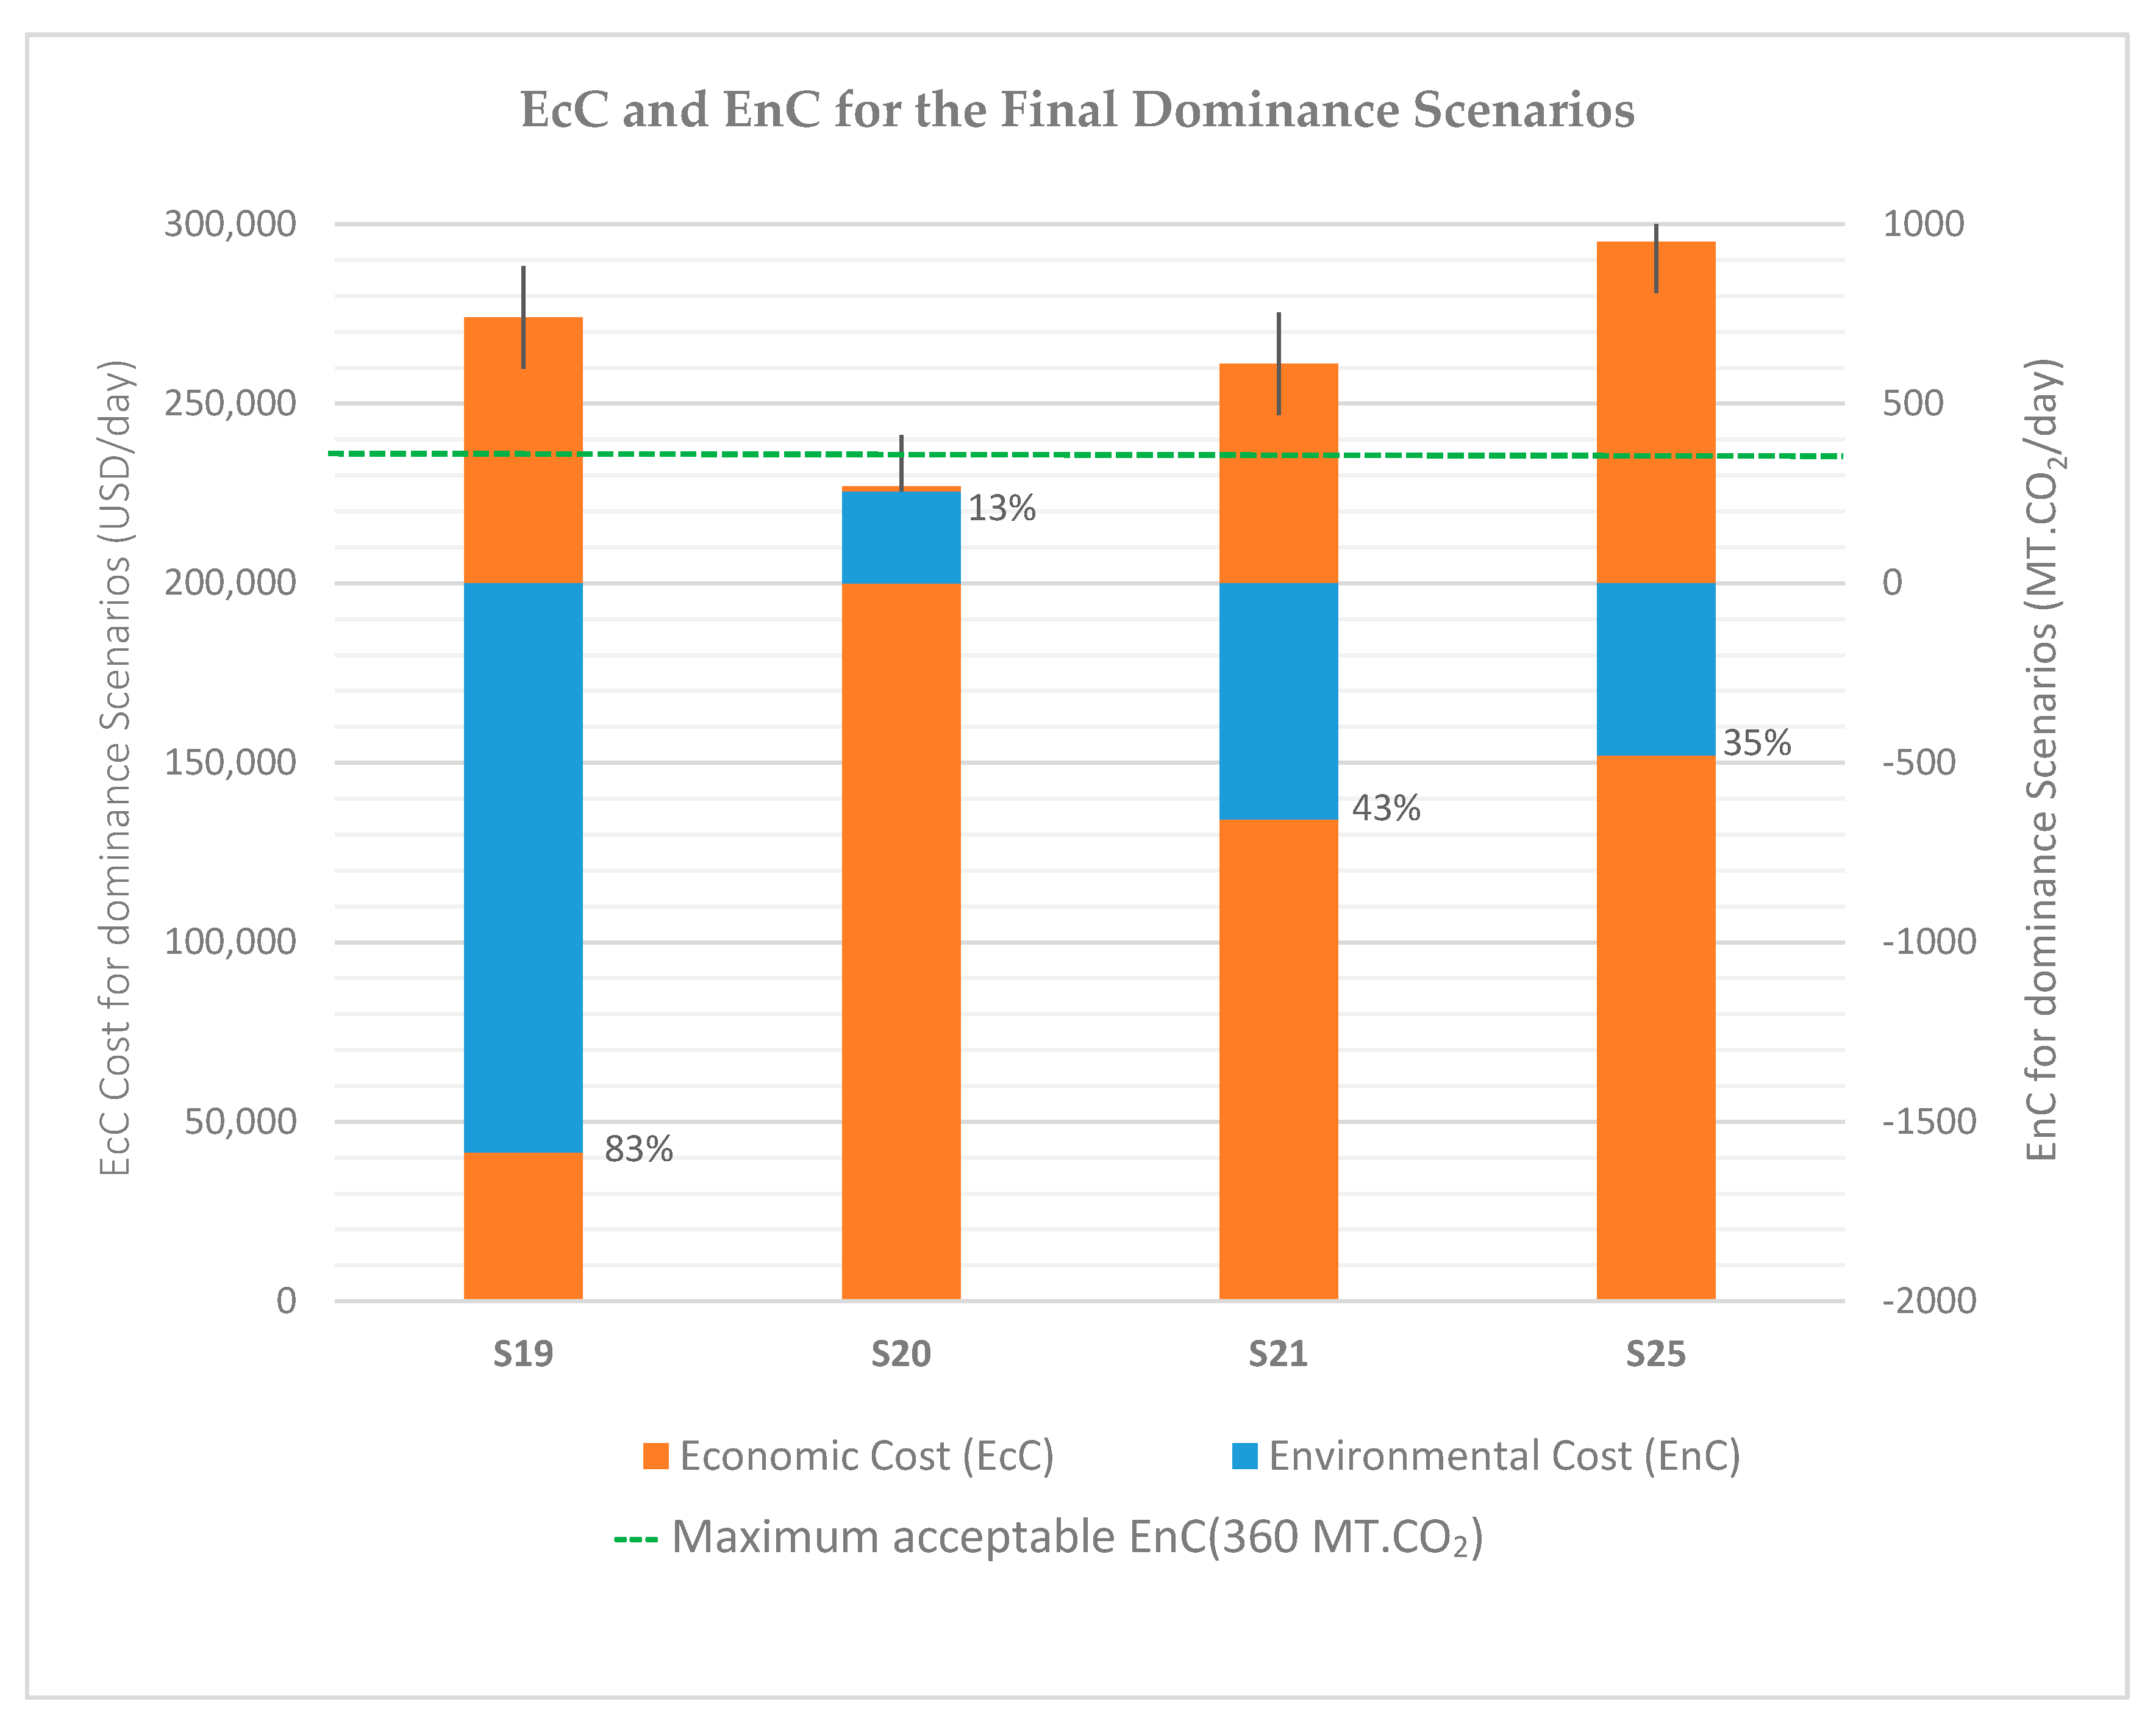
3.4. Grouping of Acceptable Scenarios
4. Conclusions
Author Contributions
Funding
Acknowledgments
Conflicts of Interest
References
- UN-HABITAT. Solid Waste Management in the World’s Cities: Water and Sanitation in the World’s Cities; United Nations Human Settlements Programme (UN-HABITAT): London, UK; Washington, DC, USA, 2010. [Google Scholar]
- UNEP. Converting Waste Plastics into a Resource: Assessment, Guidelines; DTIE—Division of Technology, Industry and Economics; United Nations Environment Programme; IETC (International Environmental Technology Centre): Osaka/Shiga, Japan, 2009; pp. 73–74. [Google Scholar]
- Singh, R.P.; Tyagi, V.V.; Allen, T.; Ibrahim, M.H.; Kothari, R. An overview for exploring the possibilities of energy generation from municipal solid waste (MSW) in Indian scenario. Renew. Sustain. Energy Rev. 2011, 15, 4797–4808. [Google Scholar] [CrossRef]
- Angelo, B. Lands of the Poor: Local Environmental Governance and the Decentralized Management of Natural Resources; UNCDF: New York, NY, USA, 2004; pp. 68–69. [Google Scholar]
- Narayana, T. Municipal solid waste management in India: From waste disposal to recovery of resources. Waste Manag. 2009, 29, 1163–1166. [Google Scholar] [CrossRef] [PubMed]
- Diamadopoulos, E.; Koutsantonakis, Y.; Zaglara, V. Optimal design of municipal solid waste recycling systems. Resour. Conserv. Recycl. 1995, 14, 21–34. [Google Scholar] [CrossRef]
- Quiros, R.; Gabarrell, X.; Villalba, G. The application of LCA to alternative methods for treating the organic fiber produced from autoclaving unsorted municipal solid waste: case study of Catalonia. Clean. Prod. 2015, 107, 516–528. [Google Scholar] [CrossRef]
- Xia, G.; Liu, T.; Wang, Z.; Hou, Y.; Dong, L.; Zhu, J.; Qi, J. The effect of silver nanoparticles on zebrafish embryonic development and toxicology. Artif. Cells Nanomed. Biotechnol. 2016, 44, 1116. [Google Scholar] [CrossRef]
- Awasthi, A.K.; Zeng, X.; Li, J. Environmental pollution of electronic waste recycling in India: A critical review. Environ. Pollut. 2016, 211, 259–270. [Google Scholar] [CrossRef]
- Qdais, A. Techno-economic assessment of municipal solid waste management in Jordan. Waste Manag. 2007, 27, 1666–1672. [Google Scholar] [CrossRef] [PubMed]
- Kazuva, E.; Zhang, J.; Tong, Z.; Si, A.; Li, N. The DPSIR Model for Environmental Risk Assessment of Municipal Solid Waste in Dar es Salaam City, Tanzania. Int. J. Environ. Res. Public Health 2018, 15, 1692. [Google Scholar] [CrossRef]
- Henry, R.K.; Yongsheng, Z.; Jun, D. Municipal solid waste management challenges in developing countries: Kenyan case study. Waste Manag. 2006, 26, 92–100. [Google Scholar] [CrossRef] [PubMed]
- Gurung, A.; Oh, S.E. Municipal Solid Waste Management: Challenges and Opportunities in Nepal. Korean J. Soil Sci. Fertil. 2012, 45, 421–427. [Google Scholar] [CrossRef] [Green Version]
- Getahun, T.; Mengistie, E.; Haddis, A.; Wasie, F.; Alemayehu, E.; Dadi, D. Municipal solid waste generation in growing urban areas in Africa: Current practices and relation to socioeconomic factors in Jimma, Ethiopia. Environ. Monit. Assess. 2012, 184, 6337–6345. [Google Scholar] [CrossRef] [PubMed]
- Omran, A.; Gavrilescu, M. Municipal solid waste management in developing countries: A perspective on Vietnam. Environ. Eng. Manag. J. 2008, 7, 469–478. [Google Scholar] [CrossRef]
- Ghafour, S.; Shoresh, A.; Chiman, M. Strategic Planning of Factors Affecting Municipal Solid Waste Management by Analysis SWOT a Case Study: Bukan City, Kurdistan Province. Environ. Based Territ. Plan. 2013, 6, 1–21. [Google Scholar]
- Vishwakarma, A.; Kulshrestha, M.; Kulshreshtha, M. Efficiency evaluation of municipal solid waste management utilities in the urban cities of the state of Madhya Pradesh, India, using stochastic frontier analysis. Benchmarking Int. J. 2012, 19, 340–357. [Google Scholar] [CrossRef]
- Huisman, H.; Breukelman, H.; Keesman, B. Expert Mission on Integrated Solid Waste Management (ISWM) to Dar es Salaam; MetaSus: The Hague, The Netherlands, 2016. [Google Scholar]
- Melaré, A.V.D.S.; González, S.M.; Faceli, K.; Casadei, V.J.W.M. Technologies and decision support systems to aid solid-waste management: A systematic review. Waste Manag. 2017, 59, 567–584. [Google Scholar] [CrossRef] [PubMed]
- Alexis, T.; Mihelcic, J. Sustainable recycling of municipal solid waste in developing countries. Waste Manag. 2009, 29, 915–923. [Google Scholar]
- Boadi, K.O.; Kuitunen, M. Municipal solid waste management in the Accra metropolitan area, Ghana. Environmentalist 2003, 23, 211–218. [Google Scholar] [CrossRef]
- Kirama, A.; Mayo, A.W. Challenges and prospects of private sector participation in solid waste management in Dar es Salaam City, Tanzania. Habitat Int. 2016, 53, 195–205. [Google Scholar] [CrossRef]
- NBS. National Bureau of Statistics, 2012 Population and Housing Census. Ministry of Finance, United Republic of Tanzania. 2013. Available online: http://www.tzdpg.or.tz/fileadmin/documents/dpg_internal/dpg_working_groups_clusters/cluster_2/water/WSDP/Background_information/2012_Census_General_Report.pdf (accessed on 21 May 2019).
- UN. World Population Review: Urbanization Prospect; United Nations-Population Division: New York, NY, USA, 2019; Available online: http://worldpopulationreview.com/world-cities/dar-es-salaam-population/#sources (accessed on 21 May 2019).
- Huang, G.H.; Sae-Lim, N.; Liu, L.; Chen, Z. An interval-parameter fuzzy-stochastic programming approach for municipal solid waste management and planning. Environ. Model. Assess. 2001, 6, 271–283. [Google Scholar] [CrossRef]
- Tanskanen, J.H. Strategic planning of municipal solid waste management. Resour. Conserv. Recycl. 2000, 30, 111–133. [Google Scholar] [CrossRef]
- Triassi, M.; Alfano, R.; Illario, M.; Nardone, A.; Caporale, O.; Montuori, P. Environmental pollution from illegal waste disposal and health effects: A review on the “triangle of death”. Int. J. Environ. Res. Public Health 2015, 12, 1216–1236. [Google Scholar] [CrossRef] [PubMed]
- Wu, K.; Zhang, L.P. Application of environmental risk assessment for strategic decision making in coastal areas: case studies in China. J. Environ. Plan. Manag. Publ. Online 2015, 59, 826–842. [Google Scholar] [CrossRef]
- Soltani, A.; Hewage, K.; Reza, B.; Sadiq, R. Multiple stakeholders in multi-criteria decision-making in the context of Municipal Solid Waste Management: A review. Waste Manag. 2015, 35, 318–328. [Google Scholar] [CrossRef] [PubMed]
- Soós, R.; Whiteman, A.D.; Wilson, D.C.; Briciu, C.; Oelz, B.; Gunsilius, E.; Schwehn, E. Operator models for delivering municipal solid waste management services in developing countries: Part B—Decision support. Waste Manag. Res. 2017, 35, 842–862. [Google Scholar] [CrossRef] [PubMed]
- Yili, L.; Peixuan, X.; Jianguo, L. Environmental performance evaluation of different municipal solid waste management scenarios in China. Resour. Conserv. Recycl. 2017, 125, 98–106. [Google Scholar]
- Sthiannopkao, S. Managing E-Waste in Developed and Developing Countries; Springer: Berlin/Heidelberg, Germany, 2012; pp. 263–278. [Google Scholar]
- Mmereki, D.; Baldwin, A.; Li, B. A comparative analysis of solid waste management in developed, developing and lesser developed countries. Environ. Technol. Rev. 2016, 5, 120–141. [Google Scholar] [CrossRef]
- Guerrero, L.A.; Maas, G.; Hogland, W. Solid waste management challenges for cities in developing countries. Waste Manag. 2013, 33, 220–232. [Google Scholar] [CrossRef]
- Bundhoo; Zumar, M. Solid waste management in least developed countries: current status and challenges faced. J. Mater. Cycles Waste Manag. 2018, 20, 1–11. [Google Scholar] [CrossRef]
- Sukholthaman, P.; Shirahada, K. Technological challenges for effective development towards sustainable waste management in developing countries: Case study of Bangkok, Thailand. Technol. Soc. 2015, 43, 231–239. [Google Scholar] [CrossRef]
- Zhu, J.; Ehrgott, M.; Bienstock, D.; Matsatsinis, N.; Alpern, S. Multiple Criteria Decision Analysis: State of the Arts Surveys; Springer Science + Business Media, Inc.: Boston, MA, USA, 2005. [Google Scholar]
- Fatta, D.; Moll, S.; Tsotsos, D. Assessment of Information Related to Waste and Material Flows; European Environmental Agency: Copenhagen, Denmark, 2003. [Google Scholar]
- Ishizaka, A.; Nemery, P. Multi-Criteria Decision Analysis Methods and Software; John Wiley & Sons, Ltd.: Chichester, West Sussex, UK, 2013. [Google Scholar]
- Daskalopoulos, E.; Badr, O.; Probert, S.D. Municipal solid waste: a prediction methodology for the generation rate and composition in the European Union countries and the United States of America. Resour. Conserv. Recycl. 1998, 24, 155–166. [Google Scholar] [CrossRef]
- Song, J.; Song, D. A Decision-Making Model of Concession Period for Municipal Solid Waste Incineration Build-Operate-Transfer Project. In Proceedings of the International Conference on Management and Service Science, Wuhan, China, 20–22 September 2009; pp. 1–4. [Google Scholar] [CrossRef]
- Harijani, A.M.; Mansour, S.; Karimi, B.; Lee, C.G. Multi-period sustainable and integrated recycling network for municipal solid waste—A case study in Tehran. J. Clean. Prod. 2017, 151, 96–108. [Google Scholar] [CrossRef]
- Beck, B.D. An evaluation of the US Environmental Protection Agency definition of a risk assessment. Hum. Exp. Toxicol. 2006, 25, 3–5. [Google Scholar] [CrossRef] [PubMed]
- URT. The United Republic of Tanzania, 2013-2015 National Population Projections; URT National Bureau of Statistics, URT Press: Dar es Salaam, Tanzania, 2018; pp. 7–113. [Google Scholar]
- WB. Upgrading of Low Income Settlements: Country Assessment Report; World Bank: Washington, DC, USA, 2002; Available online: http://web.mit.edu/urbanupgrading/upgrading/case-examples/overview-africa/country-assessments/reports/Tanzania-report.html (accessed on 23 January 2009).
- Kumar, S.; Dhar, H.; Nair, V.; Bhattacharyya, J.; Vaidya, A.; Akolkar, A. Characterization of municipal solid waste in high-altitude sub-tropical regions. Environ. Technol. Rev. 2016, 37, 2627–2637. [Google Scholar] [CrossRef] [PubMed]
- Lohri, C.R.; Faraji, A.; Ephata, E.; Rajabu, H.M.; Zurbrügg, C. Urban biowaste for solid fuel production: Waste suitability assessment and experimental carbonization in Dar es Salaam, Tanzania. Waste Manag. Res. 2015, 33, 175–182. [Google Scholar] [CrossRef] [PubMed]
- Mbwette, T.; Kalwani, J.; Yohana, L. Assessment on Vulnerable Youths Integration to Dar es Salaam Solid Waste Management for Improvement: Kinondoni Municipality Case. Huria 2015, 20, 1–9. [Google Scholar]
- Rada, E.C.; Ragazzi, M.; Ionescu, G.; Merler, G.; Moedinger, F.; Raboni, M.; Torretta, V. Municipal Solid Waste Treatment by Integrated Solutions: Energy and Environmental Balances. Energy Procedia 2014, 50, 1037–1044. [Google Scholar] [CrossRef] [Green Version]
- Menikpura, S.; Gheewala, S.; Bonnet, S. Sustainability assessment of municipal solid waste management in Sri Lanka: problems and prospects. J. Mater. Cycles Waste Manag. 2012, 14, 181–192. [Google Scholar] [CrossRef]
- Margallo, M.; Taddei, M.B.M.; Hernández-Pellón, A.; Aldaco, R.; Irabien, Á. Environmental sustainability assessment of the management of municipal solid waste incineration residues: A review of the current situation. Clean Technol. Environ. Policy 2015, 17, 1333–1353. [Google Scholar] [CrossRef]
- Beccali, G.; Cellura, M.; Mistretta, M. Managing municipal solid waste. Int. J. Life Cycle Assess. 2001, 6, 243–249. [Google Scholar] [CrossRef]
- Liu, Y.; Ni, Z.; Kong, X.; Liu, J. Greenhouse gas emissions from municipal solid waste with a high organic fraction under different management scenarios. J. Clean. Prod. 2017, 147, 451–457. [Google Scholar] [CrossRef]
- Zhu, F.; Takaoka, M.; Oshita, K.; Morisawa, S. The Calcination Process in a System for Washing, Calcinating, and Converting Treated Municipal Solid Waste Incinerator Fly Ash into Raw Material for the Cement Industry. J. Air Waste Manag. Assoc. 2011, 61, 740–746. [Google Scholar] [CrossRef] [PubMed] [Green Version]
- Ionescu, G.; Rada, E.; Ragazzi, M.; Mărlescu, C.; Badea, A.; Apostol, T. Integrated municipal solid waste scenario model using advanced pretreatment and waste to energy processes. Energy Convers. Manag. 2013, 76, 1083–1092. [Google Scholar] [CrossRef]
- Oyoo, R.; Leemans, R.; Mol, A.P.J. Comparison of environmental performance for different waste management scenarios in East Africa: The case of Kampala City, Uganda. Habitat Int. 2014, 44, 349–357. [Google Scholar] [CrossRef]
- Yakov, H. Risk Modeling, Assessment, and Management, 3rd ed.; John Wiley & Sons, Inc.: Hoboken, NJ, USA, 2009. [Google Scholar]
- Emery, A.; Davies, A.; Griffiths, A.; Williams, K. Environmental and economic modelling: A case study of municipal solid waste management scenarios in Wales. Resour. Conserv. Recycl. 2007, 49, 244–263. [Google Scholar] [CrossRef]
- João, A.; Paulo, F. Assessing the costs of municipal solid waste treatment technologies in developing Asian countries. Waste Manag. 2017, 69, 592–608. [Google Scholar]
- Abrate, G.; Boffa, F.; Erbetta, F.; Vannoni, D. Corruption, Accountability and Efficiency: An Application to Municipal Solid Waste Services. 2013. Available online: https://ideas.repec.org/p/tur/wpapnw/022.html (accessed on 28 November 2018).
- Nilsson, H.; Cunningham, G.M.; Hassel, L.G. A study of the provision of environmental information in financial analysts’ research reports. Sustain. Dev. 2010, 16, 180–194. [Google Scholar] [CrossRef]
- Demirel, P.; Parris, S. Access to finance for innovators in the UK’s environmental sector. Technol. Anal. Strateg. Manag. 2015, 27, 782–808. [Google Scholar] [CrossRef]
- USEPA. Solid Waste and Emergency Response—Full Cost Accounting for Municipal Solid Waste Management: A Handbook; Gov-Publishers: Washngton, DC, USA, 1997.
- Maalouf, A.; El-Fadel, M. Effect of a food waste disposer policy on solid waste and wastewater management with economic implications of environmental externalities. Waste Manag. 2017. [Google Scholar] [CrossRef]
- Menikpura, S.; Gheewala, S.; Bonnet, S.; Chiemchaisri, C. Evaluation of the effect of recycling on sustainability of municipal solid waste management in Thailand. Waste Biomass Valoriz. 2013, 4, 237–257. [Google Scholar] [CrossRef]
- Spencer, R.L. Cost Considerations of Municipal Solid Waste Compost: Production versus Market Price. Compos. Sci. Util. 1993, 1, 20–37. [Google Scholar]
- Pandyaswargo, A.H.; Premakumara, D.G.J. Financial sustainability of modern composting: the economically optimal scale for municipal waste composting plant in developing Asia. Int. J. Recycl. Org. Waste Agric. 2014, 3, 4. [Google Scholar] [CrossRef]
- Scarlat, N.; Motola, V.; Dallemand, J.F. Evaluation of energy potential of Municipal Solid Waste from African urban areas. Renew. Sustain. Energy Rev. 2015, 50, 1269–1286. [Google Scholar] [CrossRef]
- Soma, K. Natura economica in Environmental Valuation. Environ. Values 2006, 15, 31–50. [Google Scholar] [CrossRef]
- Panepinto, D.; Blengini, G.A.; Genon, G. Economic and environmental comparison between two scenarios of waste management: MBT vs thermal treatment. Resour. Conserv. Recycl. 2015, 97, 16–23. [Google Scholar] [CrossRef]
- Bozorgirad, M.A.; Zhang, H.; Haapala, K.R.; Murthy, G.S. Environmental impact and cost assessment of incineration and ethanol;production as municipal solid waste management strategies. Int. J. Life Cycle Assess. 2013, 18, 1502–1512. [Google Scholar] [CrossRef]
- Balcazar, J.G.C.; Dias, R.A.; Balestieri, J.A.P. Analysis of hybrid waste-to-energy for medium-sized cities. Energy 2013, 55, 728–741. [Google Scholar] [CrossRef]
- Sahlin, J.; Ekvall, T.; Bisaillon, M. Introduction of a waste incineration tax: effects on the Swedish waste flows. Resour. Conserv. Recycl. 2007, 51, 827–846. [Google Scholar] [CrossRef]
- EC. European Commission, Cost-Benefit Analysis of the Different Municipal Solid Waste Management Systems: Objectives and Instruments for the Year 2000; Office for the Official Publications of the European Communities: Luxembourg, 1997. [Google Scholar]
- Hogg, D. Economic Analysis of Options for Managing Biodegradable Waste, Final Report to Directorate General Environment; Eunomia Research & Consulting Ltd.: Brussels, Belgium, 2002; Available online: http://ec.europa.eu/environment/waste/compost/pdf/econanalysis_appendices.pdf (accessed on 21 February 2019).
- Hogg, D. Costs for Municipal Waste Management in the EU, Final Report to Directorate General Environment; Eunomia Research & Consulting Ltd.: Brussels, Belgium, 2001; Available online: http://ec.europa.eu/environment/waste/studies/pdf/eucostwaste.pdf (accessed on 21 February 2019).
- EPA. Full Cost Accounting for Municipal Solid Waste Management: A Handbook; United States Environmental Protection Agency: Washington, DC, USA, 1997.
- Negri, M.; Rossi, A.D.; Fellin, M.; Macrì, G.; Russo, D.; Proto, A.R. Small Scale Plants for Energy Production: Environmental Impact of Biomasses Pyro-gasification. Procedia Soc. Behav. Sci. 2016, 223, 823–827. [Google Scholar] [CrossRef] [Green Version]
- Korai, M.S.; Mahar, R.B.; Uqaili, M.A. Optimization of waste to energy routes through biochemical and thermochemical treatment options of municipal solid waste in Hyderabad, Pakistan. Energy Convers. Manag. 2016, 124, 333–343. [Google Scholar] [CrossRef]
- Rajaeifar, M.A.; Tabatabaei, M.; Ghanavati, H.; Khoshnevisan, B.; Rafiee, S. Comparative life cycle assessment of different municipal solid waste management scenarios in Iran. Renew. Sustain. Energy Rev. 2015, 51, 886–898. [Google Scholar] [CrossRef]
- SPREP. Pacific Regional Solid Waste Management Strategy 2010–2015. 2010. Available online: https://www.sprep.org/attachments/Pacific_RSWMS_2010-2015.pdf (accessed on 12 December 2018).
- Kim, M.; Kim, J. Comparison through a LCA evaluation analysis of food waste disposal options from the perspective of global warming and resource recovery. Sci. Total Environ. 2010, 408, 3998–4006. [Google Scholar] [CrossRef] [PubMed]
- WCC. Waste Carbon Calculator for the University of Texas. 2016. Available online: https://utexas.app.box.com/v/wastecalculator (accessed on 22 December 2018).
- ISO. International Organization for Standardization. Specification with Guidance at the Organization Level for Quantification and Reporting of Greenhouse Gas Emissions and Removals 2006 ISO; 14064–Part 1. 2006. Available online: http://www.iso.org/iso/catalogue_detail?csnumber=38381 (accessed on 21 September 2018).
- ISO. International Organization for Standardization. Specification with Guidance at the Project Level for Quantification, Monitoring and Reporting of Greenhouse Gas Emission Reductions or Removal Enhancements 2006 ISO2006 ISO; 14064–Part 2. 2006. Available online: http://www.iso.org/iso/home/store/catalogue_tc/catalogue_detail.htm?csnumber=38382 (accessed on 21 Septermber 2018).
- ISO. International Organization for Standardization. Specification with Guidance for the Validation and Verification of Greenhouse Gas Assertions 2006 ISO; 14064–Part 3. 2006. Available online: http://www.iso.org/iso/home/store/catalogue_tc/catalogue_detail.htm?csnumber=38700 (accessed on 22 September 2018).
- Figueira, J.; Salvatore, G.; Matthias, E. Multiple Criteria Decision Analysis: State of the Art Surveys; Springer Science + Business Media, Inc.: New York, NY, USA, 2005. [Google Scholar]
- Shanian, A.; Savadogo, O. A non-compensatory compromised solution for material selection of bipolar plates for polymer electrolyte membrane fuel cell (PEMFC) using ELECTRE IV. Electrochim. Acta 2006, 51, 5307. [Google Scholar] [CrossRef]
- Rangel, L.; Gomes, F.; Moreira, R. Decision theory with multiple criteria: An aplication of ELECTRE IV and TODIM to SEBRAE/RJ. Pesqui. Oper. 2009, 29, 577–590. [Google Scholar] [CrossRef]
- Saracoglu, B.O. An Experimental Research Study on the Solution of a Private Small Hydropower Plant Investments Selection Problem by ELECTRE III/IV, Shannon’s Entropy, and Saaty’s Subjective Criteria Weighting. Adv. Decis. Sci. 2015, 7. [Google Scholar] [CrossRef]
- Spyridi, D.; Vlachokostas, C.; Moussiopoulos, N.; Sioutas, C. Evaluation of Measures to Address Climate Change Using Multicriteria Analysis. In Proceedings of the 13th International Conference on Environmental Science and Technology (CEST), Divani Caravel Hotel, Athens, Greece, 5–7 September 2013. [Google Scholar]
- Botti, L.; Peypoch, N. Multi-criteria ELECTRE method and destination competitiveness. Tour. Manag. Perspect. 2013, 6, 108–113. [Google Scholar] [CrossRef]
- Doumpos, M.; Figueira, J.R. A multicriteria outranking approach for modeling corporate credit ratings: An application of the ELECTRE TRI-NC method. Omega-Int. J. Manag. Sci. 2018, 82, 166–180. [Google Scholar] [CrossRef]
- Figueira, J.; Bernard, R. Determining the weights of criteria in the Electre type methods with a revised simos’ procedure. Eur. J. Oper. Res. 2002, 139, 317–326. [Google Scholar] [CrossRef]
- Hokkanen, J.; Salminen, P.; Rossi, E.; Ettala, M. The Choice of a Solid Waste Management System by Using the ELECTRE II Decision-aid Method. Waste. Manag. Res. 1995, 13(2), 175–193. [Google Scholar] [CrossRef]
- Bian, J.M.; Bai, Q. Optimal Selection of Construction Schemes Based on Simplified ELECTRE. Adv. Mater. Res. 2013, 616, 332–337. [Google Scholar] [CrossRef]
- Comaniţă, E.; Ghinea, C.; Hlihor, R.; Simion, I.; Smaranda, C.; Favier, L.; Roşca, M.; Gostin, I.; Gavrilescu, M. Challenges and opportunities in green plastics: An assessment using the ELECTRE decision-aid method. Environ. Eng. Manag. 2015, 14, 689–702. [Google Scholar] [CrossRef]
- Ezeah, C.; Roberts, C.L. Analysis of barriers and success factors affecting the adoption of sustainable management of municipal solid waste in Nigeria. J. Environ. Manag. 2012, 103, 9–14. [Google Scholar] [CrossRef] [PubMed]
- Salim, C.J. Municipal solid waste management in Dar Es Salaam city, Tanzania. Waste Manag. 2010, 30, 1430–1431. [Google Scholar] [PubMed]
- Castrejón-Godínez, M.L.; Sánchez-Salinas, E.; Rodríguez, A.; Ortiz-Hernández, M.L. Analysis of Solid Waste Management and Greenhouse Gas Emissions in México: A Study Case in the Central Region. J. Environ. Prot. 2015, 6, 146. [Google Scholar] [CrossRef]
- UNDP. United Nations Development Programme: Sustainable Develoment Goals-2030; UN: Washington, DC, USA, 2015. [Google Scholar]
- Dong, J.; Chi, Y.; Zou, D.; Fu, C.; Huang, Q.; Ni, M. Comparison of municipal solid waste treatment technologies from a life cycle perspective in China. Waste Manag. Res. J. Int. Solid Wastes Public Clean. Assoc. Iswa 2014, 32, 13–23. [Google Scholar] [CrossRef] [PubMed]
- Tom, A.P.; Pawels, R.; Haridas, A. Biodrying process: A sustainable technology for treatment of municipal solid waste with high moisture content. Waste Manag. 2016, 49, 64–72. [Google Scholar] [CrossRef] [PubMed]
- Li, Z.S.; Lei, Y.; Qu, X.Y.; Sui, Y.M. Municipal solid waste management in Beijing City. Waste Manag. 2009, 29, 2596–2599. [Google Scholar] [PubMed]
- Salon, E.; Ranjithan, S.R.; Barlaz, M.A.; Brill, E.D. Life-Cycle-Based Solid Waste Management I: Model Development. J. Environ. Eng. 2002, 128, 981–992. [Google Scholar]
- Kalwani, J.D. Towards community participation in municipal solid waste management in Tanzania: A conceptual and policy discourse. Period.-Huria 2007, 7, 96–111. [Google Scholar]
- Sharma, R.; Sharma, M.; Sharma, R.; Sharma, V. The impact of incinerators on human health and environment. Rev. Environ. Health 2013, 28, 67–72. [Google Scholar] [CrossRef] [PubMed]
- Cordioli, M.; Vincenzi, S.; De Leo, G.A. Effects of heat recovery for district heating on waste incineration health impact: a simulation study in Northern Italy. Sci. Total Environ. 2013, 444, 369–380. [Google Scholar] [CrossRef] [PubMed]
- Allsopp, M.; Costner, P.; Johnston, P. Incineration and human health. Environ. Sci. Pollut. Res. 2001, 8, 141–145. [Google Scholar] [CrossRef]
- Yhdego, M. From a Sanitary Landfill to a Dump Site: Pugu Kinyamwezi Community Curse in Dar es Salaam, Tanzania; ERC—Environmental Resources Consultancy: Dar es Salaam, Tanzania, 2017. [Google Scholar]
- Mlozi, M.R.S. Urban Agriculture in Dar es Salaam: Its Contribution to Solving the Economic Crisis and the Damage it Does to the Environment. Dev. S. Afr. 1996, 13, 47–65. [Google Scholar] [CrossRef]
- Dongus, S.; Nyika, D.; Kannady, K.; Mtasiwa, D.; Mshinda, H.; Gosoniu, L.; Drescher, A.W.; Fillinger, U.; Tanner, M.; Killeen, G.F. Urban agriculture and Anopheles habitats in Dar es Salaam, Tanzania. Geospat. Health 2009, 3, 189. [Google Scholar] [CrossRef] [PubMed]
- Halloran, A.; Magid, J. The role of local government in promoting sustainable urban agriculture in Dar es Salaam and Copenhagen. Geogr. Tidsskr. 2013, 113, 121–132. [Google Scholar] [CrossRef]


| Waste Stream/Treatment Options | Organic: Kitchen Waste, Market Waste, Garden Waste | Plastic and Rubber: Film, Rigid, other Related Plastic Waste | Paper: Paper and Paperboard | Glass | Metal: Steel, Aluminum | Others: Tetrapacks, Diapers, Non-Ferrous Metal |
|---|---|---|---|---|---|---|
| 1: Composting | + | − | − | − | − | − |
| Windrow composting | ||||||
| Vermicomposting | ||||||
| 2: Recycling | − | + | + | + | + | − |
| 3: Incineration with energy recovery | − | + | + | − | − | + |
| 4: Pyro-gasification | + | − | − | − | − | − |
| Pyrolysis | ||||||
| Gasification | ||||||
| Anaerobic digestion | ||||||
| 5: Landfilling | + | + | + | + | − | + |
| Sanitary | ||||||
| Bioreactor |
| A: Economic Cost (USD/Metric Ton (MT)) | ||||||||
| Waste Stream\Treatment Option | Organic Waste | Plastic Waste | Paper Waste | Glass | Metal | Other Waste | Country of Use | Sources |
| 1: Composting Windrow composting Vermicomposting | 50.05 | - | - | - | - | - | Australia, China, USA, South Africa (SA), Kenya, Ethiopia | [64,65,66,67] |
| 2: Recycling | - | 101.02 | −45.20 | 20.50 | 18.56 | - | China, Canada, USA, Nigeria, Taiwan, Japan, Wales | [58,65,68,69] |
| 3: Incineration with energy recovery | - | 20.00 | 20.00 | - | - | 55.05 | India, China, England, Denmark, SA, Indonesia | [68,70,71,72,73] |
| 4: Pyro-gasification Pyrolysis Gasification Anaerobic digestion | 115.25 | - | - | - | - | - | China, Nepal, UK, USA, Italy, Japan, Korea, India Pakistan, Iran | [70,74,75,76,77,78,79,80] |
| 5: Landfilling Sanitary Bioreactor | 58.25 | 71.10 | 67.25 | 70.32 | - | 68.33 | Ethiopia, Morocco, USA, UK, Korea, China, Philippines | [64,65,68,72,75,77,81] |
| B: Environmental Cost (CO2/MT) | ||||||||
| Waste Stream\Treatment Option | Organic Waste | Plastic Waste | Paper Waste | Glass | Metal | Other Waste | Country of Use | Sources |
| 1: Composting Windrow composting Vermicomposting | 0.092 | - | - | - | - | - | National and international organizations, including the United Nation (UN) in numerous environmental assessment and management programs | [53,64,65,71,82,83,84,85,86] |
| 2: Recycling | - | −1.306 | –3.893 | −0.307 | –3.38 | - | ||
| 3: Incineration with energy recovery | - | 1.377 | –0.490 | - | 1.35 | |||
| 4: Pyro-gasification Pyrolysis Gasification Anaerobic digestion | −0.560 | - | - | - | - | - | ||
| 5: Landfilling Sanitary Bioreactor | 0.474 | 0.043 | 0.441 | 0.444 | - | 0.477 | ||
| Cost Level | EcC (USD/Day) | EnC (MT. CO2) Emissions/Day |
|---|---|---|
| Low | y = (210,000–240,000) | x ≤ −1000 |
| Medium | y = (250,000–280,000) | x = −999–0 |
| High | y = (290,000–300,000) | x = 1–360 |
| Year | Amount Generated | Organic (57.21%) | Plastic (13.08%) | Paper (6.12%) | Glass (2.32%) | Metal (1.02%) | Others (20.25%) | Total (100%) |
|---|---|---|---|---|---|---|---|---|
| 2006 | 3930 | 2248.35 | 514.04 | 240.52 | 91.18 | 40.09 | 795.83 | 3930.00 |
| 2007 | 4115 | 2354.19 | 538.24 | 251.84 | 95.47 | 41.97 | 833.29 | 4115.00 |
| 2008 | 4286 | 2452.02 | 560.61 | 262.30 | 99.44 | 43.72 | 867.92 | 4286.00 |
| 2009 | 4454 | 2548.13 | 582.58 | 272.58 | 103.33 | 45.43 | 901.94 | 4454.00 |
| 2010 | 4577 | 2618.50 | 598.67 | 280.11 | 106.19 | 46.69 | 926.84 | 4577.00 |
| 2011 | 4669 | 2671.13 | 610.71 | 285.74 | 108.32 | 47.62 | 945.47 | 4669.00 |
| 2012 | 4397 | 2515.52 | 575.13 | 269.10 | 102.01 | 44.85 | 890.39 | 4397.00 |
| 2013 | 4661 | 2666.56 | 609.66 | 285.25 | 108.14 | 47.54 | 943.85 | 4661.00 |
| 2014 | 4605 | 2634.52 | 602.33 | 281.83 | 106.84 | 46.97 | 932.51 | 4605.00 |
| 2015 | 4573 | 2616.21 | 598.15 | 279.87 | 106.09 | 46.64 | 926.03 | 4573.00 |
| 2016 | 4740 | 2711.75 | 619.99 | 290.09 | 109.97 | 48.35 | 959.85 | 4740.00 |
| 2017 | 5258 | 3008.10 | 687.75 | 321.79 | 121.99 | 53.63 | 1064.75 | 5258.00 |
| Total | 54,265 | 31,045.01 | 7097.86 | 3321.02 | 1258.95 | 553.50 | 10,988.66 | 54,265.00 |
| Scenario | Code | Scenario | Code | Scenario | Code | Scenario | Code | Scenario | Code | Scenario | Code |
|---|---|---|---|---|---|---|---|---|---|---|---|
| S1 | 122223 | S19 | 122225 | S37 | 422223 | S55 | 422225 | S73 | 522223 | S91 | 522225 |
| S2 | 132223 | S20 | 132225 | S38 | 432223 | S56 | 432225 | S74 | 532223 | S92 | 532225 |
| S3 | 152223 | S21 | 152225 | S39 | 452223 | S57 | 452225 | S75 | 552223 | S93 | 552225 |
| S4 | 122523 | S22 | 122525 | S40 | 422523 | S58 | 422525 | S76 | 522523 | S94 | 522525 |
| S5 | 132523 | S23 | 132525 | S41 | 432523 | S59 | 432525 | S77 | 532523 | S95 | 532525 |
| S6 | 152523 | S24 | 152525 | S42 | 452523 | S60 | 452525 | S78 | 552523 | S96 | 552525 |
| S7 | 123223 | S25 | 123225 | S43 | 423223 | S61 | 423225 | S79 | 523223 | S97 | 523225 |
| S8 | 133223 | S26 | 133225 | S44 | 433223 | S62 | 433225 | S80 | 533223 | S98 | 533225 |
| S9 | 153223 | S27 | 153225 | S45 | 453223 | S63 | 453225 | S81 | 553223 | S99 | 553225 |
| S10 | 123523 | S28 | 123525 | S46 | 423523 | S64 | 423525 | S82 | 523523 | S100 | 523525 |
| S11 | 133523 | S29 | 133525 | S47 | 433523 | S65 | 433525 | S83 | 533523 | S101 | 533525 |
| S12 | 153523 | S30 | 153525 | S48 | 453523 | S66 | 453525 | S84 | 553523 | S102 | 553525 |
| S13 | 125223 | S31 | 125225 | S49 | 425223 | S67 | 425225 | S85 | 525223 | S103 | 525225 |
| S14 | 135223 | S32 | 135225 | S50 | 435223 | S68 | 435225 | S86 | 535223 | S104 | 535225 |
| S15 | 155223 | S33 | 155225 | S51 | 455223 | S69 | 455225 | S87 | 555223 | S105 | 555225 |
| S16 | 125523 | S34 | 125525 | S52 | 425523 | S70 | 425525 | S88 | 525523 | S106 | 525525 |
| S17 | 135523 | S35 | 135525 | S53 | 435523 | S71 | 435525 | S89 | 535523 | S107 | 535525 |
| S18 | 155523 | S36 | 155525 | S54 | 455523 | S72 | 455525 | S90 | 555523 | S108 | 555525 |
| Scenario | Code | EcC (USD/Day) | EnC (CO2/Day) | Scenario | Code | EcC (USD/Day) | EnC (CO2/Day) | Scenario | Code | EcC (USD/Day) | EnC (CO2/Day) | Scenario | Code | EcC (USD/Day) | EnC (CO2/Day) |
|---|---|---|---|---|---|---|---|---|---|---|---|---|---|---|---|
| S80 | 533223 | 257,416.02 | 3433.89 | ||||||||||||
| S81 | 553223 | 292,560.05 | 2516.43 | ||||||||||||
| S26 | 133225 | 246,889.48 | 1355.27 | S53 | 435523 | 450,159.84 | 714.71 | S82 | 523523 | 311,649.82 | 1680.27 | ||||
| S27 | 153225 | 282,033.51 | 437.81 | S54 | 455523 | 485,303.86 | −202.75 | S83 | 533523 | 263,493.56 | 3525.50 | ||||
| S1 | 122223 | 259,925.15 | −655.49 | S28 | 123525 | 301,123.28 | −398.35 | S55 | 422225 | 470,193.15 | −3546.30 | S84 | 553523 | 298,637.59 | 2608.04 |
| S2 | 132223 | 211,768.89 | 1189.74 | S29 | 133525 | 252,967.02 | 1446.88 | S56 | 432225 | 422,036.89 | −1701.07 | S85 | 525223 | 320,776.85 | 1888.24 |
| S3 | 152223 | 246,912.92 | 272.28 | S30 | 153525 | 288,111.05 | 529.42 | S57 | 452225 | 457,180.92 | −2618.53 | S86 | 535223 | 272,620.60 | 3733.47 |
| S4 | 122523 | 266,002.69 | −563.88 | S31 | 125225 | 310,250.31 | −190.38 | S58 | 422525 | 476,270.69 | −3454.69 | S87 | 555223 | 307,764.62 | 2816.01 |
| S5 | 132523 | 217,846.43 | 1281.36 | S32 | 135225 | 262,094.06 | 1654.85 | S59 | 432525 | 428,114.43 | −1609.45 | S88 | 525523 | 326,854.39 | 1979.85 |
| S6 | 152523 | 252,990.46 | 363.90 | S33 | 155225 | 297,238.08 | 737.39 | S60 | 452525 | 463,258.46 | −2526.91 | S89 | 535523 | 278,698.14 | 3825.09 |
| S7 | 123223 | 280,905.86 | 439.56 | S34 | 125525 | 316,327.85 | −98.77 | S61 | 423225 | 491,173.86 | −2451.25 | S90 | 555523 | 313,842.16 | 2907.63 |
| S8 | 133223 | 232,749.60 | 2284.79 | S35 | 135525 | 268,171.60 | 1746.47 | S62 | 433225 | 443,017.60 | −606.02 | S91 | 522225 | 298,731.45 | −435.93 |
| S9 | 153223 | 267,893.63 | 1367.33 | S36 | 155525 | 303,315.62 | 829.01 | S63 | 453225 | 478,161.63 | −1523.47 | S92 | 532225 | 250,575.19 | 1409.31 |
| S10 | 123523 | 286,983.40 | 531.17 | S37 | 422223 | 456,053.27 | −2616.77 | S64 | 423525 | 497,251.40 | −2359.63 | S93 | 552225 | 285,719.22 | 491.85 |
| S11 | 133523 | 238,827.14 | 2376.41 | S38 | 432223 | 407,897.01 | −771.54 | S65 | 433525 | 449,095.14 | −514.40 | S94 | 522525 | 304,808.99 | −344.31 |
| S12 | 153523 | 273,971.17 | 1458.95 | S39 | 452223 | 443,041.04 | −1689.00 | S66 | 453525 | 484,239.17 | −1431.86 | S95 | 532525 | 256,652.73 | 1500.92 |
| S13 | 125223 | 296,110.43 | 739.15 | S40 | 422523 | 462,130.81 | −2525.16 | S67 | 425225 | 506,378.43 | −2151.66 | S96 | 552525 | 291,796.76 | 583.46 |
| S14 | 135223 | 247,954.18 | 2584.38 | S41 | 432523 | 413,974.55 | −679.93 | S68 | 435225 | 458,222.18 | −306.43 | S97 | 523225 | 319,712.16 | 659.13 |
| S15 | 155223 | 283,098.20 | 1666.92 | S42 | 452523 | 449,118.58 | −1597.38 | S69 | 455225 | 493,366.20 | −1223.89 | S98 | 533225 | 271,555.90 | 2504.36 |
| S16 | 125523 | 302,187.97 | 830.76 | S43 | 423223 | 477,033.98 | −1521.72 | S70 | 425525 | 512,455.97 | −2060.05 | S99 | 553225 | 306,699.93 | 1586.90 |
| S17 | 135523 | 254,031.72 | 2675.99 | S44 | 433223 | 428,877.72 | 323.51 | S71 | 435525 | 464,299.72 | −214.81 | S100 | 523525 | 325,789.70 | 750.74 |
| S18 | 155523 | 289,175.74 | 1758.53 | S45 | 453223 | 464,021.75 | −593.95 | S72 | 455525 | 499,443.74 | −1132.27 | S101 | 533525 | 277,633.44 | 2595.97 |
| S19 | 122225 | 274,065.03 | −1585.02 | S46 | 423523 | 483,111.52 | −1430.11 | S73 | 522223 | 284,591.57 | 493.60 | S102 | 553525 | 312,777.47 | 1678.52 |
| S20 | 132225 | 225,908.77 | 260.21 | S47 | 433523 | 434,955.26 | 415.13 | S74 | 532223 | 236,435.31 | 2338.83 | S103 | 525225 | 334,916.73 | 958.71 |
| S21 | 152225 | 261,052.80 | −657.24 | S48 | 453523 | 470,099.29 | −502.33 | S75 | 552223 | 271,579.34 | 1421.38 | S104 | 535225 | 286,760.48 | 2803.95 |
| S22 | 122525 | 280,142.57 | −1493.40 | S49 | 425223 | 492,238.55 | −1222.14 | S76 | 522523 | 290,669.11 | 585.22 | S105 | 555225 | 321,904.50 | 1886.49 |
| S23 | 132525 | 231,986.31 | 351.83 | S50 | 435223 | 444,082.30 | 623.10 | S77 | 532523 | 242,512.85 | 2430.45 | S106 | 525525 | 340,994.27 | 1050.33 |
| S24 | 152525 | 267,130.34 | −565.63 | S51 | 455223 | 479,226.32 | −294.36 | S78 | 552523 | 277,656.88 | 1512.99 | S107 | 535525 | 292,838.02 | 2895.56 |
| S25 | 123225 | 295,045.74 | −489.97 | S52 | 425523 | 498,316.09 | −1130.52 | S79 | 523223 | 305,572.28 | 1588.65 | S108 | 555525 | 327,982.04 | 1978.10 |
| Scenario | Code | Economic Cost (USD/Day) | Environmental Cost (CO2 Emission; MT/Day) |
|---|---|---|---|
| S19 | 122225 | 274,065.03 | −1585.02 |
| S22 | 122525 | 280,142.57 | −1493.40 |
| S21 | 152225 | 261,052.80 | −657.24 |
| S1 | 122223 | 259,925.15 | −655.49 |
| S24 | 152525 | 267,130.34 | −565.63 |
| S4 | 122523 | 266,002.69 | −563.88 |
| S25 | 123225 | 295,045.74 | −489.97 |
| S91 | 522225 | 298,731.45 | −435.93 |
| S20 | 132225 | 225,908.77 | 260.21 |
| S3 | 152223 | 246,912.92 | 272.28 |
| S23 | 132525 | 231,986.31 | 351.83 |
| Group | EcC | EnC | Scenarios | Representative Scenario (Scenario with Least EnC) |
|---|---|---|---|---|
| Most favorable | Low/Medium | Low | S19, S22 | S19 |
| Favorable | Medium | Low/Medium | S21, S1, S24, S4 | S21 |
| Less favorable | High | Low/Medium | S25, S91 | S25 |
| Intermediate | Low | High | S20, S3, S23 | S20 |
© 2019 by the authors. Licensee MDPI, Basel, Switzerland. This article is an open access article distributed under the terms and conditions of the Creative Commons Attribution (CC BY) license (http://creativecommons.org/licenses/by/4.0/).
Share and Cite
Kazuva, E.; Zhang, J. Analyzing Municipal Solid Waste Treatment Scenarios in Rapidly Urbanizing Cities in Developing Countries: The Case of Dar es Salaam, Tanzania. Int. J. Environ. Res. Public Health 2019, 16, 2035. https://0-doi-org.brum.beds.ac.uk/10.3390/ijerph16112035
Kazuva E, Zhang J. Analyzing Municipal Solid Waste Treatment Scenarios in Rapidly Urbanizing Cities in Developing Countries: The Case of Dar es Salaam, Tanzania. International Journal of Environmental Research and Public Health. 2019; 16(11):2035. https://0-doi-org.brum.beds.ac.uk/10.3390/ijerph16112035
Chicago/Turabian StyleKazuva, Emmanuel, and Jiquan Zhang. 2019. "Analyzing Municipal Solid Waste Treatment Scenarios in Rapidly Urbanizing Cities in Developing Countries: The Case of Dar es Salaam, Tanzania" International Journal of Environmental Research and Public Health 16, no. 11: 2035. https://0-doi-org.brum.beds.ac.uk/10.3390/ijerph16112035