Anthropometric Profile of Soccer Players as a Determinant of Position Specificity and Methodological Issues of Body Composition Estimation

 ,
,  , , ,
, , , 
 and
and 
Abstract
:1. Introduction
2. Materials and Methods
2.1. Participants
2.2. Anthropometric Procedures
2.3. Statistical Analysis
3. Results
4. Discussion
Limitations
5. Conclusions
Author Contributions
Funding
Acknowledgments
Conflicts of Interest
References
- Sutton, L.; Scott, M.; Wallace, J.; Reilly, T. Body composition of English Premier League soccer players: Influence of playing position, international status, and ethnicity. J. Sports Sci. 2009, 27, 1019–1026. [Google Scholar] [CrossRef]
- Lukaski, H.C. Body Composition: Health and Performance in Exercise and Sport, 1st ed.; Taylor & Francis Group: London, UK, 2017; p. 401. [Google Scholar]
- Gall, F.L.; Beillot, J.; Rochcongar, P. Évolution de la puissance maximale anaérobie au cours de la croissance chez le footballeur. Sci. Sports 2002, 1597, 177–188. [Google Scholar] [CrossRef]
- Manna, I.; Khanna, G.L.; Dhara, P.C. Effect of Training on Physiological and Biochemical Variables of Soccer Players of Different Age Groups. Asian J. Sports Med. 2010, 1, 5–22. [Google Scholar] [CrossRef] [Green Version]
- Lago-Peñas, C.; Casais, L.; Dellal, A.; Rey, E.; Dominguez, E. Anthropometric and Physiological Characteristics of Young Soccer Players according To Their Playing Position: Relevance for Competition Sucess. J. Strength Cond. Res. 2011, 25, 3358–3367. [Google Scholar] [CrossRef]
- Nikolaidis, P.T.; Ruano, M.A.G.; Oliveira NCDe Portes, L.A.; Freiwald, J.; Leprêtre, P.M.; Knechtle, B. Who runs the fastest ? Anthropometric and physiological correlates of 20 m sprint performance in male soccer players. Res. Sports Med. 2016, 24, 341–351. [Google Scholar] [CrossRef]
- Carling, C.; Orhant, E. Variation in body composition in professional soccer players: Interseasonal and intraseasonal changes and the effects of exposure time and player position. J. Strength Cond. Res. 2010, 24, 1332–1339. [Google Scholar] [CrossRef]
- Milanese, C.; Cavedon, V.; Corradini, G.; De Vita, F.; Zancanaro, C. Seasonal DXA-measured body composition changes in professional male soccer players. J. Sport Sci. 2015, 33, 1219–1228. [Google Scholar] [CrossRef]
- Santos, D.A.; Dawson, J.A.; Matias, C.N.; Rocha, P.M.; Allison, D.B. Reference Values for Body Composition and Anthropometric Measurements in Athletes. PLoS ONE 2014, 9, e97846. [Google Scholar] [CrossRef]
- Ackland, T.R.; Lohman, T.G.; Sundgot-Borgen, J.; Maughan, R.J.; Meyer, N.L.; Stewart, A.D.; Müller, W. Current status of body composition assessment in sport: Review and position statement on behalf of the Ad Hoc research working group on body composition health and performance, under the auspices of the I.O.C. medical commission. Sports Med. 2012, 42, 227–249. [Google Scholar] [CrossRef]
- Meyer, N.L.; Sundgot-borgen, J.; Lohman, T.G.; Ackland, T.R.; Stewart, A.D.; Maughan, R.J.; Smith, S.; Müller, W. Body composition for health and performance: A survey of body composition assessment practice carried out by the Ad Hoc Research Working Group on Body Composition, Health and Performance under the auspices of the IOC Medical Commission. Br. J. Sports Med. 2013, 47, 1044–1053. [Google Scholar] [CrossRef]
- Leão, C.; Simões, M.; Silva, B.; Clemente, F.; Bezerra, P.; Camões, M. Body Composition Evaluation Issue among Young Elite Football Players: DXA Assessment. Sports 2017, 5, 17. [Google Scholar] [CrossRef]
- Reilly, T.; George, K.; Marfell-Jones, M.; Scott, M.; Sutton, L.; Wallace, J.A. How well do skinfold equations predict percent body fat in elite soccer players? Int. J. Sports Med. 2009, 30, 607–613. [Google Scholar] [CrossRef]
- Evans, E.M.; Rowe, D.A.; Misic, M.M.; Prior, B.M.; Arngrímsson, S.Á. Skinfold prediction equation for athletes developed using a four-component model. Med. Sci. Sports Exerc. 2005, 37, 2006–2011. [Google Scholar] [CrossRef]
- World Medical Association. WMA Declaration of Helsinki—Ethical Principles for Medical Research Involving Human Subjects; WMA: Ferney-Voltaire, France, 1964; pp. 1–8. [Google Scholar]
- Pařízková, J. Body Fat and Physical Fitness; Springer Science & Business Media: Berlin, Germany, 1977; p. 280. [Google Scholar]
- Canhadas, I.L.; Silva, R.L.P.; Chaves, C.R.; Portes, L.A. Características antropométricas e de aptidão física de meninos atletas de futebol. Rev. Bras. Cineantropometria Desempenho Hum. 2010, 12, 239–245. [Google Scholar]
- Nikolaidis, P.T.; Karydis, N.V. Physique and body composition in soccer players across adolescence. Asian J. Sports Med. 2011, 2, 75–82. [Google Scholar] [CrossRef]
- Gil, S.; Ruiz, F.; Irazusta, A.; Gil, J.; Irazusta, J. Selection of young soccer players in terms of anthropometric and physiological factors. J. Sports Med. Phys. Fit. 2007, 47, 25–32. [Google Scholar]
- Arnason, A.; Sigurdsson, S.B.; Gudmundsson, A.; Holme, I.; Engebretsen, L.; Bahr, R. Physical Fitness, Injuries, and Team Performance in Soccer. Med. Sci. Sports Exerc. 2004, 36, 278–285. [Google Scholar] [CrossRef]
- Carling, C.; Le Gall, F.; Malina, R.M. Body size, skeletal maturity, and functional characteristics of elite academy soccer players on entry between 1992 and 2003. J. Sports Sci. 2012, 30, 1683–1693. [Google Scholar] [CrossRef]
- Davis, J.A.; Brewer, J.; Atkin, D. Pre-season physiological characteristics of English first and second division soccer players. J. Sports Sci. 1992, 10, 541–547. [Google Scholar] [CrossRef]
- Dellal, A.; Lago-Peñas, C.; Rey, E.; Chamari, K.; Orhant, E. The effects of a congested fixture period on physical performance, technical activity and injury rate during matches in a professional soccer team. Br. J. Sports Med. 2015, 49, 390–394. [Google Scholar] [CrossRef]
- Malina, R.M.; Reyes, M.E.P.; Eisenmann, J.C.; Horta, L.; Rodrigues, J.; Miller, R. Height, mass and skeletal maturity of elite Portuguese soccer players aged 11–16 years. J. Sports Sci. 2000, 18, 685–693. [Google Scholar] [CrossRef]
- Rico-Sanz, J. Body Composition and Nutritional assessments in Soccer. Int. J. Sport Nutr. 1998, 8, 113–123. [Google Scholar] [CrossRef]
- Towlson, C.; Cobley, S.; Midgley, A.W.; Garret, A.; Parkin, G.; Lovell, R. Relative Age, Maturation and Physical Biases on Position Allocation in Elite-Youth Soccer. Int. J. Sports Med. 2017, 38, 201–209. [Google Scholar] [CrossRef] [Green Version]
- Lago-Peñas, C.; Rey, E.; Casáis, L.; Gómez-López, M. Relationship between performance characteristics and the selection process in youth soccer players. J. Hum. Kinet. 2014, 40, 189–199. [Google Scholar] [CrossRef]
- Wittich, A.; Oliveri, M.B.; Rotemberg, E.; Mautalen, C. Body composition of professional football (soccer) players determined by dual X-ray absorptiometry. J. Clin. Densitom. 2001, 4, 51–55. [Google Scholar] [CrossRef]
- Deprez, D.; Fransen, J.; Lenoir, M.; Philippaerts, R.M.; Vaeyens, R. A retrospective study on anthropometrical, physical fitness, and motor coordination characteristics that influence dropout, contract status, and first-team playing time in high-level soccer players aged eight to eighteen years. J. Strength Cond. Res. 2015, 29, 1692–1704. [Google Scholar] [CrossRef]
- Le Gall, F.; Carling, C.; Williams, M.; Reilly, T. Anthropometric and fitness characteristics of international, professional and amateur male graduate soccer players from an elite youth academy. J. Sci. Med. Sport 2010, 13, 90–95. [Google Scholar] [CrossRef]
- Bunc, V.; Psotta, R. Physiological profile of very young soccer players. / Profil physiologique de tres jeunes joueurs de football. J. Sports Med. Phys. Fit. 2001, 41, 337–341. [Google Scholar]
- Figueiredo, A.J.; Goncalves, C.E.; Coehlo ESilvea, M.J.; Malina, R.M. Characteristics of youth soccer players who drop out, persist or move up. J. Sports Sci. 2009, 27, 883–891. [Google Scholar] [CrossRef] [Green Version]
- Vaeyens, R.; Malina, R.M.; Janssens, M.; Van Renterghem, B.; Bourgois, J.; Vrijens, J.; Philippaerts, R.M. A multidisciplinary selection model for youth soccer: The Ghent Youth Soccer Project. Br. J. Sports Med. 2006, 40, 928–934. [Google Scholar] [CrossRef]
- Reilly, T.; Bangsbo, J.; Franks, A. Anthropometric and physiological predispositions for elite soccer. J. Sports Sci. 2000, 18, 669–683. [Google Scholar] [CrossRef]
- Ziv, G.; Lidor, R. Physical characteristics, physiological attributes, and on-field performances of soccer goalkeepers. Int. J. Sports Physiol. Perform. 2011, 6, 509–524. [Google Scholar] [CrossRef]
- Milsom, J.; Naughton, R.; O’Boyle, A.; Iqbal, Z.; Morgans, R.; Drust, B.; Morton, J.P. Body composition assessment of English Premier League soccer players: A comparative DXA analysis of first team, U21 and U18 squads. J. Sports Sci. 2015, 33, 1799–1806. [Google Scholar] [CrossRef]
- Di Salvo, V.; Baron, R.; Tschan, H.; Calderon Montero, F.J.; Bachl, N.; Pigozzi, F. Performance characteristics according to playing position in elite soccer. Int. J. Sports Med. 2007, 28, 222–227. [Google Scholar] [CrossRef]
- Bloomfield, J.; Polman, R.; O’Donoghue, P. Physical demands of different positions in FA Premier League soccer. J. Sports Sci. Med. 2007, 6, 63–70. [Google Scholar]
- Stewart, A.; Marfell-Jones, M. International Standards for Anthropometric Assessment; International Society for the Advancement of Kinanthropometry: Underdale, Australia, 2011; p. 125. [Google Scholar]
- Zemski, A.J.; Broad, E.; Slater, G. Skinfold Prediction Equations Fail to Provide an Accurate Estimate of Body Composition in Elite Rugby Union Athletes of Caucasian and Polynesian Ethnicity. Int. J. Sport Nutr. Exerc. Metab. 2017, 28, 90–99. [Google Scholar] [CrossRef]
- Aragon, A.A.; Schoenfeld, B.J.; Wildman, R.; Kleiner, S.; VanDusseldorp, T.; Taylor, L.; Earnest, C.P.; Arciero, P.J.; Wilborn, C.; Kalman, D.S.; et al. International society of sports nutrition position stand: Diets and body composition. J. Int. Soc. Sports Nutr. 2017, 14, 16. [Google Scholar] [CrossRef]
- Silva, A.M.; Fields, D.A.; Quitério, A.L.; Sardinha, L.B. Are skinfold-based models accurate and suitable for assessing changes in body composition in highly trained athletes? J. Strength Cond. Res. 2009, 23, 1688–1696. [Google Scholar] [CrossRef]
- Rodriguez, G.; Moreno, L.A.; Blay, M.G.; Blay, V.A.; Fleta, J.; Sarrı, A.; Bueno, M.; AVENA-Zaragoza Study Group. Body fat measurement in adolescents: Comparison of skinfold thickness equations with dual-energy X-ray absorptiometry. Eur. J. Clin. Nutr. 2005, 59, 1158–1166. [Google Scholar]


| Age Group (Years old) | n (%) | Playing Position | n (%) |
|---|---|---|---|
| 12–14 | 97 (15.7%) | Goalkeeper (GK) | 63 (10.2%) |
| 14–16 | 155 (25.1%) | Defender | 237 (38.3%) |
| 16–18 | 126 (20.4%) | Midfielder | 232 (37.5%) |
| 18–37 | 240 (38.8%) | Forward | 86 (13.9%) |
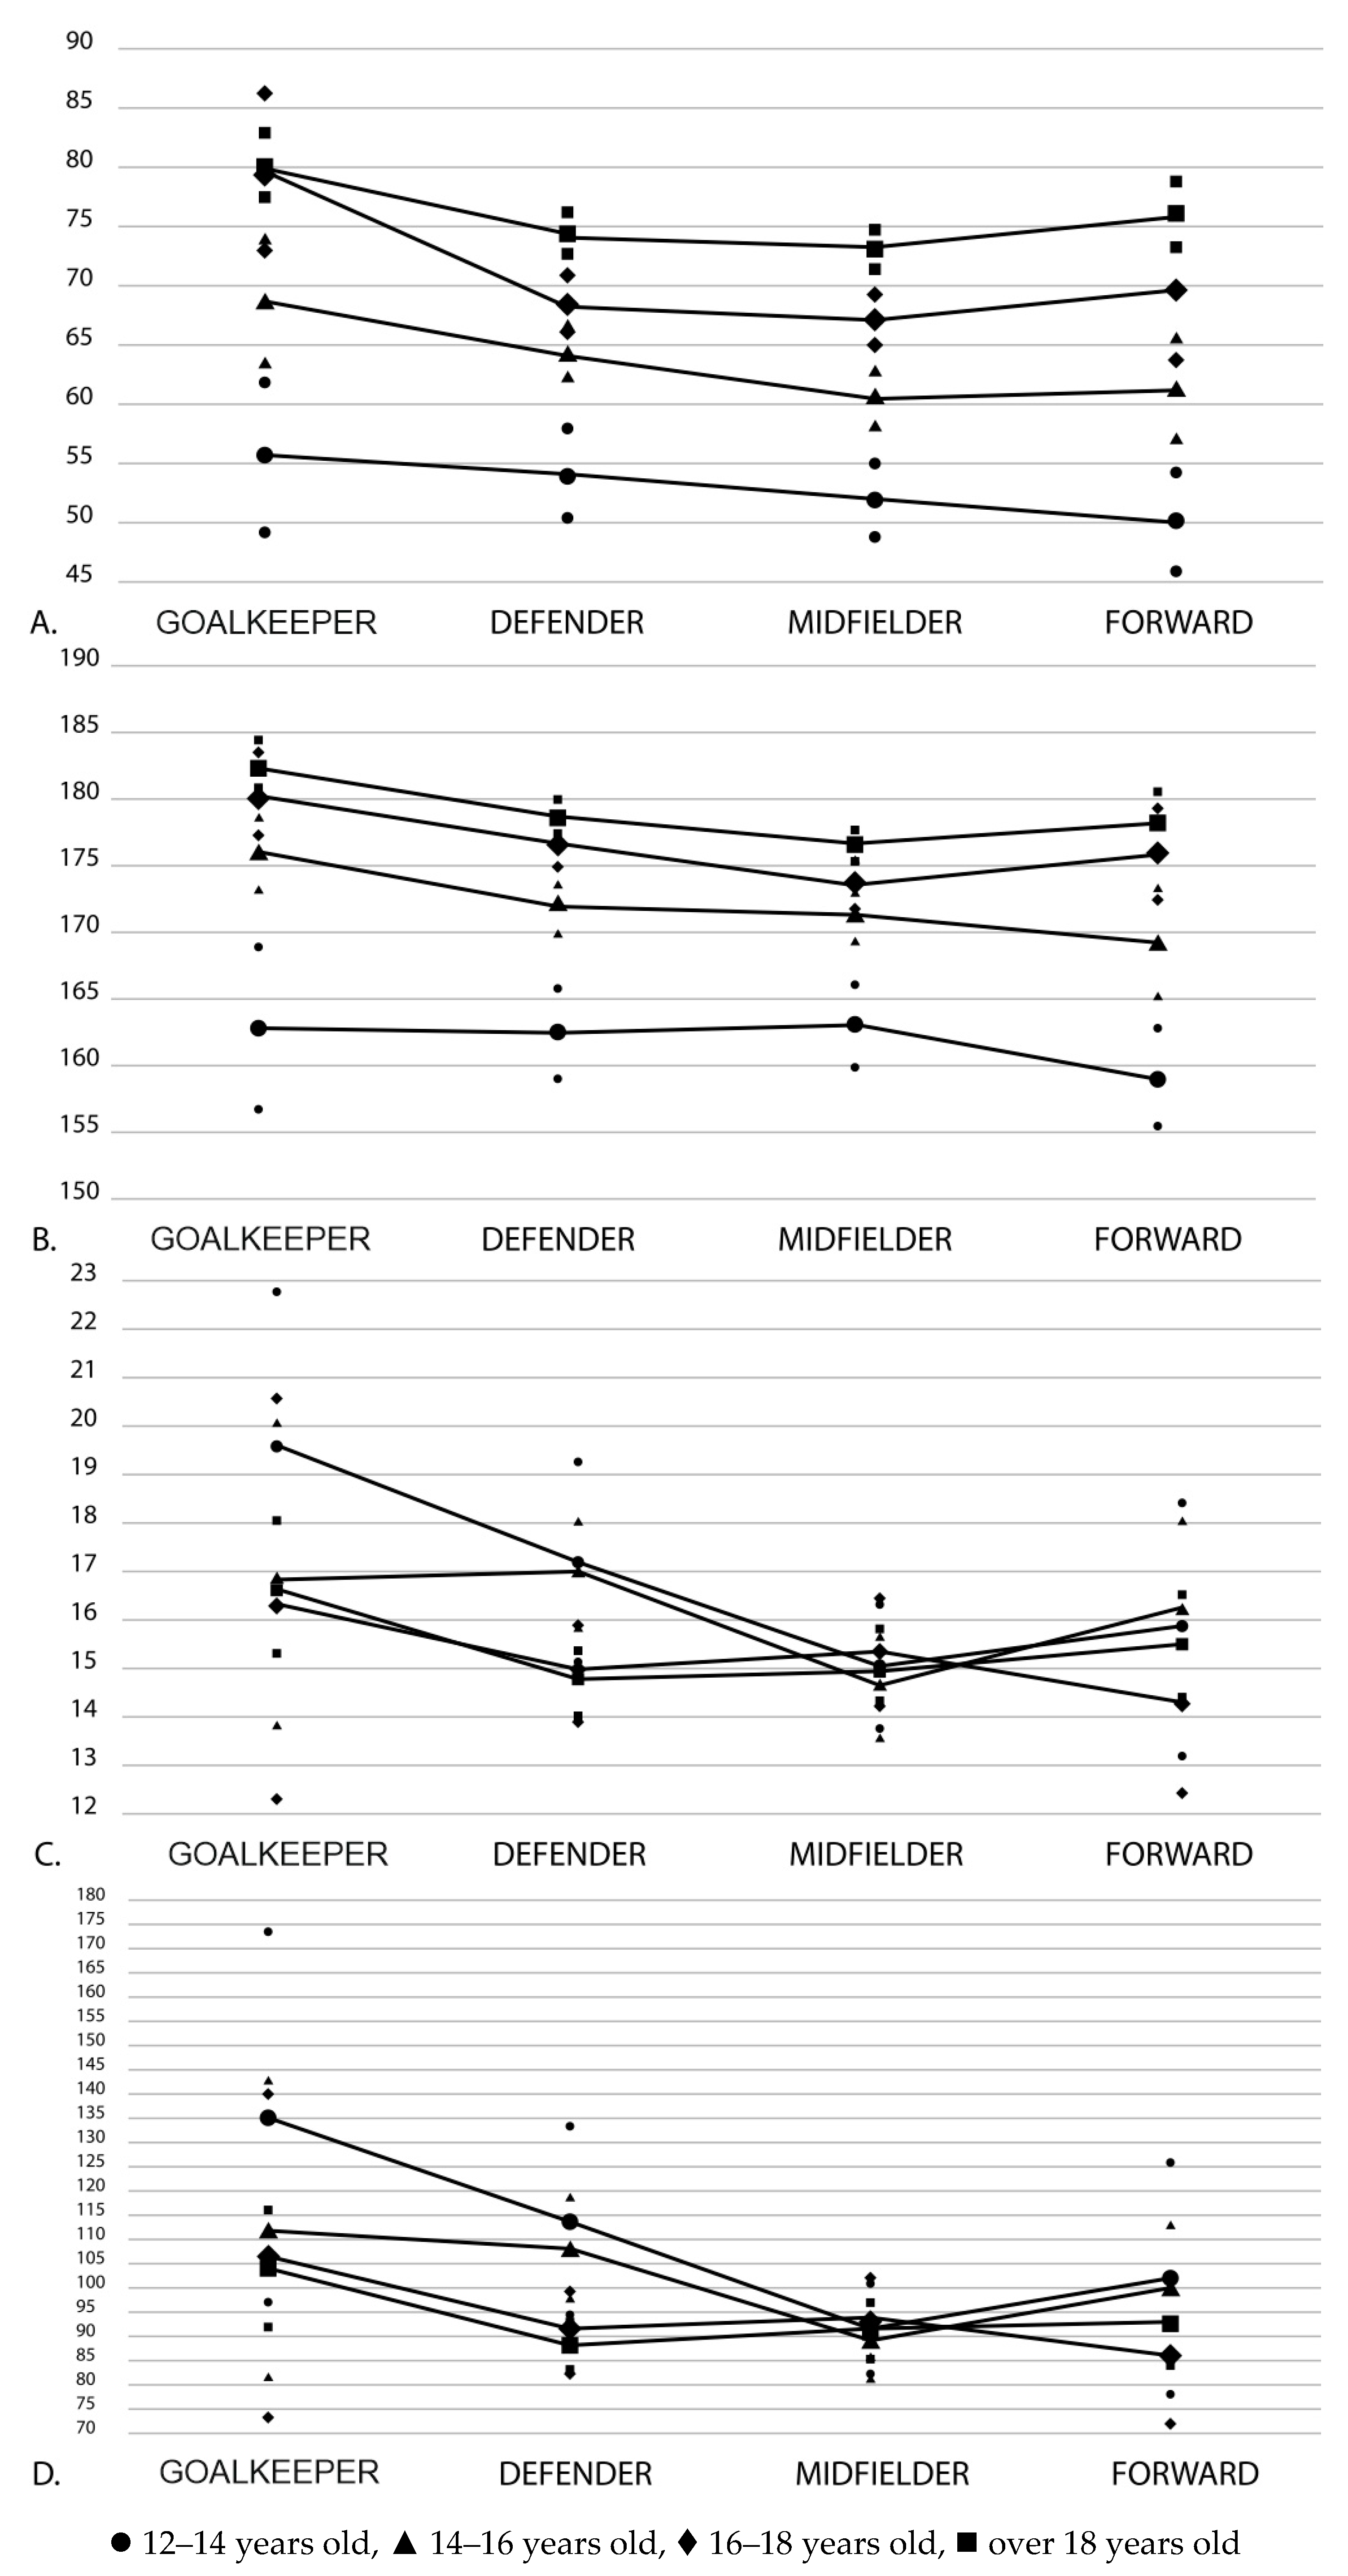
| Age Group (years) | Position | Weight (kg) | p | Height (cm) | p | Body fat (%) | p | Ʃ SKF (mm) | p |
|---|---|---|---|---|---|---|---|---|---|
| 12–14 years | Goalkeeper | 55.71 ± 9.27 | 0.376 | 162.96 ± 8.98 | 0.455 | 19.61 ± 4.83 | 0.033 | 135.76 ± 57.72 | 0.23 |
| Defender | 54.04 ± 10.14 | 162.50 ± 9.03 | 17.14 ± 5.42 | 114.19 ± 51.96 | |||||
| Midfielder | 52.00 ± 9.06 | 163.10 ± 9.25 | 15.07 ± 3.61 | 91.94 ± 26.69 | |||||
| Forward | 50.33 ± 8.95 | 159.23 ± 7.54 | 15.74 ± 5.42 | 102.21 ± 49.25 | |||||
| 14–16 years | Goalkeeper | 68.78 ± 8.99 | 0.006 | 176.27 ± 5.44 | 0.052 | 16.91 ± 5.46 | 0.013 | 111.73 ± 52.44 | 0.018 |
| Defender | 64.51 ± 8.12 | 172.10 ± 7.37 | 16.99 ± 4.16 | 108.78 ± 39.55 | |||||
| Midfielder | 60.66 ± 9.51 | 171.29 ± 6.97 | 14.64 ± 3.77 | 89.33 ± 30.17 | |||||
| Forward | 61.34 ± 8.27 | 169.37 ± 7.91 | 16.13 ± 3.60 | 99.58 ± 26.55 | |||||
| 16–18 years | Goalkeeper | 79.76 ± 8.23 | 0.001 | 180.41 ± 4.20 | 0.007 | 16.42 ± 5.48 | 0.516 | 106.56 ± 43.28 | 0.400 |
| Defender | 68.44 ± 8.61 | 176.90 ± 6.09 | 14.92 ± 3.83 | 91.42 ± 30.35 | |||||
| Midfielder | 67.17 ± 7.13 | 173.69 ± 6.19 | 15.34 ± 3.63 | 94.01 ± 28.34 | |||||
| Forward | 69.80 ± 11.67 | 176.02 ± 6.36 | 14.18 ± 3.63 | 85.72 ± 27.34 | |||||
| Over 18 years | Goalkeeper | 80.10 ± 7.11 | 0.000 | 182.69 ± 4.32 | 0.000 | 16.69 ± 3.59 | 0.044 | 104.36 ± 30.33 | 0.041 |
| Defender | 74.50 ± 7.54 | 178.86 ± 6.33 | 14.69 ± 3.21 | 88.46 ± 23.04 | |||||
| Midfielder | 73.39 ± 6.87 | 176.70 ± 6.01 | 15.01 ± 3.44 | 91.39 ± 27.69 | |||||
| Forward | 76.10 ± 8.53 | 178.31 ± 6.45 | 15.35 ± 3.06 | 92.97 ± 24.04 |
| Position | %BF Pařízková (%) | %BF Reilly (%) | p | Cohen d |
| Forward | 15.35 ± 3.06 | 10.66 ± 1.43 | <0.001 | 1.9754 |
| Midfielder | 15.01 ± 3.44 | 10.73 ± 1.85 | <0.001 | 1.5576 |
| Defender | 14.69 ± 3.21 | 10.52 ± 1.46 | <0.001 | 1.6826 |
| GK | 16.69 ± 3.59 | 11.51 ± 1.80 | <0.001 | 1.8343 |
| Position | %BF Pařízková (%) | %BF Evans (%) | p | Cohen d |
| Forward | 15.35 ± 3.06 | 10.12 ± 2.29 | <0.001 | 1.9403 |
| Midfielder | 15.01 ± 3.44 | 10.09 ± 2.54 | <0.001 | 1.8737 |
| Defender | 14.69 ± 3.21 | 9.82 ± 1.97 | <0.001 | 2.1572 |
| GK | 16.69 ± 3.59 | 11.18 ± 2.43 | <0.001 | 1.5124 |
| Position | Pařízková–Reilly | Pařízková–Evans | Reilly–Evans (%) |
|---|---|---|---|
| Forward | 4.69 ± 1.84 | 5.28 ± 1.55 | 0.59 ± 0.71 |
| Midfielder | 4.29 ± 1.79 | 4.92 ± 1.35 | 0.64 ± 0.74 |
| Defender | 4.17 ± 1.91 | 4.87 ± 1.56 | 0.70 ± 0.58 |
| GK | 5.18 ± 1.99 | 5.51 ± 1.46 | 0.33 ± 0.71 |
© 2019 by the authors. Licensee MDPI, Basel, Switzerland. This article is an open access article distributed under the terms and conditions of the Creative Commons Attribution (CC BY) license (http://creativecommons.org/licenses/by/4.0/).
Share and Cite
Leão, C.; Camões, M.; Clemente, F.M.; Nikolaidis, P.T.; Lima, R.; Bezerra, P.; Rosemann, T.; Knechtle, B. Anthropometric Profile of Soccer Players as a Determinant of Position Specificity and Methodological Issues of Body Composition Estimation. Int. J. Environ. Res. Public Health 2019, 16, 2386. https://0-doi-org.brum.beds.ac.uk/10.3390/ijerph16132386
Leão C, Camões M, Clemente FM, Nikolaidis PT, Lima R, Bezerra P, Rosemann T, Knechtle B. Anthropometric Profile of Soccer Players as a Determinant of Position Specificity and Methodological Issues of Body Composition Estimation. International Journal of Environmental Research and Public Health. 2019; 16(13):2386. https://0-doi-org.brum.beds.ac.uk/10.3390/ijerph16132386
Chicago/Turabian StyleLeão, César, Miguel Camões, Filipe Manuel Clemente, Pantelis Theo Nikolaidis, Ricardo Lima, Pedro Bezerra, Thomas Rosemann, and Beat Knechtle. 2019. "Anthropometric Profile of Soccer Players as a Determinant of Position Specificity and Methodological Issues of Body Composition Estimation" International Journal of Environmental Research and Public Health 16, no. 13: 2386. https://0-doi-org.brum.beds.ac.uk/10.3390/ijerph16132386