Article

ATR–FTIR Spectral Analysis and Soluble Components of PM10 And PM2.5 Particulate Matter over the Urban Area of Palermo (Italy) during Normal Days and Saharan Events

1
Dipartimento Scienze della Terra e del Mare (DiSTeM), Via Archirafi 22, 90123 Palermo, Italy
2
Risorse Ambiente Palermo (RAP), Piazzetta B. Cairoli, 90123 Palermo, Italy
3
CNRS/INSU-Université d’Orléans—BRGM, UMR 7327, Institut des Sciences de la Terre d’Orléans, 1A rue de la Férollerie, 45071 Orléans, France
*
Author to whom correspondence should be addressed.
Int. J. Environ. Res. Public Health 2019, 16(14), 2507; https://0-doi-org.brum.beds.ac.uk/10.3390/ijerph16142507
Submission received: 7 May 2019 / Revised: 17 June 2019 / Accepted: 26 June 2019 / Published: 13 July 2019
(This article belongs to the Collection Environmental Risk Assessment)

Abstract

:
Several epidemiological studies have shown a close relationship between the mass of particulate matter (PM) and its effects on human health. This study reports the identification of inorganic and organic components by attenuated total reflectance-Fourier-transform infrared spectroscopy (ATR-FTIR) analysis in PM10 and PM2.5 filters collected from three air quality monitoring stations in the city of Palermo (Sicily, Italy) during non-Saharan dust events and Saharan events. It also provides information on the abundance and types of water-soluble species. ATR-FTIR analysis identified sulfate, ammonium, nitrate, and carbonate matter characterized by vibrational frequencies at 603, 615, 670, and 1100 cm–1 (SO42–); at 1414 cm–1 (NH4+); at 825 and 1356 cm–1 (NO3); and at 713, 730, and 877 cm–1 (CO32–) in PM10 and PM2.5 filters. Moreover, aliphatic hydrocarbons were identified in the collected spectra. Stretching frequencies at 2950 cm–1 were assigned to CH3 aliphatic carbon stretching absorptions, while frequencies at 2924 and 2850 cm–1 indicated CH2 bonds. In filters collected during Saharan dust events, the analysis also showed the presence of absorbance peaks typical of clay minerals. The measurement of soluble components confirmed the presence of a geogenic component (marine spray and local rocks) and secondary particles ((NH4)2SO4, NH4NO3) in the PM filters. ATR-FTIR characterization of solid surfaces is a powerful analytical technique for identifying inorganic and organic compounds in samples of particulate matter.

1. Introduction

The urban air people breathe contains several solid and gaseous chemicals that have significant negative effects on public health [1,2,3]. Several epidemiological studies have shown a close relationship between air pollution and various respiratory tract diseases (allergies, asthma, lung emphysema), lung cancer, and cardiopulmonary mortality, which commonly affect urban populations [4,5,6,7,8,9]. The World Health Organization (WHO) [10] and the Directive of the European Parliament [11] established that daily values in Europe for concentrations of particulate matter with sizes of ≤10 and ≤2.5 µm (i.e., PM10 and PM2.5) should not exceed 50 µg/m3 and 25 µg/m3, respectively. Particulate matter with a size ≤10 µm is considered to be particularly detrimental to human health, but the nature of the PM is equally crucial as particle types have highly variable toxicity levels. Particulate matter comprises a range of particles such as mineral dust, metals, metalloids, sea salts, ammonium nitrate and sulfate, organic compounds, and elemental carbon. The abundance of the various organic and inorganic components is temporally and spatially variable [12]. Some are directly emitted into the atmosphere by either natural or anthropogenic sources (primary particles), while others are the result of homogeneous or heterogeneous nucleation and condensation of gaseous precursors (secondary particles). The Mediterranean area is often affected by Saharan dust events, which increase PM10 and PM2.5 concentrations beyond European recommended values, mainly in southern Europe. Saharan dust is a mixture of mineral particles (quartz, calcite, dolomite, and clay minerals) and organic matter [13]. Some studies have suggested that Saharan dust has a significantly negative impact on air quality, visibility, and human health [14,15,16]. Several authors described increased asthma, rhinitis, cardiovascular disease, and mortality [17,18]. Other authors found no association between dust events and hospitalizations [19,20,21,22,23], increased mortality, or increased potential oxidative water-soluble fractions in PM10 and PM2.5 [24] compared to anthropogenic dust.
Water-soluble components (WSCs) are among the main components of total particulate matter [25,26], typically contributing about 50%–70% of the weight. WSCs are associated with degraded atmospheric visibility and adverse effects on human health [27,28,29]—they also contribute to the formation of acid rain, which promotes the faster decay of buildings. The main analytical technique used to determine water-soluble components is ion chromatography (IC). In recent years, Fourier-transform-infrared spectroscopy (FTIR) has become important in identifying aerosol composition and quantifying the mass of organic and inorganic compounds in particulate matter [30,31,32,33]. FTIR coupled with accessories like attenuated total reflectance (ATR) allows the analysis of a wide range of solid and liquid components [34].
In this study, we present data on the chemical composition of water-soluble components in PM10 and PM2.5 samples collected in an urban area of southern Italy. The city of Palermo, chosen for our case study, is affected by urban pollution and natural particulate matter from a range of sources. The principal sources in the study area are gasoline- and diesel-powered vehicles, an active commercial and tourist harbor, domestic heating, and a geogenic component that includes soil erosion, marine aerosol, and sporadic Saharan dust events. The aim of this paper is to identify the principal functional groups of inorganic and organic components in atmospheric aerosols by ATR-FTIR analysis. Moreover, we report the results of FTIR analysis carried out on samples of PM10 and PM2.5 filters taken during Saharan dust events that affected the Mediterranean area.

2. Materials and Methods
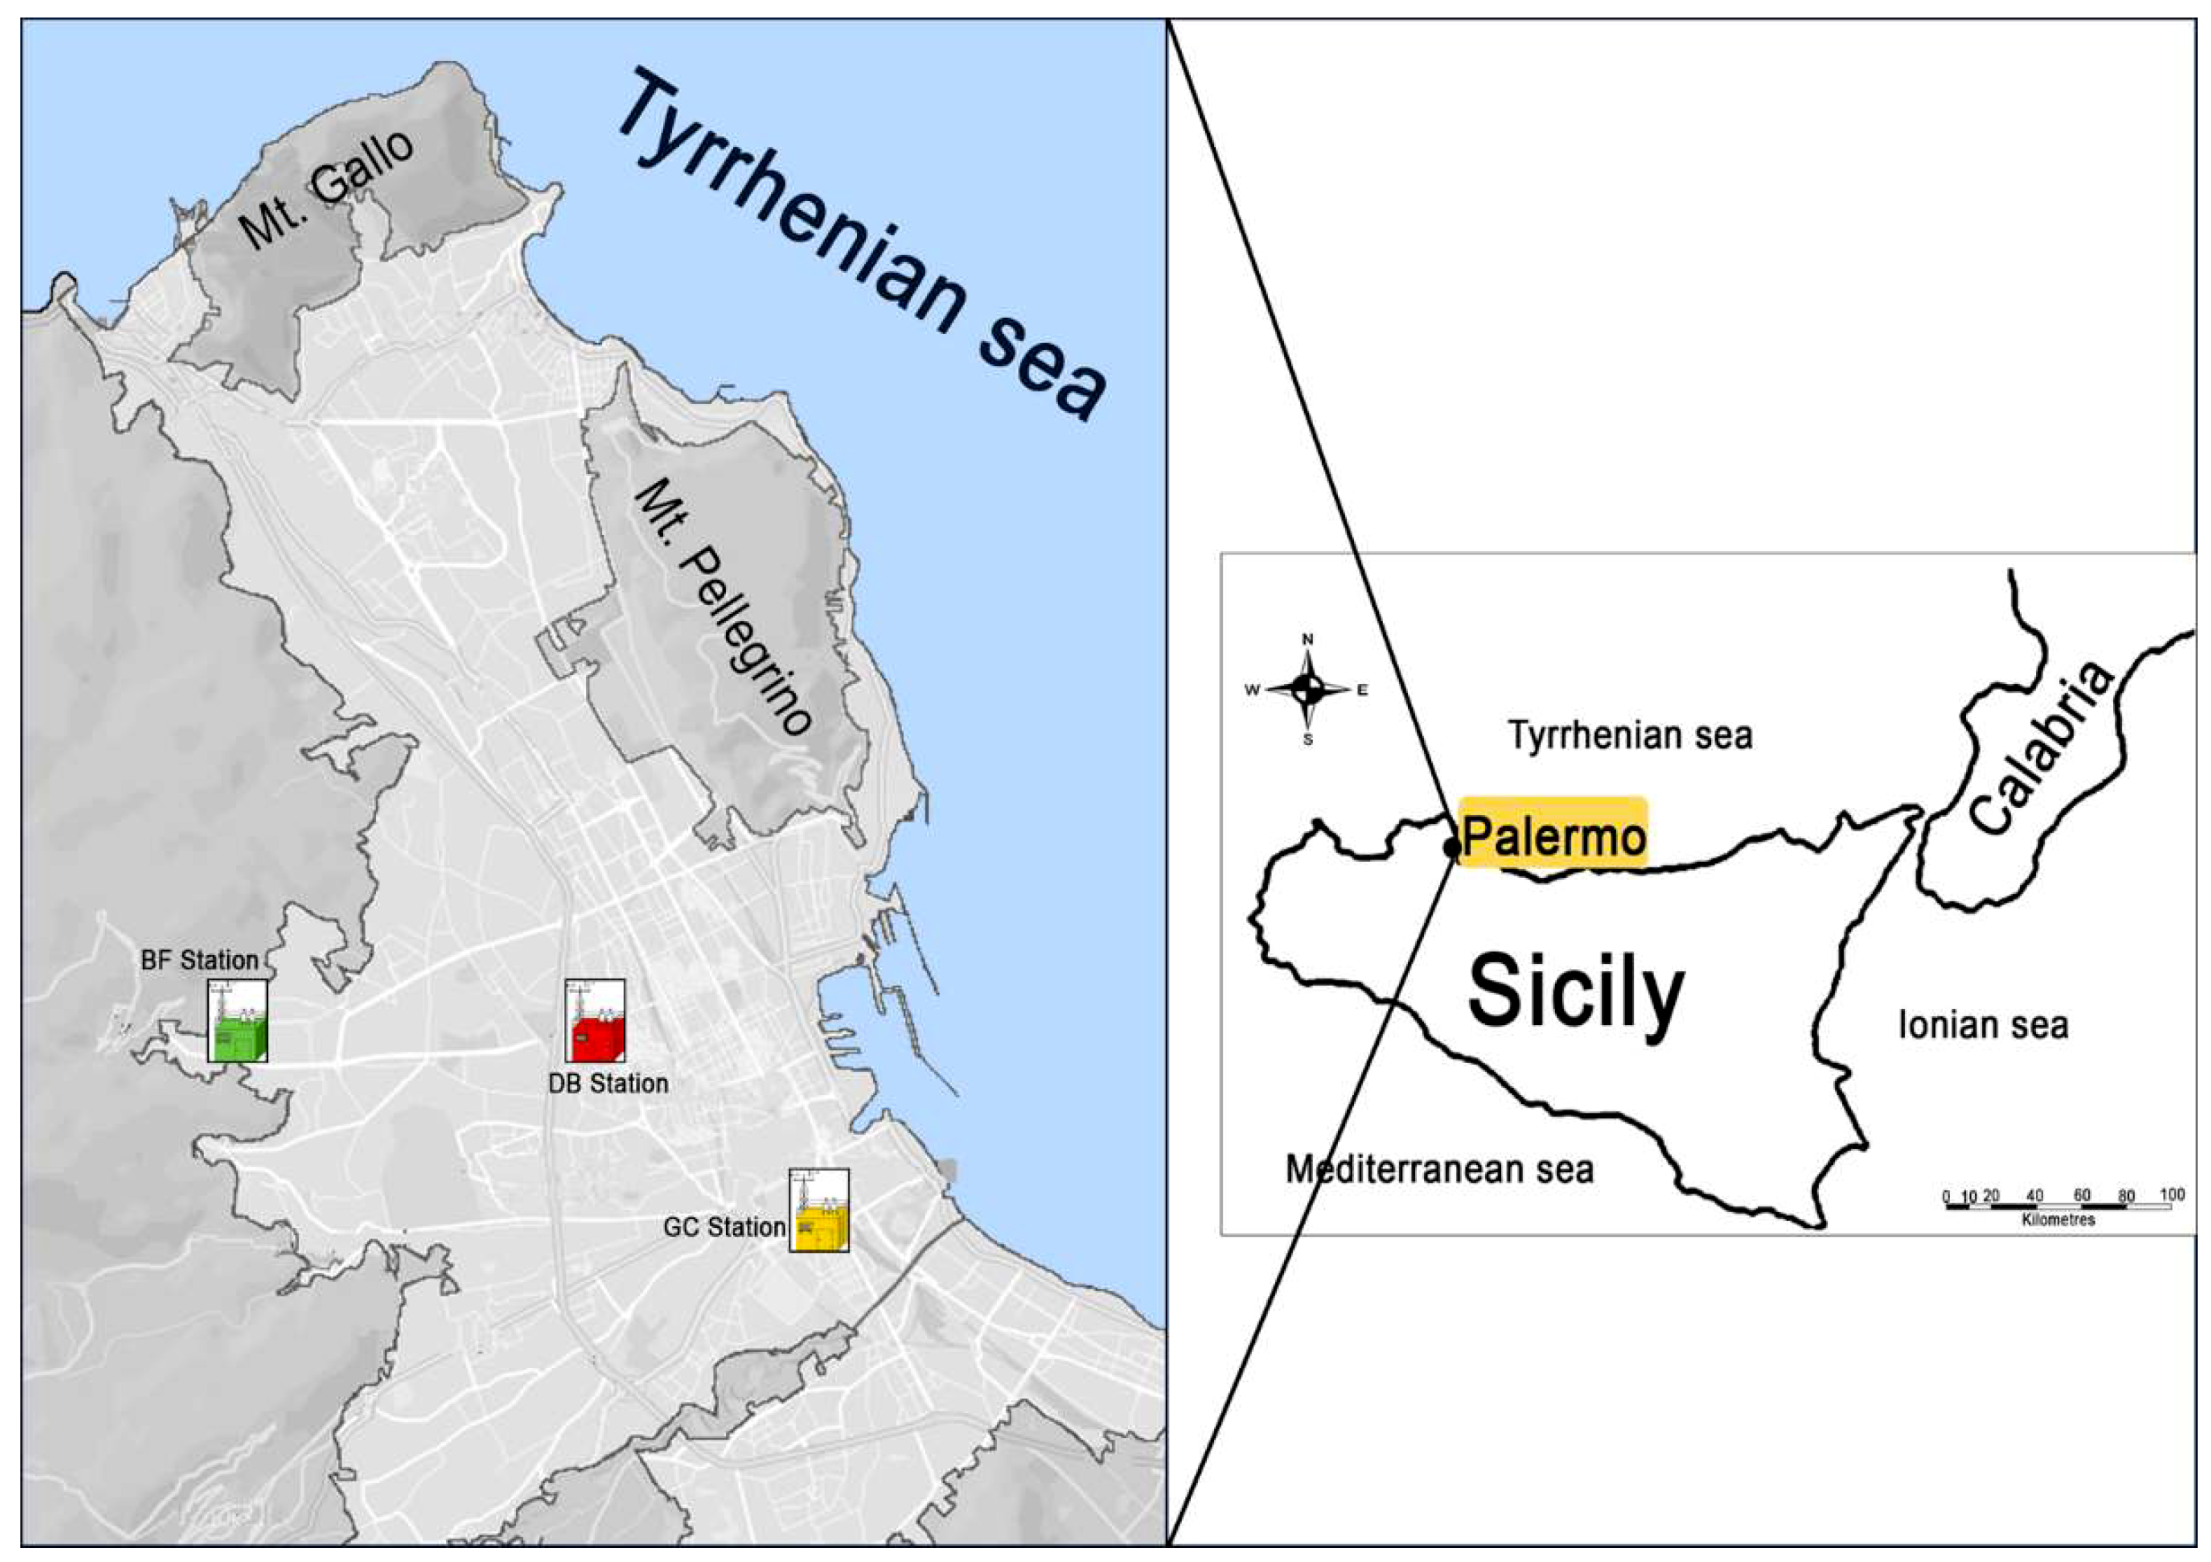
2.1. Site Details

Palermo is the largest urban area of Sicily, with about 680,000 inhabitants and a metropolitan area populated by more than 1 million people. The city is situated on the north-western coast of the island, bordered on the northeast by the Tyrrhenian Sea and surrounded by mountains (Monti di Palermo) reaching 500–1000 m above sea level (Figure 1).
The study area is entirely covered by sedimentary rocks (limestone, clay, marly-clay, and white or yellow quaternary biocalcarenite). The climate of Palermo is typically Mediterranean, with hot summers and temperate winters. Among the stations studied, only Boccadifalco (BF) station records weather data representative of the entire agglomeration where the other stations of the present study (Giulio Cesare (GC) and Di Blasi (DB) are located. Figure 2 shows the wind rose of the sampling period (November 2008–February 2009). From the monthly wind roses during the winter months, the prevailing wind direction is from the WNW and WSW sectors. In the same period, close to 5% wind direction from the S and SSE sectors (Sirocco winds) has been registered. During autumn and spring in the city, there are frequent warm winds coming from south-east (Sirocco winds) carrying dust raised from the Sahara Desert region throughout the Mediterranean basin. Over the sampling period, the weather monitoring station located in the peripheral area of Palermo (BF station) registered six periods of 1–2 days of Saharan dust intrusions.

2.2. Sampling Sites

A total of 348 daily samples, 308 PM10 and 40 PM2.5, were collected from November 2008 to February 2009. To meet the requirements of Directive 1999/30/EC (EU Commission, 1999), PM10 sampling was performed according to European Standard EN12341 (CEN, 1998), with a low-volume system equipped with a sampling inlet head (Zambelli Explorer Plus Controller 16) operating at a constant sampling rate (2.3 m3h-1). Particles were collected on standard 47 mm quartz filters (Advantec, grade QR100). The sampling time was 24 h, from midnight to midnight. PM2.5 sampling was performed according to European standard EN 14907 (CEN 2005). At Di Blasi (DB) station, simultaneous sampling of PM10 and PM2.5 was carried out. PM10 mass determination was performed by β-ray attenuation method, model Environment MP101M.C (CNR–Italy certified). The beta attenuation instrument is compliant with EN 12341 for PM10 and is approved as federal equivalent method by US the Environmental Protection Agency for PM10. The detection is done every 2 hours (12 detections in 24 hours). Initial and final weighing of PM10 and PM2.5 filters were carried out in a temperature- and humidity-controlled room (T = 20 ± 1 °C, RH = 50 ± 5%) after the filters had been conditioned for 48 h before and after sampling. Three air quality monitoring stations belonging to the municipal monitoring network (RAP-ex AMIA) were chosen for this study (Figure 1).
The Di Blasi (DB) station is located close to a crossroads with traffic lights at pedestrian crossings and is characterized by high traffic flow, consisting of cars, heavy-duty vehicles, and buses. Giulio Cesare (GC) station is situated in a large square in front of the railway station, exposed to heavy traffic composed of cars as well as urban and regional buses. The Boccadifalco (BF) station is a suburban background station, situated leeward of the sea breeze, without any direct influence of urban activities. It has lower traffic density than the other stations and was selected as a control site to monitor the hypothetical background level of pollution. Filters used for analysis were selected based on the simultaneity of daily sampling between the three monitoring stations. ATR-FTIR spectroscopy was used to analyze 13 PM10 filters from the suburban background station (BF), 36 PM10 filters from the urban station (GC), 40 PM2.5 filters from the urban station (DB), and one composite sample of Saharan dust deposited in Palermo town. A total of 1 g of Saharan dust was taken near GC station using a plastic brush and tray and stored in plastic bags. The sample was initially sieved through a 63 μm sieve to remove coarse components. Afterward, screening through a 20 μm mesh sieve was necessary to obtain a finer fraction for FTIR analysis. The following were analyzed for water-soluble ions: 13 PM10 filters from BF station, 30 PM10 filters from GC station and 30 PM2.5 filters from DB station.

2.3. Analytical Procedures

2.3.1. FTIR Spectra

A Bruker Optics (Tensor 27) IR (Bruker Corporation, Billerica, MA, USA) spectrometer equipped with a deuterated triglyceride sulfate detector was operated with Opus software from Bruker to obtain the spectra of ambient air samples. An ATR accessory with a germanium crystal flat plate was coupled with the spectrometer for data acquisition. Aerosol sample spectra were obtained over wavelengths between 4000 and 400 cm–1 (mid-infrared region) with 2 cm–1 resolution by averaging 32 scans. Each aerosol sample was scanned by placing the quartz fiber filter sample-side down on the ATR crystal and applying the pressure tower. Each IR spectrum was corrected for optical effects with the ATR correction algorithm in Opus. A blank quartz fiber spectrum was obtained with each set of daily samples to account for any changes in the absorbance bands due to instrument drift. Between each sample spectrum acquisition, the ATR crystal was cleaned with ethanol, and an air background spectrum was obtained. The FTIR operation method is explained in Doyle [35] and Simonescu [36].

2.3.2. Water-Soluble Ions

Water-soluble ions were extracted from filter samples with 20 mL ultra-pure Milli-Q (Merck Millipore, Burlington, MA, USA) water (18MΩ cm) and shaken for 24h. The extracts were filtered through a 0.45 µm pore size polytetrafluoroethylene filter (Sartorius) and then stored in sterile 50 mL polypropylene centrifuge tubes. Each extract was analyzed the day after the extraction procedure for Ca2+, Mg2+, Na+, K+, Cl, SO42–, and NO3 ions by ion chromatography (Dionex 100), with precision better than ± 5%. Cations were measured using a Dionex IonPac CS12A (Thermo Fisher Scientific, Waltham, MA, USA) column with 20 mM methanesulfonic acid as the eluent. Anions were measured using a Dionex IonPac AS14 (Thermo Fisher Scientific, Waltham, MA, USA) with 3.5 Mm Na2CO3 and 1.0 mM NaHCO3 as the eluent. The limit of detection was evaluated by solution extracts for three blank filters in 0.02–0.05 and 0.04–0.05 mg/L for cations and anions, respectively. NH4+ ions were determined spectrophotometrically at λ = 420 nm (Thermo Scientific Evolution 600) using Nessler’s reagent (0.09 mol/L solution of potassium tetraiodomercurate (II) (K2[HgI4]) in 2.5 mol/L potassium hydroxide). The ion chromatograph operation method is explained in Michalski [37].

3. Results and Discussion

3.1. Mass Levels of PM10 and PM2.5

Table 1 shows the mass levels of PM10 at the urban and peripheral stations (GC, DB, and BF) and of PM2.5 at the urban DB station.
The mean PM2.5 and PM10 concentrations fall within the range reported for European urban areas [38,39,40]. The highest mean PM10 value was observed at the urban DB station (42 µg/m3), one of the most heavily traffic-exposed sites in Palermo, followed by GC station (39 µg/m3) and BF station (16 µg/m3). The average PM2.5 value observed at DB station is 29 µg/m3. For the 112 days analyzed (November 2008–February 2009), Saharan dust events influenced mass levels in the Palermo atmosphere on about 6% of the days. During these events, concentrations of 130–158 µg/m3 and 78 µg/m3 were measured for PM10 and PM2.5, respectively. In Palermo in February 2009, PM2.5 reached a daily concentration of 120 µg/m3 and PM10 reached values between 220 and 276 µg/m3 following a high-intensity Saharan dust event. The value of PM2.5 is comparable to that found by Remoundaki et al. [41] in Athens in February 2009 (100 µg/m3). During other, less-intense Saharan dust events, PM2.5 concentrations (average 62 µg/m3) increased by 50% and PM10 (average 86–119 µg/m3) by 65–80%. The values reported are higher than those published in previous studies concerning southern Italy (Rome: PM2.5, 25.6 µg/m3; PM10, 47.2 µg/m3 [16]; Salento: PM2.5, 36.6 µg/m3; PM10, 137 µg/m3 [24]; Bari: PM2.5, 31–49 µg/m3; PM10, 50–71 µg/m3 [42]), but the higher percentages during Saharan dust events are comparable [24,43,44,45]. In general, the contribution of particulate matter is evidenced in coarse rather than fine fractions [41]. The influence of Saharan dust on the Mediterranean basin has been estimated to be about 10–20% per year, thus many European countries have exceeded the PM limits recommended by the European Directive. The PM2.5/PM10 ratio has been widely used in environmental studies as an indicator of the contribution from stationary vs. mobile source emissions to the environment.
The average PM2.5/PM10 ratio measured at DB station is 0.70. This value is typical of urban environments with high traffic density [26,40,46,47,48,49]. During Saharan events, the PM2.5/PM10 ratio was only 0.58, indicating a greater natural contribution of coarse than fine particles.

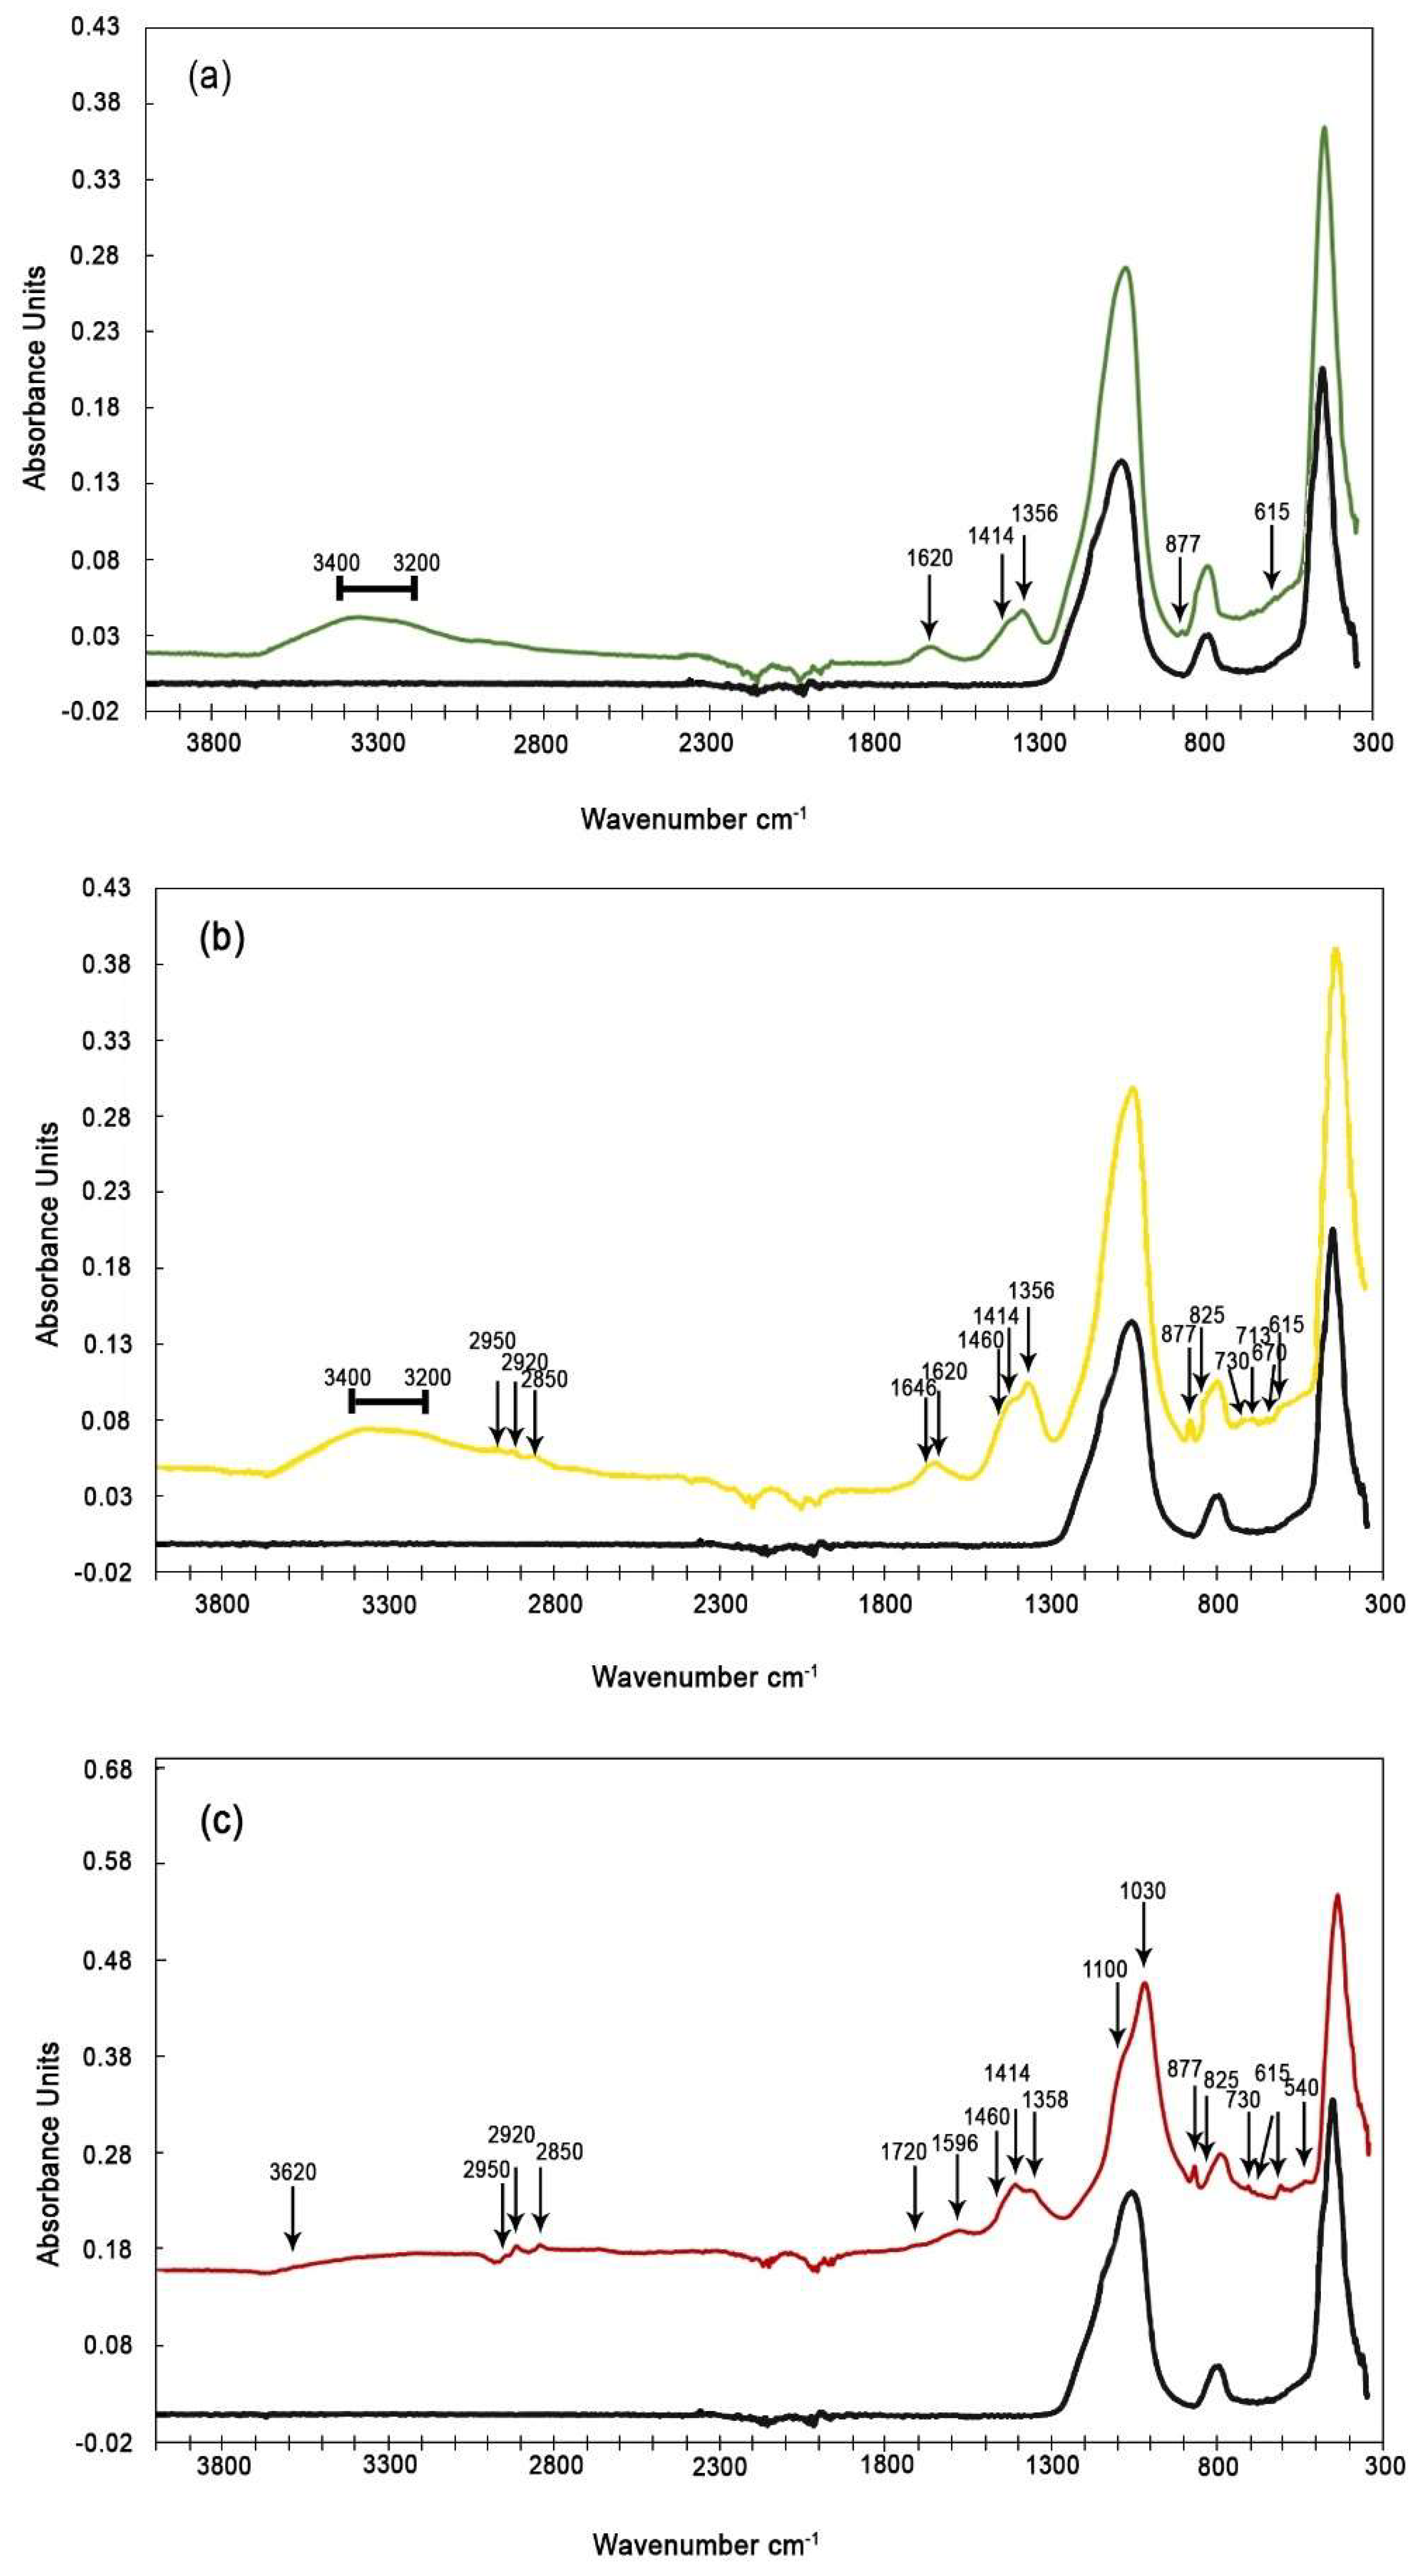
3.2. Spectral Analysis

The ATR spectra of PM10 and PM2.5 are shown in Figure 3a–c. The spectra identify different inorganic and organic molecules (Table 2).
Some peaks have no well-defined forms, and the presence of a shoulder indicates that there are overlapping peaks due to several different types of molecules absorbing IR radiation within the same range. From comparing the spectra, it is observed that the samples are dominated by inorganic components common to all stations.
In PM10 and PM2.5 filters, we observed vibrational frequencies typical for sulfate, ammonium, nitrate, and carbonate ions (603, 615, 670, and 1100 cm–1 (SO42–); 1414 cm–1 (NH4+); 825 and, 1356 cm–1 (NO3); and 713, 730, and 877 cm–1 (CO32–). The presence of (NH4)2SO4 and NH4NO3 compounds is supported by spectra shown in Figure 3b,c revealing absorption frequencies at 825 and 1356 cm–1 (group NO3), at 615 and 1100 cm–1 (group SO42–), and at 1414 cm–1 (NH4+ ion) [30,50]. The inferred 1100 cm–1 peak is a shoulder of the peak observed at 1060 cm–1. The 1100 cm–1 peak is assigned to the v3 asymmetrical stretching vibration of sulfate ion [51,52].
In all spectra (for coarse and fine particles), absorption frequencies at 1620 cm–1 and in the range of 3240–3400 cm–1 have been detected that can be attributed to O–H stretching, indicating crystalline water in gypsum [34,53].
The presence of CaSO4 × 2H2O is more evident in coarse than fine particles. The common presence of CaSO4 × 2H2O signals supports the widely accepted hypothesis that the sulfation process is important in urban environments [54]. Varrica et al. [55] observed CaSO4 × 2H2O crust on CaCO3 particles by scanning electron microscopy (SEM) of samples also collected in Palermo. In samples of “black crust” formed on historical buildings in Palermo, Montana et al. [56] determined δ34S values ranging from –0.5 to +5.0‰ (vs. Vienna Cañon Diablo Troilite (VCDT) scale), which suggests that most of the sulfur was derived from fossil fuel combustion. Moreover, Cesari et al. [43] observed that during Saharan dust events, the dominant form of sulfate is calcium sulfate rather than (NH4)2SO4. The absorption peaks at 713, 730, and 877 cm–1 are typical for the CO3 group [53,57,58], and the FTIR analysis of pure crystalline calcite and dolomite confirms that these peaks are related to CaCO3. The peaks of halite between 1000 and 1200 cm–1 are not clearly visible due to the absorption linked with the quartz filter. In the GC and BF samples, there is also a peak at 1620 cm–1 that can be attributed to one of the peaks of halite; at 1414 cm–1 the peak of halite is not visible as it is very small and overlaps with the ammonium ion peak.
Organic compounds are identified in the coarse and fine particle fractions of the urban stations but are absent from the filters collected at the suburban station. The aliphatic hydrocarbons (2850, 2920, and 2950 cm–1) were clearly identified in the collected spectra (Figure 3b,c) [30,31,34,59,60,61]. The stretching frequency at 2950 cm–1 is assigned to CH3 aliphatic carbon stretching absorption, while the frequencies at 2924 and 2850 cm–1 are due to CH2 bonds. An absorption peak at 1460 cm–1 comprises contributions from bending of CH3 and CH2 aliphatic carbon bonds [30,59]. Vibration around 1460 cm–1 is a shoulder of the peak at 1414 cm–1. The spectra for PM2.5 filters also show an absorbance peak at 1596 cm–1, identified as a C = C group [59,61]. The identification of other peaks for C = C aromatic group (1463–1511–1596 cm–1) is complicated by overlapping peaks due to several different types of molecules that absorb IR radiation within the same range.

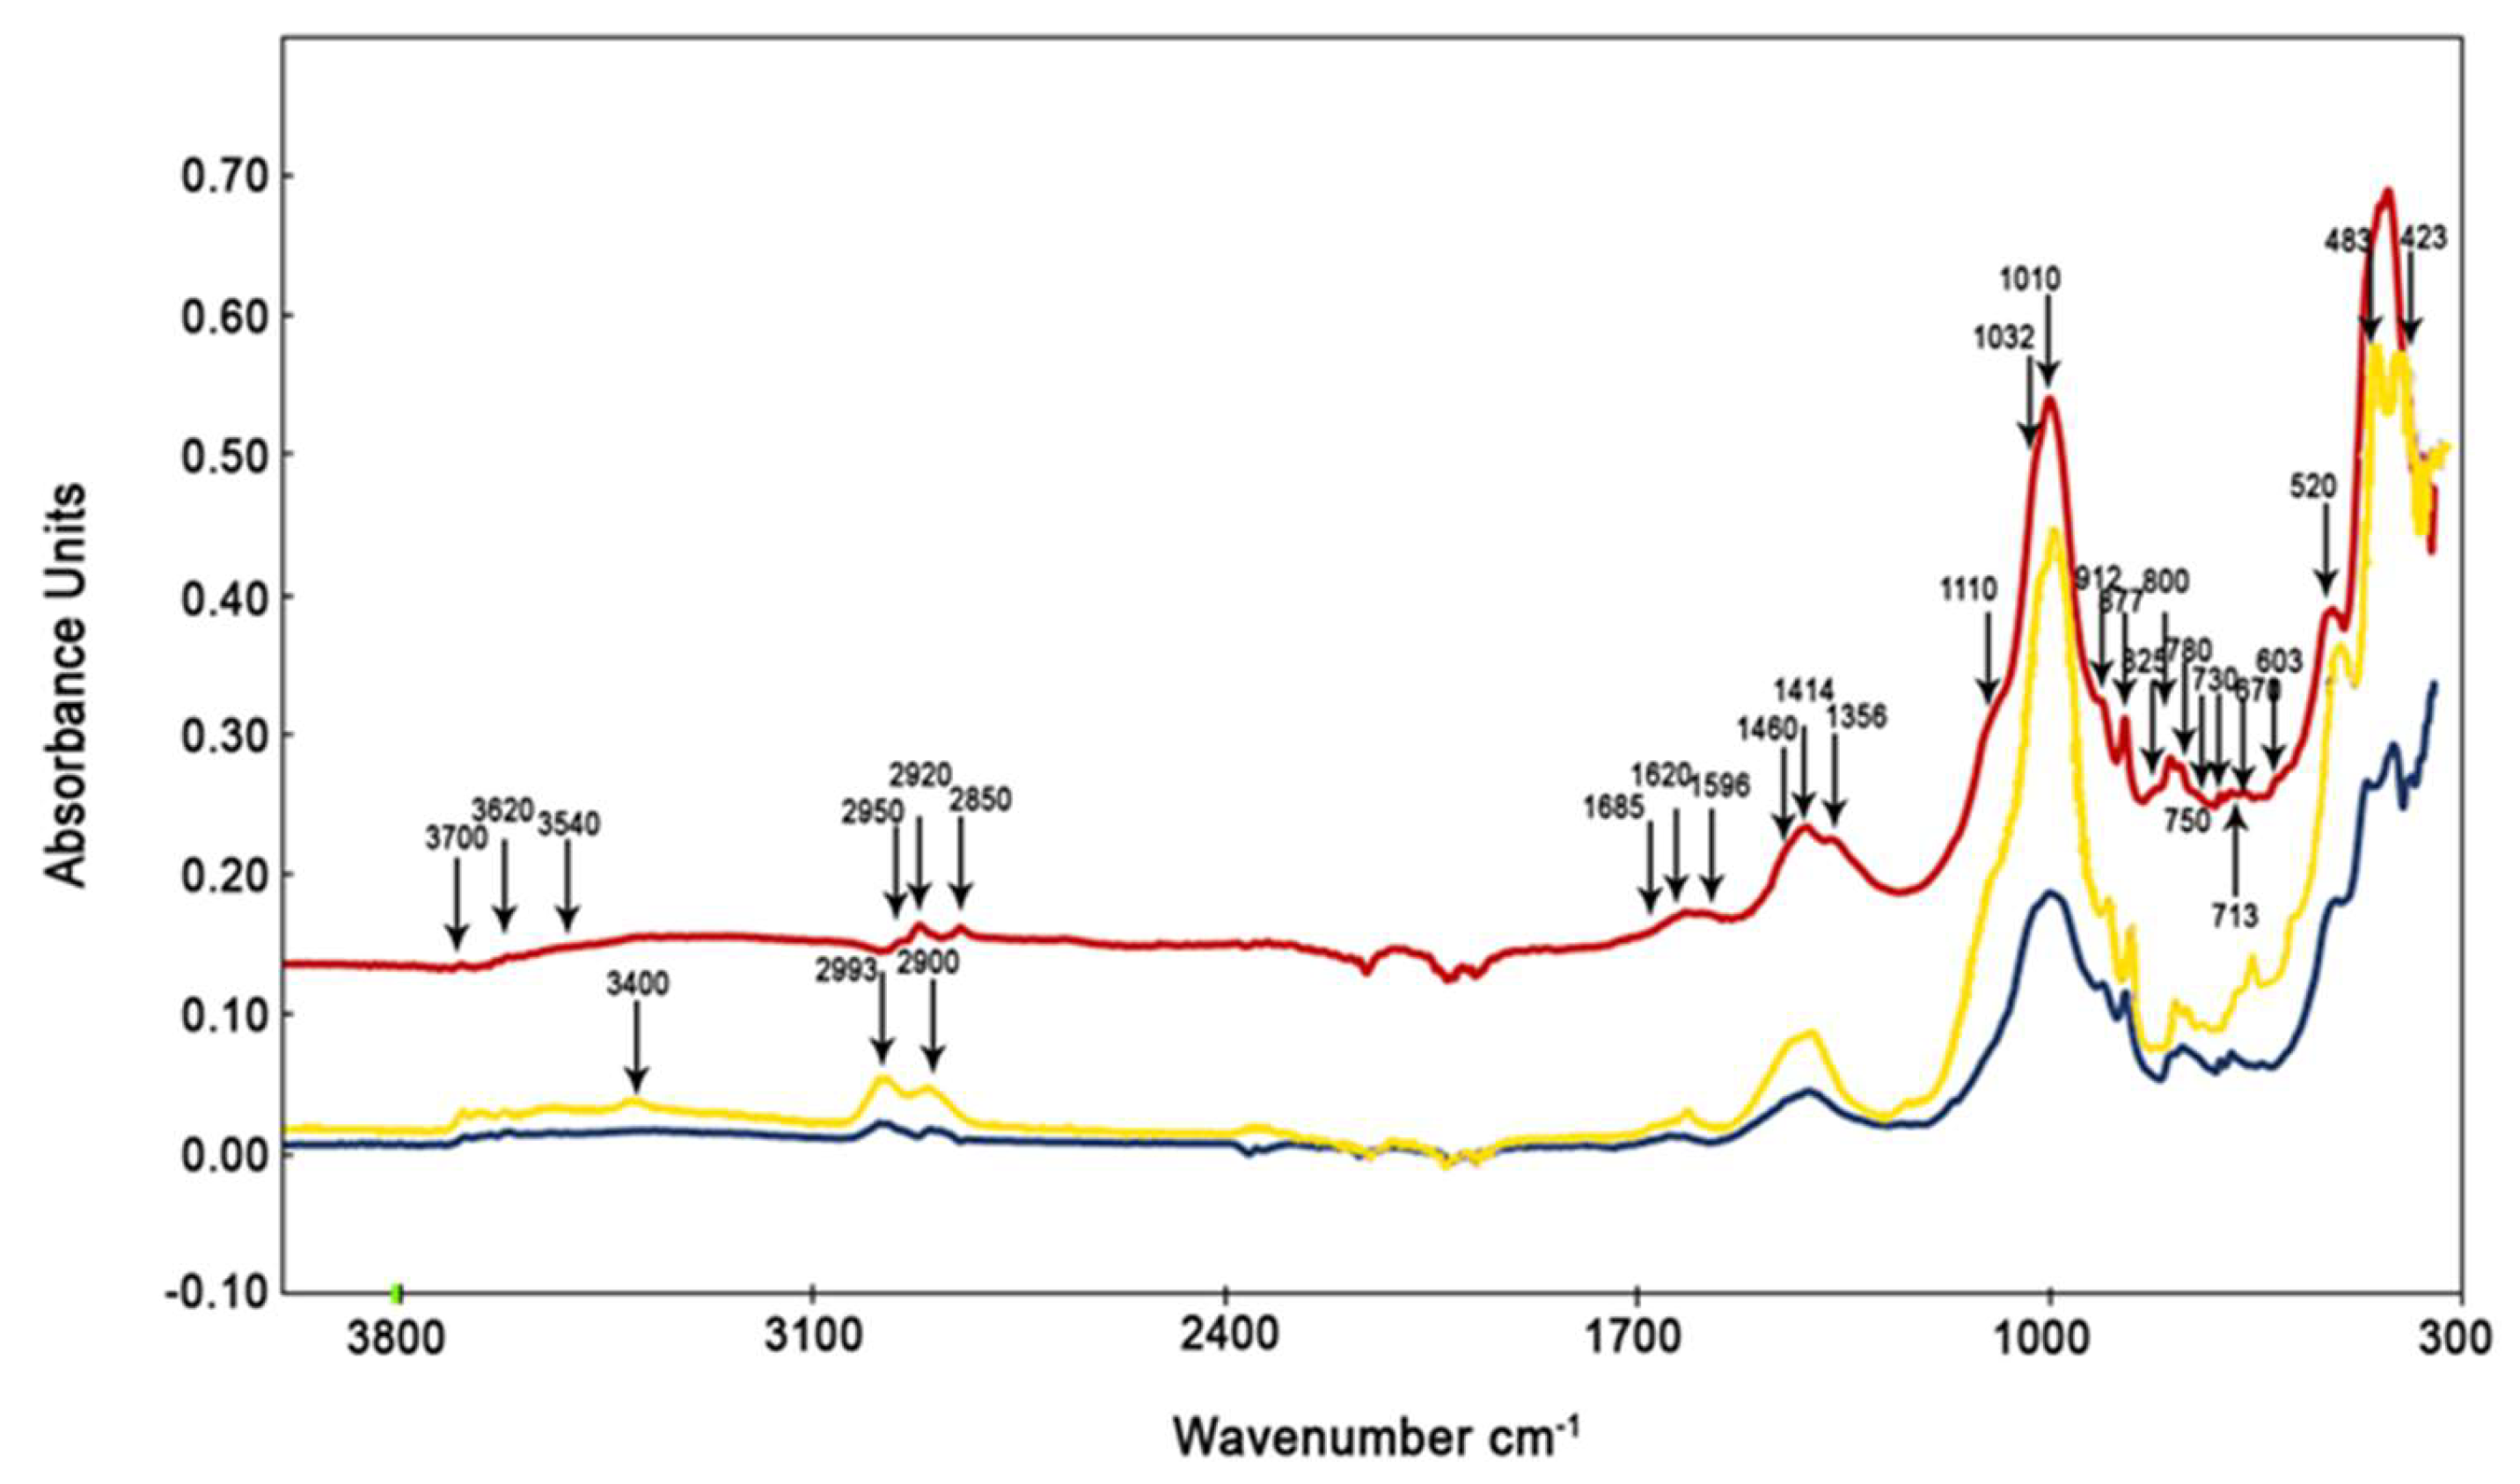
3.3. Spectral Analysis Of Samples Collected During Saharan Dust Episodes

The particulate matter collected during Saharan dust events show peaks belonging to a group of clay minerals, which were not detected during non-Saharan events. Figure 4 shows the ATR spectra of the urban area (GC) PM10 filter, the urban area (DB) PM2.5 filter, and the Saharan dust.
Peaks at wavenumbers of 423, 463, and 520 cm–1 are associated with the O–Si–O bending of palygorskite and illite (426, 468, and 525 cm–1) [63]. The peak at 750 cm–1 identifies the inner layer vibration of Al–O–Si groups in illite [63,64]. Previous studies assigned the peak at 912 cm–1 to the deformation of Al–Al–OH groups in the dioctahedral layer of palygorskite [62,65]. The identification of kaolinite is characterized by the presence of peaks at 1010, 1032, and 1114 cm–1, representing the Si–O stretching group [67]. Peaks at 1032 and 1114 cm–1 are not distinct because they simultaneously characterize various molecules that vibrate in the same IR intervals, creating peak overlaps.
Peaks at 3260, 3400, 3620, 3669, and 3695 cm–1 are all linked to the vibration of –OH groups belonging to different clay minerals. Peaks at 3260 and 3400 cm–1 are reported to relate to water stretching in palygorskite [63,65]. The OH groups located between tetrahedral and octahedral sheets are characterized by absorption near 3620 cm–1 in all clay minerals. They reside at the octahedral surface of the layers, forming weak hydrogen bonds with the oxygens of the Si–O–Si bonds on the lower surface of the next layer. A strong band at 3695 cm1 relates to the in-phase symmetric stretching vibration. Weak absorptions at 3669 cm1 are assigned to out-of-plane stretching vibrations [68,69]. In these samples, we found the same organic components as observed in the samples taken during non-Saharan events.

3.4. Water-Soluble Ions

Table 3 shows the mean concentrations of soluble components of PM10 and PM2.5 filters. Inorganic ions represent about 50%–70% of the total mass of PM10 and PM2.5.
About 60% and 70% of total ions analyzed in PM10 and PM2.5 filters, respectively, are made up of NH4+, NO3, and SO42–. For urban stations (PM10 and PM2.5) the ammonium and calcium ions (expressed in neq/m3) are the most abundant cations. Magnesium and potassium are less abundant, contributing only about 1% to the total content of particulate matter. If the soluble calcium is derived from the alteration of carbonate rocks, a geogenic contribution of 10–14% of the total mass of the PM10 fraction from urban and suburban stations is estimated. In the fine PM2.5 fraction, a geogenic contribution is estimated to account for 9% of the total mass at the urban station.
NO3 and SO42– anions have the highest concentration at all stations. In this study, the contribution of marine sulfate was calculated to have been around 6–10% in PM10 and 3% in PM2.5 fractions. The main source of SO42– in the atmosphere is from gas-to-particle conversion of SO2. NO3 ions derive from the reaction of hydroxyl radicals, formed by photolysis of ozone molecules, with NOx emitted by fossil fuel combustion. High concentrations of ammonium, sulfate, and nitrate ions demonstrate their involvement in secondary particulate formation. A significant correlation between NH4+ and (nssSO42– + NO3) has been found (r = 0.90, p < 0.05; Figure 5), confirming the formation of ammonium sulfate and nitrate following neutralization of aerosol through heterogeneous atmospheric chemical reactions [47,70,71,72].
These sequences of reactions are strongly influenced by ambient temperature, relative humidity conditions, incidence of solar radiation, and above all the concentration of primary gases [73]. The equivalent ratio of NH4+/nss–SO42– in urban PM10 and PM2.5 is more than 1.5, characterizing the ambient atmosphere as ammonium-rich [74]. Nevertheless, as Figure 5 shows, the concentration of ammonium ions is insufficient to completely neutralize H2SO4 and HNO3. Total neutralization of the acid species is linked to the presence of carbonate rocks, abundant in the study area. The highest chlorine and sodium contents found in coarse samples (GC and BF) range between 1.70 and 1.19 µg/m3 and 1.14 and 1.45 µg/m3, respectively. The main source of Cl and Na+ in the study area is marine spray, accounting for 11–15% of the total mass in the PM10 fraction from urban and suburban stations. For fine PM2.5 fraction, sea salt contribution is estimated to account for 9% of the total mass at DB station. The average Na/Cl equivalent ratio measured in the PM10 and PM2.5 filters ranges between 1.4 and 1.8. These values are higher than those of seawater (0.85) and halite (1.0), suggesting a loss of chlorine ions due to chemical reactions that involve NaCl and HNO3 or H2SO4, bringing the formation of NaNO3 or Na2SO4 and gaseous HCl [66]. Similarly, a deficit of ammonium with respect to the collective concentration of SO42+ and NO3 (neq/m3) suggests that a proportion of these ions is lost via formation of NH4Cl or HCl and NH3 [47,51].

4. Conclusions

The main objective of this study was to verify the potential of ATR-FTIR to identify organic and inorganic groups present in PM10 and PM2.5. The use of ATR-FTIR led to the identification of absorption bands characteristic of sulfate, ammonium, nitrate, and carbonate by vibrational frequencies at 603, 615, 670, and 1100 cm–1 for SO42–-, at 1414 cm–1 for NH4+, at 825 and 1356 cm–1 for NO3, and at 713, 730, and 877 cm–1 for CO32– common to all filter types (PM10 and PM2.5). Vibration frequencies at 1620 cm–1 and in the range of 3240–3400 cm–1 indicate O–H stretching of crystalline water in gypsum. The presence of gypsum in the particulate matter of Palermo confirms the hypothesis that sulfation processes play an important role in urban areas. Moreover, in urban spectra, several organic compounds were identified, while aliphatic compounds were not detected at the suburban station. The ATR-FTIR analysis of filters taken during Saharan dust events shows the presence of absorbance peaks typical for clay minerals. The minerals found were palygorskite, illite, and kaolinite, which are typical for Saharan desert environments.
The water-soluble components represent about 50%–70% of the total mass of PM10 and PM2.5. Nitrate and sulfate ions had the highest concentrations at all stations, confirming their involvement in secondary particulate formation. The results show that ammonium ions are not able to neutralize most of the nitric and sulfuric acids present in aerosols. The main geogenic sources in the study area are marine spray and local rocks.
The data of this study shows that ATR-FTIR, used here as a qualitative approach, is a powerful analytical technique for the identification of inorganic and organic compounds in PM10 and PM2.5 filters. Moreover, the simplicity of the substrate preparation, the excellent reproducibility of the results, the non-destruction of the sample, and above all the fast identification of components of particulate matter confirm the opportunity to use this analytical technique for qualitative analysis, and to characterize variations in the chemical composition of aerosol particles during intense pollution episodes.

Author Contributions

Conceptualization, D.V. and I.D.C.; Data curation, D.V., E.T. and I.D.C.; Formal analysis, D.V., E.T. and I.D.C.; Funding acquisition, D.V.; Methodology, M.V.; Writing—original draft, D.V., E.T. and I.D.C.

Acknowledgments

This work was supported by Miur (funds FFR2018, D. Varrica). We would like to thank Risorse Ambiente Palermo (RAP, ex AMIA) of Palermo (Italy) (http://www.rapspa.it/site/) for providing the filter samples.

Conflicts of Interest

The authors declare no conflict of interest.

References

  1. Schell, L.M.; Denham, M. Environmental Pollution in Urban Environments and Human Biology. Annu. Rev. Anthropol. 2003, 32, 111–134. [Google Scholar] [CrossRef]
  2. Sancini, A.; Tomei, F.; Tomei, G.; Caciari, T.; Di Giorgio, V.; André, J.C.; Palermo, P.; Andreozzi, G.; Nardone, N.; Schifano, M.P.; et al. Urban pollution. G. Ital. Med. Lav. Ergon. 2012, 34, 187–196. [Google Scholar] [PubMed]
  3. Kelly, F.J.; Fussell, J.C. Air pollution and public health: Emerging hazards and improved understanding of risk. Environ. Geochem. Health 2015, 37, 631–649. [Google Scholar] [CrossRef] [PubMed]
  4. Miller, K.A.; Siscovick, D.S.; Sheppard, K.; Sullivan, J.H.; Anderson, G.L.; Kaufman, J.D. Long-term exposure to costituents of fine particulate air pollution and incidence of cardiovascular events in women. N. Engl. J. Med. 2007, 356, 447–458. [Google Scholar] [CrossRef] [PubMed]
  5. Pope, C.A.; Burnett, R.T.; Thun, M.J.; Calle, E.E.; Krewsky, D.; Ito, K.; Thurston, G.D. Lung cancer, cardiopulmonary mortality, and long-term exposure to fine particulate air pollution. JAMA 2002, 287, 1132–1141. [Google Scholar] [CrossRef] [PubMed]
  6. Pope, C.A.; Ezzati, M.; Dockery, D.W. Fine-Particulate Air Pollution and Life Expectancy in the United States. N. Engl. J. Med. 2009, 360, 376–386. [Google Scholar] [CrossRef] [PubMed] [Green Version]
  7. Van Donkelaar, A.; Martin, R.V.; Michael Brauer, M.; Boys, B.L. Use of Satellite Observations for Long-Term Exposure Assessment of Global Concentrations of Fine Particulate Matter. Environ. Health Perspect. 2015, 123, 135–143. [Google Scholar] [CrossRef] [Green Version]
  8. Lipfert, F.W. Long-term associations of morbidity with air pollution: A catalog and synthesis. J. Air Waste Manag. Assoc. 2018, 68, 12–28. [Google Scholar] [CrossRef]
  9. Liu, M.; Xue, X.; Zhou, B.; Zhang, Y.; Baijun, S.; Chen, J.; Li, X. Population susceptibility differences and effects of air pollution on cardiovascular mortality: Epidemiological evidence from a time-series study. Environ. Sci. Pollut. Res. 2019, 26, 15943–15952. [Google Scholar] [CrossRef]
  10. World Health Organization (WHO). Air Quality Guidelines for Europe, 2nd ed.; WHO Regional Publications, 91; World Health Organization, Regional Office for Europe: Copenhagen, Denmark, 2000. [Google Scholar]
  11. EU-Commission. Directive 2008/50/EC of the European Parliament and of the Council of 21 May 2008 on Ambient Air Quality and Cleaner Air for Europe Official Journal of the European Union L152/3 (11/06/2008), 6-15; EU-Commission: Brussels, Belgium, 2008. [Google Scholar]
  12. Squizzato, S.; Cazzaro, M.; Innocente, E.; Visin, F.; Hopke, P.K.; Rampazzo, G. Urban air quality in a mid-size city—PM2.5 composition, sources and identification of impact areas: From local to long range contributions. Atmos. Res. 2017, 186, 51–62. [Google Scholar] [CrossRef]
  13. Avila, A.; Queralt-Mitjans, I.; Alarcón, M. Mineralogical composition of African dust Delivered by red rains over north eastern Spain. J. Geophys. Res. 1997, 102, 21977–21996. [Google Scholar] [CrossRef]
  14. Molinaroli, E.; Masiol, M. Particolato Atmosferico e Ambiente Mediteranneo. Il Caso Delle Polveri Sahariane; Aracne: Roma, Italy, 2006; p. 224. [Google Scholar]
  15. Jiménez, E.; Linares, C.; Martínez, D.; Díaz, J. Role of Saharan dust in the relationship between particulate matter and short-term daily mortality among the elderly in Madrid (Spain). Sci. Total Environ. 2010, 408, 5729–5736. [Google Scholar] [CrossRef] [PubMed]
  16. Mallone, S.; Stafoggia, M.; Faustini, A.; Gobbi, G.P.; Marconi, A.; Forastiere, F. Saharan dust and associations between particulate matter and daily mortality in Rome, Italy. Environ. Health Prespect. 2011, 119, 1409–1414. [Google Scholar] [CrossRef] [PubMed]
  17. Cadelis, G.; Tourres, R.; Molinie, J. Short-Term Effects of the Particulate Pollutants Contained in Saharan Dust on the Visits of Children to the Emergency Department due to Asthmatic Conditions in Guadeloupe (French Archipelago of the Caribbean). PLoS ONE 2014, 9, e91136. [Google Scholar] [CrossRef] [PubMed]
  18. Middleton, N.; Yiallouros, P.; Kleanthous, S.; Kolokotroni, O.; Schwartz, J.; Dockery, D.W.; Demokritou, P.; Koutrakis, P. A 10-year time-series analysis of respiratory and cardiovascular morbidity in Nicosia, Cyprus: The effect of short-term changes in air pollution and dust storms. Environ. Health 2008, 7, 1–16. [Google Scholar] [CrossRef] [PubMed]
  19. Zhang, X.; Zhao, L.; Tong, D.Q.; Wu, G.; Dan, M.; Teng, B. A Systematic Review of Global Desert Dust and Associated Human Health Effects. Atmosphere 2016, 7, 158. [Google Scholar] [CrossRef]
  20. Bennett, C.M.; McKendry, I.G.; Kelly, S.; Denike, K.; Koch, T. Impact of the 1998 Gobi dust event on hospital admissions in the Lower Fraser Valley, British Columbia. Sci. Total Environ. 2006, 366, 918–925. [Google Scholar] [CrossRef] [PubMed]
  21. Schwartz, J.; Norris, G.; Larson, T.; Sheppard, L.; Claiborne, C.; Koenig, J. Episodes of high coarse particle concentrations are not associated with increased mortality. Environ. Health Perspect. 1999, 107, 339–342. [Google Scholar] [CrossRef] [PubMed]
  22. Sandström, T.; Forsberg, B. Desert dust: An unrecognized source of dangerous air pollution? Epidemiology 2008, 19, 808–809. [Google Scholar] [CrossRef] [PubMed]
  23. Pérez, L.L.; Tobias, A.; Querol, X.; Künzli, N.; Pey, J.; Alastuey, A.; Viana, M.; Valero, N.; González-Cabré, M.; Sunyer, J. Coarse particles from Saharan dust and daily mortality. Epidemiology 2008, 19, 800–807. [Google Scholar] [CrossRef] [PubMed]
  24. Chirizzi, D.; Cesari, D.; Guascito, M.R.; Dinoi, A.; Giotta, L.; Donateo, A.; Contini, D. Influence of Saharan dust outbreaks and carbon content on oxidative potential of water-soluble fractions of PM2.5 and PM10. Atmos. Environ. 2017, 163, 1–8. [Google Scholar] [CrossRef]
  25. Russell, M.; Allen, D.T.; Collins, D.R.; Fraser, M.P. Daily, seasonal, and spatial trends in PM2.5 mass and composition in southern Texas. Aerosol Sci. Technol. 2004, 38, 14–26. [Google Scholar] [CrossRef]
  26. Lianou, M.; Chalbot, M.C.; Kavouras, I.G.; Kotronarou, A.; Karakatsani, A.; Analytis, A.; Katsouyanni, K.; Puustinen, A.; Hameri, K.; Vallius, M.; et al. Temporal variations of atmospheric aerosol in four European urban areas. Environ. Sci. Pollut. Res. 2011, 18, 1202–1212. [Google Scholar] [CrossRef] [PubMed]
  27. Lee, B.K.; Hieu, N.T. Seasonal ion characteristics of fine and coarse particles from an urban residential area in a typical industrial city. Atmos. Res. 2013, 122, 362–377. [Google Scholar] [CrossRef]
  28. Mkoma, S.L.; Da Rocha, G.O.; Domingos, J.S.S.; Santos, J.V.S.; Cardoso, M.P.; Da Silva, R.L.; De Andrade, J.B. Atmospheric particle dry deposition of major ions to the South Atlantic coastal area observed at Baía de Todos os Santos, Brazil. An. Acad. Bras. Cienc. 2014, 86, 37–55. [Google Scholar] [CrossRef]
  29. Zhang, T.; Cao, J.J.; Tie, X.X.; Shen, Z.X.; Liu, S.X.; Ding, H.; Han, Y.M.; Wang, G.H.; Ho, K.F.; Qiang, J.; et al. Water-soluble ions in atmospheric aerosols measured in Xi’an, China: Seasonal variations and sources. Atmos. Res. 2011, 102, 110–119. [Google Scholar] [CrossRef]
  30. Allen, D.T.; Palen, E.J.; Haimov, M.I.; Hering, S.V.; Young, J.R. Fourier transform infrared spectroscopy of aerosol collected in a low pressure impactor (LPI/FTIR): Method development and field calibration. Aerosol Sci. Technol. 1994, 21, 325–342. [Google Scholar] [CrossRef]
  31. Maria, S.F.; Russella, L.M.; Turpin, B.J.; Porcja, R.J. FTIR measurements of functional groups and organic mass in aerosol samples over the Caribbean. Atmos. Environ. 2002, 36, 5185–5196. [Google Scholar] [CrossRef] [Green Version]
  32. Bruns, E.A.; Perraud, E.; Zelenyuk, A.; Ezell, M.J.; Johnson, S.N.; Yu, Y. Comparison of FTIR and particle mass spectrometry for the measurement of particulate organic nitrates. Environ. Sci. Technol. 2010, 44, 1056–1061. [Google Scholar] [CrossRef]
  33. Yu, X.; Song, W.; Yu, Q.; Li, S.; Zhu, M.; Zhang, Y.; Deng, W.; Yang, W.; Huang, Z.; Bi, X.; et al. Fast screening compositions of PM2.5 by ATR-FTIR: Comparison with results from IC and OC/EC analyzers. J. Environ. Sci. 2018, 71, 76–88. [Google Scholar] [CrossRef]
  34. Ghauch, A.; Deveau, P.A.; Jacob, V.; Baussand, P. Use of FTIR spectroscopy coupled with ATR for the determination of atmospheric compounds. Talanta 2006, 68, 1294–1302. [Google Scholar] [CrossRef] [PubMed]
  35. Doyle, W.M. Principles and Applications of Fourier Transform Infrared (FTIR) Process Analysis; Technical Note AN–906 Rev. C; Hellma Axiom, Inc.: Plainview, NY, USA, 1992; pp. 1–24. [Google Scholar]
  36. Simonescu, C.M. Application of FTIR Spectroscopy in Environmental Studies. In Advanced Aspects of Spectroscopy; Muhammad, A.F., Ed.; InTech: Rijeka, Croatia, 2012; pp. 49–84. [Google Scholar]
  37. Michalski, R. Principles and Applications of Ion Chromatography. In Application of IC-MS and IC-ICP-MS in Environmental Research; John Wiley & Sons: Hoboken, NJ, USA, 2016. [Google Scholar]
  38. Rodríguez, S.; Alastuey, A.; Alonso-Pérez, S.; Querol, X.; Cuevas, E.; Abreu-Afonso, J.; Viana, M.; Pérez, N.; Pandolfi, M.; de la Rosa, J. Transport of desert dust mixed with North African industrial pollutants in the subtropical Saharan Air Layer. Atmos. Chem. Phys. 2011, 11, 6663–6685. [Google Scholar] [CrossRef] [Green Version]
  39. Pey, J.; Alastuey, A.; Querol, X.; Rodríguez, S. Monitoring of sources and atmospheric processes controlling air quality in an urban Mediterranean environment. Atmos. Environ. 2010, 44, 4879–4890. [Google Scholar] [CrossRef]
  40. Putaud, J.P.; Van Dingenen, R.; Alastuey, A.; Bauer, H.; Birmili, W.; Cyrys, J.; Flentje, H.; Fuzzi, S.; Gehrig, R.; Hansson, H.C.; et al. A European aerosol phenomenology e 3: Physical and chemical characteristics of particulate matter from 60 rural, urban, and kerbside sites across Europe. Atmos. Environ. 2010, 44, 1308–1320. [Google Scholar] [CrossRef]
  41. Remoundaki, E.; Papayannis, A.; Kassomenos, P.; Mantas, E.; Kokkalis, P.; Tsezos, M. Influence of Saharan Dust Transport Events on PM2.5 Concentrations and Composition over Athens. Water Air Soil Pollut. 2013, 224, 1373–1387. [Google Scholar] [CrossRef]
  42. Amodio, M.; Bruno, P.; Caselli, M.; de Gennaro, G.; Dambruoso, P.R.; Daresta, B.E.; Ielpo, P.; Gungolo, F.; Placentino, C.M.; Paolillo, V.; et al. Chemical characterization of fine particulate matter during peak PM10 episodes in Apulia (South Italy). Atmos. Res. 2008, 90, 313–325. [Google Scholar] [CrossRef]
  43. Cesari, D.; Donateo, A.; Conte, M.; Merico, E.; Giangreco, A.; Giangreco, F.; Contini, D. An inter-comparison of PM2.5 at urban and urban background sites: Chemical characterization and source apportionment. Atmos. Res. 2016, 174–175, 106–119. [Google Scholar] [CrossRef]
  44. Vasilatou, V.; Manousakas, M.; Gini, M.; Diapouli, E.; Scoullos, M.; Eleftheriadis, K. Long Term Flux of Saharan Dust to the Aegean Sea around the Attica Region, Greece. Front. Mar. Sci. 2017, 4, 1–8. [Google Scholar] [CrossRef]
  45. Nava, S.; Becagli, S.; Calzolai, G.; Chiari, M.; Lucarelli, F.; Prati, P.; Traversi, R.; Udisti, R.; Valli, G.; Vecchi, R. Saharan dust impact in central Italy: An overview on three years elemental data records. Atmos. Environ. 2012, 60, 444–452. [Google Scholar] [CrossRef]
  46. Querol, X.; Alastuey, A.; Ruiz, C.R.; Artiñano, B.; Hansson, H.C.; Harrison, R.M.; Buringh, E.; ten Brink, H.M.; Lutz, M.; Bruckmann, P.; et al. Speciation and origin of PM10 and PM2.5 in selected European cities. Atmos. Environ. 2004, 38, 6547–6555. [Google Scholar] [CrossRef]
  47. Dongarrà, G.; Manno, E.; Varrica, D.; Vultaggio, M.; Lombardo, M. Study on ambient concentrations of PM10, PM10-2.5, PM2.5 and gaseous pollutants. Trace elements and chemical speciation of atmospheric particulates. Atmos. Environ. 2010, 44, 5244–5257. [Google Scholar] [CrossRef]
  48. Pastuszka, J.S.; Rogula-Kozlowska, W.; Zajusz-Zubek, E. Characterization of PM10 and PM2.5 and associated heavy metals at the crossroads and urban background site in Zabrze, Upper Silesia, Poland, during the smog episodes. Environ. Monit. Assess. 2010, 168, 613–627. [Google Scholar] [CrossRef] [PubMed]
  49. Ferm, M.; Sjöberg, K. Concentrations and emission factors for PM2.5 and PM10 from road traffic in Sweden. Atmos. Environ. 2015, 119, 211–219. [Google Scholar] [CrossRef]
  50. Kouyoumdjian, H.; Saliba, N.A. Mass concentration and ion composition of coarse and fine particles in an urban area in Beirut: Effect of calcium carbonate on the absorption of nitric and sulfuric acids and the depletion of chloride. Atmos. Chem. Phys. 2006, 6, 1865–1877. [Google Scholar] [CrossRef]
  51. Hug, S. In situ Fourier Transform infrared measurements of sulfate adsorption on hematite in aqueous solutions. J. Colloid Inerface Sci. 1997, 188, 415–422. [Google Scholar] [CrossRef]
  52. Peak, D.; Ford, R.G.; Sparks, D.L. An in situ ATR-FTIR investigation of sulfate bonding mechanisms on Goethite. J. Colloid Interface Sci. 1999, 218, 289–299. [Google Scholar] [CrossRef] [PubMed]
  53. Shaka, H.; Saliba, N. Concentration measurements and chemical composition of PM10-2.5 and PM2.5 at a coastal site in Beirut, Lebanon. Atmos. Environ. 2004, 38, 523–531. [Google Scholar] [CrossRef]
  54. Rodriguez-Navarro, C.; Sebastian, E. Role of particulate matter from vehicle exhaust on porous building stones (limestone) sulfation. Sci. Total Environ. 1996, 187, 79–91. [Google Scholar] [CrossRef]
  55. Varrica, D.; Dongarrà, G.; Sabatino, G.; Monna, F. Inorganic geochemistry of roadway dust from the metropolitan area of Palermo (Italy). Environ. Geol. 2003, 44, 222–230. [Google Scholar] [CrossRef]
  56. Montana, G.; Randazzo, L.; Oddo, I.A.; Valenza, M. The growth of “black crusts” on calcareous building stones in Palermo (Sicily): A first appraisal of anthropogenic and natural sulphur sources. Environ. Geol. 2008, 56, 367–380. [Google Scholar] [CrossRef]
  57. Rahier, H.; Wullaert, B.; Van Mele, B. Influence of the Degree of Dehydroxylation of Kaolinite on the Properties of Aluminosilicate Glasses. J. Therm. Anal. Calorim. 2000, 62, 417–427. [Google Scholar] [CrossRef]
  58. Chou, C.C.K.; Huang, S.H.; Chen, T.K.; Lin, C.Y.; Wang, L.C. Size–segregated characterization of atmospheric aerosols in Taipei during Asian outflow episodes. Atmos. Res. 2005, 75, 89–109. [Google Scholar] [CrossRef]
  59. Coury, C.; Dillner, A.M. A method to quantify organic functional groups and inorganic compounds in ambient aerosols using attenuated total reflectance FTIR spectroscopy and multivariate chemometric techniques. Atmos. Environ. 2008, 42, 5923–5932. [Google Scholar] [CrossRef]
  60. Reff, A.; Turpin, B.J.; Offenberg, J.H.; Weisel, C.P.; Zhang, J.; Morandi, M.; Stock, T.; Colome, S.; Winer, A. A functional group characterization of organic PM 2.5 exposure: Results from the RIOPA study. Atmos. Environ. 2007, 41, 4585–4598. [Google Scholar] [CrossRef]
  61. Coury, C.; Dillner, A.M. ATR-FTIR characterization of organic functional groups and inorganic ions in ambient aerosols at a rural site. Atmos. Environ. 2009, 43, 940–948. [Google Scholar] [CrossRef]
  62. Madejová, J.; Komadel, P. Baseline Studies of the Clay Minerals Society Source Clays: Infrared Methods. Clays Clay Miner. 2001, 49, 410–432. [Google Scholar] [CrossRef]
  63. Davarcioglu, B. Spectral characterization of non-clay minerals found in the clays Central Anatolian-Turkey. Int. J. Phys. Sci. 2011, 6, 511–522. [Google Scholar]
  64. Wilson, M.J. A Handbook of Determinative Methods in Clay Mineralogy; Blackie-Son Ltd.: London, UK, 1987; p. 308. [Google Scholar]
  65. Suárez, M.; García-Romero, E. FTIR spectroscopic study of palygorskite: Influence of the composition of the octahedral sheet. Appl. Clay Sci. 2006, 31, 154–163. [Google Scholar] [CrossRef] [Green Version]
  66. Anton, O.; Rouxhet, P.G. Note on the intercalation of kaolinite, dickite, and halloysite by dimethylsulfoxide. Clays Clay Miner. 1977, 25, 259–263. [Google Scholar] [CrossRef]
  67. Madejová, J. FTIR techniques in clay mineral studies. Vib. Spectrosc. 2003, 31, 1–10. [Google Scholar] [CrossRef]
  68. Farmer, V.C. Transverse and longitudinal crystal modes associated with OH stretching vibrations in single crystals of kaolinite and dickite. Spectrochim. Acta 2000, 56, 927–930. [Google Scholar] [CrossRef]
  69. Cheng, Z.L.; Lam, K.S.; Chan, L.Y.; Wang, T.; Cheng, K.K. Chemical characteristics of aerosols at coastal station in Hong Kong. I. Seasonal variation of major ions, halogens and mineral dusts between 1995 and 1996. Atmos. Environ. 2000, 34, 2771–2783. [Google Scholar] [CrossRef]
  70. Kong, L.; Yang, Y.; Zhang, S.; Zhao, X.; Du, H.; Fu, H.; Zhang, S.; Cheng, T.; Yang, X.; Chen, J.; et al. Observations of linear dependence between sulfate and nitrate in atmospheric particles. J. Geophys. Res. Atmos. 2013, 119, 341–361. [Google Scholar] [CrossRef]
  71. Squizzato, S.; Masiol, M.; Brunelli, A.; Pistollato, S.; Tarabotti, E.; Rampazzo, G.; Pavoni, B. Factors determining the formation of secondary inorganic aerosol: A case study in the Po Valley (Italy). Atmos. Chem. Phys. 2013, 13, 1927–1939. [Google Scholar] [CrossRef]
  72. Baek, B.H.; Aneja, V.P.; Tong, Q. Chemical coupling between ammonia, acid gases, and fine particles. Environ. Pollut. 2004, 129, 89–98. [Google Scholar] [CrossRef] [PubMed]
  73. Huang, X.; Qiu, R.; Chan, C.K.; Kant, P.R. Evidence of high PM2.5 strong acidity in ammonia-rich atmosphere of Guangzhou, China: Transition in pathways of ambient ammonia to form aerosol ammonium at [NH4+]/[SO4 2–] = 1.5. Environ. Res. 2011, 99, 488–495. [Google Scholar] [CrossRef]
  74. Pio, C.A.; Cerqueira, M.A.; Castro, L.M.; Salgueiro, M.L. Sulphur and nitrogen compounds in variable marine/continental air masses at the South-west European coast. Atmos. Environ. 1996, 30, 3115–3127. [Google Scholar] [CrossRef]
Figure 1. Location of study area with sampling sites. BF, Boccadifalco; DB, Di Blasi; GC, Giulio Cesare.
Ijerph 16 02507 g001
Figure 2. Prevailing winds at Palermo during the sampling period.
Ijerph 16 02507 g002
Figure 3. FTIR spectra of (a) suburban PM10 filter (BF station); (b) urban PM10 filter (GC station); and (c) urban PM2.5 filter (DB station). For each spectrum, we also report the spectrum of a blank quartz filter (black line) for comparison.
Ijerph 16 02507 g003
Figure 4. FTIR spectra of urban PM10 (GC, yellow line) and PM2.5 (DB, red line) filters. Blue line is FTIR spectrum of Saharan dust deposited in Palermo.
Ijerph 16 02507 g004
Figure 5. Plot of NO3-+nss–SO42- vs NH4+ ion concentrations. Data expressed in neq/m3.
Ijerph 16 02507 g005
Table 1. Characteristics of PM10 and PM2.5 samples at the three monitoring stations during non-Saharan dust events and Saharan dust events. Mass values expressed in µg/m3. # indicates measurements carried out simultaneously.
November 2008–February 2009
PM10PM2.5
BF stationGC stationDB station #DB station #
N9510810540
Mean16394229
Std.Dev.711116
Median15394330
Min8161313
Max44697440
Q1010262822
Q2512323525
Q7517464933
Q9027535537
Saharan Dust Events
N7784
Mean13015813378
Dev.St89815928
Min67978959
Max261276220120
Table 2. Typical peaks of inorganic and organic molecules identified in filter samples during non-Saharan events and Saharan dust events.
SpeciesFrequency (cm–1) in This StudyFrequency (cm–1) from LiteratureReferences
Non-Saharan Events
SO4 2-603; 615; 670; 1100608; 615; 670; 1100[30,35,36,51,52,53]
CO3 2-713; 730; 877713; 730; 873; 877[53,57,58]
NO3-825; 1356825; 1318–1410; 1350[30,58]
NH4+14141414[50]
C=C1510–15961463–1511–1596[59,61]
C-H1460; 2850; 2920; 29502850–2920; 2800–3000[30,31,34,58,59,60]
Water (OH)1620; 3200–3400; 36201620; 3200–3400; 3620[34,53,62]
Al-O-Si540540[57,58]
Si-O10301030[30,62]
C = O17201720; 1722[34,58]
Saharan Dust Events
O-Si-O423; 463; 520426; 468; 525[63]
SO4 2-603; 615; 670; 1110608; 615; 670; 1100[30,60]
CO3 2-713; 730; 780; 877;1433713; 730; 873; 877[58,62]
Al-O-Si750750[63,64]
Al-Al-OH912910[62,65]
NO3-825; 1356825; 1318–1410; 1350[30,32,58]
NH4+14141414[50]
C = C1510–15961463–1511–1596[59,61]
C-H1460; 2800–30001460; 2850–2920; 2800–3000[30,31,34,58,59]
Water (OH)688; 1620; 1685; 3260–3400; 3620; 3669; 3695688; 1620; 3200–3400; 3620, 3669; 3695[34,62,63,66]
Si-O1010; 10321010; 1030; 1031[30,62,67]
Table 3. Soluble ion concentrations. Data expressed in µg/m3. nss, non-sea salt; ∑TP, total mass of ions; TPM, total particulate matter (µg/m3).
PM10PM2.5
BF stationGC stationDB station
F-0.150.150.17
Cl-1.191.700.64
NO3-2.304.132.91
SO42-2.692.262.49
Na+1.141.470.74
K+0.230.270.23
Mg2+0.200.240.09
Ca2+0.781.601.33
NH4+0.961.321.52
nssSO42-2.442.052.10
ΣTM9.6413.110.1
TPM19.537.029.3

