Development of a Computational Model to Predict Excess Body Fat in Adolescents through Low Cost Variables

 , , and
Abstract
:1. Introduction
2. Materials and Methods
2.1. Construction of The Database
2.2. Sample Calculation
2.3. Data Collect
2.4. Predictor Variables
2.5. Statistical Model
2.6. Performance Analysis
2.7. Statistical Analysis
3. Results
4. Discussion
5. Conclusions
Author Contributions
Funding
Acknowledgments
Conflicts of Interest
References
- Katia, V.C.; Moyses, S.; Maria, C.C.K.; Gabriela, A.A.; Laura, A.B.; Carlos, H.K.; Maurício, T.L.V.; Glória, V.V.; Valeska, C.F.; Adriano, D.; et al. The study of cardiovascular risk in adolescents—ERICA: Rationale, design and sample characteristics of a national survey examining cardiovascular risk factor profile in Brazilian adolescents. BMC Public Health 2015, 15, 94. [Google Scholar]
- Dahl, R.E.; Allen, N.B.; Wilbrecht, L.; Suleiman, A.B. Importance of investing in adolescence from a developmental science perspective. Nature 2018, 554, 441–450. [Google Scholar] [CrossRef] [PubMed]
- Hagani, N.; Moran, M.R.; Caspi, O.; Plaut, P.; Endevelt, R. The Relationships between Adolescents’ Obesity and the Built Environment: Are They City Dependent? Int. J. Environ. Res. Public Health 2019, 16, 1579. [Google Scholar] [CrossRef]
- Reinehr, T. Long-term effects of adolescent obesity: Time to act. Nat. Rev. Endocrinol. 2018, 14, 183. [Google Scholar] [CrossRef] [PubMed]
- Andreoli, A.; Garaci, F.; Cafarelli, F.P.; Guglielmi, G. Body composition in clinical practice. Eur. J. Radiol. 2016, 85, 1461–1468. [Google Scholar] [CrossRef] [PubMed] [Green Version]
- Tewari, N.; Awad, S.; Macdonald, I.A.; Lobo, D.N. A comparison of three methods to assess body composition. Nutrition 2018, 47, 1–5. [Google Scholar] [CrossRef] [PubMed]
- Böhm, A.; Heitmann, B.L. The use of bioelectrical impedance analysis for body composition in epidemiological studies. Eur. J. Clin. Nutr. 2013, 67, S79. [Google Scholar] [CrossRef]
- Dehghan, M.; Merchant, A.T. Is bioelectrical impedance accurate for use in large epidemiological studies? Nutr. J. 2018, 7, 26. [Google Scholar] [CrossRef]
- Ramírez-Vélez, R.; Correa-Bautista, J.; Martínez-Torres, J.; González-Ruíz, K.; González-Jiménez, E.; Valle, J.; Ramírez-Vélez, R. Performance of Two Bioelectrical Impedance Analyses in the Diagnosis of Overweight and Obesity in Children and Adolescents: The FUPRECOL Study. Nutrients 2016, 8, 575. [Google Scholar] [CrossRef]
- Tovar-Galvez, M.I.; González-Jiménez, E.; Martí-García, C.; Schmidt-RioValle, J. Composición corporal en escolares: Comparación entre métodos antropométricos simples e impedancia bioeléctrica. Endocrinol. Diabetes Nutr. 2017, 64, 424–431. [Google Scholar] [CrossRef]
- Von Hurst, P.R.; Walsh, D.C.I.; Conlon, C.A.; Ingram, M.; Kruger, R.; Stonehouse, W. Validity and reliability of bioelectrical impedance analysis to estimate body fat percentage against air displacement plethysmography and dual-energy X-ray absorptiometry. Nutr. Diet. 2016, 73, 197–204. [Google Scholar] [CrossRef]
- Guo, B.; Wu, Q.; Gong, J.; Xiao, Z.; Tang, Y.; Shang, J. Relationships between the lean mass index and bone mass and reference values of muscular status in healthy Chinese children and adolescents. J. Bone Miner. Metab. 2015. [Google Scholar] [CrossRef] [PubMed]
- Laurson, K.R.; Welk, G.J.; Eisenmann, J.C. Diagnostic Performance of BMI Percentiles to Identify Adolescents With Metabolic Syndrome. Pediatrics 2014, 133, 330–338. [Google Scholar] [CrossRef] [PubMed]
- de Oliveira, P.M.; Da Silva, F.A.; Oliveira, R.M.S. Association between fat mass index and fat-free mass index values and cardiovascular risk in adolescents. Revista Paulista de Pediatria (English Edition) 2016, 34, 30–37. [Google Scholar] [CrossRef] [Green Version]
- de Cássia Ribeiro-Silva, R.; Florence, T.; da Conceição-Machado, M.E.P.; Fernandes, G.B.; Couto, R.D. Indicadores antropométricos na predição de síndrome metabólica em crianças e adolescentes: um estudo de base populacional. Rev. Bras. Saúde Matern. Infant. 2014, 14. [Google Scholar] [CrossRef]
- Weber, D.R.; Leonard, M.B.; Zemel, B.S. Body composition analysis in the pediatric population. Pediatr. Endocrinol. Rev. 2012, 10, 130–139. [Google Scholar]
- ANS. Agência Nacional De Saúde Suplementar Diretoria De Normas E Habilitação Dos Produtos Gerência De Monitoramento Assistencial Coordenadoria De Informações Assistenciais. 2017. Available online: http://www.ans.gov.br/images/Manual_de_Diretrizes_para_o_Enfrentamento_da_Obesidade_na_Saúde_Suplementar_Brasileira.pdf (accessed on 19 June 2019).
- Lohman, T.G. Applicability of body composition techniques and constants for children and youths. Exerc. Sport Sci. Rev. 1986, 14, 325–358. [Google Scholar] [CrossRef]
- Lwanga, S.; Lemeshow, S. Sample Size Determination in Health Studies: A Practical Manual; World Health Organization: Geneva, Switzerland, 1991. [Google Scholar] [CrossRef]
- Oliveira MLDE. Estimativa Dos Custos Da Obesidade Para O Sistema Único de Saúde do Brasil. Univ Brasília. 2013. Available online: http://repositorio.unb.br/handle/10482/13323 (accessed on 19 June 2019).
- Farias, E.D.S. Excess weight and associated factors in adolescents. Rev. Nutr. 2012, 25, 229–236. [Google Scholar] [CrossRef]
- Brasil A. Associação Brasileira para o Estudo da Obesidade e da Síndrome Metabólica. Obesidade Mata. 2016. Available online: http://www.abeso.org.br/uploads/downloads/92/57fccc403e5da.pdf (accessed on 29 June 2019).
- Huang, B.X.; Zhu, M.F.; Wu, T.; Zhou, J.Y.; Liu, Y.; Chen, X.L.; Zhou, R.F.; Wang, L.J.; Chen, Y.M.; Zhu, H.L. Neck circumference, along with other anthropometric indices, has an independent and additional contribution in predicting fatty liver disease. PLoS ONE 2015, 10, e0118071. [Google Scholar] [CrossRef]
- Rerksuppaphol, S.; Rerksuppaphol, L. Mid-upper-arm circumference and arm-to-height ratio to identify obesity in school-age children. Clin. Med. Res. 2017, 15, 53–58. [Google Scholar] [CrossRef]
- Salmaso, F.V.; Vigário, P.D.S.; Mendonça, L.M.C.D.; Madeira, M.; Netto, L.V.; Guimarães, M.R.M.; Farias, M.L.F.D. Análise de idosos ambulatoriais quanto ao estado nutricional, sarcopenia, função renal e densidade óssea. Arq. Bras. Endocrinol. Metab. 2014, 58, 226–331. [Google Scholar] [CrossRef]
- Brasil. Ministério da Saude. Orientações para a Coleta e Análise de Dados Antropométricos em Serviços de Saúde: Norma Técnica do Sistema de Vigilância Alimentar e Nutricional - SISVAN; Secretaria de Atenção à Saúde, Departamento de Atenção Básica: Brasília, Brazil, 2011. Available online: http://bvsms.saude.gov.br/bvs/publicacoes/orientacoes_coleta_analise_dados_antropometricos.pdf (accessed on 29 June 2019).
- Onis, M.D. WHO Child Growth Standards based on length/height, weight and age. Acta Pædiatr. 2007, 95. [Google Scholar] [CrossRef]
- Ashwell, M.; Hsieh, S.D. Six reasons why the waist-to-height ratio is a rapid and effective global indicator for health risks of obesity and how its use could simplify the international public health message on obesity. Int. J. Food Sci. Nutr. 2005, 56, 303–307. [Google Scholar] [CrossRef] [PubMed]
- Houtkooper, L.B.; Going, S.B.; Lohman, T.G.; Roche, A.F.; Van Loan, M. Bioelectrical impedance estimation of fat-free body mass in children and youth: A cross-validation study. J. Appl. Physiol. 1992, 72, 366. [Google Scholar] [CrossRef] [PubMed]
- Kyle, U.G.; Bosaeus, I.; De Lorenzo, A.D.; Deurenberg, P.; Elia, M.; Gómez, J.M. Bioelectrical impedance analysis—Part I: Review of principles and methods. Clin. Nutr. 2004, 23, 1226–1243. [Google Scholar] [CrossRef]
- Neves, E.B.; Ripka, W.L.; Ulbricht, L.; Stadnik, A.M.W. Comparison of the fat percentage obtained by bioimpedance, ultrasound and skinfolds in young adults. Rev. Bras. Med. Esporte 2013, 19, 323–327. [Google Scholar] [CrossRef]
- Lohman, T.G. Advances in body composition assessment. Med. Sci. Sport Exerc. 1993, 25, 762. [Google Scholar] [CrossRef]
- Ripka, W.L. Modelos Matemáticos Para Estimativa da Gordura Corporal de Adolescentes Utilizando Dobras Cutâneas, a Partir da Absorciometria de Raios-X de Dupla Energia. Ph.D. Thesis, Universidade Tecnológica Federal do Paraná, Curitiba, Brazil, April 2017. [Google Scholar]
- Jésus, P.; Guerchet, M.; Pilleron, S.; Fayemendy, P.; Maxime Mouanga, A.; Mbelesso, P. Undernutrition and obesity among elderly people living in two cities of developing countries: Prevalence and associated factors in the EDAC study. Clin. Nutr. ESPEN 2017, 21, 40–50. [Google Scholar] [CrossRef]
- Sigulem, D.M.; Devincenzi, M.U.; Lessa, A.C. Diagnosis of the nutritional status of children and adolescents. J. Pediatr. 2000, 76, S275–S284. [Google Scholar] [CrossRef]
- Onis, M.D.; Onyango, A.W.; Borghi, E.; Siyam, A.; Nishida, C.; Siekmann, J. Development of a WHO growth reference for school-aged children and adolescents. Bull. World Health Organ. 2007, 85, 660–667. [Google Scholar] [CrossRef]
- Taylor, R.W.; Jones, I.E.; Williams, S.M.; Goulding, A. Evaluation of waist circumference, waist-to-hip ratio, and the conicity index as screening tools for high trunk fat mass, as measured by dual-energy X-ray absorptiometry, in children aged 3-19 y13. Am. J. Clin. Nutr. 2000, 72, 490–495. [Google Scholar] [CrossRef] [PubMed]
- Savva, S.C.; Tornaritis, M.; Savva, M.E.; Kourides, Y.; Panagi, A.; Silikiotou, N. Waist circumference and waist-to-height ratio are better predictors of cardiovascular disease risk factors in children than body mass index. Int. J. Obes. 2000, 24, 1453–1458. [Google Scholar] [CrossRef] [Green Version]
- Schröder, H.; Ribas, L.; Koebnick, C.; Funtikova, A.; Gomez, S.F.; Fíto, M. Prevalence of abdominal obesity in Spanish children and adolescents. do we need waist circumference measurements in pediatric practice? PLoS ONE 2014, 9, e87549. [Google Scholar] [CrossRef]
- Alencar, M.D.S.S.; Melo, M.T.S.M.; Coê, R.; Meneses, A.V.; Sá, L.D.; Nunes, I.F.D.O.C. Loss of muscle and fat mass after institutionalization: Attention to older. Geriatr. Gerontol. Aging 2015, 9, 150–155. [Google Scholar] [CrossRef]
- de Faria, E.R.; Gontijo, C.A.; Franceschini, S.D.C.C.; Peluzio, M.D.C.G.; Priore, S.E. Body composition and risk for metabolic alterations in female adolescents. Rev. Paul. Pediatr. 2014, 32, 207–215. [Google Scholar] [CrossRef] [PubMed] [Green Version]
- Kroll, C.; Mastroeni, S.S.B.S.; Czarnobay, S.A.; Ekwaru, J.P.; Veugelers, P.J.; Mastroeni, M.F. The accuracy of neck circumference for assessing overweight and obesity: a systematic review and meta-analysis. Ann. Hum. Biol. 2017, 44, 667–677. [Google Scholar] [CrossRef]
- Li, C.; Ford, E.S.; Mokdad, A.H.; Cook, S. Recent Trends in Waist Circumference and Waist-Height Ratio Among US Children and Adolescents. Pediatrics 2006, 118, 1390–1398. [Google Scholar] [CrossRef]
- Pereira, P.F.; de Faria, F.R.; de Faria, E.R.; Hermsdorff, H.H.M.; Peluzio, M.D.C.G.; Franceschini, S.D.C.C.; Priore, S.E. Anthropometric indices to identify metabolic syndrome and hypertriglyceridemic waist phenotype: a comparison between the three stages of adolescence. Rev. Paul. Pediatr. 2015, 33, 194–203. [Google Scholar] [CrossRef]
- Ripka, W.L.; Ulbricht, L.; Gewehr, P.M. Body composition and prediction equations using skinfold thickness for body fat percentage in Southern Brazilian adolescents. PLoS ONE 2017, 12, e0184854. [Google Scholar] [CrossRef]
- Talma, H.; Van Dommelen, P.; Schweizer, J.J.; Bakker, B.; Kist-Van Holthe, J.E.; Chinapaw, J.M.M. Is mid-upper arm circumference in Dutch children useful in identifying obesity? Arch. Dis. Child. 2019, 104, 159–165. [Google Scholar] [CrossRef]
- Coelho-Barros, E.A.; Simões, P.A.; Achcar, J.A.; Martinez, E.Z.; Shimano, A.C. Methods of Estimation in Multiple Linear Regression: Application to Clinical Data. Rev. Colomb. Estad. 2008, 31, 111–129. [Google Scholar]
- Carvalho Junior, W.D.; Filho, B.C.; Chagas, C.D.S.; Bhering, S.B.; Pereira, N.R.; Pinheiro, H.S.K. Multiple linear regression and Random Forest model to estimate soil bulk density in mountainous regions. Pesqui. Agropecu. Bras. 2016, 51, 1428–1437. [Google Scholar] [CrossRef]
- Santos, R.R.; Rosa, E.C.; Rosa, T.; Ferreira, E.A.; Gris, E.F.; de Andrade, R.V. Sedentary Behavior: A Key Component in the Interaction between an Integrated Lifestyle Approach and Cardiac Autonomic Function in Active Young Men. Int. J. Environ. Res. Public Health 2019, 16, 2156. [Google Scholar] [CrossRef]
- Song, Q.; Zheng, Y.J.; Yang, J. Effects of Food Contamination on Gastrointestinal Morbidity: Comparison of Different Machine-Learning Methods. Int. J. Environ. Res. Public Health 2019, 16, 838. [Google Scholar] [CrossRef]
- Akan, R.; Keskin, S.N.; Uzundurukan, S. Multiple Regression Model for the Prediction of Unconfined Compressive Strength of Jet Grout Columns. Procedia Earth Planet. Sci. 2015, 15, 299–303. [Google Scholar] [CrossRef] [Green Version]
- Yadav, S.; Shukla, S. Analysis of k-Fold Cross-Validation over Hold-Out Validation on Colossal Datasets for Quality Classification. In Proceedings of the 6th International Advanced Computing Conference, IACC 2016, Taipei, Taiwan, 12–16 September 2016. [Google Scholar]
- Lopes, M.V.; Barradas Filho, A.O.; Barros, A.K.; Viegas, I.M.A.; Silva, L.C.O.; Marques, E.P. Attesting compliance of biodiesel quality using composition data and classification methods. Neural Comput. Appl. 2019, 31, 539–551. [Google Scholar] [CrossRef]
- Afzal, Z.; Schuemie, M.J.; Van Blijderveen, J.C.; Sen, E.F.; Sturkenboom, M.C.; Kors, J.A. Improving sensitivity of machine learning methods for automated case identification from free-text electronic medical records. BMC Med. Inf. Decis. Mak. 2013, 13, 30. [Google Scholar] [CrossRef]
- Chang, F.; Chen, H.C.; Liu, H.C. Double K-Folds in SVM. In Proceedings of the 9th International Conference on Innovative Mobile and Internet Services in Ubiquitous Computing, IMIS 2015, Santa Cantarina, Brazil, 8–10 July 2015. [Google Scholar]
- Rovini, E.; Maremmani, C.; Moschetti, A.; Esposito, D.; Cavallo, F. Comparative Motor Pre-clinical Assessment in Parkinson’s Disease Using Supervised Machine Learning Approaches. Ann. Biomed. Eng. 2018, 46, 2057–2068. [Google Scholar] [CrossRef]
- Hoo, Z.H.; Candlish, J.; Teare, D. What is an ROC curve? Emerg. Med. J. 2017, 34. [Google Scholar] [CrossRef]
- Das, J.K.; Salam, R.A.; Thornburg, K.L.; Prentice, A.M.; Campisi, S.; Lassi, Z.S. Nutrition in adolescents: physiology, metabolism, and nutritional needs. Ann. NY Acad. Sci. 2017, 1393, 21–33. [Google Scholar] [CrossRef]
- Moraes, M.M.D.; Veiga, G.V.D. Acurácia da gordura corporal e do perímetro da cintura para predizer alterações metabólicas de risco cardiovascular em adolescentes. Arq. Bras. Endocrinol. Metabol. 2014, 58, 341–351. [Google Scholar] [CrossRef]
- Vanderwall, C.; Randall Clark, R.; Eickhoff, J.; Carrel, A.L. BMI is a poor predictor of adiposity in young overweight and obese children. BMC Pediatr. 2017, 17, 135. [Google Scholar] [CrossRef]
- Kyle, U.G.; Earthman, C.P.; Pichard, C.; Coss-Bu, J.A. Body composition during growth in children: limitations and perspectives of bioelectrical impedance analysis. Eur. J. Clin. Nutr. 2015, 69, 1298. [Google Scholar] [CrossRef]
- Brambilla, P.; Bedogni, G.; Moreno, L.A.; Goran, M.I.; Gutin, B.; Fox, K.R. Crossvalidation of anthropometry against magnetic resonance imaging for the assessment of visceral and subcutaneous adipose tissue in children. Int. J. Obes. 2006, 30, 23–30. [Google Scholar] [CrossRef]
- Rerksuppaphol, S.; Rerksuppaphol, L. Waist circumference, waist-to-height ratio and body mass index of thai children: Secular changes and updated reference standards. J. Clin. Diagn. Res. 2014, 8, 5–9. [Google Scholar] [CrossRef]
- Tebar, W.R.; Ritti-Dias, R.M.; Farah, B.Q.; Zanuto, E.F.; Vanderlei, L.C.M.; Christofaro, D.G.D. High blood pressure and its relationship to adiposity in a school-aged population: Body mass index vs waist circumference. Hypertens. Res. 2018, 41, 135. [Google Scholar] [CrossRef]
- Sousa, N.P.S.; Salvador, E.P.; Barros, A.K.; Polisel, C.G.; de Carvalho, W.R.G. Anthropometric predictors of abdominal adiposity in adolescents. J. Exerc. Physiol. Online 2016, 19, 66–76. [Google Scholar]
- Lavrador, M.S.F.; Abbes, P.T.; Escrivão, M.A.M.S.; Taddei, J.A.A.C. Riscos cardiovasculares em adolescentes com diferentes graus de obesidade. Arquivos Brasileiros de Cardiologia 2011, 96, 205–211. [Google Scholar] [CrossRef] [Green Version]
- De Lorenzo, A.; Soldati, L.; Sarlo, F.; Calvani, M.; Di Lorenzo, N.; Di Renzo, L. New obesity classification criteria as a tool for bariatric surgery indication. World J. Gastroenterol. 2016, 22, 681. [Google Scholar] [CrossRef]
- Oliveros, E.; Somers, V.K.; Sochor, O.; Goel, K.; Lopez-Jimenez, F. The Concept of Normal Weight Obesity. Prog. Cardiovasc Dis. 2014, 56, 426–433. [Google Scholar] [CrossRef]
- Frayon, S.; Cavaloc, Y.; Wattelez, G.; Cherrier, S.; Lerrant, Y.; Ashwell, M. Potential for waist-to-height ratio to detect overfat adolescents from a Pacific Island, even those within the normal BMI range. Obes. Res. Clin. Pract. 2018, 12, 351–357. [Google Scholar] [CrossRef]
- Javed, A.; Jumean, M.; Murad, M.H.; Okorodudu, D.; Kumar, S.; Somers, V.K. Diagnostic performance of body mass index to identify obesity as defined by body adiposity in children and adolescents: A systematic review and meta-analysis. Pediatr. Obes. 2015, 10, 234–244. [Google Scholar] [CrossRef]
- Zhang, S.; Tjortjis, C.; Zeng, X.; Qiao, H.; Buchan, I.; Keane, J. Comparing data mining methods with logistic regression in childhood obesity prediction. Inf. Syst. Front. 2009, 11, 449–460. [Google Scholar] [CrossRef]
- Lo, K.; Wong, M.; Khalechelvam, P.; Tam, W. Waist-to-height ratio, body mass index and waist circumference for screening paediatric cardio-metabolic risk factors: A meta-analysis. Obes. Rev. 2016, 17, 1342–1343. [Google Scholar] [CrossRef]


| Attribute | Abbreviation | Unit |
|---|---|---|
| Body Mass | BM | Kg |
| Height | Ht | M |
| Gender | - | - |
| Age | - | years |
| Arm Circumference | AC | cm |
| Waist Circumference | WC | cm |
| Calf Circumference | CC | cm |
| Hip Circumference | HC | cm |
| Variables | Normal BFP * (n = 233) | Elevated BFP * (n = 539) | All # (n = 772) |
|---|---|---|---|
| Ht (m) | 1.67 (1.59−1.75) | 1.62 (1.57−1.68) | 1.64±0.09 |
| BM (kg) | 53.6 (45.7−61.5) | 56.9(50.1−64.3) | 57.18±11.67 |
| Age (years) | 17 (15−17) | 16(15−17) | 15.66±1.72 |
| HC (cm) | 86.5 (82−91) | 92 (86.5−97) | 90.31±8.6 |
| WC (cm) | 66 (62−71) | 69 (65−75) | 69±8.4 |
| AC (cm) | 23 (21−25.5) | 25 (23−28) | 24.9±3.90 |
| CC (cm) | 32 (30−34.7) | 34 (31.5−36) | 33.2±3.9 |
| BFP (%) | 15.7(12.7−19.8) | 33.7 (28.4−39.1) | 28.4±10.23 |
| Gender§ | |||
| Female | 99 | 402 | 501 |
| Male | 134 | 137 | 271 |
| Ethnicity§ | |||
| Caucasian | 53 | 124 | 177 |
| Non-Caucasian | 180 | 415 | 595 |
| Attribute | Beta | p |
|---|---|---|
| Body Mass | −0.12 | 0.018 |
| Height | −6.84 | 0.005 |
| Gender | −11.5 | <0.001 |
| Age | −1.32 | <0.001 |
| Arm Circumference | 0.37 | 0.002 |
| Waist Circumference | 0.31 | <0.001 |
| Calf Circumference | 0.40 | 0.001 |
| Hip Circumference | 0.30 | <0.001 |
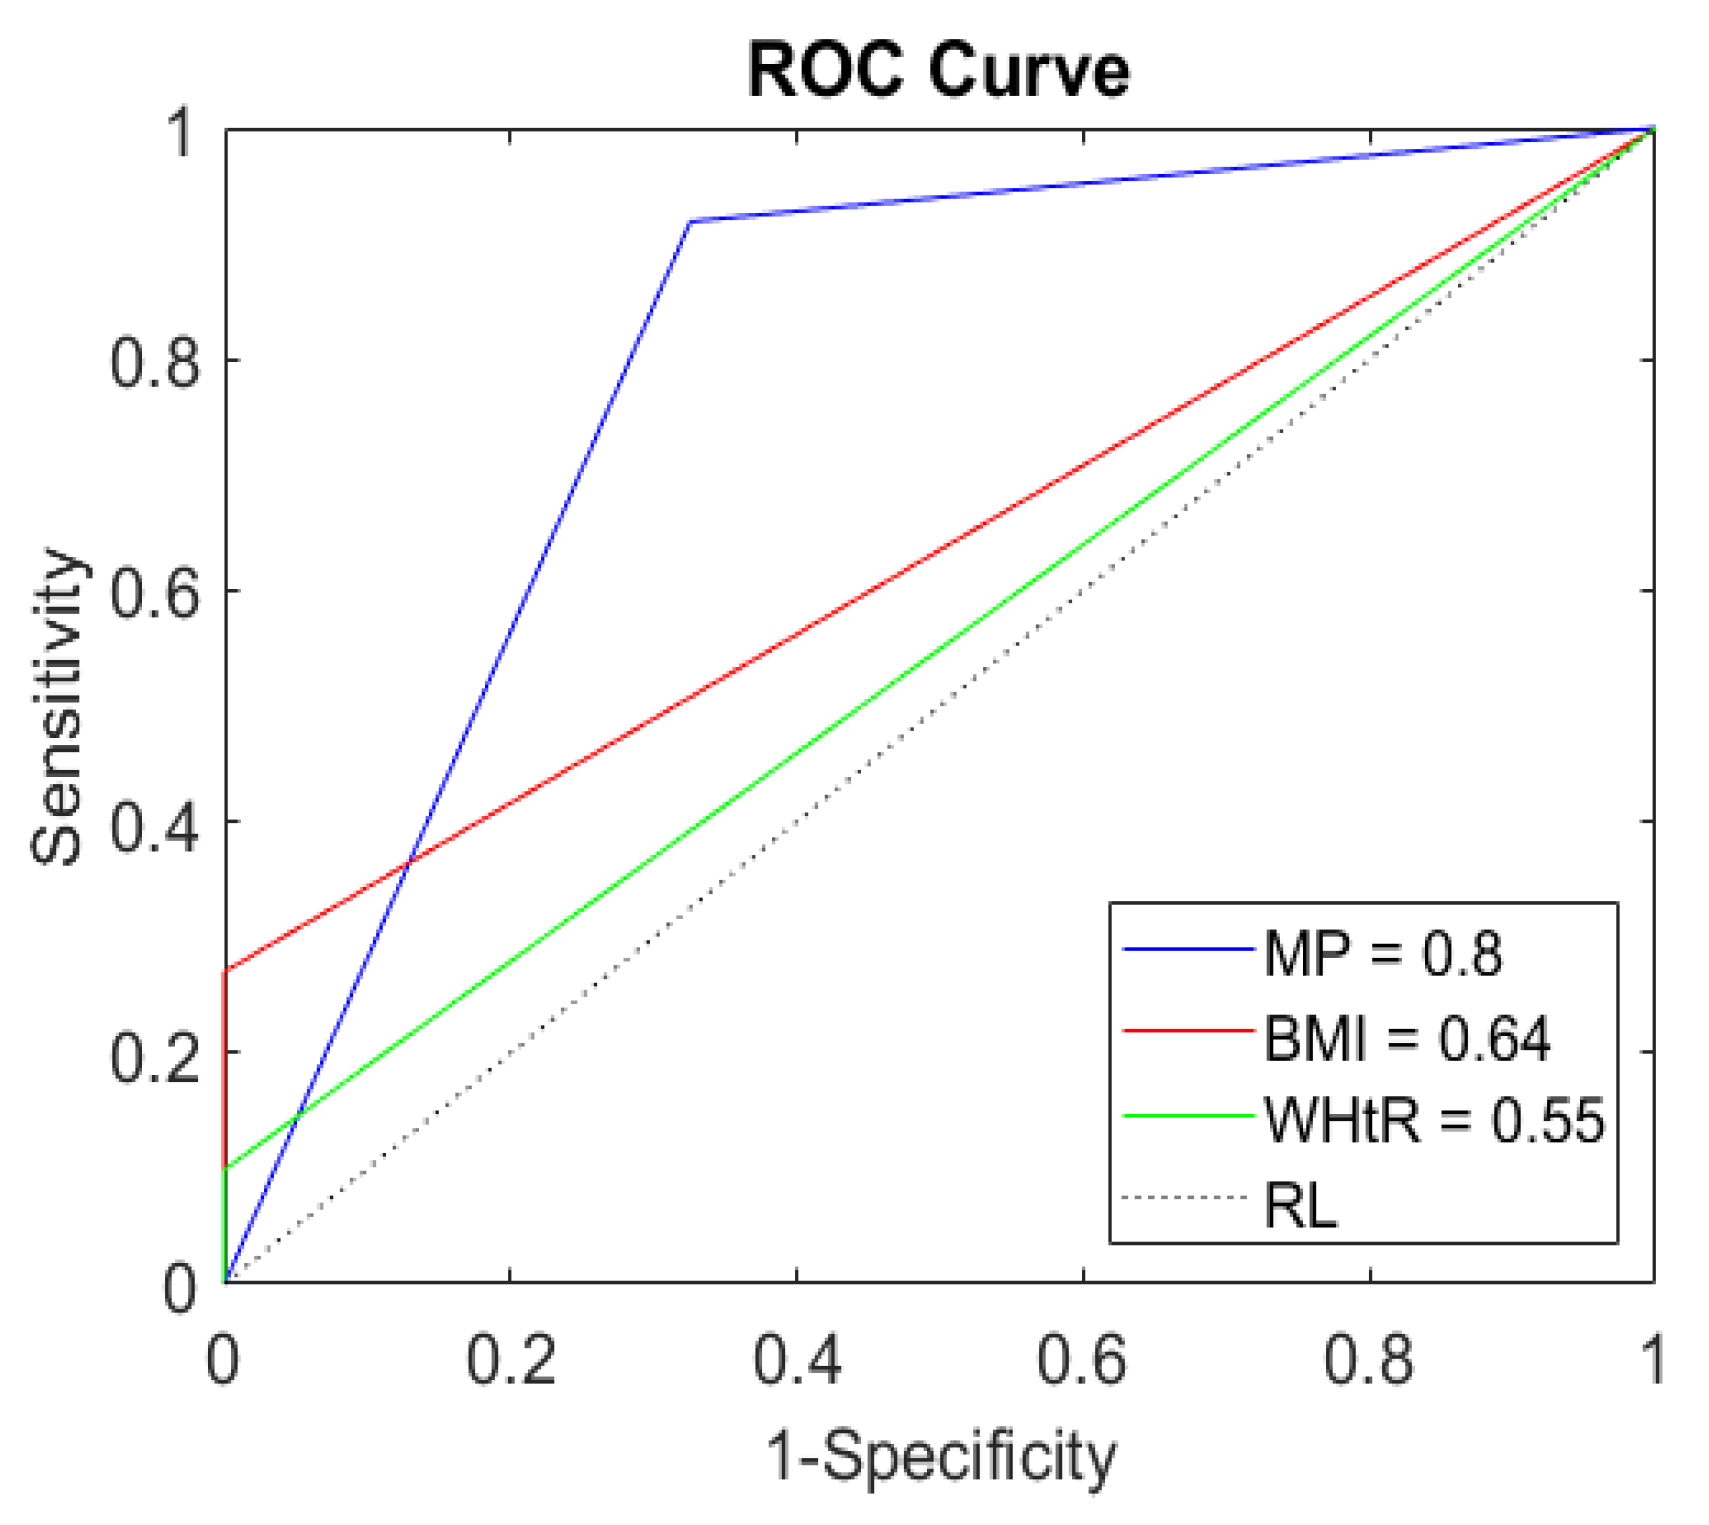
| Indicators | AUROC * (CI 95 %) | Accu (%) | Sens (%) | Spe (%) | TP (%) | TN (%) | FP (%) | FN (%) |
|---|---|---|---|---|---|---|---|---|
| MP | 0.80 (0.70–0.90) | 85.1 | 92 | 67.4 | 66 | 19 | 9 | 6 |
| BMI | 0.64 (0.51–0.77) | 47.4 | 27 | 100 | 19 | 28 | 0 | 53 |
| WHtR | 0.55 (0.36–0.74) | 35.1 | 9.9 | 100 | 7 | 28 | 0 | 65 |
| (%) | Male | Female | ||||||||||
|---|---|---|---|---|---|---|---|---|---|---|---|---|
| 10–14 (n = 13) | 15–19 (n = 44) | 10–14 (n = 17) | 15–19 (n = 80) | |||||||||
| MP | BMI | WHtR | MP | BMI | WHtR | MP | BMI | WHtR | MP | BMI | WHtR | |
| Accu | 84 | 46 | 46 | 82 | 73 | 64 | 76 | 53 | 23 | 89 | 32 | 20 |
| Sens | 75 | 12 | 12 | 80 | 40 | 20 | 100 | 38 | 0 | 96 | 23 | 8 |
| Spe | 100 | 100 | 100 | 83 | 100 | 100 | 0 | 100 | 100 | 40 | 100 | 100 |
| TP | 46 | 8 | 8 | 36 | 18 | 9 | 76 | 29 | 0 | 84 | 20 | 7 |
| TN | 39 | 39 | 39 | 46 | 55 | 55 | 0 | 24 | 24 | 5 | 13 | 13 |
| FP | 0 | 0 | 0 | 9 | 0 | 0 | 24 | 0 | 0 | 7 | 0 | 0 |
| FN | 15 | 53 | 53 | 9 | 27 | 36 | 0 | 47 | 76 | 4 | 67 | 80 |
© 2019 by the authors. Licensee MDPI, Basel, Switzerland. This article is an open access article distributed under the terms and conditions of the Creative Commons Attribution (CC BY) license (http://creativecommons.org/licenses/by/4.0/).
Share and Cite
Sousa, C.M.; Santana, E.; Lopes, M.V.; Lima, G.; Azoubel, L.; Carneiro, É.; Barros, A.K.; Pires, N. Development of a Computational Model to Predict Excess Body Fat in Adolescents through Low Cost Variables. Int. J. Environ. Res. Public Health 2019, 16, 2962. https://0-doi-org.brum.beds.ac.uk/10.3390/ijerph16162962
Sousa CM, Santana E, Lopes MV, Lima G, Azoubel L, Carneiro É, Barros AK, Pires N. Development of a Computational Model to Predict Excess Body Fat in Adolescents through Low Cost Variables. International Journal of Environmental Research and Public Health. 2019; 16(16):2962. https://0-doi-org.brum.beds.ac.uk/10.3390/ijerph16162962
Chicago/Turabian StyleSousa, Carlos Magno, Ewaldo Santana, Marcus Vinicius Lopes, Guilherme Lima, Luana Azoubel, Érika Carneiro, Allan Kardec Barros, and Nilviane Pires. 2019. "Development of a Computational Model to Predict Excess Body Fat in Adolescents through Low Cost Variables" International Journal of Environmental Research and Public Health 16, no. 16: 2962. https://0-doi-org.brum.beds.ac.uk/10.3390/ijerph16162962