Predicting Factors Affecting Adolescent Obesity Using General Bayesian Network and What-If Analysis


Abstract
:1. Introduction
1.1. Factors Affecting Adolescent Obesity
1.2. Data Mining for Predicting Obesity
1.3. General Bayesian Network (GBN) and What-If Analysis
2. Methodology
2.1. Procedure
2.2. Dataset
2.3. Data Pre-Processing
3. Results
3.1. Performance Comparison of GBN with Other Classifiers
3.2. Chosen Factors for What-If Analysis
3.3. What-If Analysis
4. Discussion
4.1. Implications
4.2. Limitations and Future Recommendations
Author Contributions
Funding
Conflicts of Interest
Appendix A

| Revised Attributes | Original Attributes | Type | Description | Source |
|---|---|---|---|---|
| Region | CTYPE | Nominal | City type (County, Big city, Small city) | Lee, Kang, Kim, Son, Lee and Ham [4] Park and Song [1] Jang, Oh, Kim and Shin [3] |
| Academic_Performance | E_S_RCRD | Academic performance | ||
| Pressure | M_STR | How often do you feel under pressure? | ||
| Suicide_Thought | M_SUI_CON | In the last 12 months, have you ever had suicide thought? | ||
| Sleeping_Quality | M_SLP_EN | In the last 7 days, do you think that sleeping time is sufficient? | ||
| Drinking | DRINKING | Have you ever had a drink? | ||
| Smoking | SMOKING | Have you ever smoked cigarettes? | ||
| Education_Father | E_EDU_F | Father’s educational level | Lee, Kang, Kim, Son, Lee and Ham [4] | |
| Education_Mother | E_EDU_M | Mother’s educational level | ||
| Wealth | E_SES | Family economic level | Jang, Oh, Kim and Shin [3] | |
| Pocket_Money (KRW) | E_ALLWN | Average pocket money per week | ||
| Healthy_Eating | F_BR | Numeric | During the last 7 days, how many days did you eat breakfast? | Lee, Kang, Kim, Son, Lee and Ham [4] Park and Song [1] Jang, Oh, Kim and Shin [3] |
| F_FRUIT | During the last 7 days, how often did you eat fruit? | |||
| F_VEG | During the last 7 days, how often did you eat vegetables? | |||
| F_MILK | During the last 7 days, how often did you drink milk? | |||
| Unhealthy_Eating | F_FASTFOOD | During the last 7 days, how often did you eat fast food? | ||
| F_INSTND | During the last 7 days, how often did you eat instant noodles? | |||
| F_CRACK | During the last 7 days, how often did you eat snake? | |||
| F_SODA | During the last 7 days, how often did you drink carbonated drinks? | |||
| F_CAFFEINE | During the last 7 days, how often did you drink coffee or energy drinks? | |||
| F_SWDRINK | During the last 7 days, how often did you drink sweet drinks? | |||
| Exercise_60 min | PA_TOT | In the past 7 days, the number of days that take more than 60 min of exercise. | Lee, Kang, Kim, Son, Lee and Ham [4] Park and Song [1] Jang, Oh, Kim and Shin [3] | |
| Exercise_20 min | PA_VIG | In the past 7 days, the number of days that take more than 20 min of strenuous exercise. | ||
| Sitting_Time_Study (min) | PA_SWD_S | In the last 7 days, how many hours do you spend sitting for study per day on weekday? | Lee, Kang, Kim, Son, Lee and Ham [4] | |
| PA_SWK_S | In the last 7 days, how many hours do you spend sitting for study per day on weekend? | |||
| Smartphone_Time (min) | INT_SP_WD | In the last 7 days, how many hours do you spend using smartphone per day on weekday? | Park and Song [1] | |
| INT_SP_WK | In the last 7 days, how many hours do you spend using smartphone per day on weekend? | |||
| Smartphone_Service | INT_SP_ITEM | Nominal | During the last 30 days, which kind of smartphone service is mainly used? | |
| Obesity_Level | Obesity | >=95th BMI Percentile | Lee, Kang, Kim, Son, Lee and Ham [4] Park and Song [1] | |
| Overweight | 85th~95th BMI Percentile | |||
| Normal | 5th~85th BMI Percentile | |||
| Underweight | <=5th BMI Percentile |
References
- Park, M.H.; Song, H.Y. Relationship among the Korean Adolescents Obesity, Health Behavior and Smart phone Usage. J. Korean Public Health Nurs. 2019, 33, 47–58. [Google Scholar]
- Ebbeling, C.B.; Pawlak, D.B.; Ludwig, D.S. Childhood obesity: Public-health crisis, common sense cure. Lancet 2002, 360, 473–482. [Google Scholar] [CrossRef]
- Jang, M.N.; Oh, S.-M.; Kim, H.S.; Shin, H. The Relationship between Quality of Sleep and Body Mass Index of Adolescents: Focusing on Mediating Effect of Physical Activity, Dietary Habit, and Academic Stress and Moderating Effect of Gender. J. Korean Public Health Nurs. 2019, 33, 85–97. [Google Scholar]
- Lee, J.Y.; Kang, S.N.; Kim, S.A.; Son, D.M.; Lee, B.G.; Ham, O.K. Factors Influencing Obesity among Rural and Urban Adolescent: Analysis of 2013 Korean Youth Health Behavior Survey. J. Korean Public Health Nurs. 2019, 33, 73–84. [Google Scholar]
- Zhang, S.; Tjortjis, C.; Zeng, X.; Qiao, H.; Buchan, I.; Keane, J. Comparing data mining methods with logistic regression in childhood obesity prediction. Inf. Syst. Front. 2009, 11, 449–460. [Google Scholar] [CrossRef]
- Chung, D.; Lee, K.C.; Seong, S.C. General Bayesian network approach to health informatics prediction: Emphasis on performance comparison. Procedia Soc. Behav Sci 2013, 81, 465–468. [Google Scholar] [CrossRef]
- Harding, N.J. Application of Bayesian Networks to Problems within Obesity Epidemiology. Ph.D. Thesis, The University of Manchester, Manchester, UK, 2011. [Google Scholar]
- Kim, H.-K.; Kim, J.-H.; Jung, H.-K. A comparison of health related habits, nutrition knowledge, dietary habits, and blood composition according to gender and weight status of college students in Ulsan. Korean J. Nutr. 2012, 45, 336–346. [Google Scholar] [CrossRef]
- Lee, J.H.; Yi, K.H. An analysis of the determinants of adolescents’ health inequality in Korea: A view from the students’ selfrated health condition and obesity. Korea Educ. Rev. 2015, 21, 217–243. [Google Scholar]
- Jee, S.H.; Sull, J.W.; Park, J.; Lee, S.-Y.; Ohrr, H.; Guallar, E.; Samet, J.M. Body-mass index and mortality in Korean men and women. N. Engl. J. Med. 2006, 355, 779–787. [Google Scholar] [CrossRef]
- Kenney, E.L.; Gortmaker, S.L. United States adolescents’ television, computer, videogame, smartphone, and tablet use: Associations with sugary drinks, sleep, physical activity, and obesity. J. Pediatr. 2017, 182, 144–149. [Google Scholar] [CrossRef]
- Sallis, J.; Owen, N.; Fisher, E. Ecological models of health behavior. In Health Behavior and Health Education: Theory, Research, and Practice; Glanz, K., Rimer, B.K., Viswanath, K., Eds.; Jossey-Bass: San Francisco, CA, USA, 2008. [Google Scholar]
- Hill, J.O.; Peters, J.C. Environmental contributions to the obesity epidemic. Science 1998, 280, 1371–1374. [Google Scholar] [CrossRef] [PubMed]
- Burke, V.; Beilin, L.J.; Durkin, K.; Stritzke, W.G.; Houghton, S.; Cameron, C.A. Television, computer use, physical activity, diet and fatness in Australian adolescents. Int. J. Pediatr. Obes. 2006, 1, 248–255. [Google Scholar] [CrossRef] [PubMed]
- Moore, J.; Haemer, M.; Mirza, N.Z.; Weatherall, Y.; Han, J.; Mangarelli, C.; Hawkins, M.J.; Xanthakos, S.; Siegel, R. Pilot Testing of a Patient Decision Aid for Adolescents with Severe Obesity in US Pediatric Weight Management Programs within the COMPASS Network. Int. J. Environ. Res. Public Health 2019, 16, 1776. [Google Scholar] [CrossRef] [PubMed]
- Ievers-Landis, C.E.; Dykstra, C.; Uli, N.; O’Riordan, M.A. Weight-Related Teasing of Adolescents Who Are Primarily Obese: Roles of Sociocultural Attitudes Towards Appearance and Physical Activity Self-Efficacy. Int. J. Environ. Res. Public Health 2019, 16, 1540. [Google Scholar] [CrossRef]
- Zanganeh, M.; Adab, P.; Li, B.; Frew, E. A systematic review of methods, study quality, and results of economic evaluation for childhood and adolescent obesity intervention. Int. J. Environ. Res. Public Health 2019, 16, 485. [Google Scholar] [CrossRef]
- Galan-Lopez, P.; Ries, F.; Gisladottir, T.; Domínguez, R.; Sánchez-Oliver, A. Healthy lifestyle: Relationship between Mediterranean diet, body composition and physical fitness in 13 to 16-years old Icelandic students. Int. J. Environ. Res. Public Health 2018, 15, 2632. [Google Scholar] [CrossRef]
- Brewis, A.; Bruening, M. Weight shame, social connection, and depressive symptoms in late adolescence. Int. J. Environ. Res. Public Health 2018, 15, 891. [Google Scholar] [CrossRef]
- Gustafson, A.; Jilcott, P.S.; McDonald, J.; Ford, H.; Connelly, P.; Gillespie, R.; Liu, E.; Bush, H.; Brancato, C.; Babatande, T. Direct effects of the home, school, and consumer food environments on the association between food purchasing patterns and dietary intake among rural adolescents in Kentucky and North Carolina, 2017. Int. J. Environ. Res. Public Health 2017, 14, 1255. [Google Scholar] [CrossRef]
- Fayyad, U.; Piatetsky-Shapiro, G.; Smyth, P. From data mining to knowledge discovery in databases. AI Mag. 1996, 17, 37. [Google Scholar]
- Bhattarai, A.; Rus, V.; Dasgupta, D. Classification of clinical conditions: A case study on prediction of obesity and its co-morbidities. In Proceedings of the 10th International Conference on Intelligent Text Processing and Computational Linguistics (CICLING’09), Memphis, TN, USA, 24–28 February 2009. [Google Scholar]
- Adnan, M.H.B.M.; Husain, W.; Damanhoori, F. A survey on utilization of data mining for childhood obesity prediction. In Proceedings of the 8th Asia-Pacific Symposium on Information and Telecommunication Technologies, Kuching, Malaysia, 15–18 June 2010; pp. 1–6. [Google Scholar]
- Codecasa, D.; Stella, F. Learning continuous time Bayesian network classifiers. Int. J. Approx. Reason. 2014, 55, 1728–1746. [Google Scholar] [CrossRef]
- Dunstan, J.; Aguirre, M.; Bastías, M.; Nau, C.; Glass, T.A.; Tobar, F. Predicting nationwide obesity from food sales using machine learning. Health Inform. J. 2019. [Google Scholar] [CrossRef]
- Bouckaert, R.R. Bayesian network classifiers in weka. 1 September 2004. Available online: https://researchcommons.waikato.ac.nz/bitstream/handle/10289/85/content.pdf?sequence=1 (accessed on 14 August 2019).
- Nguyen, T.T.T.; Nguyen, T.T.; Sharma, R.; Liew, A.W.C. A Lossless Online Bayesian Classifier. Inf. Sci. 2019, 489, 1–17. [Google Scholar] [CrossRef]
- Perkusich, M.; Soares, G.; Almeida, H.; Perkusich, A. A procedure to detect problems of processes in software development projects using Bayesian networks. Expert Syst. Appl. 2015, 42, 437–450. [Google Scholar] [CrossRef]
- Li, G.; Yao, L.; Zhang, J.; Li, X.; Dang, S.; Zeng, K.; Zhou, Y.; Gao, F. Tumor-suppressive microRNA-34a inhibits breast cancer cell migration and invasion via targeting oncogenic TPD52. Tumor Biol. 2016, 37, 7481–7491. [Google Scholar] [CrossRef] [PubMed]
- Ropero, R.; Renooij, S.; Van der Gaag, L. Discretizing environmental data for learning Bayesian-network classifiers. Ecol. Model. 2018, 368, 391–403. [Google Scholar] [CrossRef]
- Alonso-Montesinos, J.; Martínez-Durbán, M.; del Sagrado, J.; del Águila, I.; Batlles, F. The application of Bayesian network classifiers to cloud classification in satellite images. Renew. Energy 2016, 97, 155–161. [Google Scholar] [CrossRef]
- Madden, M.G. On the classification performance of TAN and general Bayesian networks. In Proceedings of the International Conference on Innovative Techniques and Applications of Artificial Intelligence, Cambridge, UK, 9–11 December 2008; pp. 3–16. [Google Scholar]
- Pearl, J. Probabilistic Reasoning in Intelligent Systems: Networks of Plausible Inference; Elsevier: Amsterdam, The Netherlands, 2014. [Google Scholar]
- Kaufmann, D.; Parbhoo, S.; Wieczorek, A.; Keller, S.; Adametz, D.; Roth, V. Bayesian markov blanket estimation. In Proceedings of the 19th International Conference on Artificial Intelligence and Statistics, Cadiz, Spain, 9–11 May 2016; pp. 333–341. [Google Scholar]
- Golfarelli, M.; Rizzi, S.; Proli, A. Designing what-if analysis: Towards a methodology. In Proceedings of the 9th ACM international workshop on Data warehousing and OLAP, Arlington, VA, USA, 10 November 2006; pp. 51–58. [Google Scholar]
- Philippakis, A.S. Structured what if analysis in DSS models. In Proceedings of the 1988 Twenty-First Annual Hawaii International Conference on System Sciences. Volume III: Decision Support and Knowledge Based Systems Track, Kailua-Kona, HI, USA, 5–8 January 1988; pp. 366–370. [Google Scholar]
- Oakley, J.E.; O’Hagan, A. Probabilistic sensitivity analysis of complex models: A Bayesian approach. J. R. Stat. Soc. Ser. B 2004, 66, 751–769. [Google Scholar] [CrossRef]
- Nadathur, S.G.; Warren, J.R. Emergency department triaging of admitted stroke patients—A Bayesian Network analysis. Health Inf. J. 2011, 17, 294–312. [Google Scholar] [CrossRef]
- Sokolova, M.; Japkowicz, N.; Szpakowicz, S. Beyond accuracy, F-score and ROC: A family of discriminant measures for performance evaluation. In Proceedings of the Australasian joint conference on artificial intelligence, Hobart, Australia, 4–8 December 2006; pp. 1015–1021. [Google Scholar]
- Powers, D.M. Evaluation: From precision, recall and F-measure to ROC, informedness, markedness and correlation. 15 December 2011. Available online: https://dspace2.flinders.edu.au/xmlui/handle/2328/27165 (accessed on 12 August 2019).
- Brown, I.; Mues, C. An experimental comparison of classification algorithms for imbalanced credit scoring data sets. Expert Syst. Appl. 2012, 39, 3446–3453. [Google Scholar] [CrossRef]
- Sasikala, B.; Biju, V.G.; Prashanth, C. Kappa and accuracy evaluations of machine learning classifiers. In Proceedings of the 2017 2nd IEEE International Conference on Recent Trends in Electronics, Information & Communication Technology (RTEICT), Bangalore, India, 19–20 May 2017; pp. 20–23. [Google Scholar]
- Abdelaal, M.M.A.; Sena, H.A.; Farouq, M.W.; Salem, A.-B.M. Using data mining for assessing diagnosis of breast cancer. In Proceedings of the International Multiconference on Computer Science and Information Technology, Wisla, Poland, 18–20 October 2010; pp. 11–17. [Google Scholar]
- Kim, C.; Costello, F.J.; Lee, K.C. Integrating Qualitative Comparative Analysis and Support Vector Machine Methods to Reduce Passengers’ Resistance to Biometric E-Gates for Sustainable Airport Operations. Sustainability 2019, 11, 5349. [Google Scholar] [CrossRef]
- Golden, N.H.; Schneider, M.; Wood, C. Preventing obesity and eating disorders in adolescents. Pediatrics 2016, 138, e20161649. [Google Scholar] [CrossRef] [PubMed]
- Song, M.; Choi, J.-Y.; Yang, J.J.; Sung, H.; Lee, Y.; Lee, H.-W.; Kong, S.-H.; Lee, H.-J.; Kim, H.-H.; Kim, S.G. Obesity at adolescence and gastric cancer risk. Cancer Causes Control 2015, 26, 247–256. [Google Scholar] [CrossRef] [PubMed]
- Must, A.; Strauss, R.S. Risks and consequences of childhood and adolescent obesity. Int. J. Obes. 1999, 23, S2. [Google Scholar] [CrossRef] [PubMed]
- Lobstein, T.; Jackson-Leach, R.; Moodie, M.L.; Hall, K.D.; Gortmaker, S.L.; Swinburn, B.A.; James, W.P.T.; Wang, Y.; McPherson, K. Child and adolescent obesity: Part of a bigger picture. Lancet 2015, 385, 2510–2520. [Google Scholar] [CrossRef]
- Li, M.; Xue, H.; Jia, P.; Zhao, Y.; Wang, Z.; Xu, F.; Wang, Y. Pocket money, eating behaviors, and weight status among Chinese children: The childhood obesity study in China mega-cities. Prev. Med. 2017, 100, 208–215. [Google Scholar] [CrossRef] [PubMed]
- Paiva, T.; Gaspar, T.; Matos, M.G. Sleep deprivation in adolescents: Correlations with health complaints and health-related quality of life. Sleep Med. 2015, 16, 521–527. [Google Scholar] [CrossRef]
- Marseglia, L.; Manti, S.; D’Angelo, G.; Nicotera, A.; Parisi, E.; Di Rosa, G.; Gitto, E.; Arrigo, T. Oxidative stress in obesity: A critical component in human diseases. Int. J. Mol. Sci. 2015, 16, 378–400. [Google Scholar] [CrossRef] [Green Version]
- Kong, I.G.; Lee, H.-J.; Kim, S.Y.; Sim, S.; Choi, H.G. Physical activity, study sitting time, leisure sitting time, and sleep time are differently associated with obesity in Korean adolescents: A population-based study. Medicine 2015, 94, e1965. [Google Scholar] [CrossRef]
- Kim, S.-E.; Kim, J.-W.; Jee, Y.-S. Relationship between smartphone addiction and physical activity in Chinese international students in Korea. J. Behav. Addict. 2015, 4, 200–205. [Google Scholar] [CrossRef]
- Mauskopf, S.S.; O’Leary, A.K.; Banihashemi, A.; Weiner, M.; Cookston, J.T. Divorce and eating behaviors: A 5-day within-subject study of preadolescent obesity risk. Child. Obes. 2015, 11, 122–129. [Google Scholar] [CrossRef]
- van den Berk-Clark, C.; Secrest, S.; Walls, J.; Hallberg, E.; Lustman, P.J.; Schneider, F.D.; Scherrer, J.F. Association between posttraumatic stress disorder and lack of exercise, poor diet, obesity, and co-occuring smoking: A systematic review and meta-analysis. Health Psychol. 2018, 37, 407. [Google Scholar] [CrossRef] [PubMed]
- Wang, Y.; Wang, L.; Xue, H.; Qu, W. A review of the growth of the fast food industry in China and its potential impact on obesity. Int. J. Environ. Res. Public Health 2016, 13, 1112. [Google Scholar] [CrossRef] [PubMed]


| Age | Gender | BMI Percentile | ||
|---|---|---|---|---|
| 5th | 85th | 95th | ||
| 12 | Boy | 15.35 | 23.32 | 26.35 |
| Girl | 15.20 | 22.22 | 24.77 | |
| 13 | Boy | 15.82 | 23.93 | 27.02 |
| Girl | 15.71 | 22.83 | 25.38 | |
| 14 | Boy | 16.32 | 24.40 | 27.48 |
| Girl | 16.25 | 23.31 | 25.83 | |
| 15 | Boy | 16.83 | 24.74 | 27.77 |
| Girl | 16.78 | 23.67 | 26.11 | |
| 16 | Boy | 17.33 | 24.95 | 27.89 |
| Girl | 17.27 | 23.89 | 26.24 | |
| 17 | Boy | 17.80 | 25.08 | 27.89 |
| Girl | 17.68 | 23.99 | 26.24 | |
| 18 | Boy | 18.20 | 25.18 | 27.85 |
| Girl | 17.96 | 23.98 | 26.15 | |
| Accuracy | F-Measure | AUC | |
|---|---|---|---|
| GBN-MB | 53.703% | 0.535 | 0.758 |
| GBN | 52.579% | 0.523 | 0.743 |
| LR | 46.689% | 0.436 | 0.688 |
| DT | 46.779% | 0.467 | 0.632 |
| SVM | 45.431% | 0.134 | 0.661 |
| NN | 50.535% | 0.495 | 0.723 |
| NB | 45.627% | 0.451 | 0.674 |
| BA | 52.588% | 0.521 | 0.742 |
| RSS | 51.776% | 0.489 | 0.736 |
| RF | 52.570% | 0.518 | 0.743 |
| Nodes | Mutual Information | Entropy (%) | Variance of Beliefs |
|---|---|---|---|
| Obesity_Level | 1.80976 | 100 | 0.4895308 |
| Pocket_Money (KRW) | 0.22196 | 12.3 | 0.0246610 |
| Sleeping_Quality | 0.03398 | 1.89 | 0.0025873 |
| Sitting_Time_Study (min) | 0.02494 | 1.38 | 0.0027259 |
| Academic_Performance | 0.02423 | 1.35 | 0.0014365 |
| Wealth | 0.02413 | 1.34 | 0.0017131 |
| Pressure | 0.01420 | 0.766 | 0.0010950 |
| Education_Mother | 0.00766 | 0.425 | 0.0007854 |
| Smartphone_Service | 0.00645 | 0.357 | 0.0006391 |
| Smartphone_Time (min) | 0.00478 | 0.283 | 0.0001776 |
| Education_Father | 0.00396 | 0.221 | 0.0003561 |
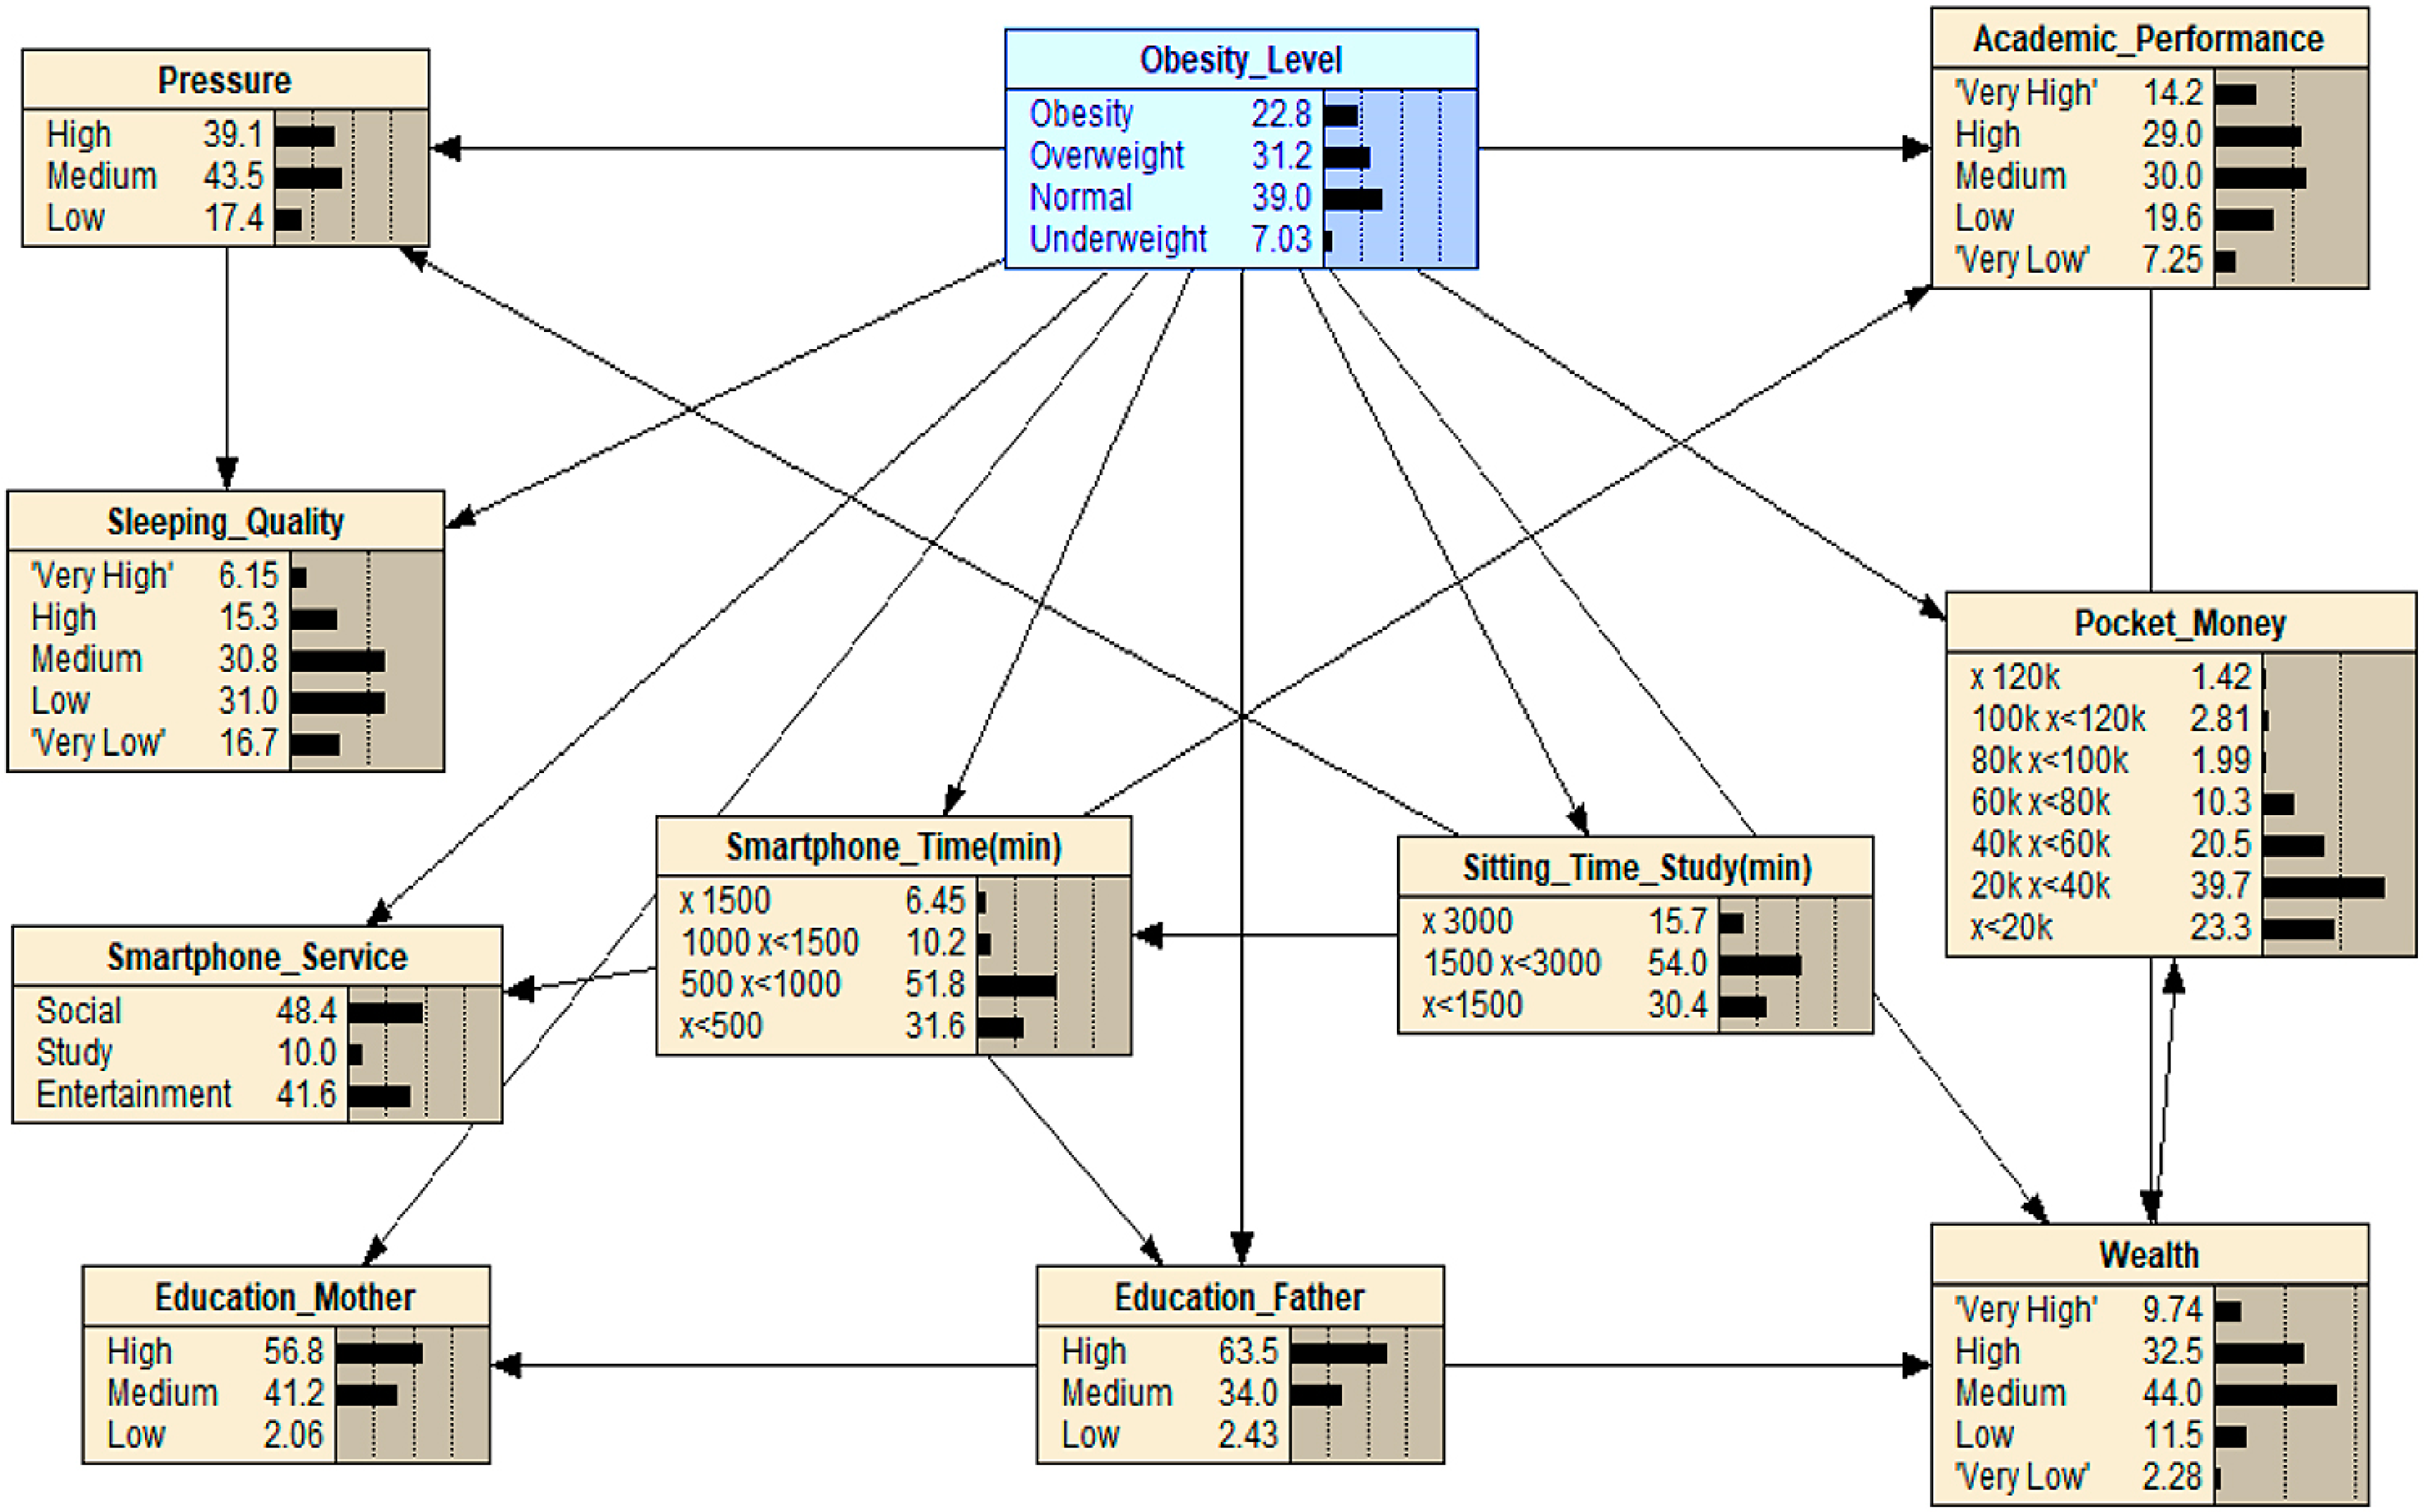
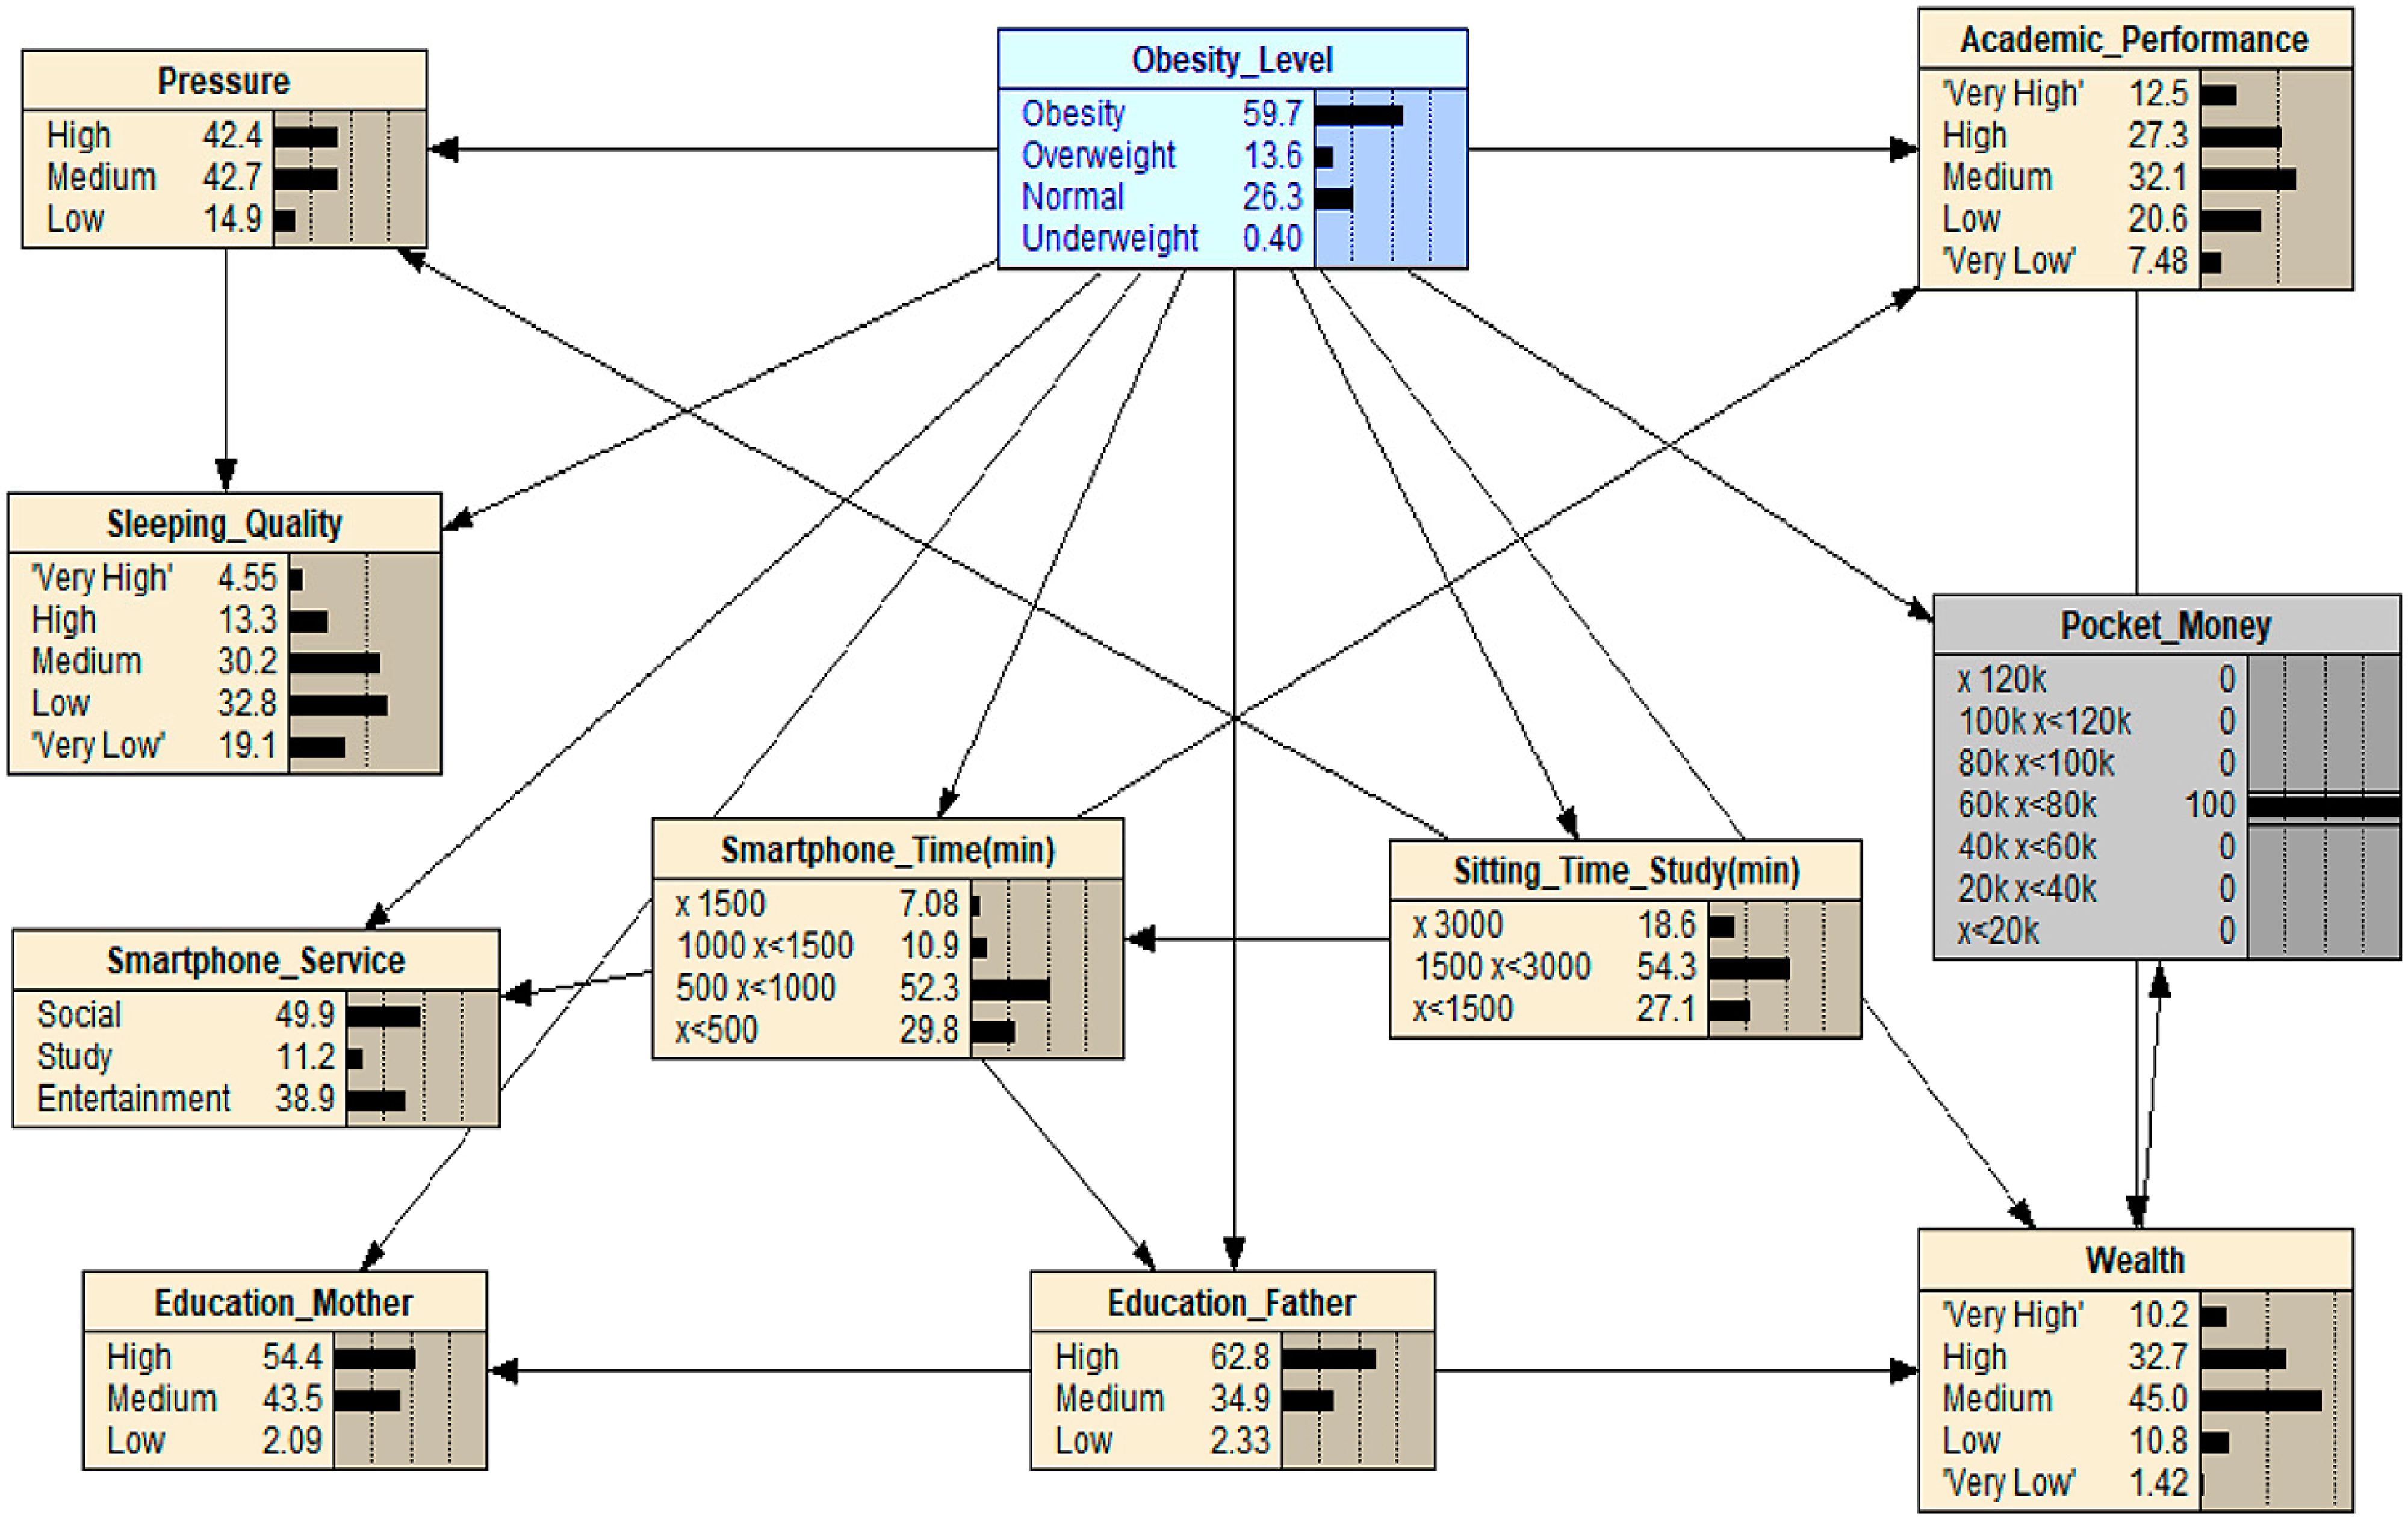
| What-If Analysis Scenario | Obesity Result (%) | |
|---|---|---|
| Scenario 1 | Select the middle level of Pocket_Money | 22.8 → 59.7 |
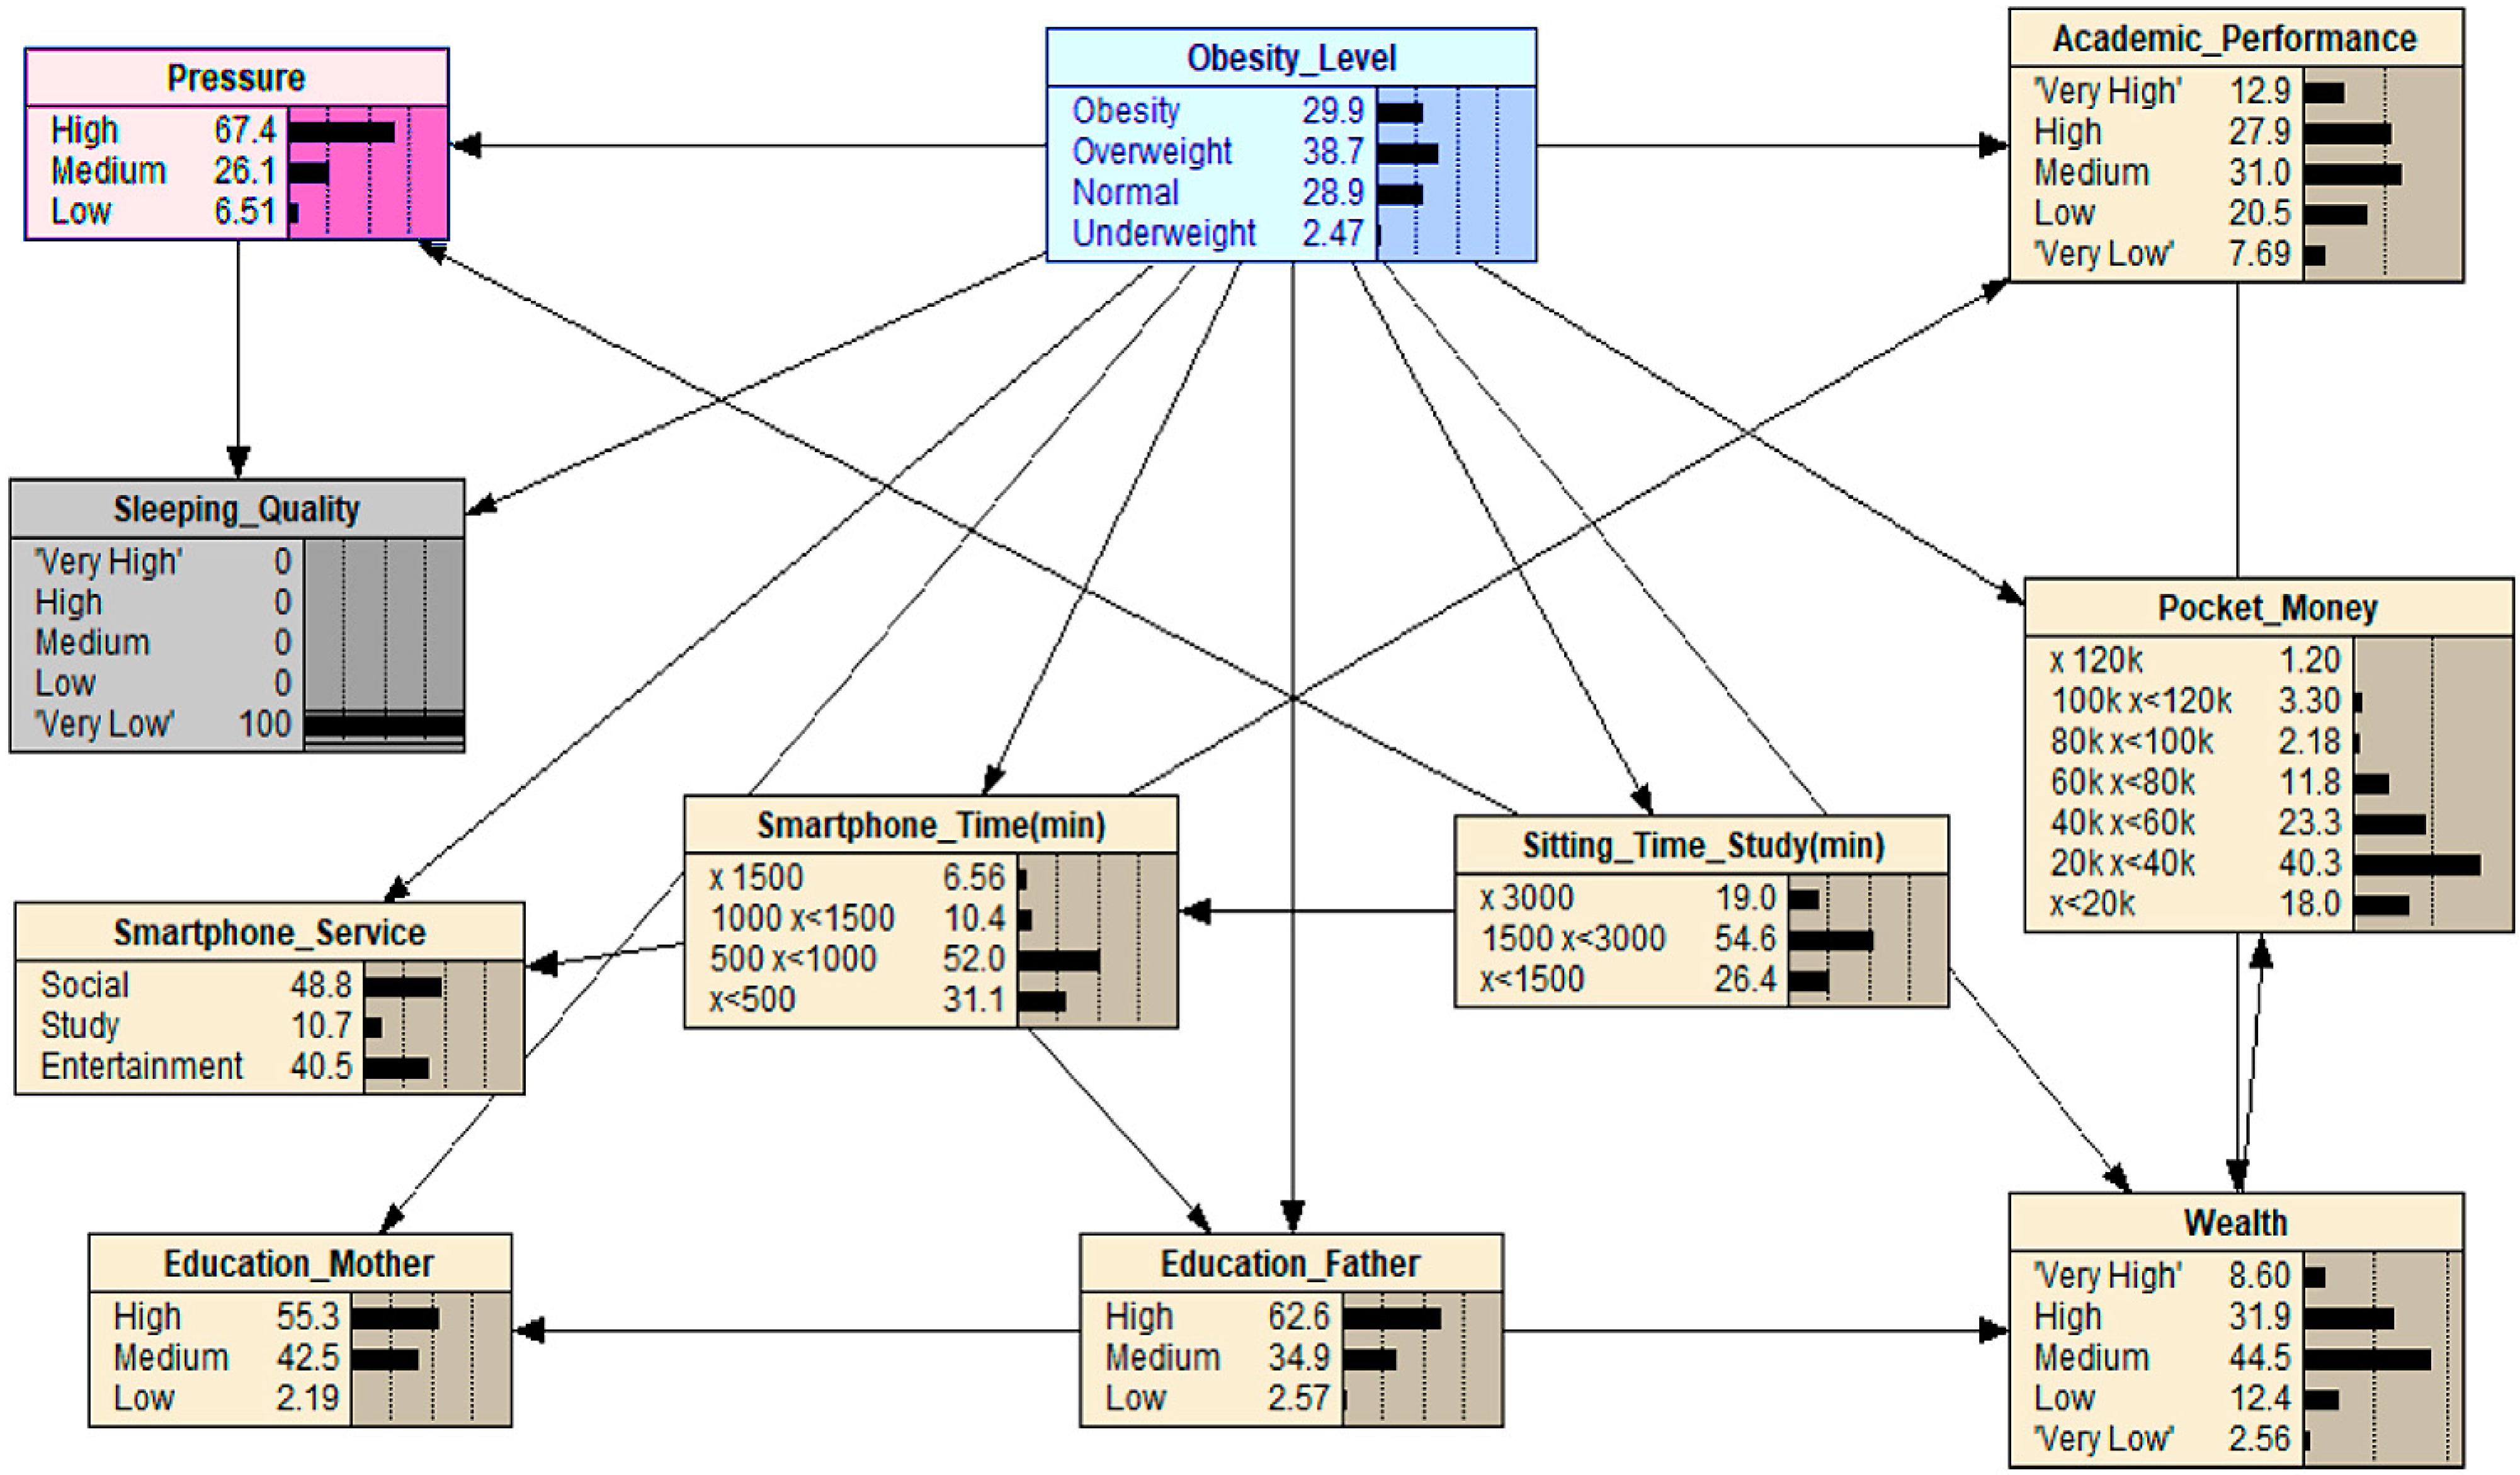
| Scenario 2 | Set Sleeping_Quality to ‘Very low’ | 22.8 → 29.9 |
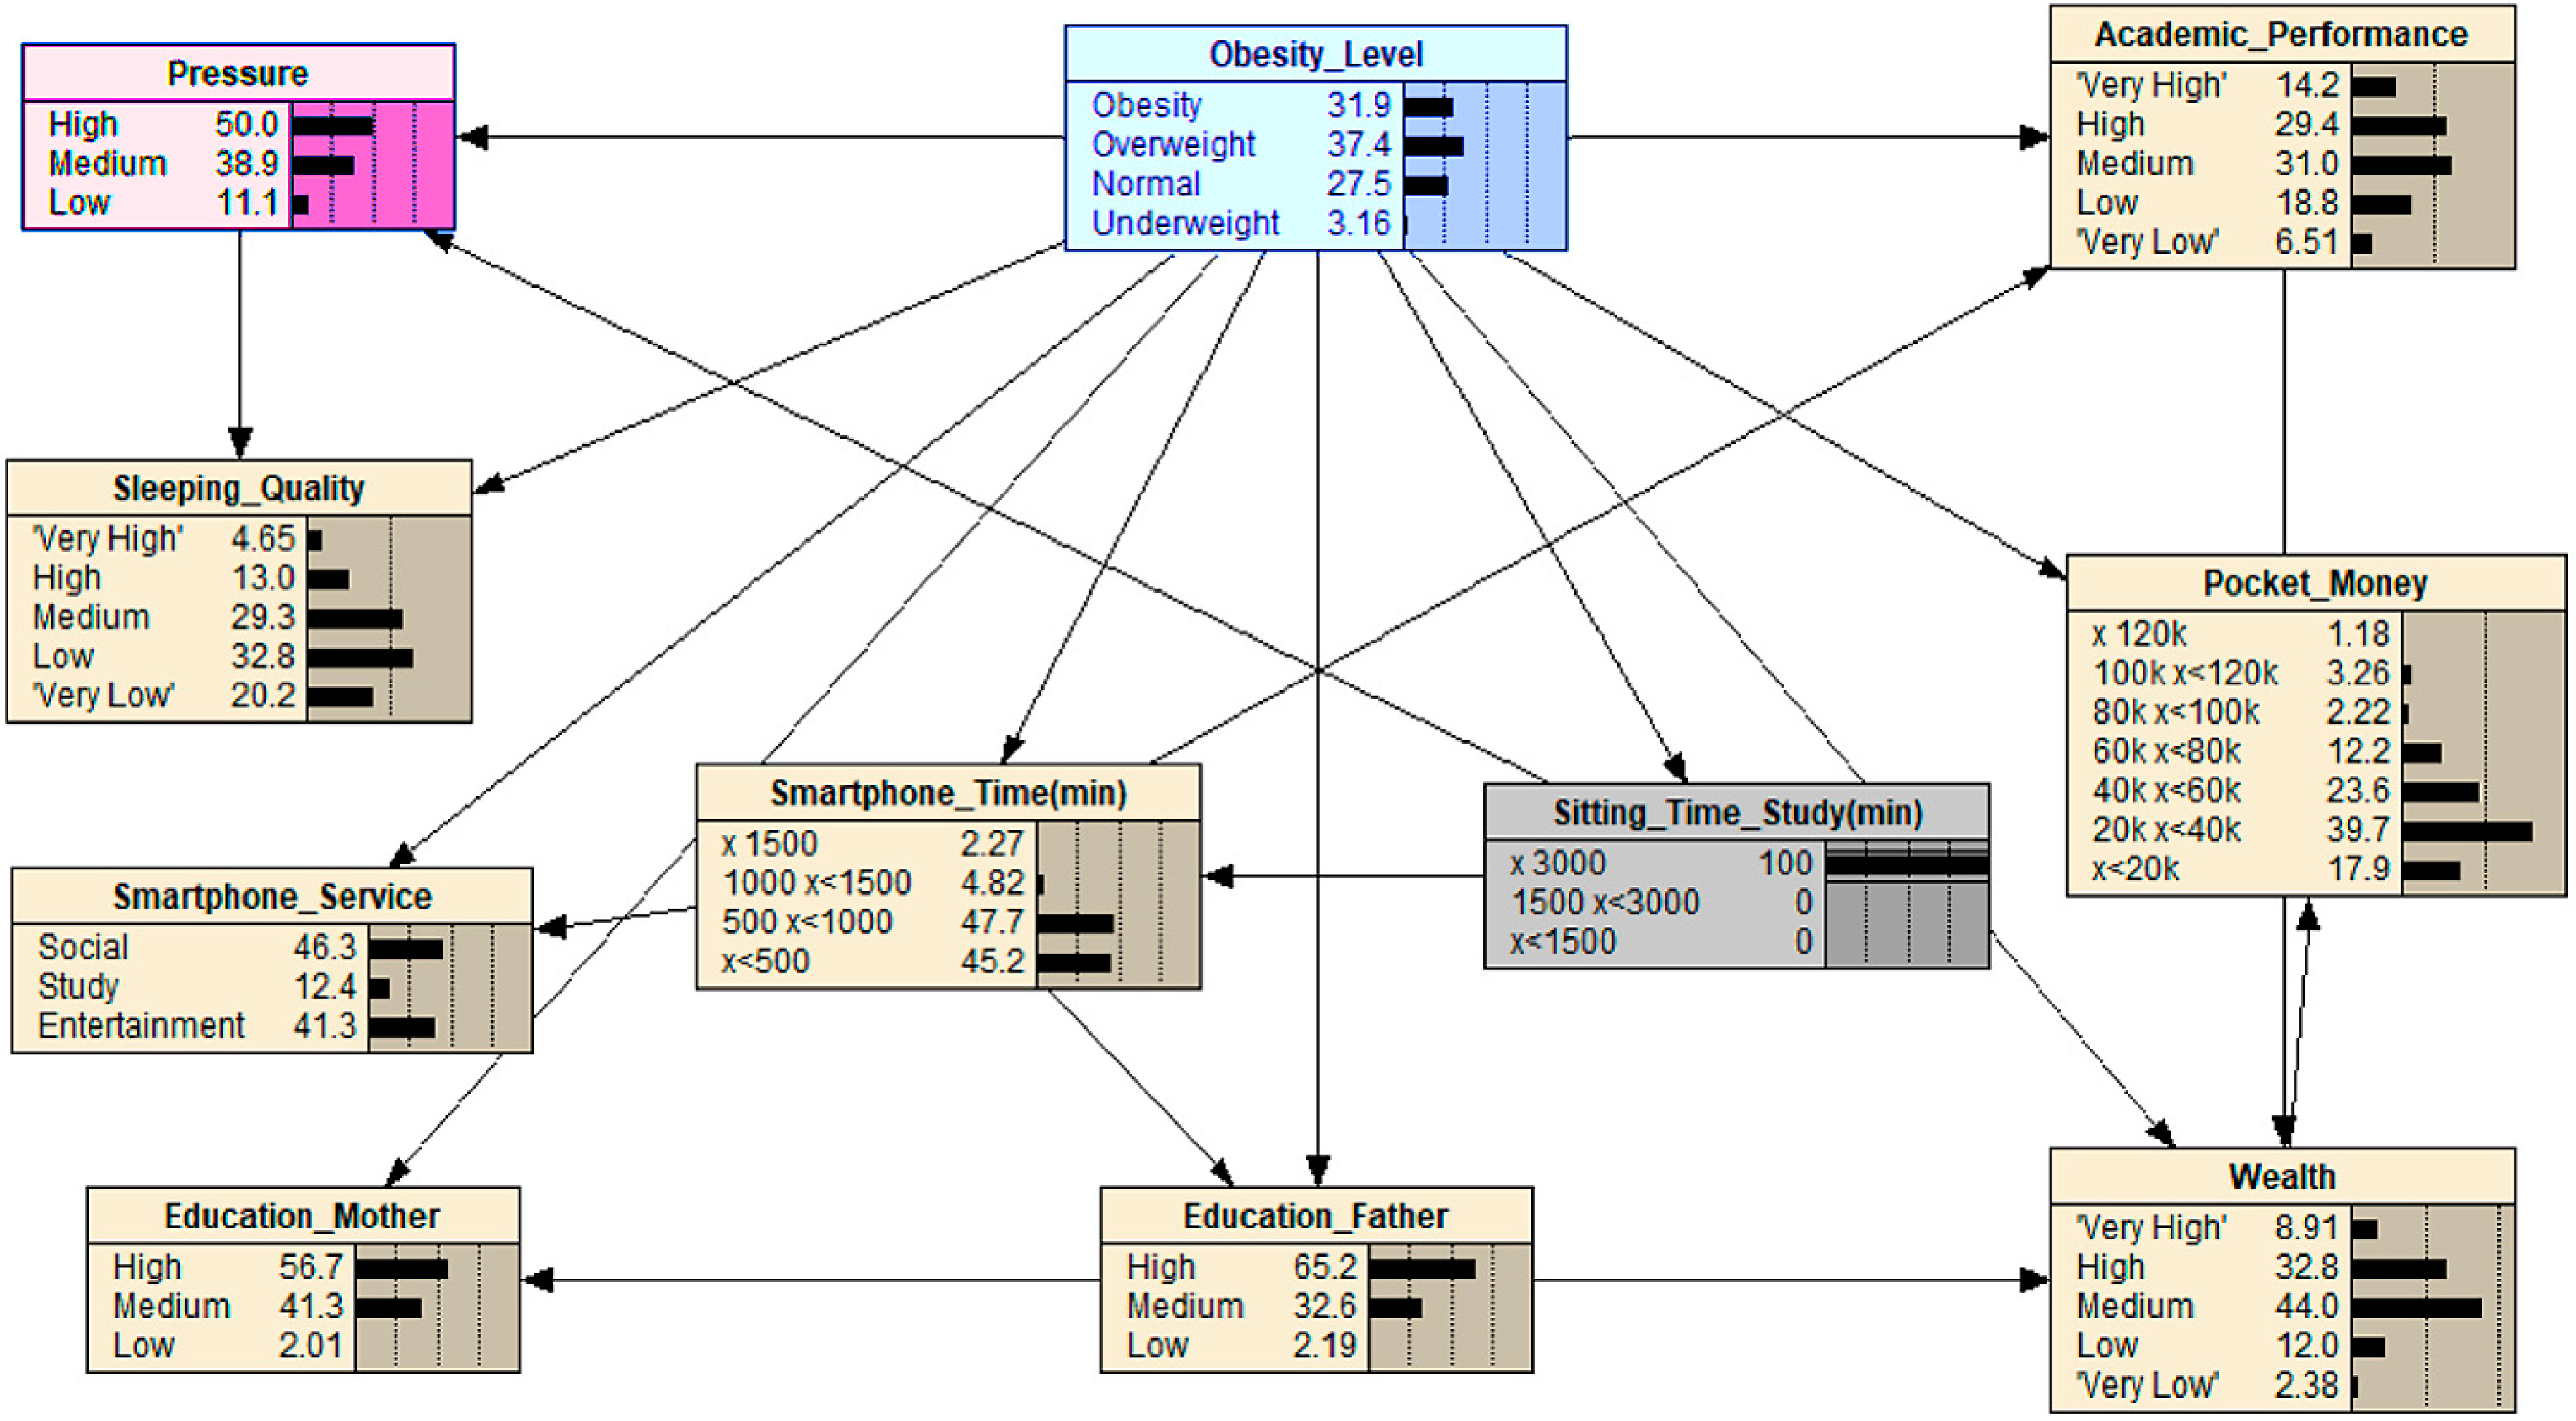
| Scenario 3 | Maximize Sitting_Time_Study | 22.8 → 31.9 |
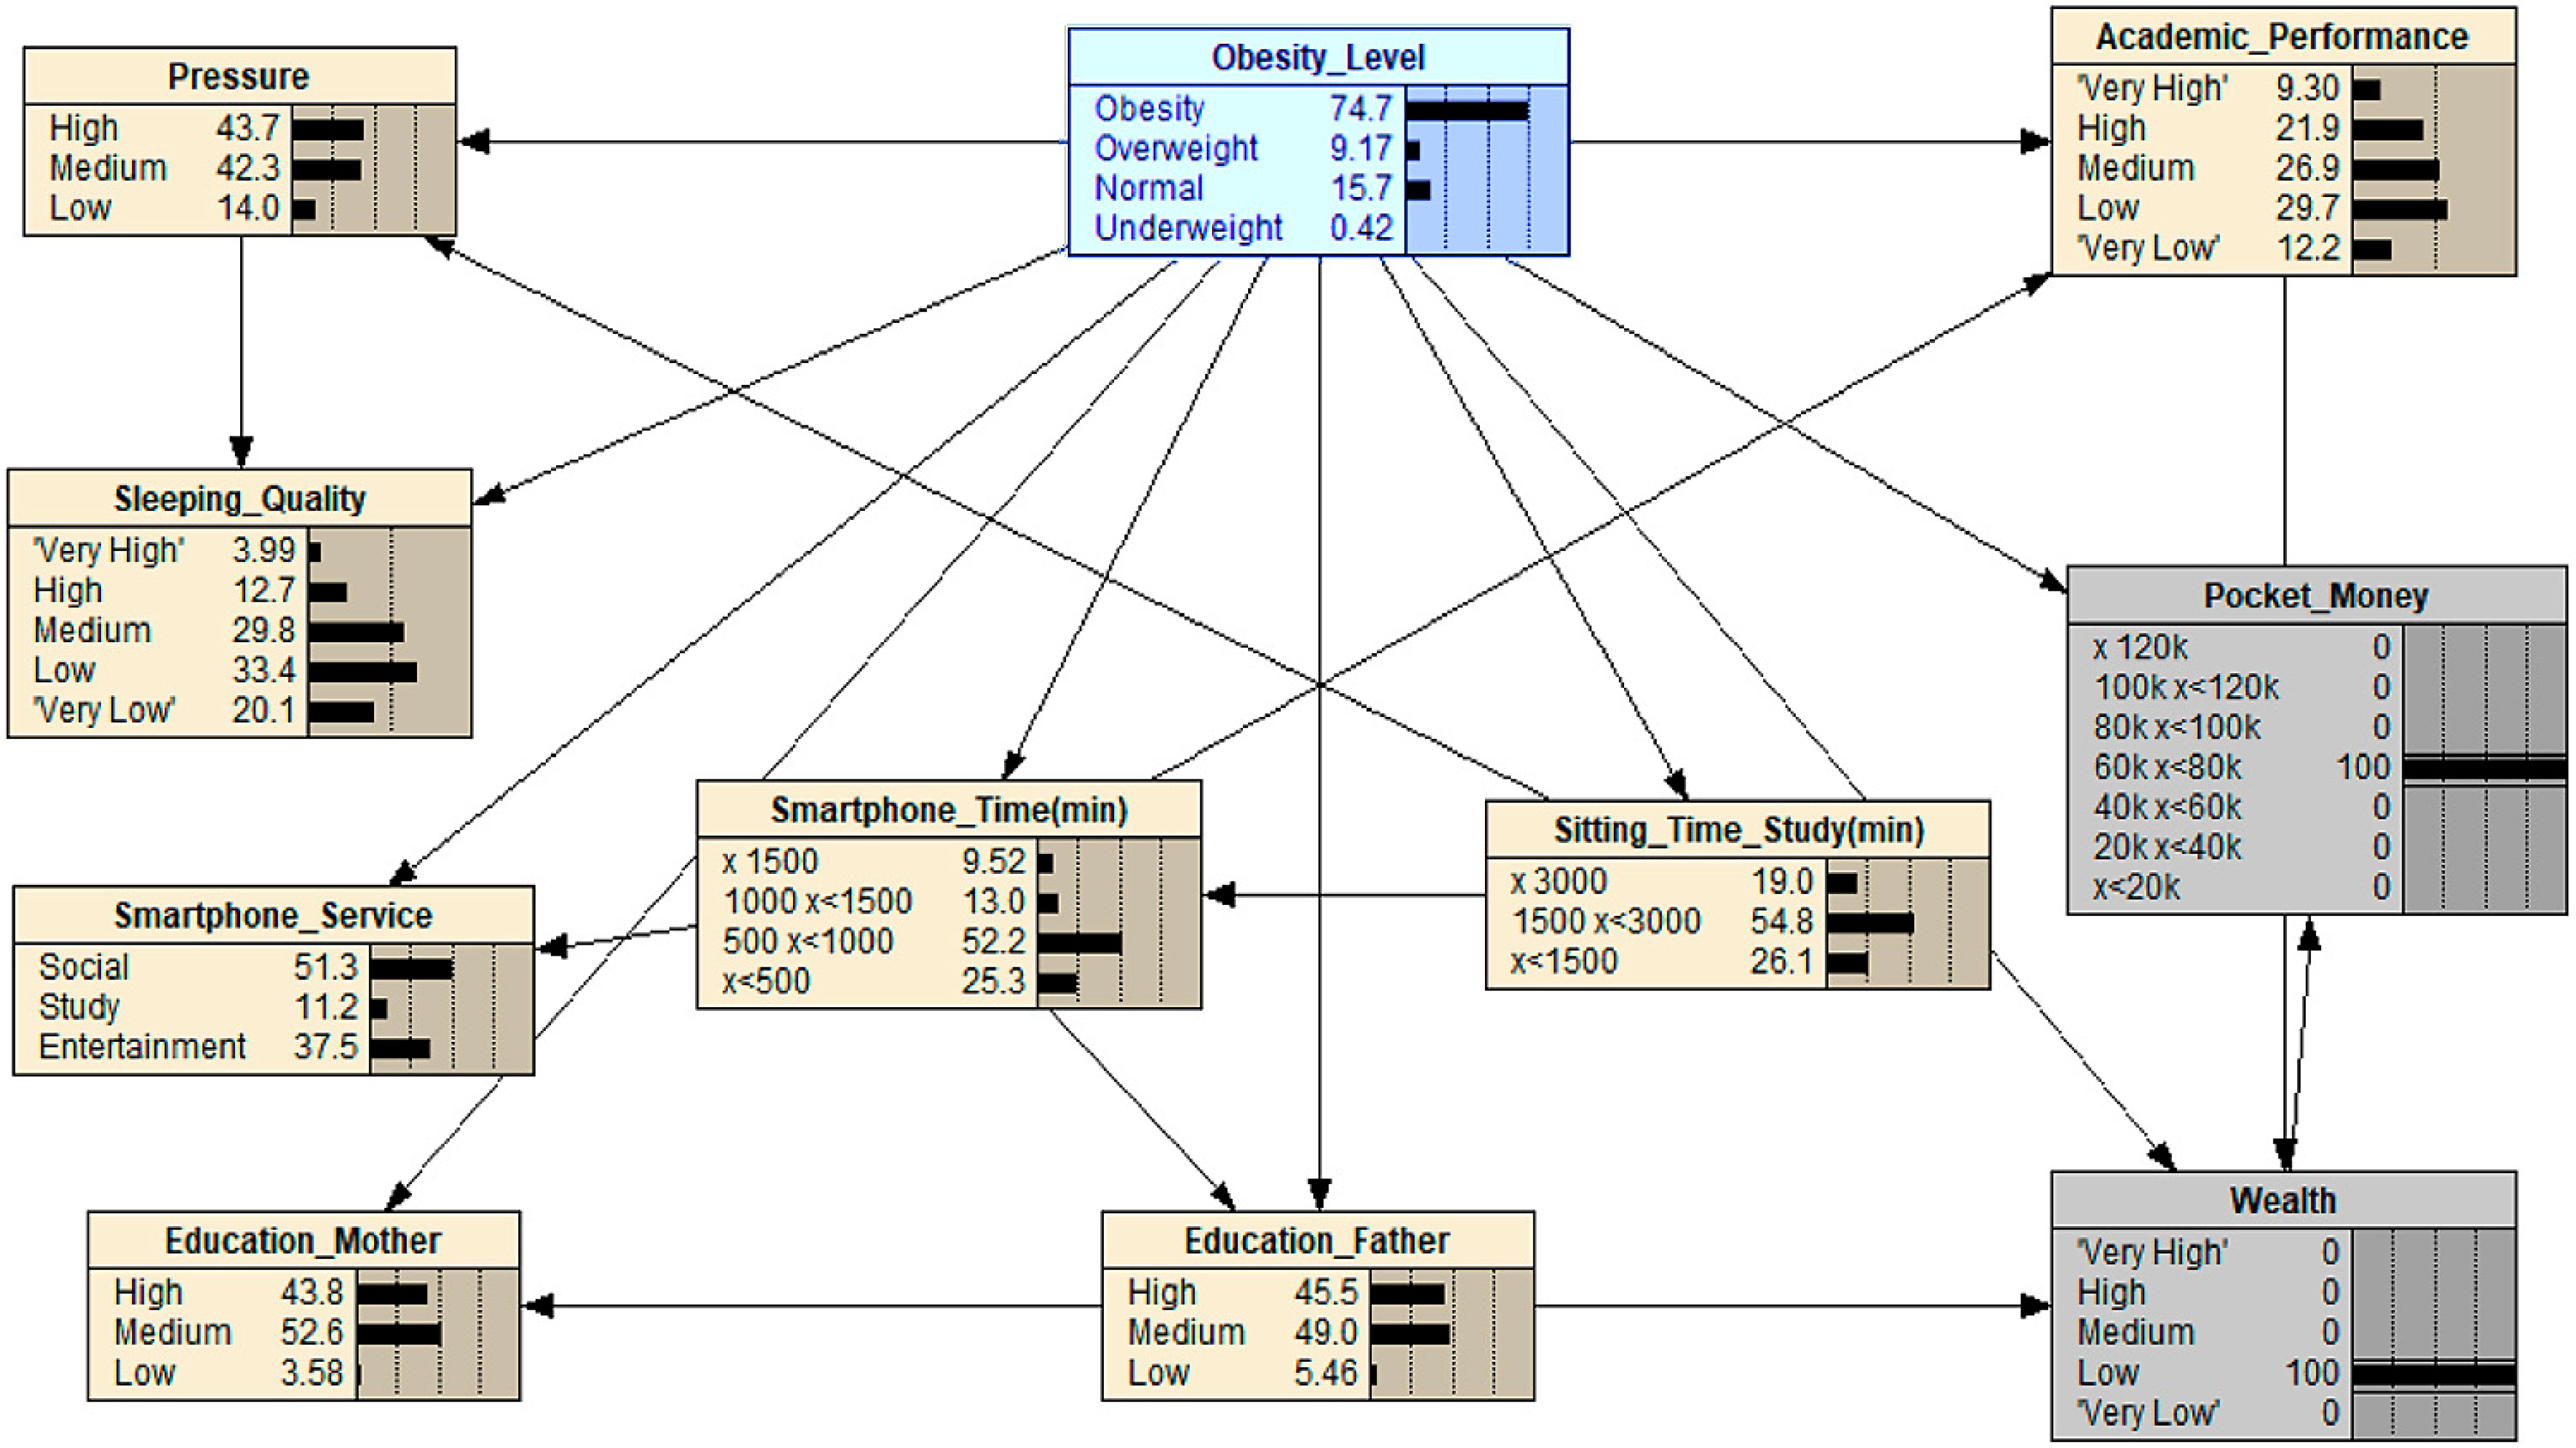
| Scenario 4 | Select the middle level of Pocket_Money and set Wealth to “Low” | 22.8 → 74.7 |
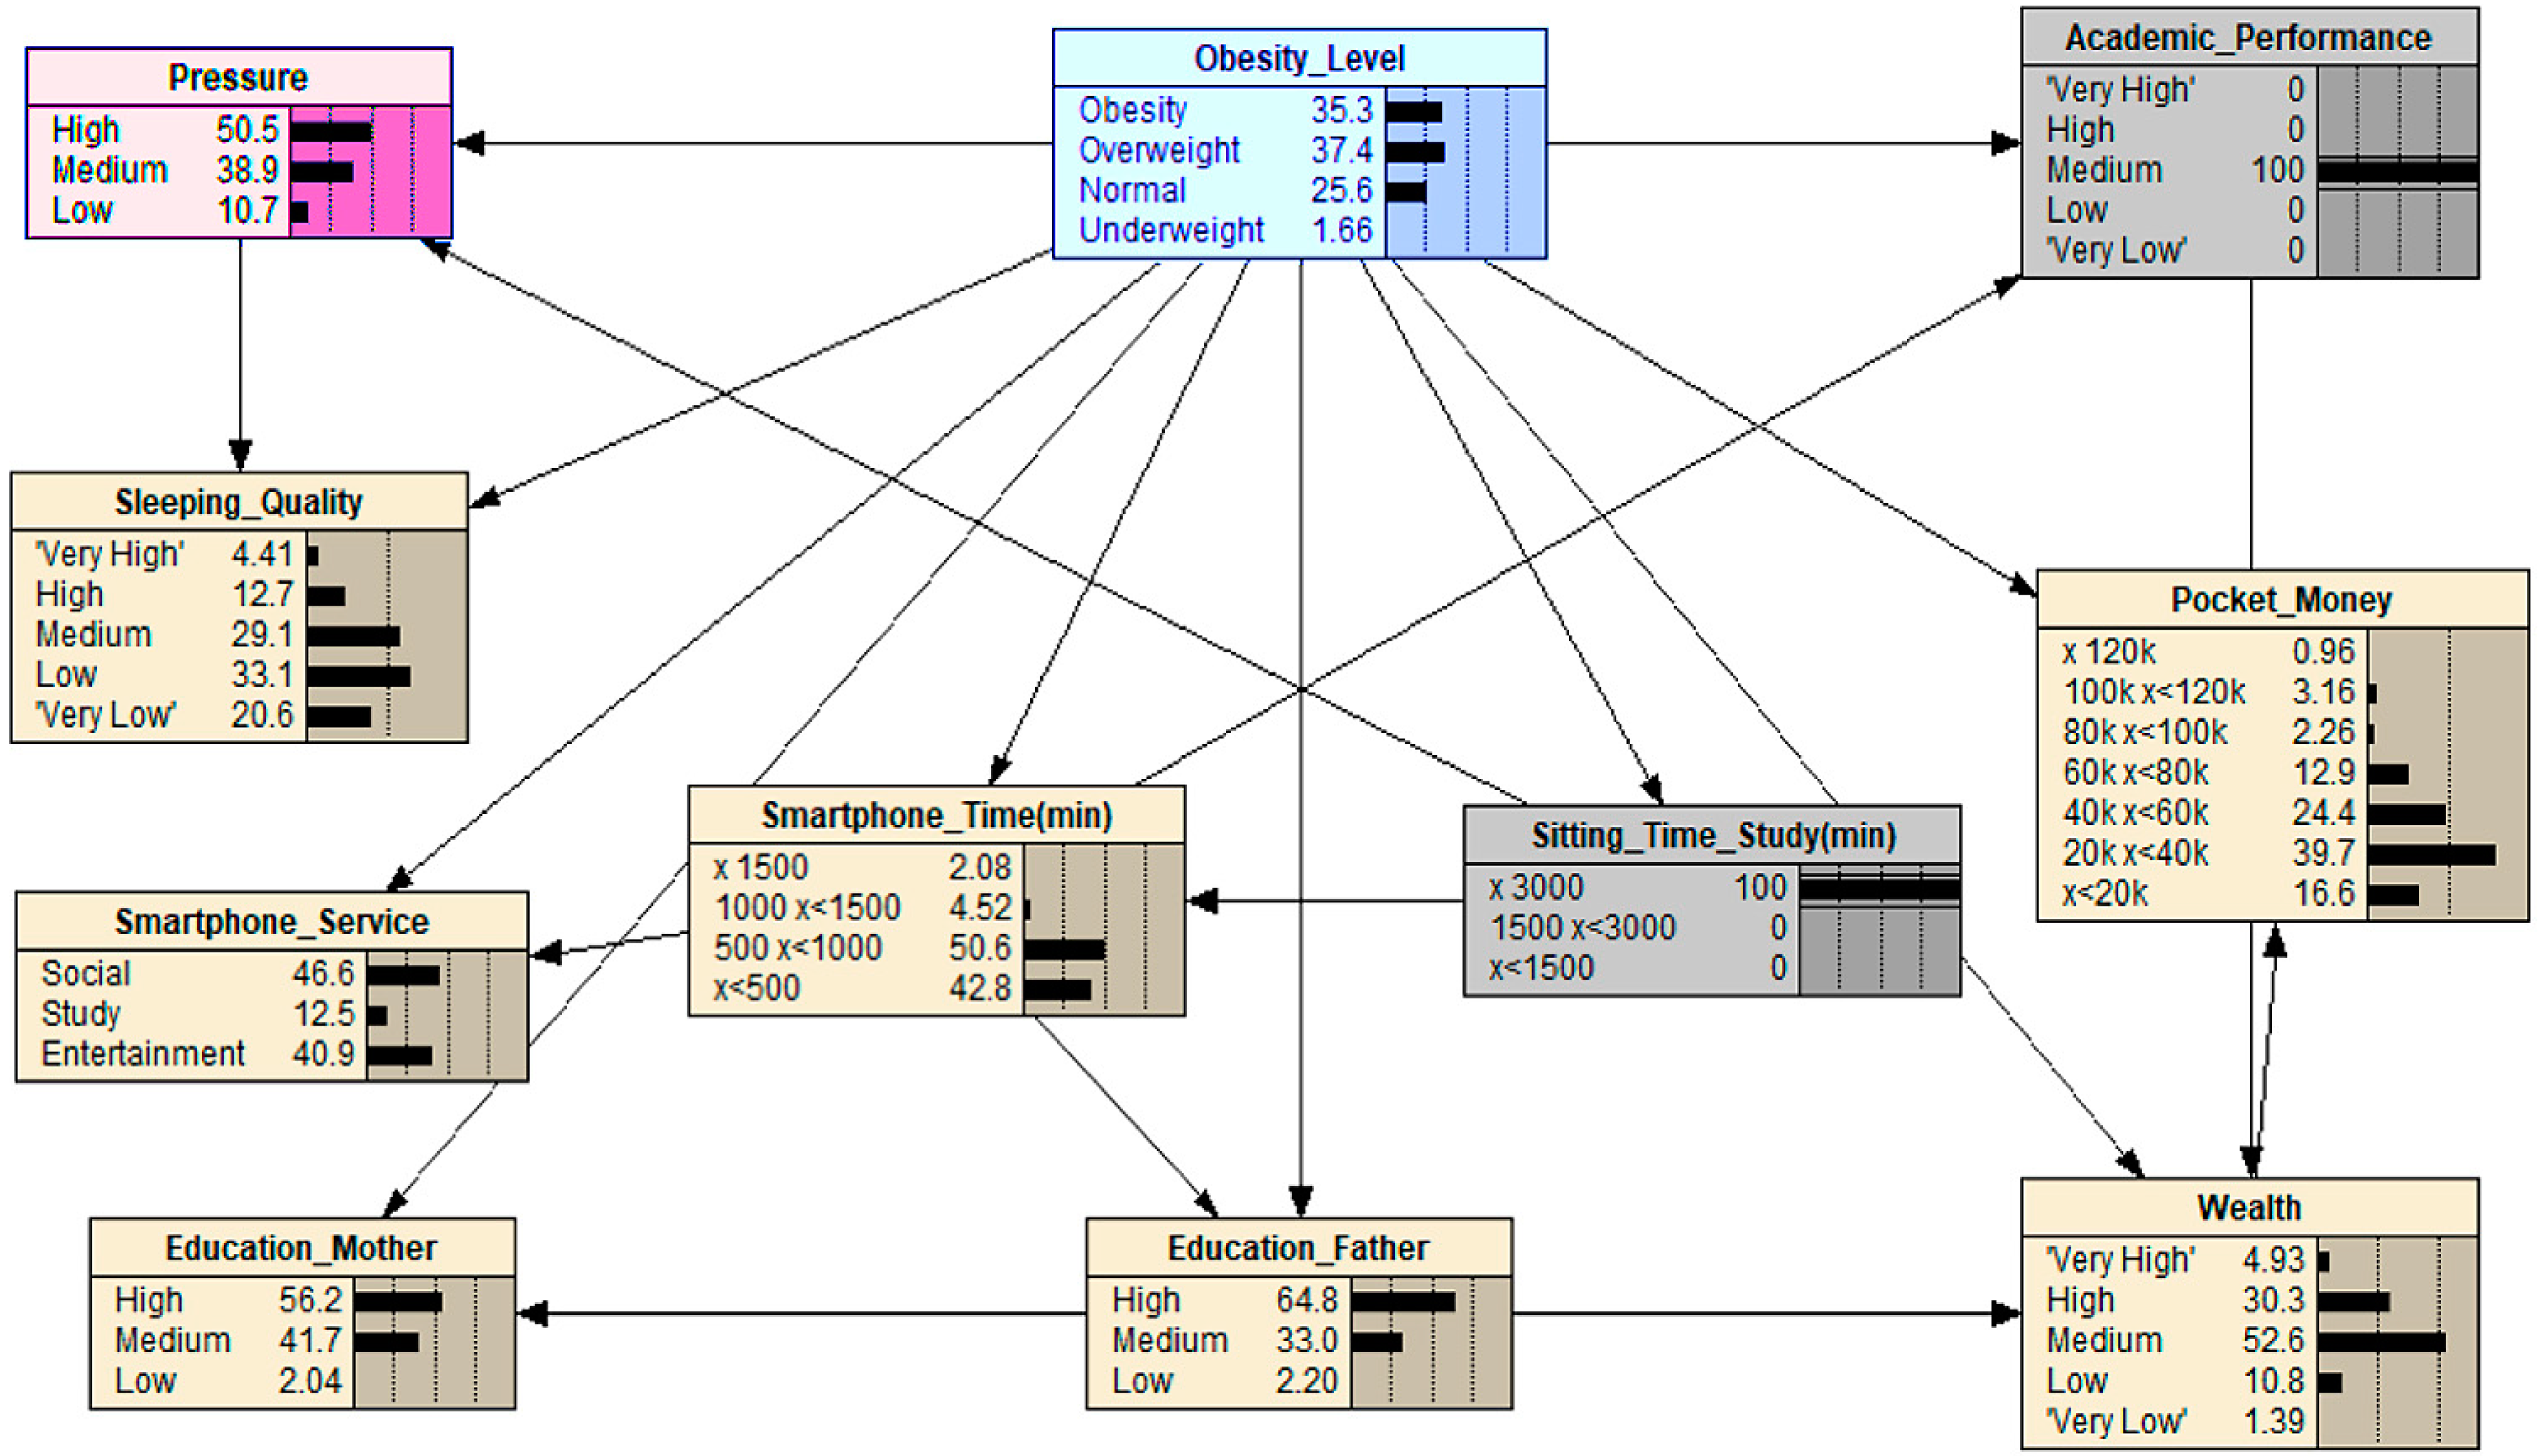
| Scenario 5 | Maximize Sitting_Time_Study and select the middle level of Academic_Performance | 22.8 → 35.3 |
| Scenario 6 | Maximize Smartphone _Time & set Smartphone_Service to “Study” | 22.8 → 32.8 |
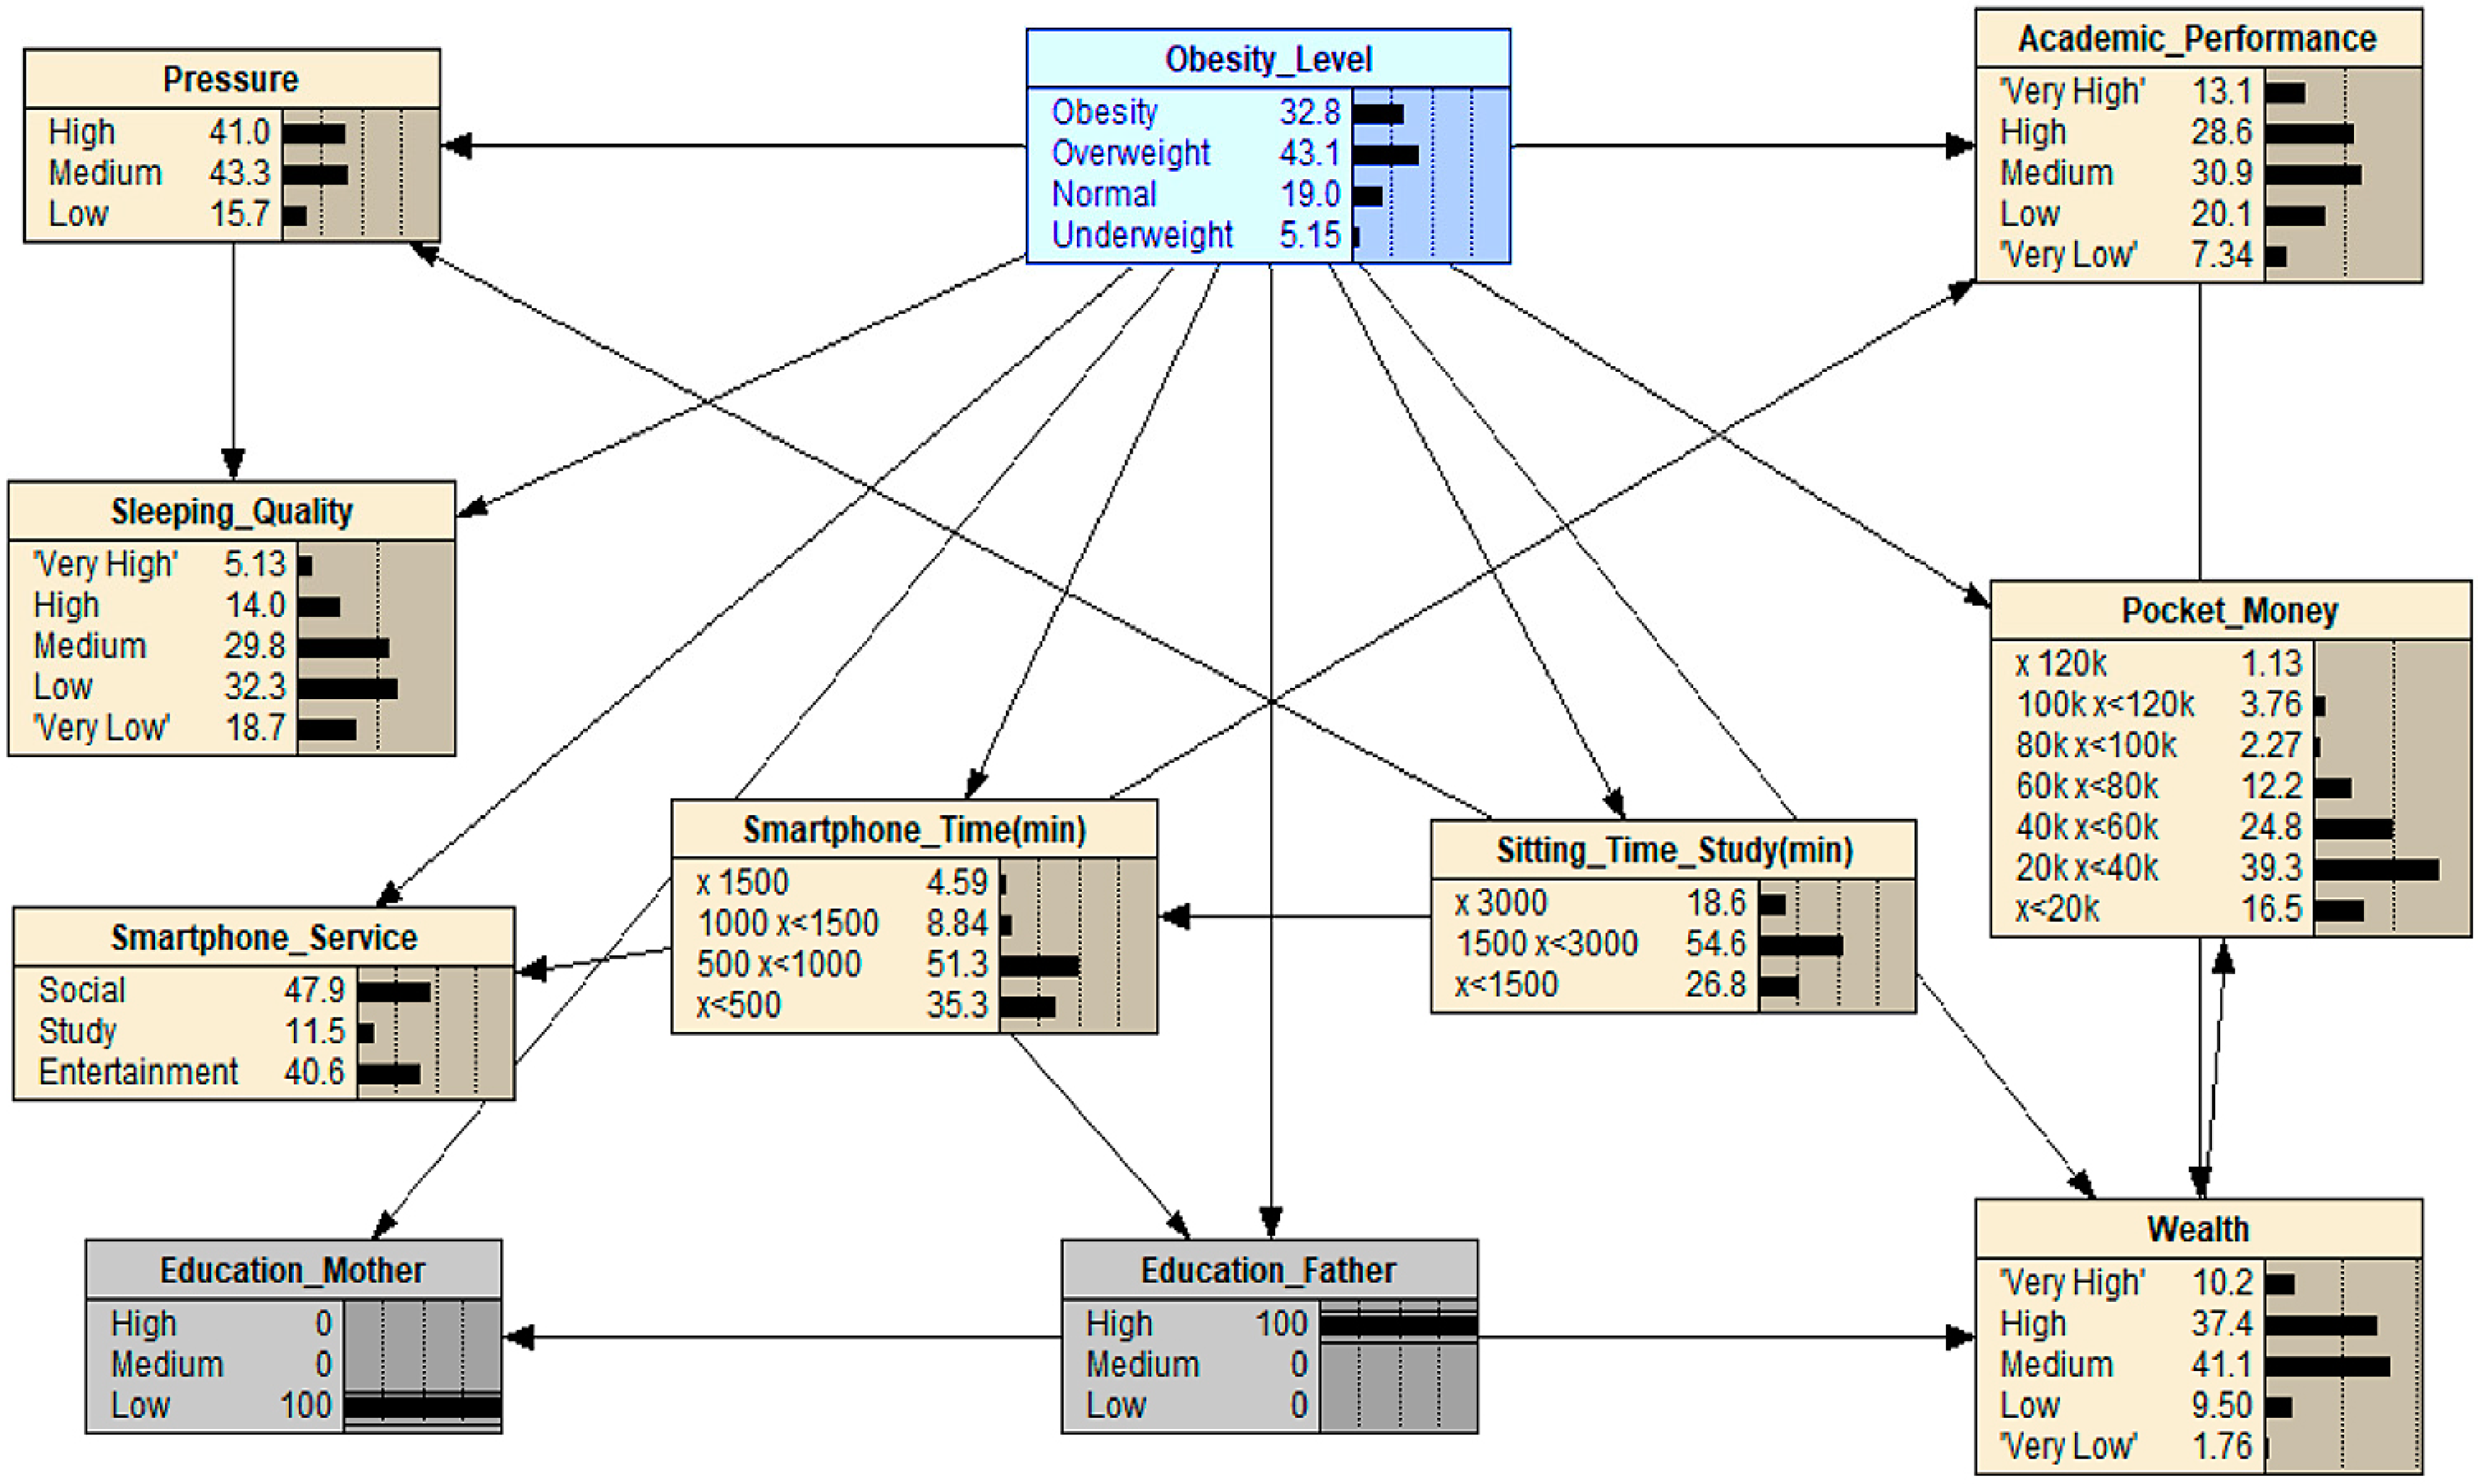
| Scenario 7 | Maximize Education_Father and minimize Education_Mother | 22.8 → 32.8 |
© 2019 by the authors. Licensee MDPI, Basel, Switzerland. This article is an open access article distributed under the terms and conditions of the Creative Commons Attribution (CC BY) license (http://creativecommons.org/licenses/by/4.0/).
Share and Cite
Kim, C.; Costello, F.J.; Lee, K.C.; Li, Y.; Li, C. Predicting Factors Affecting Adolescent Obesity Using General Bayesian Network and What-If Analysis. Int. J. Environ. Res. Public Health 2019, 16, 4684. https://0-doi-org.brum.beds.ac.uk/10.3390/ijerph16234684
Kim C, Costello FJ, Lee KC, Li Y, Li C. Predicting Factors Affecting Adolescent Obesity Using General Bayesian Network and What-If Analysis. International Journal of Environmental Research and Public Health. 2019; 16(23):4684. https://0-doi-org.brum.beds.ac.uk/10.3390/ijerph16234684
Chicago/Turabian StyleKim, Cheong, Francis Joseph Costello, Kun Chang Lee, Yuan Li, and Chenyao Li. 2019. "Predicting Factors Affecting Adolescent Obesity Using General Bayesian Network and What-If Analysis" International Journal of Environmental Research and Public Health 16, no. 23: 4684. https://0-doi-org.brum.beds.ac.uk/10.3390/ijerph16234684