Article

New Fixed Assets Investment Project Environmental Performance and Influencing Factors—An Empirical Analysis in China’s Optics Valley

Business School, Sichuan University, Chengdu 610065, China
*
Author to whom correspondence should be addressed.
Int. J. Environ. Res. Public Health 2019, 16(24), 4891; https://0-doi-org.brum.beds.ac.uk/10.3390/ijerph16244891
Submission received: 31 October 2019 / Revised: 1 December 2019 / Accepted: 2 December 2019 / Published: 4 December 2019
(This article belongs to the Special Issue Environmental and Health Efficiency Evaluation)

Abstract

:
Civilization prospers when the ecology prospers, and civilization decays when the ecology decays. As an effective indicator of sustainable development of economy and resource environment, environmental performance can comprehensively reflect the actual level of coordinated development of the economy and environment system. This paper exemplifies China’s Optics Valley to evaluate its environmental performances and research the influencing factors of new fixed assets investment projects, for which a new fixed assets investment project environmental performance assessment system was constructed. The measurement model for the system was constructed using a generalized data envelopment analysis (DEA) with undesirable output to evaluate the environmental performances of the new fixed assets investment projects in China’s Optical Valley from 2011 to 2016. The multi-regression model with eight environmental performance hypotheses was established to determine the key influencing factors and to propose targeted countermeasures to enhance low-carbon innovation and promote low-carbon economic development. The results indicated that implementing new fixed assets investment project energy conservation assessments and reviews in high-tech areas could assist companies and the government in achieving better management.

1. Introduction

The industrial revolution brought scientific and technological progress to society; however, this rapid development also brought many problems, the most serious of which have been environmental pollution, the overexploitation of natural resources, and the destruction of ecological environments [1,2,3]. Environmental problems have become so serious today that they are threatening any attempts at sustainable socio-economic development. In response to this growing environmental crisis, “ecological priority” has become an important principle when formulating major development strategies. For example, on June 16, 2018, China promulgated the “Opinions of the CPC Central Committee and the State Council on Strengthening Ecological Environment Protection and Resolutely Fighting Pollution Prevention and Control”, in which the need to “implement the red line of ecological protection and firmly adhere to the ecologically sound development path of civilization” was particularly stressed. Natural environment pollution sources are primarily the result of careless human activities, which has been especially true of enterprise production activities [4]. Because enterprises have been and continue to be the main environmental polluters, they now must take responsibility for protecting the environment [5]. Further, as the public is becoming more aware of environmental governance issues, enterprise and government environmental performances and the associated influencing factors have become the focus of extensive research [6,7,8].
China’s main economic development models for the 21st century economy have been established in national high-tech development zones. Since September 2010, the energy conservation assessment and review system for China’s fixed assets investment projects has officially entered the implementation phase; therefore, research and analysis into the environmental performance of fixed assets investment in high-tech development zones and its influencing factors are going to inevitably play a pivotal role in the construction of China’s two-type society. China’s Optical Valley has proven to be an outstanding central and western region representative and has been ranked as one of the top 10 industrial parks in China. Therefore, by exemplifying China’s Optics Valley, this paper examines the internal and external factors associated with the environmental performance of new fixed assets investment projects as an example of low-carbon economic development, the results from which can provide a valuable reference for the formulation of corporate environmental management policies, the establishment of environmental management systems, and the development of environmental management practices, all of which can improve the operability of environmental policies and ensure the achievement of relevant ecological civilization deployment goals.
The remainder of this article is organized as follows. Section 2 reviews and summarizes the literature on the definition of environmental performance, environmental performance evaluation methods, and influencing factors; Section 3 first establishes the environmental performance evaluation indicators for a fixed assets investment in new projects, and then uses a G-DEA model to evaluate the environmental performances of China’s Optical Valley’s fixed assets investment in new projects; Section 4 proposes eight hypotheses to study the factors affecting environmental performance and conducts associated regression analyses; and Section 5 summarizes the results, gives policy recommendations, and concludes the paper. The article structure is shown in Figure 1.

2. Literature Review

The primary focus of this paper is to evaluate the environmental performance of fixed assets investment in new projects and study the influencing factors. Therefore, this work is related to three main research streams: environmental performance definition, environmental performance evaluations, and the factors affecting environmental performance.

2.1. Environmental Performance Definition

Environmental performance is basically a comprehensive systems concept that encompasses environmental financial and environmental management performance and the impact on the socio-economy. Therefore, as it is a relatively complex system concept, there have been varying definitions, with the most common being the economic value borne by an environmental load unit [9,10,11,12]. Ruf et al. and Carroll both defined environmental performance as the extent to which an enterprise meets stakeholder expectations of environmental responsibility [13,14]. Lankoski saw environmental performance as a vector that measured an enterprise’s impact on the environment [15,16], and Wood claimed that the principled expression of corporate social responsibility was a process related to the social input, production and output responses, with the social impact being reflected in environmental performance [16].

2.2. Environmental Performance Evaluation

Research on corporate environmental performance evaluation is mainly divided into the selection of evaluation indicators and the improvement of evaluation methods. Industrial pollution discharge evaluation indicators mainly include wastewater, exhaust gas, and solid waste [17]. Industrial wastewater includes production wastewater, sewage, and cooling water, which contains industrial production materials, intermediate products, by-products, and pollutants generated during the production process [18]. There are many types of pollutants released into the atmosphere from industrial production, including soot, sulfur oxides (such as SO2), nitrogen oxides (such as NO2), and carbon compounds (CO2) [19,20]. Industrial waste is a variety of waste residue, dust, and other wastes discharged into the environment during industrial production [21]. The above-mentioned indicators are enterprise environmental assessment indicators from a macro perspective, but there is currently no micro-level research on environmental performance assessment indicators for new fixed asset projects. A general research consensus has been reached that enterprise production sustainability should be measured with environmental performance evaluations. Most environmental performance research has been involved in updating algorithmic models and empirical analyses [22,23,24]. For example, the TRI (Toxics Release Inventory) has been a widely used aggregate index for land, water, and air emissions as it can compare company performances and reveal the effects of different regulations or economic tools [25,26]. Although there have been some informative studies in this area, shortcomings related to research object specialization and weak research method universality remain [27]. Another representative environmental performance evaluation method has been life cycle assessments (LCA); however, this had similar shortcomings [22]. Tyteca pointed out the deficiencies in existing environmental performance evaluation indicators and proposed a comprehensive environmental performance index that employed data envelopment analysis (DEA) [28]. To calculate relative efficiency, data envelopment analysis (DEA), which was first proposed by Charnes, has attracted significant research attention and continual expansion [29]. To avoid the subjectivity and randomness of current methodologies, most environmental performance researchers now prefer DEA when evaluating environmental performance [30,31,32].

2.3. Factors Affecting Environmental Performance

Most environmental performance research has been focused on determining the internal and external factors and identifying the related laws to verify the relationships between corporate environmental performance and financial performance [33,34,35,36]. For example, Yin and Ma found that the environmental standards adopted by enterprises could not be equated with their actual environmental performances [36], Dawkin and Fraas collected data from 500 S&P companies and proved that there was a U-type relationship between environmental performance and environmental information disclosure [37], Xiao et al. found that the social environment of a country affected enterprise environmental performances [38], Pineiro-Chousa, Romero-Castro, and Vizcaíno-González argued that socially responsible investment indices could provide a new analysis approach for assessing the relationship between corporate financial and corporate environmental performances [39], and Farooq found that employee participation had a strong and positive impact on corporate environmental performance [40]. Other studies have analyzed the relationships between environmental performance and industrial structure, international trade, and technology, and others have suggested specific environmental supervision, market structures, and lean production developments for management decision-making in China’s eco-industrial demonstration parks [41,42,43,44].
Even though there has been some valuable research conducted, these studies have had some limitations. First, as almost all have focused on overall industry environmental performance, the results are limited because the research covers a wide range of enterprises, periods, regions, environmental management characteristics, and environmental performances. Second, China is in an economic development and transformation stage from an extensive economy to an intensive economy, and therefore, economic growth relies more on the society itself than government policies or management. Third, there has been little recent research into environmental performances at high-tech development zones, and while the research on environmental performance influencing factors has moved from single factor to multiple factors measure. There have been few studies to date on the specific environmental performances of new projects and the associated internal and external influencing factors.
As environmental performance evaluations are the cornerstone of effective environmental management system operations, an analysis of the new project environmental performances in China’s Optical Valley could reveal the current state of corporate environmental management and the specific internal and external influencing factors, which could improve the applicability of environmental policies, and assist in the promotion of corporate environmental responsibility and the construction of an ecological civilization in high-tech zones.

3. New Fixed Assets Investment Project Environmental Performance Measurements

Environmental performance evaluations have their own particularities. First, the research enterprise environmental problems are essentially external, non-economic issues as high-tech zone enterprises conduct energy-saving assessments and review processes before project launches to improve energy efficiency and reduce external uneconomic influences. Second, environmental performance is reflected in the long-term interactions between corporate environmental management and resource utilization. While investment in environmental management and clean production technologies increases a project’s environmental costs in the short term, the comprehensive benefits to be derived from this investment in terms of environmental governance and the achievement of the environmental management objectives only becomes evident over the long term. Third, current corporate environmental management effects are diverse; that is, while the assessment of environmental performance is inseparable from environmental assessment indicators such as carbon dioxide emissions, it is also inseparable from financial input indicators, such as green fees and sewage charges.

3.1. Generalized DEA Model with Undesirable Output

When using DEA to evaluate the production or operational efficiencies of an economic system, the larger the output, the better. However, discharged waste and pollutants do not follow these principles as the less waste and pollutants, the better it is for the enterprise production process. As the value of waste and pollutants cannot be zero because waste and pollutants from production processes cannot be avoided, when assessing the environmental performance of new high-tech zone projects, to evaluate the comprehensive efficiency, a generalized DEA model with undesirable outputs has the following advantages:
Firstly, as environmental performance is a complex system problem, the weights between the indicators are difficult to determine; however, a generalized DEA does not need the indicator weights to be determined in advance. Secondly, the complexity of environmental performance assessments makes it difficult to determine the quantitative relationships within the system; however, the generalized DEA method does not need the quantitative relationships within the system to be determined in advance. Thirdly, traditional DEA is unable to select the sample to evaluate the decision unit based on need, whereas the generalized DEA method is able to determine the reference plane as needed.

3.2. Model Construction and Validity Judgment

In this system model, it is assumed that there are n decision units and n ¯ sample units, with each unit being characterized by m input indicators, s kinds of desirable output indicators (expected growth indicators) and k kinds of undesirable output indicators (reflecting negative effects), with the values for the sample and decision units being positive numbers.
Let the input index value of the j sample unit be:
x ¯ j = ( x ¯ 1 j , x ¯ 2 j , , x ¯ m j ) T ,
the desirable output indicator value be:
y ¯ j = ( y ¯ 1 j , y ¯ 2 j , , y ¯ s j ) T ,
the undesirable output indicator value be:
z ¯ j = ( z ¯ 1 j , z ¯ 2 j , , z ¯ k j ) T
Let the input index value of the p decision unit be:
x p = ( x 1 p , x 2 p , , x m p ) T ,
the desirable output indicator value be:
y p = ( y 1 p , y 2 p , , y s p ) T ,
the undesirable output indicator value be:
z p = ( z 1 p , z 2 p , , z k p ) T .
Let the sample unit set be:
T = { ( x ¯ 1 , y ¯ 1 , z ¯ 1 ) ,   ( x ¯ 2 , y ¯ 2 , z ¯ 2 ) , ,   ( x ¯ n ¯ , y ¯ n ¯ , z ¯ n ¯ ) } ,
the decision unit set be:
T D M U = { ( x 1 , y 1 , z 1 ) ,   ( x 2 , y 2 , z 2 ) , ,   ( x n , y n , z n ) } .
According to the idea of constructing production possible set by the DEA method, the possible production set determined by sample unit is as follows:
T = { ( x , y , z ) | j = 1 n ¯ x ¯ j λ j x , j = 1 n ¯ y ¯ j λ j y , j = 1 n ¯ z ¯ j λ j z , δ 1 ( j = 1 n ¯ λ j + δ 2 ( 1 ) δ 3 λ n ¯ + 1 ) = δ 1 , λ j 0 , j = 1 , 2 , , n ¯ + 1 }
δ 1 , δ 2 , δ 3 are the parameters of 0 or 1.
And the set of production possibilities identified by the sample unit set be:
T ( d ) = { ( x , y , z ) | j = 1 n ¯ x ¯ j λ j x , j = 1 n ¯ d y ¯ j λ j y , j = 1 n ¯ z ¯ j λ j z , δ 1 ( j = 1 n ¯ λ j + δ 2 ( 1 ) δ 3 λ n ¯ + 1 ) = δ 1 , λ j 0 , j = 1 , 2 , , n ¯ + 1 }
d is a positive number and is called the shift factor.
Based on the G-DEA and G-DEAd efficiency concepts, a generalized DEA model (DGU) with undesirable output is constructed as follows:
( D G U ) { min θ , s . t . θ x p j = 1 n ¯ x ¯ j λ j 0 , y p + j = 1 n ¯ d y ¯ j λ j 0 , z p j = 1 n ¯ z ¯ j λ j 0 , δ 1 ( j = 1 n ¯ λ j + δ 2 ( 1 ) δ 3 λ n ¯ + 1 ) = δ 1 , λ j 0 , j 1 , 2 , n ¯ + 1 .
When δ 1 = 0, the model is based on the CCR model in a generalized DEA model with undesirable output. In calculating the environmental performance of New Fixed Asset Investment Projects involved in energy conservation assessment and review of high-tech zones, the CCR model in the generalized DEA model with undesirable output is needed.

3.3. Screening of Environmental Performance Evaluation Indicators for New Fixed Assets Investment Projects

After reviewing existing environmental performances, environmental protection statistics and related statistical yearbooks, academic papers, and research reports, this study determined the environmental performance evaluation indicators for the new projects from resources, economic, and environmental aspects, with the indicator selection being based on basic evaluation principles and energy conservation assessment and review reports to reflect resource consumption, pollution emissions, and energy savings after the assessment [44].
The assessment indicators are divided into three levels. The input indicators are the resource consumption indicators and the financial input indicators, with the resource consumption index being composed of power consumption, water consumption, steam consumption, and natural gas consumption, and the financial input indicator being total investment. The output indicators are divided into desirable output indicators and non-desirable output indicators, with the desirable output indicators being the performance evaluation indicators that correspond to the energy-saving indicator in the energy-saving assessment reports, and the undesirable output indicators being the industrial waste gas emissions resulting from the project implementation, such as carbon dioxide and sulfur dioxide, which also reflect the environmental impact of new regional construction projects. The indicator settings are shown in Table 1.

3.4. Environmental Performance Assessment Process and Results Analysis

The DEA algorithm requires that the number of Decision Making Units (DMUs) be no less than the number of input indicators multiplied by the output indicators or no less than three times the sum of the input and output indicators [45]:
N ≥ max{X*Y, 3*(X + Y)}
In this study, X = 5 is the number of input indicators, and Y = 3 is the number of output indicators. The input indicators are projected power consumption (10,000 kwh), projected natural gas consumption (10,000 m3), projected water consumption (10,000 m3), projected steam consumption (10,000 t) and projected total investment (10,000 Chinese Yuan (CNY)), and the output indicators are the expected energy savings (tonnes of standard coal), and expected carbon dioxide emissions (tonnes) and sulfur dioxide emissions (tonnes). To ensure the accuracy of the final result, equivalent values are taken for the three output indicators.
Because the basic requirement for running the DEA algorithm is that N conforms with equation (12), 24 is selected as the standard reference value (3 × 5 = 15 and 3 × (5 + 3) = 24). As the overall sample number 237 was much larger than the standard reference value, the above algorithm could be executed.
To calculate the environmental performance for new high-tech zone fixed asset investment projects, the input-oriented CCR model was combined with an SBM super-efficiency model and then run on the MAXDEA PRO 6.0 tool to determine the static environmental performance values for each new project. The specific distribution is shown in Table 2, and a more intuitive view of the environmental performance value distribution is plotted and shown in Figure 2.

4. Factors Affecting the Environmental Performance of New Fixed Assets Investment Projects

4.1. Research Hypothesis

Based on the literature review in Section 2, it was surmised that environmental performance is affected by both internal and external factors. The internal environmental performance factors are the enterprise size, the environmental awareness of the enterprise manager, the pollution attributes of the industry in which the enterprise is located, the current enterprise technical level, the financial health status, the nature of the enterprise, the product attributes and services provided, the environmental technology investment proportion, and the ISO environmental certification. As different internal factors affect environmental performance, the project feedback on environmental pressures and associated environmental project costs are different, which means that each project has different environmental behaviors and performances. The external factors affecting environmental performance are government rules and regulations, consumer demand for environmentally friendly products, public supervision of corporate management environmental behavior, attention by the media and other non-government organizations to corporate environmental information disclosure, imitation competition behavior among competitors in the same industry, investment selection criteria, and the upstream and downstream enterprise trade agreements, all of which have different driving force or external pressure effects on enterprise environmental performance. Therefore, based on the above and combined with the field research results, this paper proposes the following eight hypotheses.
Hypothesis 1.
There is a positive correlation between the nature of the project owner’s business and the environmental performance of new projects.
If the new project enterprise is a listed company, it has more social responsibility than a non-listed enterprise as the shareholders of listed companies can influence internal environmental management decisions [46]. Further, as listed companies also need to publish a “Corporate Social Responsibility Report” or an independent environmental report every year [40], enterprises with high information disclosure levels need to pay more attention to environmental protection and environmental performance improvements.
Hypothesis 2.
There is a positive correlation between project profitability and new project environmental performance.
Enterprises seek profitability, which is a reflection of their capital appreciation; that is, in a normal business year, profitability allows an enterprise to further expand and re-invest its accumulated assets [33,34,35,36]. Companies with strong profitability often have more resources, higher quality products, stable markets, harmonious partnerships, and a growing development space; therefore, they are often more willing to put more resources into energy conservation, emissions reduction, and environmental management protection, with the objective of improving their environmental performance and establishing a good ecological image.
Hypothesis 3.
There is a negative correlation between enterprise financial status and new project environmental performance.
Based on previous research [36,47], the higher the enterprise debt, the lower the environmental management enthusiasm, and the lower the asset-liability ratio, the higher the enterprise’s environmental management enthusiasm. As China is still a developing country, there will be a continuing focus on economic development for some time. Therefore, enterprise production and operations are mainly aimed at reducing controllable costs, increasing marginal revenue, achieving a maximum net profit, or pursuing maximum benefit, all of which means that most companies tend to pay less attention to environmental performance than to meeting local government economic goals. Consequently, only profitable enterprises take responsibility for environmental management as enterprises with high asset-liability ratios find it difficult to implement consistent environmental management strategies.
Hypothesis 4.
There is a positive correlation between enterprise scale and new project environmental performance.
The theory of scale economy and management economic market structure states that the larger the enterprise scale, the greater its influence in the market. To avoid monopoly, however, large-scale enterprises are subject to greater government regulation and are more affected by government environmental policies, regulations, and standards [39,40]. Second, the larger the enterprise, the more attention the daily business activities receive from stakeholders. Therefore, as business owners or managers must consider the behavior of the government, the media, and the public when formulating corporate strategy, to attract investors and consumers and ensure a good industry reputation, most take the initiative to undertake their social environmental responsibilities and obligations.
Hypothesis 5.
There is a positive correlation between environmental management behavior implementation frequency and the environmental performance of new projects.
Enterprise environmental management in this paper is seen to be part of strategic enterprise management. By implementing environmental management as part of everyday corporate behavior, the corporate costs and public welfare losses caused by environmental problems can be minimized. Therefore, the extent to which corporate environmental management is integrated in enterprise strategies is an indicator of enterprise environmental management [37,47]. For example, joining environmental protection organizations, establishing special environmental management departments, and implementing new energy conservation and emissions reduction technologies to reduce environmental pollution and resource waste can all improve the environmental performance of new projects.
Hypothesis 6.
There is a positive correlation between the project duration and the environmental performance of new projects.
It has been observed that the longer the project construction period, the greater the total project input, and that most projects with long construction periods have complex technical standards and/or are difficult to construct. Therefore, the energy-saving technologies and energy-saving standards used in project construction are described in detail in the respective energy-saving assessment and review reports. Further, projects with long project construction periods have more government and public supervision than projects with shorter construction periods. Therefore, the longer the construction, the greater the external pressure, and the higher the environmental performance.
Hypothesis 7.
There is a positive correlation between the frequency of society petitions and the environmental performance of new projects.
Hypothesis 8.
There is a positive correlation between government supervision and the environmental performance of new projects.
Hypotheses 7 and 8 are related to many research results that indicated that corporate environmental performance management was influenced by the environmental behavior of the government environmental departments, investors, and the public [38,43,46,48]. In recent years, the government, society, and the public have demanded better environmental protection and have insisted that for any new fixed asset investment projects, enterprises must ensure environmental protection to stop the common enterprise free-riding behaviors. In these circumstances, the government is a vital independent third-party supervisor to ensure proper corporate environmental management and insist on the control of external factors by high-tech zone management committees to encourage enterprises to pay attention to and continuously improve their environmental management, reduce their environmental pollution, and improve their resource utilization. Therefore, this study believes that the supervision of public and government agencies improves the environmental performance of new projects.

4.2. Variable Design

In this paper, the environmental efficiency (score), which is between (0, 1) (including 1, and excluding 0), calculated using the DEA is the dependent variable Y for the new project environmental performance; the closer the score is to 1, the higher the resource allocation efficiency of the new project, and the higher the environmental management level of the project, the better the environmental performance. Therefore, 1 indicates efficiency; from the relative efficiency analysis, that is, 100% of the resource inputs contribute to the output, and there is almost no resource waste.
The independent variables are the internal and external factors that affect environmental performance. In actual situations, there may be certain correlations between the internal and external factors that affect the environmental performance of new projects. Therefore, the independent variable index is set with the internal influencing factors mainly based on the financial indicators, and the external influencing factors mainly based on the external stakeholders.
Therefore, the internal influence factors used in this paper are as follows:
(1)
The nature of the enterprise (Is it a listed company? Yes = 1; no = 0);
(2)
Corporate profitability (return on net assets, indicating the ability of the net assets to generate profits);
(3)
Financial status (the asset-liability ratio is an effective indicator for evaluating the financial health of enterprises, and is also an indicator that can measure the ability of enterprises to use creditor funds for reasonable business activities);
(4)
Enterprise scale (registered capital of the enterprise, <10 million CNY = 1, 10–50 million CNY = 2, 50–100 million CNY = 3, 100–500 million CNY = 4, 500 million–1 billion CNY = 5, >1 billion CNY = 6);
(5)
Implementation frequency of environmental management behavior (based on the relevant national environmental policies, regulations, and standards (Table 3);
(6)
Construction period (the time span from the start of construction to the completion of the project, by month).
The external influence factor independent variables are:
(7)
The number of letters and visits from social groups;
(8)
The number of supervisory actions taken by the government.

4.3. Data Sources

To determine the environmental performance influencing factors for new high-tech zone projects, enterprise environmental management professionals, and related front-line staff, including middle and high-level management personnel, enterprise production departments, project construction enterprise working groups, and enterprise pollution treatment departments, were consulted.
The following additional data was collected. Basic data from 2011 to 2016 and some data related to the internal operations of some enterprises were collected from the low-carbon development and enterprise clean production soft science research base and clean production center. If the enterprise was listed, its annual report, corporate website information, and corporate social responsibility reports were consulted. Relevant data on business durations and operations, total assets, net assets, net profit, environmental protection expenditures, and scientific research investment were extracted from the Wuhan Municipal Bureau of Statistics and the “Compilation of Key Enterprises in Donghu High-tech Zone” compiled by the Statistical Center of Wuhan East Lake High-tech Development Zone. Data on new project environmental management implementation frequencies, the pollution attributes for the industries to which the enterprises belonged, the number of government supervisory visits and audits, and the number of mass petitions were extracted from energy conservation assessment reports and questionnaires. After the statistical analysis, a dummy variable was set. The variable definitions, indicator selections, and data type selections are detailed in Table 4.

4.4. Model Selection and Result Analysis

The environmental performance for new high-tech zone projects and the associated influencing factors were developed as a general form of the regression model based on the preliminary research hypothesis. The general form was expressed as:
Y = β 0 + β 1 X 1 + β 2 X 2 + β 3 X 3 + β 4 X 4 + β 5 X 5 + β 6 X 6 + β 7 X 7 + β 8 X 8
where Y is the environmental performance value of the dependent variable calculated by DEA, β i ( i = 1 , 2 , 3 , 4 , 5 , 6 , 7 , 8 ) is the regression coefficient for the model, X1X8 are the independent variables (eight internal and external influencing factors), and β 0 is a constant term.

4.4.1. Descriptive Statistical Analysis

The descriptive statistics in 
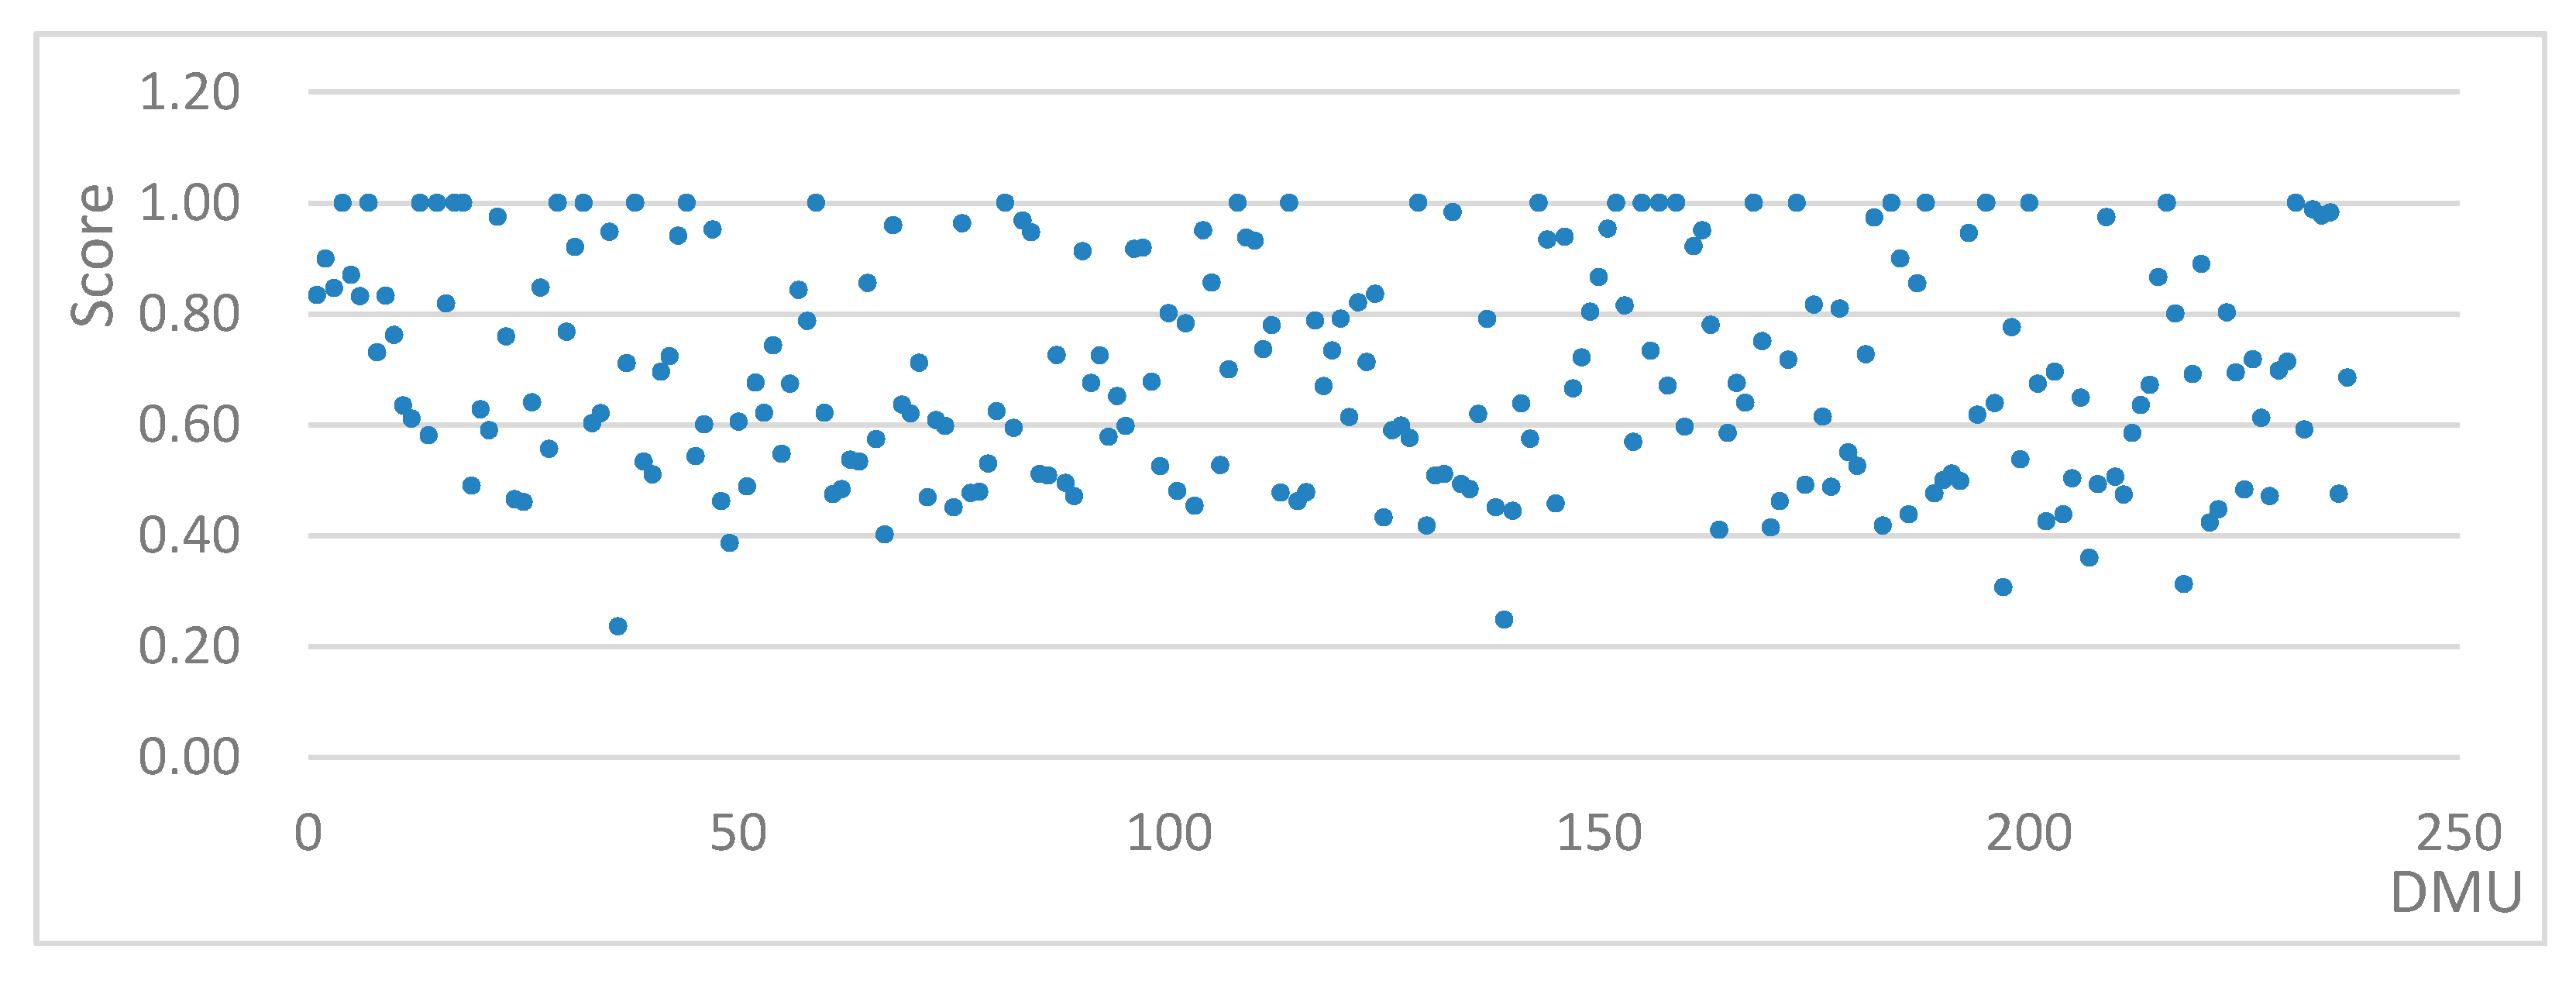
Table 5 indicate that the mean value for the Y environmental performance was 0.6976; that is, 69.76% of environmental resource inputs contributed to the environmental output, but 30.24% of the environmental resources investment was wasted in the implementation process, which means that the environmental performance level of the new project had a large improvement space. The standard deviation for the environmental performance was 0.1985, which was less than 0.2, which indicated that the environmental performance was concentrated around the mean. The minimum environmental performance value was 23.7%, and the maximum was 100%, which meant that the overall environmental performance evaluation results were different for different projects, that there were significant environmental performance differences in the new projects, and that the environmental performances across the enterprises were uneven.
The mean enterprise nature data group indicator indicated that there were more non-listed enterprises than listed enterprises in the research sample. The ROE average was 0.1598, the maximum was 2.68, and the minimum was −1.25. The mean value was low, and the maximum value and the minimum value had positive and negative values, indicating that the new project owner had a win or loss in their current business. The asset-liability ratio, which reflected the long-term solvency, was generally low, but the financial status was relatively healthy, with an average of 0.487 and a standard deviation of 0.256, which indicated that the asset-liability ratio was concentrated around the mean. The enterprise scale also adopted dummy variables, which were counted based on the registered capital scale of the project; that is, a minimum value of 1, a maximum value of 6, and an average value of 3.18; therefore, the enterprise size distribution was considered reasonable. The four variables for environmental management: implementation frequency, project duration, social petitions, and government audits, were extracted from actual statistics. In the sample, the enterprises that had environmental management system certifications, environmental protection departments, and new energy conservation and emissions reduction technologies were counted as the environmental management behavior implementation frequencies; the maximum environmental management behavior implementation frequency was 37, the minimum value was 3, and the average was 19.36; therefore, environmental management for the new project fixed assets investment was considered good. The project duration was based on a monthly construction period, with the maximum being 83, the minimum being 2, the mean being 28.05, and the standard deviation was 13.24, which indicated that the sample data in this group were relatively dispersed, which was consistent with the actual situation because new project scales, technical implementation difficulties, and therefore construction periods varied considerably. The number of social petitions was taken as the number of complaints from residents in surrounding communities during new project construction, for which the maximum was eight, the minimum was zero, and the mean was 2.56. The number of government audits was the number of times an enterprise was audited by the environmental department, for which the maximum was 5, the minimum was 1, and the mean was 3.31. All indicators in the above data sets reflected the actual new project situation for enterprises currently participating in energy conservation assessments and reviews.

4.4.2. Statistical Tests and Regression Analyses

In this paper, SPSS Statistics for Windows, version 19.0 ( SPSS Inc. Chicago, IL, USA) was used to calculate the Pearson’s correlation coefficient to test the correlations between the explanatory variables.
The correlation matrix in Table 6 shows the strength and direction of each independent variable and dependent variable, as well as the correlations between the independent variables. As can be seen, all eight independent variables were correlated with Y, most indicators passed the 1% (bilateral) and 5% (bilateral) significance tests, and the eight selected independent variables were found to better explain the dependent variables. The correlation between X4 (Enterprise scale) and X6 (Project duration) was 0.459 at a 0.01 significance level; therefore, as the absolute correlation value was greater than 0.4, there was a moderate or low degree of correlation, indicating possible multicollinearity between the two indicators. Therefore, the multicollinearity in the multiple regression analysis was tested with Tolerance and VIF (variance inflation factor). As outlined in the fourth edition of modern psychology and educational statistics, the multiple regression method, which can be divided into a forced entry method and forced elimination method, should include all predictive variables in the regression equation when estimating the dependent variables. As the forced entry method includes all predictors with explanatory power for the dependent variables in the regression equation and then calculates the regression coefficients of all the variables without considering the relationships between the predictors at a certain significance level, the forced entry method was adopted in this paper, and therefore, there was only one regression model. As can be seen from the results for the relevant indicators in the fitting model in Table 7, the R square was 0.401, the Adjust R square was 0.349, and the goodness of fit was 0.349, which is considered a good result in social science and management economics. The results indicated that the eight independent variables in the regression model explained 34.9% of the degree of variation in the dependent variables.
Table 8 shows the variance analysis test results for the fitted regression model. The F-value for the significance test of variance was 187.677, and the P-value for the significance test was 0.000, which was less than the significance level of 0.05, indicating that the overall explanatory variance of the regression model reached the significance level. The F-value test also passed the significance test. The regression equation was found to have a good goodness of fit, and therefore, the regression equation reflected the research phenomenon well. However, as the statistical significance of the model did not mean that all model variables had statistical significance, it was necessary to further test each independent variable to determine which regression coefficients were significant.
Therefore, a collinearity diagnosis was conducted on the multiple linear regression analysis, the results for which are shown in Table 9, which shows the regression coefficients in a coefficient summary table, the t-values, the significance probability values for the corresponding significance test, the tolerance, and the VIF for the collinearity statistics. The smaller the tolerance, the higher the accuracy of the prediction by the other independent variables, and the more serious the multicollinearity, and when the tolerance is less than 0.1, severe multicollinearity exists. The VIF (variance inflation factor) is the reciprocal of tolerance; that is, the larger the VIF, the more serious the multicollinearity; therefore, the VIF should not be greater than five in general.
As can be seen from Table 9, the tolerance values for the eight independent variables were all greater than 0.1, and the VIF values were all below 4.000, with none being greater than the evaluation index value 10, which indicated that there were no obvious multicollinearity problems between the independent variables in the regression equation.

4.4.3. Discussion

From Table 9, standardized regression coefficients were adopted for the standardized regression model, as follows:
Y = 0.122 X 1 + 0.133 X 2 0.012 X 3 0.034 X 4 + 0.381 X 5 0.059 X 6 0.279 X 7 + 0.34 X 8 ,
from which the following was observed.
(1) As the enterprise nature coefficient was 0.122, the symbol was positive, the t-test was 2.899, and the probability P was 0.027, it passed the 5% significance level test, which indicated that there was a significant positive correlation between environmental performance and enterprise nature; therefore, Hypothesis 1 was valid; that is, there is a positive correlation between the enterprise nature and the new project environmental performance.
(2) The ROE coefficient was 0.133, the symbol was positive, the t-test was 3.625, and the probability P was 0.032; therefore, the ROE passed the 5% significance test, which indicated that the environmental performance was positively correlated with ROE and Hypothesis 2 was valid; that is, there is a positive correlation between profitability and new project environmental performance.
(3) The asset-liability ratio coefficient was 0.012, the symbol was negative, the t-test was −2.015, and the probability P was 0.007, which passed the 1% significance test, indicating that environmental performance had a significant negative correlation with the asset-liability ratio and Hypothesis 3 was valid; that is, there is a negative correlation between the financial status of the project and the environmental performance of the new project.
(4) The enterprise scale coefficient was 0.034, the symbol was negative, the t-test was −1.148, and the probability P was 0.252; therefore, the significance test was not passed, which may have been due to the principle of managing diminishing returns and the limited enterprise scales. As the enterprise scale expands, transaction costs increase. At the same time, the management capacity was limited, and management efficiency too large, resulting in an efficiency decrease; therefore, Hypothesis 4 was not valid; that is, there is not a positive correlation between the project enterprise scale and new project environmental performance.
(5) The environmental management behavior implementation frequency coefficient was 0.381, the symbol was positive, the t-test was 8.397, and the probability P was 0.000, which passed the 1% significance test, which indicated that there was a significant positive correlation between the environmental performance and the environmental management behavior implementation frequency; therefore, Hypothesis 5 was valid; that is, there is a positive correlation between the environmental management behavior implementation frequency and the environmental performance of new projects.
(6) The project duration coefficient was 0.059, the symbol was negative, the t-test was 3.506, and the probability P was 0.712; therefore, the significance test was not passed, which may have been related to social inertia. Because of the economic externalities associated with environmental problems, perfunctory behavior or free-riding is common. Therefore, the longer the project duration, the more obvious the perfunctory free-riding behavior, and the lower the environmental performance; therefore, Hypothesis 6 was not valid: that is, there is not a positive correlation between the project period and the environmental performance of the new project.
(7) The social petition coefficient was 0.279, the symbol was negative, the t-test was −7.449, and the probability P was 0.000, which passed the 1% significance test, and indicated that the environmental performance level had a significant negative correlation with the number of social petitions; therefore, Hypothesis 7 should be corrected to the following; there is a negative correlation between the society petition frequency and the environmental performance of new projects. The reason for this could be that the amount of pollution discharged by new projects participating in energy conservation evaluation assessment and reviews does not normally reach the evaluation standard, which can significantly impact the surrounding communities; therefore, there would be an increase in opposition and complaints.
(8) The government audit number coefficient was 0.340, the symbol was positive, the t-test was 8.010, and the probability P was 0.000, which passed the 1% significance test, and indicated that the environmental performance had a significant positive correlation with the number of government audits; therefore, Hypothesis 8 was valid: that is, there is a positive correlation between government supervision behavior and the environmental performance of new projects. The verification of this hypothesis indicated that, to a certain extent, external pressure (mainly from the management committee of the high-tech zone and local governments at various levels) could prompt enterprises to strengthen their environmental management behavior and improve their environmental performance. Therefore, high-tech development zone administrative committees need to supervise the environmental management of enterprises and carry out energy conservation evaluation assessments and reviews.

5. Conclutions

The evaluation index for new fixed asset investment projects, which included resources, economic, and environmental characteristics, was determined based on current research, energy conservation evaluations, and work reports. This paper exemplified China’s Optics Valley to develop an environmental performance evaluation method for new fixed assets investment projects and to identify the influencing factors, for which a system measurement model was constructed using generalized DEA with undesirable output, and a multiple regression analysis model established to determine the key internal and external influencing factors for environmental performance of new projects, from which the following conclusions were made.
(1) It was found that the average environmental performance for new high-tech zone projects was about 69.76%, which indicated that there was a certain degree of resource waste and a large environmental performance improvement space. A big difference was also found between the environmental performances for the various new projects. Therefore, it is recommended that enterprises implement clean production through process improvements and technological innovations, improve energy utilization efficiencies, and reduce unnecessary energy consumption and emissions. To improve the environmental performance of new projects and achieve sustainable development, enterprises should have the courage to assume corporate social responsibility and participate in energy conservation assessments and reviews. The government and relevant departments should also strengthen their environmental supervision and law enforcement, pay greater attention to the differences among different projects, and encourage enterprises to increase their environmental protection investment.
(2) The influencing factor analysis results found that there were different countermeasures and suggestions based on the internal and external factors.
As the enterprise nature, ROE and environmental management behavior implementation frequency internal factors were all found to have a positive impact on the environmental performance of new projects, and enterprise managers could consider the following aspects for improvements. First, non-listed enterprises should learn from listed enterprises and publish CSR reports or independent environmental reports every year to improve their environmental protection information transparency and CSR information disclosure quality. Second, as enterprises with higher profitability are better able to implement environmental governance and protection by increasing environmental protection investment, enhancing scientific and technological innovation, and implementing energy conservation and emissions reduction, they could stimulate environmental protection motivation and improve overall environmental performance. Third, the more frequently environmental management strategies are implemented, the higher the environmental performance of new projects; therefore, managers should pay attention to the development of a low-carbon development atmosphere by focusing on employee green development demands and responding to green and sustainable development requirements. Finally, the asset-liability ratio was found to have a negative effect on the environmental performance of new projects, which may indicate that high asset-liability ratio enterprises could face higher operating costs or energy conservation and emissions reduction technology implementation bottlenecks. Therefore, these enterprises should actively seek technical assistance and strengthen their communication with industry peers. The Chinese government and relevant departments could also provide greater tax incentives, set up special assistance funds, or provide technical assistance to high asset-liability ratio enterprises.
The external factors cover social management and government supervision. It was found that the larger the numbers of social petitions, the worse the environmental performance, which indicated that the number of social petitions could possibly reflect the actual environmental performance level of new projects, which in turn demonstrates that as public environmental awareness has grown, this could be used to encourage high-tech enterprises to implement environmental management strategies and improve new project environmental performances. To some extent, the level of public environmental awareness reflects the level of a country’s cultural civilization; that is, the higher the public’s recognition of environmental protection, the more quickly and efficiently it helps the government enact and implement environmental laws and regulations and the more enterprises are motivated to take active measures to improve their environmental management. Further, as strengthening government supervision and auditing was found to be associated with improved new project environmental performances, it is necessary to strengthen the environmental management audit of enterprises in high-tech zones by including energy conservation performance assessments and environmental protection performance assessments in the high-tech development zone management committee performance assessments. Further, to enhance the sense of responsibility for the relevant subjects and ensure the full implementation of energy conservation evaluation and review systems, the government performance appraisal department should seek to promote the implementation of a target responsibility system, establish an environmental protection special GDP assessment system, and include energy consumption indicators in the comprehensive evaluation system.

Author Contributions

Conceptualization, F.D. and Y.J.; methodology, Y.J. and M.Y.; investigation and data collection, S.Z. and Y.J.; software processing, Y.J.; validation, F.D. and Y.J.; writing-original draft preparation, Y.J. and S.Z.; writing-review and editing, F.D. and Y.J.; supervision, Y.J. and M.Y.

Funding

This research was funded by the Major Projects of Social Science Research and Planning in Sichuan Province (Grant No. SC19ZD18).

Conflicts of Interest

The authors declare no conflict of interest.

References

  1. Chevallier, J.; Goutte, S. Estimation of Lévy-driven Ornstein–Uhlenbeck processes: Application to modeling of CO2 and fuel-switching. Ann. Oper. Res. 2017, 255, 169–197. [Google Scholar] [CrossRef]
  2. Cai, Y.; Lu, Y.; Stegman, A.; Newth, D. Simulating emissions intensity targets with energy economic models: Algorithm and application. Ann. Oper. Res. 2017, 255, 141–155. [Google Scholar] [CrossRef]
  3. Mikko, P.; Pasi, P.; Marko, T.; Jouni, T. Perspectives to Performance of Environment and Health Assessments and Modelsâ—From Outputs to Outcomes? Int. J. Environ. Res. Public Health 2013, 10, 2621–2642. [Google Scholar]
  4. Suasana, I.G.A.K.G.; Ekawati, N.W. Environmental commitment and green innovation reaching success new products of creative industry in Bali. J. Bus. Retail Manag. Res. 2018, 12. [Google Scholar] [CrossRef]
  5. Zehir, C.; Balak, D. Market Dynamism and Firm Performance Relation: The Mediating Effects of Positive Environment Conditions and Firm Innovativeness. EMAJ Emerg. Mark. J. 2018, 8, 45–51. [Google Scholar] [CrossRef] [Green Version]
  6. Dües, C.M.; Tan, K.H.; Lim, M. Green as the new Lean: How to use Lean practices as a catalyst to greening your supply chain. J. Clean. Prod. 2013, 40, 93–100. [Google Scholar] [CrossRef]
  7. Qiu, Y.; Shaukat, A.; Tharyan, R. Environmental and social disclosures: Link with corporate financial performance. Br. Account. Rev. 2016, 48, 102–116. [Google Scholar] [CrossRef] [Green Version]
  8. Braam, G.J.; de Weerd, L.U.; Hauck, M.; Huijbregts, M.A. Determinants of corporate environmental reporting: The importance of environmental performance and assurance. J. Clean. Prod. 2016, 129, 724–734. [Google Scholar] [CrossRef]
  9. Chuang, S.-P.; Huang, S.-J. The effect of environmental corporate social responsibility on environmental performance and business competitiveness: The mediation of green information technology capital. J. Bus. Ethics 2018, 150, 991–1009. [Google Scholar] [CrossRef]
  10. Latan, H.; Jabbour, C.J.C.; de Sousa Jabbour, A.B.L.; Wamba, S.F.; Shahbaz, M. Effects of environmental strategy, environmental uncertainty and top management’s commitment on corporate environmental performance: The role of environmental management accounting. J. Clean. Prod. 2018, 180, 297–306. [Google Scholar] [CrossRef]
  11. Brooks, C.; Oikonomou, I. The effects of environmental, social and governance disclosures and performance on firm value: A review of the literature in accounting and finance. Br. Account. Rev. 2018, 50, 1–15. [Google Scholar] [CrossRef]
  12. Koskela, M.; Vehmas, J. Defining eco-efficiency: A case study on the Finnish forest industry. Bus. Strategy Environ. 2012, 21, 546–566. [Google Scholar] [CrossRef]
  13. Ruf, B.M.; Muralidhar, K.; Brown, R.M.; Janney, J.J.; Paul, K. An empirical investigation of the relationship between change in corporate social performance and financial performance: A stakeholder theory perspective. J. Bus. Ethics 2001, 32, 143–156. [Google Scholar] [CrossRef]
  14. Carroll, A.B. A commentary and an overview of key questions on corporate social performance measurement. Bus. Soc. 2000, 39, 466–478. [Google Scholar] [CrossRef]
  15. Lankoski, L. Determinants of Environmental Profit: An Analysis of the Firm-Level Relationship between Environmental Performance and Economic Performance; Helsinki University of Technology: Espoo, Finland, 2000. [Google Scholar]
  16. Wood, D.J. Measuring corporate social performance: A review. Int. J. Manag. Rev. 2010, 12, 50–84. [Google Scholar] [CrossRef]
  17. Wang, J.; Wang, R.; Zhu, Y.; Li, J. Life cycle assessment and environmental cost accounting of coal-fired power generation in China. Energy Policy 2018, 115, 374–384. [Google Scholar] [CrossRef]
  18. Wang, Q.; Yang, Z. Industrial water pollution, water environment treatment, and health risks in China. Environ. Pollut. 2016, 218, 358–365. [Google Scholar] [CrossRef]
  19. Wang, Z.; Yang, L. Delinking indicators on regional industry development and carbon emissions: Beijing–Tianjin–Hebei economic band case. Ecol. Indic. 2015, 48, 41–48. [Google Scholar] [CrossRef]
  20. Ye, F.F.; Yang, L.H.; Wang, Y.M. An interval efficiency evaluation model for air pollution management based on indicators integration and different perspectives. J. Clean. Prod. 2019, 118945. [Google Scholar] [CrossRef]
  21. Solarin, S.A.; Al-Mulali, U.; Musah, I.; Ozturk, I. Investigating the pollution haven hypothesis in Ghana: An empirical investigation. Energy 2017, 124, 706–719. [Google Scholar] [CrossRef]
  22. Song, M.-L.; Fisher, R.; Wang, J.-L.; Cui, L.-B. Environmental performance evaluation with big data: Theories and methods. Ann. Oper. Res. 2018, 270, 459–472. [Google Scholar] [CrossRef]
  23. Qu, S.; Zhou, Y.; Zhang, Y.; Wahab, M.; Zhang, G.; Ye, Y. Optimal strategy for a green supply chain considering shipping policy and default risk. Comput. Ind. Eng. 2019, 131, 172–186. [Google Scholar] [CrossRef]
  24. Huang, R.; Qu, S.; Yang, X.; Liu, Z. Multi-stage distributionally robust optimization with risk aversion. J. Ind. Manag. Optim. 2019, 13. [Google Scholar] [CrossRef] [Green Version]
  25. Freedman, M.; Patten, D.M. Evidence on the pernicious effect of financial report environmental disclosure. Account. Forum (Taylor Fr.) 2004, 28, 27–41. [Google Scholar]
  26. Hamilton, J.T. Pollution as news: Media and stock market reactions to the toxics release inventory data. J. Environ. Econ. Manag. 1995, 28, 98–113. [Google Scholar] [CrossRef]
  27. Arabi, B.; Doraisamy, S.M.; Emrouznejad, A.; Khoshroo, A. Eco-efficiency measurement and material balance principle: An application in power plants Malmquist Luenberger Index. Ann. Oper. Res. 2017, 255, 221–239. [Google Scholar] [CrossRef] [Green Version]
  28. Tyteca, D. On the Measurement of the Environmental Performance of Firms—A Literature Review and a Productive Efficiency Perspective. J. Environ. Manag. 1996, 46, 281–308. [Google Scholar] [CrossRef]
  29. Charnes, A.; Cooper, W.W.; Rhodes, E. Measuring the efficiency of decision making units. Eur. J. Oper. Res. 1978, 2, 429–444. [Google Scholar] [CrossRef]
  30. Ramanathan, R.; Ramanathan, U.; Bentley, Y. The debate on flexibility of environmental regulations, innovation capabilities and financial performance—A novel use of DEA. Omega 2018, 75, 131–138. [Google Scholar] [CrossRef] [Green Version]
  31. Park, Y.S.; Lim, S.H.; Egilmez, G.; Szmerekovsky, J. Environmental efficiency assessment of US transport sector: A slack-based data envelopment analysis approach. Transp. Res. Part D Transp. Environ. 2018, 61, 152–164. [Google Scholar] [CrossRef] [Green Version]
  32. Sueyoshi, T.; Goto, M.; Ueno, T. Performance analysis of US coal-fired power plants by measuring three DEA efficiencies. Energy Policy 2010, 38, 1675–1688. [Google Scholar] [CrossRef]
  33. Hu, Q. Research on Correlation between Environmental Performance and Financial Performance of Listed Companies. China’s Popul. Resour. Environ. 2012, 6, 25–34. [Google Scholar]
  34. Zhou, H.; Li, Z. Environmental Management System Certification Improves Environmental Management Performance. Environ. Sustain. Dev. 2013, 2, 102–105. [Google Scholar]
  35. Lin, W.L.; Ho, J.A.; Sambasivan, M. Impact of Corporate Political Activity on the Relationship Between Corporate Social Responsibility and Financial Performance: A Dynamic Panel Data Approach. Sustainability 2018, 11, 60. [Google Scholar] [CrossRef] [Green Version]
  36. Yin, H.; Ma, C. International integration: A hope for a greener China? Int. Mark. Rev. 2009, 26, 348–367. [Google Scholar] [CrossRef]
  37. Dawkins, C.E.; Fraas, J.W. Erratum to: Beyond acclamations and excuses: Environmental performance, voluntary environmental disclosure and the role of visibility. J. Bus. Ethics 2011, 99, 383–397. [Google Scholar] [CrossRef]
  38. Xiao, C.; Wang, Q.; van der Vaart, T.; van Donk, D.P. When does corporate sustainability performance pay off? The impact of country-level sustainability performance. Ecol. Econ. 2018, 146, 325–333. [Google Scholar] [CrossRef]
  39. Pineiro-Chousa, J.; Romero-Castro, N.; Vizcaíno-González, M. Inclusions in and Exclusions from the S&P 500 Environmental and Socially Responsible Index: A Fuzzy-Set Qualitative Comparative Analysis. Sustainability 2019, 11, 1211. [Google Scholar]
  40. Farooq, O.; Farooq, M.; Reynaud, E. Does Employees’ Participation in Decision Making Increase the level of Corporate Social and Environmental Sustainability? An Investigation in South Asia. Sustainability 2019, 11, 511. [Google Scholar] [CrossRef] [Green Version]
  41. Chen, Y.; Yang, Y.; Du, D. Research on Performance Evaluation of Provincial Ecological Environment Based on Cloud Model. Soft Sci. 2018, 1, 100–103. [Google Scholar]
  42. Long, J.; Pan, J.; Feng, T. Research on the Influence of Lean Production and Enterprise Environmental Management on the Sustainable Development Performance of Manufacturing Industry. Soft Sci. 2018, 4, 68–71. [Google Scholar]
  43. Haihua, Z.; Shuanglong, W. Community environmental pressure, environmental information communication and environmental performance. Soft Sci. 2018, 32, 80–83. [Google Scholar]
  44. Jin, Y.; Zheng, S.; Tang, D.; Feng, Q. Environmental Performance Evaluation of New Fixed Assets Investment Projects—Taking Wuhan East Lake High-Tech Development Zone as an Example. In International Conference on Management Science and Engineering Management; Springer: Cham, Switzerland, 2018; pp. 1327–1340. [Google Scholar]
  45. Petrash, J.M.; Cooper III, W.S.; Baskerville, S.L.; Blanton, M.S. Report of the Legislation and Regulatory Reform Committee. Energy Law J. 2007, 28, 375. [Google Scholar]
  46. James, P. Business environmental performance measurement. Bus. Strategy Environ. 1994, 3, 59–67. [Google Scholar] [CrossRef]
  47. Zheng, S.; Jin, Y.; Zhang, J. Investigation and Study on the Influencing Factors of Enterprise Environmental Management Behavior under the Background of Two-oriented Society—Taking Wuhan East Lake High-tech Development Zone (China’s Optical Valley) as an Example. Sci. Technol. Prog. Policy 2015, 11, 83–88. [Google Scholar]
  48. Du, X.; Weng, J.; Zeng, Q.; Chang, Y.; Pei, H. Do Lenders Applaud Corporate Environmental Performance? Evidence from Chinese Private-Owned Firms. J. Bus. Ethics 2017, 143, 179–207. [Google Scholar] [CrossRef]
Figure 1. Article structure map.
Ijerph 16 04891 g001
Figure 2. Environmental performance value distribution map.
Ijerph 16 04891 g002
Table 1. Environmental performance new project assessment indicators.
Target LayerInput/Output IndicatorSpecific Indicators
Environmental impact indicatorsInput indexResource consumption indicatorsPower consumption
Water Consumption
Steam consumption
Natural gas consumption
Financial input indicatorTotal investment
Output indexDesirable outputEnergy evaluation benefit indicatorEnergy saving quantity
Undesirable outputEnvironmental impact indicatorsCarbon dioxide emissions
Sulfur dioxide emissions
Table 2. Environmental performance values for the new fixed assets investment projects.
DMUScoreDMUScoreDMUScoreDMUScoreDMUScoreDMUScore
10.83403410.695298111210.613731610.921602010.67344
20.89979420.72310820.593941220.820401620.950352020.42593
30.84619430.94080830.968061230.713061630.780172030.69537
41441840.947231240.835621640.410452040.43802
50.87032450.54297850.511221250.432461650.585322050.50311
60.83144460.60018860.507871260.589771660.675522060.64870
71470.95178870.725521270.598481670.639672070.35988
80.73059480.46232880.494721280.5759116812080.49269
90.83246490.38664890.4712812911690.750942090.97435
100.76183500.60499900.912541300.417801700.414712100.50609
110.63478510.48843910.675031310.508221710.461982110.47409
120.61079520.67561920.725001320.511131720.717132120.58472
131530.62132930.577771330.9834317312130.63503
140.58068540.74319940.651621340.492731740.491672140.67161
151550.54714950.597731350.483471750.816472150.86567
160.81828560.67385960.916891360.619181760.614322161
171.00000570.84309970.919361370.790361770.488242170.80032
181580.78713980.677611380.451141780.809432180.31238
190.48971591990.524811390.248501790.550342190.69154
200.62746600.621641000.801271400.444381800.525322200.88936
210.59018610.474401010.480571410.637951810.726542210.42359
220.97459620.483411020.782511420.574421820.973852220.44712
230.75880630.536851030.4536914311830.418262230.80231
240.46537640.533111040.950141440.9334518412240.69384
250.46057650.855631050.856131450.457731850.899822250.48331
260.64031660.573851060.527251460.938441860.438622260.71790
270.84698670.402281070.699641470.665541870.854422270.61203
280.55617680.9594810811480.7212818812280.47119
291690.636191090.937131490.803501890.476092290.69730
300.76708700.619831100.931701500.866061900.499772300.71354
310.92010710.711201110.735781510.953071910.511542311
321720.469241120.7791015211920.498612320.59157
330.60245730.608361130.477491530.814641930.945342330.98787
340.62087740.5979311411540.569201940.617852340.97681
350.94771750.450651150.46239155119512350.98257
360.23667760.963201160.477981560.732941960.638672360.47521
370.71091770.476411170.7875815711970.306822370.68523
381780.478821180.669811580.670381980.77594
390.53313790.530021190.7335615911990.53735
400.51001800.624531200.791151600.595922001
Table 3. Some examples of enterprise environmental management.
No.Environmental Management ExamplesRelevant Legal Basis
1The enterprise regularly conducts environmental training for employeesEnvironmental protection law of the People’s Republic of China;
Environmental impact assessment law of the People’s Republic of China;
Law of the People’s Republic of China on energy conservation;
Regulations on the administration of environmental protection for construction projects.
2Pollutant emissions enterprise system monitoring indicators
3The enterprise regularly publishes environmental reports
4The enterprise has implemented an environmental plan
5The enterprise has clear environmental requirements for the raw materials and suppliers.
6Extensive publicity and education on environmental protection and energy saving
7The enterprise’s products have an ISO9001 quality management system certification.
8The enterprise’s products have an ISO14001 environmental management system certification.
9The enterprise has a dedicated department or dedicated staff responsible for environmental management
10The enterprise has established an environmental management system with the supplier
11The enterprise purchases environmentally friendly equipment
12The enterprise evaluates environmental performance based on policy objectives and seeks reasonable improvements
13The enterprise has a clean production audit
14The enterprise has a documented environmental policy to guide environmental management
15The enterprise’s products have obtained GB/T18001 occupational health and safety management system certification
Data source: the enterprise environmental management examples were mainly derived from the relevant national environmental policies, regulations, and standards.
Table 4. Variable definitions, indicator selections, and data types.
Variable TypeVariableVariable Indicator SelectionAbbeviation
Dependent variableEnvironmental performance(0, 1]Y
Independent variableEnterprise natureListing = 1, no listing = 0X1
ROERoe = net profit/net assetsX2
Asset-liability ratioAsset-liability ratio = total liabilities/total assetsX3
Enterprise scaleRegistered capitalX4
Environmental Management behavior implementation frequencyIFEMB, the data comes from questionnaire statisticsX5
Project durationThe length of months from the start of construction to completionX6
Social petition numberNumber of complaints and letters from residents of surrounding communitiesX7
Government audit numberNumber of times the enterprise was audited by the environment during the project construction periodX8
Table 5. Descriptive statistics.
VariableNMinimum ValueMaximumMeanStandard Deviation
Y Environmental performance2370.236671.0000.697590.198500
X1 Enterprise nature237010.030.170
X2 ROE237−1.252.680.15980.36811
X3 Asset-liability ratio2370.0111.2110.487460.255657
X4 Enterprise scale237163.181.336
X5 Environmental management behavior implementation frequency23733719.367.556
X6 Project duration23728328.0513.240
X7 Social petition number237082.561.842
X8 Government audit number237153.311.117
Valid N (list state)237
Table 6. Pearson’s correlation analysis for the explanatory variables.
YX1X2X3X4X5X6X7X8
Y1
X10.127 *1
X20.119 *−0.0411
X3−0.129 *−0.0500.0521
X4−0.019 *−0.0620.0150.0471
X50.175 **0.127−0.107−0.033−0.141 **1
X6−0.088 **−0.103−0.023−0.0310.459 **−0.182 **1
X7−0.216 **−0.0670.1020.0360.112 **−0.047 **0.169 **1
X80.155 **0.019−0.155−0.049−0.054 *0.295 **−0.148−0.315 **1
** Significantly correlated at the 0.01 level (both sides). * Significantly correlated at the 0.05 level (both sides). a. List N = 237.
Table 7. Model summary.
ModelRR SquareAdjust R SquareStandard Estimated Error
10.633 a0.4010.3495.85059
a Predicted variables: (constant), X8 government audit number, X1 enterprise nature, X3 asset-liability ratio, X2 ROE, X6 project duration, X4 enterprise scale, X7 social petition number, X5 environmental management behavior implementation.
Table 8. Regression equation F value.
ModelSum of SquareDfMean SquareFSig.
1Regression8.07381.009187.6770.000 a
Residual1.2262280.005
Total9.299236
a Predicted variables: (constant), X8 government audit number, X1 enterprise nature, X3 asset-liability ratio, X2 ROE, X6 project duration, X4 enterprise scale, X7 social petition number, X5 environmental management behavior implementation.
Table 9. Results of the regression equation.
MODELNon-Standardized CoefficientStandard CoefficienttSig.Collinear Statistic
BStandard errortrial versionToleranceVIF
(constant)0.3920.037 10.5120.000
X1 Enterprise nature0.1260.0290.1222.8990.0270.9531.050
X2 ROE0.1010.0210.1333.6250.0320.9691.032
X3 Asset-liability ratio−0.0100.019−0.012−2.0150.0070.9881.012
X4 Enterprise scale−0.0050.004−0.034−1.1480.2520.6541.529
X5 Environmental management behavior implementation frequency0.0100.0010.3818.3970.0000.2813.560
X6 Project duration−0.330.055−0.0593.5060.7120.7771.287
X7 Social petition number−0.0300.004−0.279−7.4490.0000.4112.433
X8 Government audit number0.0600.0080.3408.0100.0000.3213.118

