Comparison of the JNC7 and 2017 American College of Cardiology/American Heart Association Guidelines for the Management of Hypertension in Koreans: Analysis of Two Independent Nationwide Population-Based Studies


Abstract
:1. Introduction
2. Materials and Methods
2.1. Study Population and Data Collection
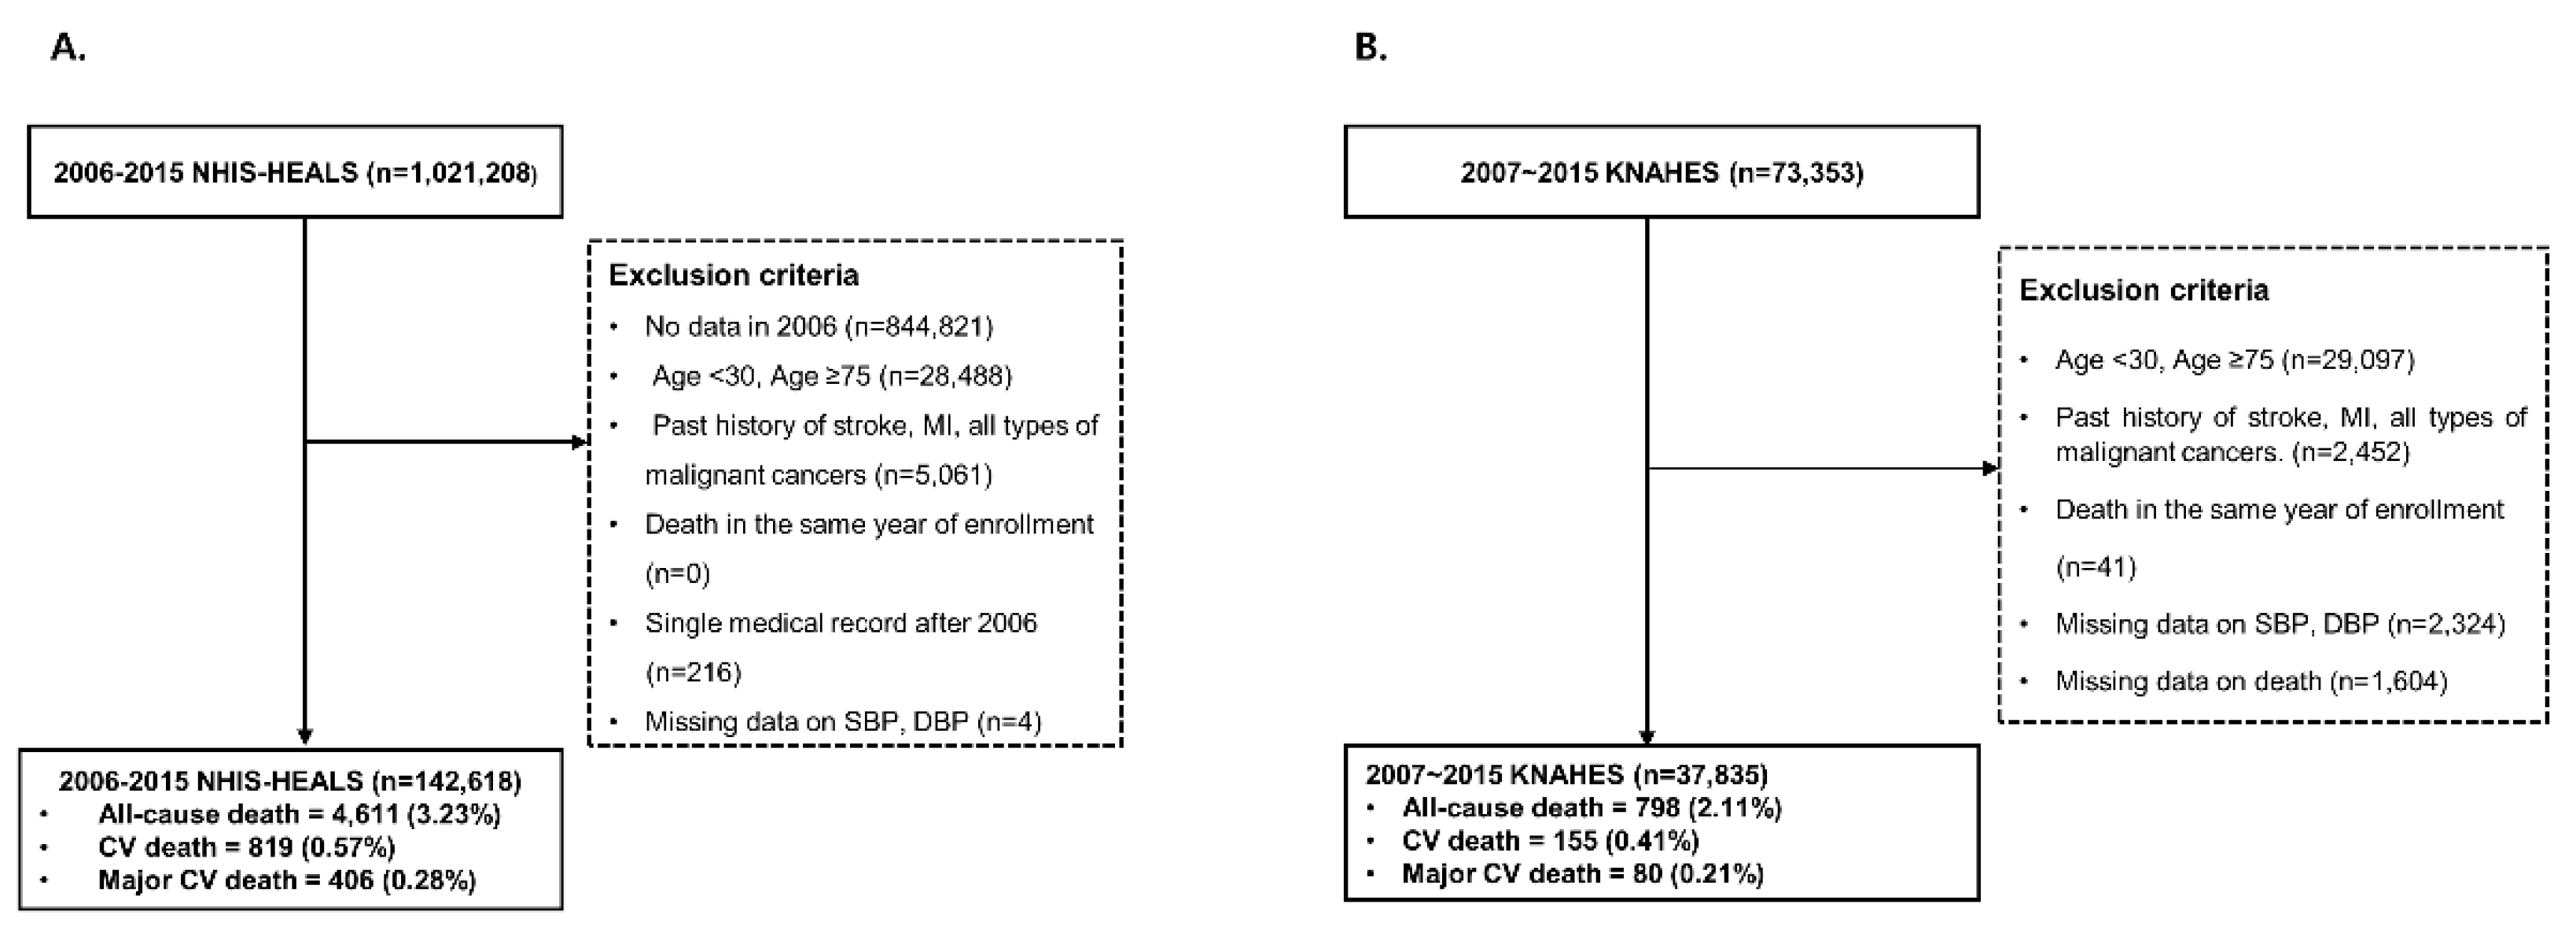
2.1.1. National Health Insurance System-National Health Screening Cohort (2006–2015 NHIS-HEALS)
2.1.2. Korea National Health and Nutrition Examination Survey (2007–2015 KNHANES Cohort)
2.2. Outcome Measurement
2.3. Statistical Analysis
3. Results
4. Discussion
5. Conclusions
Author Contributions
Funding
Acknowledgments
Conflicts of Interest
References
- Whelton, P.K.; Carey, R.M.; Aronow, W.S.; Casey, D.E., Jr.; Collins, K.J.; Dennison Himmelfarb, C.; DePalma, S.M.; Gidding, S.; Jamerson, K.A.; Jones, D.W.; et al. 2017 ACC/AHA/AAPA/ABC/ACPM/AGS/APhA/ASH/ASPC/NMA/PCNA Guideline for the Prevention, Detection, Evaluation and Management of High Blood Pressure in Adults: Executive Summary: A Report of the American College of Cardiology/American Heart Association Task Force on Clinical Practice Guidelines. Circulation 2018, 138, 426–483. [Google Scholar] [CrossRef]
- Wright, J.T., Jr.; Williamson, J.D.; Whelton, P.K.; Snyder, J.K.; Sink, K.M.; Rocco, M.V.; Reboussin, D.M.; Rahman, M.; Oparil, S.; Lewis, C.E.; et al. A Randomized Trial of Intensive versus Standard Blood-Pressure Control. N. Engl. J. Med. 2015, 373, 2103–2116. [Google Scholar] [CrossRef] [PubMed]
- Reboussin, D.M.; Allen, N.B.; Griswold, M.E.; Guallar, E.; Hong, Y.; Lackland, D.T.; Miller, E.P.R., 3rd; Polonsky, T.; Thompson-Paul, A.M.; Vupputuri, S. Systematic Review for the 2017 ACC/AHA/AAPA/ABC/ACPM/AGS/APhA/ASH/ASPC/NMA/PCNA Guideline for the Prevention, Detection, Evaluation, and Management of High Blood Pressure in Adults: A Report of the American College of Cardiology/American Heart Association Task Force on Clinical Practice Guidelines. Circulation 2018, 138, 595–616. [Google Scholar] [CrossRef]
- Vaduganathan, M.; Pareek, M.; Qamar, A.; Pandey, A.; Olsen, M.H.; Bhatt, D.L. Baseline Blood Pressure, the 2017 ACC/AHA High Blood Pressure Guidelines, and Long-Term Cardiovascular Risk in SPRINT. JAMA Cardiol. 2018, 131, 956–960. [Google Scholar] [CrossRef] [PubMed]
- Bundy, J.D.; Mills, K.T.; Chen, J.; Li, C.; Greenland, P.; He, J. Estimating the Association of the 2017 and 2014 Hypertension Guidelines With Cardiovascular Events and Deaths in US Adults: An Analysis of National Data. JAMA Cardiol. 2018, 3, 572–581. [Google Scholar] [CrossRef] [PubMed] [Green Version]
- Ogihara, T.; Saruta, T.; Matsuoka, H.; Shimamoto, K.; Fujita, T.; Shimada, K.; Imai, Y.; Nishigaki, M. Valsartan in elderly isolated systolic hypertension (VALISH) study: Rationale and design. Hypertens. Res. 2004, 27, 657–661. [Google Scholar] [CrossRef] [PubMed] [Green Version]
- Margolis, K.L.; O’Connor, P.J.; Morgan, T.M.; Buse, J.B.; Cohen, R.M.; Cushman, W.C.; Cutler, J.A.; Evans, G.W.; Gerstein, H.C.; Grimm, R.H., Jr.; et al. Outcomes of combined cardiovascular risk factor management strategies in type 2 diabetes: The ACCORD randomized trial. Diabetes Care 2014, 37, 1721–1728. [Google Scholar] [CrossRef] [PubMed] [Green Version]
- Williams, B.; Mancia, G.; Spiering, W.; Agabiti Rosei, E.; Azizi, M.; Burnier, M.; Clement, D.L.; Coca, A.; de Simone, G.; Dominiczak, A.; et al. 2018 ESC/ESH Guidelines for the management of arterial hypertension: The Task Force for the management of arterial hypertension of the European Society of Cardiology and the European Society of Hypertension: The Task Force for the management of arterial hypertension of the European Society of Cardiology and the European Society of Hypertension. J. Hypertens. 2018, 36, 1953–2041. [Google Scholar] [CrossRef] [PubMed] [Green Version]
- Kario, K.; Chen, C.-H.; Park, S.; Park, C.-G.; Hoshide, S.; Cheng, H.-M.; Huang, Q.-F.; Wang, J.-G. Consensus document on improving hypertension management in Asian patients, taking into account Asian characteristics. Hypertension 2018, 71, 375–382. [Google Scholar] [CrossRef] [PubMed]
- Kweon, S.; Kim, Y.; Jang, M.-J.; Kim, Y.; Kim, K.; Choi, S.; Chun, C.; Khang, Y.-H.; Oh, K. Data resource profile: The Korea national health and nutrition examination survey (KNHANES). Int. J. Epidemiol. 2014, 43, 69–77. [Google Scholar] [CrossRef] [PubMed] [Green Version]
- Nwankwo, T.; Yoon, S.S.; Burt, V.; Gu, Q. Hypertension among adults in the United States: National Health and Nutrition Examination Survey, 2011–2012. NCHS Data Brief. 2013, 133, 1–8. [Google Scholar]
- Weiss, J.; Freeman, M.; Low, A.; Fu, R.; Kerfoot, A.; Paynter, R.; Motu’apuaka, M.; Kondo, K.; Kansagara, D. Benefits and harms of intensive blood pressure treatment in adults aged 60 years or older: A systematic review and meta-analysis. Ann. Intern. Med. 2017, 166, 419–429. [Google Scholar] [CrossRef] [PubMed]
- Ihm, S.-H.; Bakris, G.; Sakuma, I.; Sohn, I.S.; Koh, K.K. Controversies in the 2017 ACC/AHA Hypertension Guidelines: Who Can Be Eligible for Treatments Under the New Guidelines?―An Asian Perspective. Circ. J. 2019, 83, 504–510. [Google Scholar] [CrossRef] [PubMed] [Green Version]
- Collaboration, A.P.C.S. Blood pressure and cardiovascular disease in the Asia Pacific region. J. Hypertens. 2003, 21, 707–716. [Google Scholar]
- Perry, H.M., Jr.; Davis, B.R.; Price, T.R.; Applegate, W.B.; Fields, W.S.; Guralnik, J.M.; Kuller, L.; Pressel, S.; Stamler, J.; Probstfield, J.L. Effect of treating isolated systolic hypertension on the risk of developing various types and subtypes of stroke: The Systolic Hypertension in the Elderly Program (SHEP). JAMA 2000, 284, 465–471. [Google Scholar] [CrossRef] [PubMed] [Green Version]
- Bohm, M.; Schumacher, H.; Teo, K.K.; Lonn, E.M.; Mahfoud, F.; Mann, J.F.E.; Mancia, G.; Redon, J.; Schmieder, R.E.; Sliwa, K.; et al. Achieved blood pressure and cardiovascular outcomes in high-risk patients: Results from ONTARGET and TRANSCEND trials. Lancet 2017, 389, 2226–2237. [Google Scholar] [CrossRef]
- Phillips, R.A.; Xu, J.; Peterson, L.E.; Arnold, R.M.; Diamond, J.A.; Schussheim, A.E. Impact of Cardiovascular Risk on the Relative Benefit and Harm of Intensive Treatment of Hypertension. J. Am. Coll. Cardiol. 2018, 71, 1601–1610. [Google Scholar] [CrossRef] [PubMed]
- Son, J.S.; Choi, S.; Kim, K.; Kim, S.M.; Choi, D.; Lee, G.; Jeong, S.-M.; Park, S.Y.; Kim, Y.-Y.; Yun, J.-M.; et al. Association of Blood Pressure Classification in Korean Young Adults According to the 2017 American College of Cardiology/American Heart Association Guidelines With Subsequent Cardiovascular Disease EventsCardiovascular Disease Rates Among Young Korean Adults by 2017 ACC/AHA Hypertension Guideline DefinitionsCardiovascular Disease Rates Among Young Korean Adults by 2017 ACC/AHA Hypertension Guideline Definitions. JAMA 2018, 320, 1783–1792. [Google Scholar] [CrossRef] [PubMed] [Green Version]
- Kim, D.; Yang, P.S.; Kim, T.H.; Jang, E.; Shin, H.; Kim, H.Y.; Yu, H.T.; Uhm, J.S.; Kim, J.Y.; Pak, H.N.; et al. Ideal Blood Pressure in Patients With Atrial Fibrillation. J. Am. Coll. Cardiol. 2018, 72, 1233–1245. [Google Scholar] [CrossRef] [PubMed]
- Severino, P.; Maestrini, V.; Mariani, M.V.; Birtolo, L.I.; Scarpati, R.; Mancone, M.; Fedele, F. Structural and myocardial dysfunction in heart failure beyond ejection fraction. Heart Fail. Rev. 2019, 1–9. [Google Scholar] [CrossRef] [Green Version]


| Guidelines | JNC7 Guidelines | 2017 ACC/AHA Guidelines | ||||||
|---|---|---|---|---|---|---|---|---|
| 2006–2015 NHIS-HEALS | <130 and <80 (n = 84,653) | 130/80–139/89 (n = 44,214) | ≥140/90 (n = 13,751) | p-Value 1 | <120 and <80 (n = 53,374) | 120–129 and <80 (n = 31,279) | ≥130/80 (n = 57,965) | p-Value 1 |
| Age | 45.53 ± 10.52 | 49.36 ± 11.26 | 53.92 ± 11.94 | <0.0001 | 44.04 ± 9.7 | 48.09 ± 11.35 | 50.45 ± 11.58 | <0.0001 |
| Female Sex, N (%) | 38948 (46.01) | 14,321 (32.39) | 5023 (36.53) | <0.0001 | 27,377 (51.29) | 11571 (36.99) | 19344 (33.37) | <0.0001 |
| Height, m2 | 163.76 ± 8.81 | 164.63 ± 9.15 | 162.85 ± 9.38 | <0.0001 | 163.42 ± 8.59 | 164.35 ± 9.15 | 164.21 ± 9.24 | <0.0001 |
| Weight, kg | 62.46 ± 10.46 | 67.11 ± 11.21 | 67.14 ± 11.94 | <0.0001 | 60.87 ± 10.04 | 65.17 ± 10.59 | 67.11 ± 11.39 | <0.0001 |
| BMI, kg/m2 | 23.21 ± 2.84 | 24.67 ± 2.98 | 25.21 ± 3.24 | <0.0001 | 22.71 ± 2.74 | 24.05 ± 2.81 | 24.8 ± 3.05 | <0.0001 |
| Physical activity, N (%) | <0.0001 | <0.0001 | ||||||
| 0 | 43,192 (52.57) | 20,980 (48.83) | 6884 (51.54) | 28,066 (54.2) | 15126 (49.79) | 27,864 (49.47) | ||
| 1–2 | 23,590 (28.71) | 13,070 (30.42) | 3533 (26.45) | 14,606 (28.21) | 8984 (29.57) | 16,603 (29.48) | ||
| 3–4 | 9530 (11.6) | 5235 (12.18) | 1504 (11.26) | 5856 (11.31) | 3674 (12.09) | 6739 (11.97) | ||
| 5–6 | 2141(2.61) | 1150 (2.68) | 380 (2.85) | 1254 (2.42) | 887 (2.92) | 1530 (2.72) | ||
| Almost everyday | 3708(4.51) | 2531 (5.89) | 1055 (7.9) | 2001 (3.86) | 1707 (5.62) | 3586 (6.37) | ||
| Household income, N (%) | <0.0001 | <0.0001 | ||||||
| 1–2 | 11,982 (14.41) | 6366 (14.66) | 2279 (16.74) | 7450 (14.18) | 4532 (14.79) | 8645 (15.16) | ||
| 3–4 | 11,231 (13.5) | 5834 (13.44) | 2056 (15.1) | 7084 (13.49) | 4147 (13.53) | 7890 (13.84) | ||
| 5–6 | 13,664 (16.43) | 7278 (16.77) | 2438 (17.91) | 8407 (16.01) | 5257 (17.16) | 9716 (17.04) | ||
| 7–8 | 22,734 (27.34) | 11,374 (26.2) | 3340 (24.53) | 14,441 (27.49) | 8293 (27.07) | 14,714 (25.8) | ||
| 9–10 | 23,555 (28.32) | 12,559 (28.93) | 3503 (25.73) | 15,143 (28.83) | 8412 (27.45) | 16,062 (28.17) | ||
| Smokers, N (%) | 27,345 (33.27) | 17,041 (39.69) | 4827 (36.24) | <0.0001 | 15,827 (30.55) | 11518 (37.92) | 21868(38.87) | <0.0001 |
| Alcohol drinkers, N (%) | ||||||||
| Non-drinker | 45,514 (54.86) | 20,411 (47.07) | 6732 (50.1) | 29,806 (57.03) | 15708 (51.17) | 27,143 (47.79) | ||
| Intermittent drinker | 35,851 (43.22) | 21,417 (49.39) | 6007 (44.71) | 21,708 (41.54) | 14143 (46.07) | 27,424 (48.28) | ||
| Daily drinker | 1593 (1.92) | 1535 (3.54) | 697 (5.19) | 747 (1.43) | 846 (2.76) | 2232 (3.93) | ||
| SBP, mm Hg | 116.16 ± 11.73 | 130.75 ± 12.3 | 146.66 ± 16.25 | <0.0001 | 111.83 ± 10.23 | 123.55 ± 10.36 | 134.52 ± 14.96 | <0.0001 |
| DBP, mm Hg | 72.67 ± 8.2 | 82.72 ± 8.34 | 90.37 ± 11.06 | <0.0001 | 70.64 ± 7.87 | 76.13 ± 7.55 | 84.53 ± 9.63 | <0.0001 |
| Fasting Glucose, mg/dL | 93.47 ± 22.22 | 98.08 ± 25.49 | 103.91 ± 32.39 | <0.0001 | 91.79 ± 20.37 | 96.33 ± 24.8 | 99.46 ± 27.4 | <0.0001 |
| Total cholesterol, mg/dL | 192.03 ± 35.65 | 200.21 ± 36.33 | 204.12 ± 38.42 | <0.0001 | 189.15 ± 34.95 | 196.95 ± 36.3 | 201.14 ± 36.87 | <0.0001 |
| AST, mg/dL | 24.6 ± 17.94 | 27.32 ± 23.45 | 29.21 ± 22.55 | <0.0001 | 23.7 ± 14.59 | 26.14 ± 22.45 | 27.77 ± 23.26 | <0.0001 |
| ALT, mg/dL | 24.12 ± 22.32 | 29 ± 28.98 | 30.15 ± 26.87 | <0.0001 | 22.58 ± 20.05 | 26.75 ± 25.53 | 29.27 ± 28.5 | <0.0001 |
| 2007–2015 KNAHES Cohort | <130 and <80 (n = 20,903) | 130/80–139/89 (n = 9983) | ≥140/90 (n = 6949) | p-value 1 | <120 and <80 (n = 17,989) | 120–129 and <80 (n = 2914) | ≥130/80 (n = 16,932) | p-value 1 |
| Age | 48.4 ± 12.5 | 52.0 ± 11.9 | 55.4 ± 11.6 | <0.0001 | 46.765 ± 11.9 | 58.469 ± 11.709 | 53.439 ± 11.933 | <0.0001 |
| Female Sex, N (%) | 13704 (65.56) | 4714 (47.22) | 3175 (45.69) | <0.0001 | 11,986 (66.63) | 1718 (58.96) | 7889 (46.59) | <0.0001 |
| BMI, kg/m2 | 23.2 ± 3.1 | 24.5 ± 3.3 | 25.1 ± 3.3 | <0.0001 | 5623 (32.20) | 1039 (36.96) | 7504 (45.87) | <0.0001 |
| Physical activity, N (%) | 1233 (6.15) | 603 (6.31) | 430 (6.46) | 00.6341 | 2266 (6.25) | 1080 (6.25) | 153 (5.52) | 0.2307 |
| Household income, N (%) | <0.0001 | <0.0001 | ||||||
| Q1 | 2988 (14.49) | 1654 (16.83) | 1616 (23.63) | 2199 (12.39) | 789 (27.51) | 3270 (19.62) | ||
| Q2 | 5277 (25.60) | 2518 (25.63) | 1829 (26.74) | 4464(25.15) | 813 (28.35) | 4347 (26.08) | ||
| Q3 | 6128 (29.72) | 2735 (27.83) | 1764 (25.79) | 5415 (30.51) | 713 (24.86) | 4499 (27.00) | ||
| Q4 | 6224 (30.19) | 2919 (29.71) | 1630 (23.83) | 5671 (31.95) | 553 (19.28) | 4549 (27.30) | ||
| Smokers, N (%) | 6662 (32.86) | 4361 (45.19) | 3143 (46.85) | <0.0001 | 7573 (45.48) | 978 (37.94) | 7085 (48.50) | <0.0001 |
| Alcohol drinkers, N (%) | 8551 (44.46) | 4234 (48.50) | 2851 (48.51) | <0.0001 | 23.072 ± 3.072 | 24.238 ± 3.151 | 24.751 ± 3.295 | <0.0001 |
| SBP, mm Hg | 108.22 ± 9.639 | 124.22 ± 8.702 | 143.71 ± 14.043 | <0.0001 | 105.71 ± 7.833 | 123.71 ± 2.93 | 132.22 ± 14.75 | <0.0001 |
| DBP, mm Hg | 69.876 ± 6.256 | 81.892 ± 4.81 | 90.245 ± 9.73 | <0.0001 | 69.367 ± 6.233 | 73.017 ± 5.429 | 85.32 ± 8.329 | <0.0001 |
| Pulse rate | 57.557 ± 12.041 | 57.992 ± 12.185 | 60.412 ± 16.426 | 0.0002 | 57.531 ± 11.812 | 57.659 ± 12.921 | 59.042 ± 14.225 | 0.0217 |
| Fasting Glucose, mg/dL | 96.55 ± 21.92 | 101.61 ± 24.799 | 104.42 ± 25.985 | <0.0001 | 95.269 ± 20.484 | 104.52 ± 28.035 | 102.76 ± 25.328 | <0.0001 |
| HbA1c, mg/dL | 5.827 ± 0.946 | 5.981 ± 1.005 | 6.12 ± 1.081 | <0.0001 | 5.765 ± 0.897 | 6.17 ± 1.124 | 6.036 ± 1.038 | <0.0001 |
| Insulin, mg/dL | 9.209 ± 6.171 | 10.146 ± 6.963 | 10.575 ± 7.307 | <0.0001 | 9.03 ± 5.71 | 10.361 ± 8.48 | 10.328 ± 7.114 | <0.0001 |
| Total cholesterol, mg/dL | 187.28 ± 34.381 | 195.58 ± 35.902 | 199.46 ± 38.069 | <0.0001 | 186.61 ± 34.123 | 191.4 ± 35.675 | 197.17 ± 36.854 | <0.0001 |
| Triglycerides, mg/dL | 120.61 ± 88.481 | 154.95 ± 124.52 | 174.44 ± 142.33 | <0.0001 | 116.98 ± 86.061 | 143.13 ± 99.322 | 162.93 ± 132.45 | <0.0001 |
| HDL-cholesterol, mg/dL | 50.173 ± 11.786 | 48.489 ± 11.6 | 48.216 ± 11.583 | <0.0001 | 50.481 ± 11.828 | 48.248 ± 11.331 | 48.377 ± 11.594 | <0.0001 |
| LDL-cholesterol, mg/dL | 113.09 ± 31.369 | 116.23 ± 34.847 | 116.34 ± 38.254 | <0.0001 | 112.82 ± 30.927 | 114.73 ± 33.952 | 116.28 ± 36.283 | <0.0001 |
| AST, mg/dL | 21.302 ± 11.932 | 24.121 ± 14.125 | 25.489 ± 14.695 | <0.0001 | 20.962 ± 11.371 | 23.416 ± 14.781 | 24.681 ± 14.376 | <0.0001 |
| ALT, mg/dL | 19.931 ± 18.982 | 24.604 ± 18.695 | 25.672 ± 17.601 | <0.0001 | 19.613 ± 18.845 | 21.904 ± 19.698 | 25.042 ± 18.262 | <0.0001 |
| BUN, mg/dL | 14.144 ± 4.162 | 14.783 ± 4.362 | 15.098 ± 4.576 | <0.0001 | 13.953 ± 4.065 | 15.326 ± 4.545 | 14.912 ± 4.454 | <0.0001 |
| Creatinine, mg/dL | 0.812 ± 0.228 | 0.865 ± 0.259 | 0.869 ± 0.283 | <0.0001 | 0.808 ± 0.219 | 0.837 ± 0.276 | 0.867 ± 0.269 | <0.0001 |
| WBC, mg/dL | 5.951 ± 1.693 | 6.263 ± 1.761 | 6.423 ± 1.781 | <0.0001 | 5.915 ± 1.685 | 6.175 ± 1.73 | 6.328 ± 1.771 | <0.0001 |
| Guidelines | 2006–2015 NHIS-HEALS | 2007–2015 KNAHES Cohorts | ||||||||||
|---|---|---|---|---|---|---|---|---|---|---|---|---|
| Groups | Warranty Period (0.5%) | n | Person-Time (Years) | Events, N (%) | Incidence per 1000 Person-Years (95% CI) | Warranty Period (0.5%) | n | Person-Time (Years) | Events, N (%) | Incidence per 1000 Person-Years (95% CI) | ||
| JNC7 | ACM | <130 and <80 | 3.59 | 84,653 | 784,456.07 | 1854 (2.19) | 2.36 (0.15–4.57) | 2.45 | 20,903 | 11,2374.2 | 352 (1.68) | 3.13 (2.81–3.46) |
| 130/80–139/89 | 2.42 | 44,214 | 407,805.67 | 1548 (3.50) | 3.80 (0.73–6.86) | 2.24 | 9983 | 54,240.97 | 220 (2.20) | 4.06 (3.52–4.60) | ||
| ≥140/90 | 1.24 | 13,751 | 123,886.58 | 1209 (8.79) | 9.76 (4.22–15.30) | 1.72 | 6949 | 38,376.21 | 226 (3.25) | 5.89 (5.12–6.66) | ||
| ACD | <130 and <80 | 9.67 | 84,653 | 784,456.07 | 254 (0.30) | 0.32 (0.00–2.54) | 8.19 | 20,903 | 11,2374.2 | 60 (0.29) | 0.53 (0.40–0.67) | |
| 130/80–139/89 | 8.42 | 44,214 | 407,805.67 | 279 (0.63) | 0.68 (0.00–3.75) | 6.28 | 9983 | 54,240.97 | 38 (0.38) | 0.70 (0.48–0.92) | ||
| ≥140/90 | 2.75 | 13,751 | 123,886.58 | 286 (2.08) | 2.31 (0.00–7.87) | 3.5 | 6949 | 38,376.21 | 57 (0.82) | 1.49 (1.10–1.87) | ||
| MACE | <130 and <80 | 9.68 | 84,653 | 784,456.07 | 120 (0.14) | 0.15 (0.00–2.37) | 9.5 | 20,903 | 11,2374.2 | 32 (0.15) | 0.29 (0.19–0.38) | |
| 130/80–139/89 | 9.84 | 44,214 | 407,805.67 | 136 (0.31) | 0.33 (0.00–3.40) | 9.5 | 9983 | 54,240.97 | 19 (0.19) | 0.35 (0.19–0.51) | ||
| ≥140/90 | 4.08 | 13,751 | 123,886.58 | 150 (1.09) | 1.21 (0.00–6.78) | 6.5 | 6949 | 38,376.21 | 29 (0.42) | 0.76 (0.48–1.03) | ||
| 2017 ACC/AHA | ACM | <120 and <80 | 3.51 | 53,374 | 494,529.82 | 1051 (1.97) | 2.13 (0.00–4.91) | 2.74 | 17,989 | 97,368.52 | 259 (1.44) | 2.66 (2.34–2.98) |
| 120–129 and <80 | 3.67 | 31,279 | 289,926.25 | 803 (2.57) | 2.77 (0.00–6.41) | 1.72 | 2914 | 15,005.72 | 93 (3.19) | 6.20 (4.94–7.45) | ||
| ≥130/80 | 1.83 | 57,965 | 531,692.25 | 2757 (4.76) | 5.19 (2.50–7.87) | 1.92 | 16,932 | 92,617.18 | 446 (2.63) | 4.82 (4.37–5.26) | ||
| ACD | <120 and <80 | 9.51 | 53,374 | 494,529.82 | 123 (0.23) | 0.25 (0.00–3.04) | 8.21 | 17,989 | 97,368.52 | 35(0.19) | 0.36 (0.24–0.48) | |
| 120–129 and <80 | 6.59 | 31,279 | 289,926.25 | 131 (0.42) | 0.45 (0.00–4.09) | 3.28 | 2914 | 15,005.72 | 25 (0.86) | 1.67 (1.01–2.32) | ||
| ≥130/80 | 6.17 | 57,965 | 531,692.25 | 565 (0.97) | 1.06 (0.00–3.75) | 4.78 | 16,932 | 92,617.18 | 95 (0.56) | 1.03 (0.82–1.23) | ||
| MACE | <120 and <80 | 8.76 | 53,374 | 494,529.82 | 57 (0.11) | 0.12 (0.00–2.90) | 9.5 | 17,989 | 97,368.52 | 18 (0.10) | 0.19 (0.10–0.27) | |
| 120–129 and <80 | 9.68 | 31,279 | 289,926.25 | 63 (0.20) | 0.22 (0.00–3.86) | 4.91 | 2914 | 15,005.72 | 14 (0.48) | 0.93 (0.44–1.42) | ||
| ≥130/80 | 9.34 | 57,965 | 531,692.25 | 286 (0.49) | 0.54 (0.00–3.23) | 8.16 | 16,932 | 92,617.18 | 48 (0.28) | 0.51 (0.37–0.67) | ||
| Guidelines | 2006–2015 NHIS-HEALS | ||||||
| Groups | Adjusted HR (95% CI) 1 | p-Value for Trend | Pairwise Comparison p-Value | ||||
| JNC7 | ACM | <130 and <80 | 1 | <0.0001 | ref | ||
| 130/80–139/89 | 1.10 (1.02–1.18) | 0.0102 | ref | ||||
| ≥140/90 | 1.84 (1.70–2.00) | <0.0001 | <0.0001 | ref | |||
| ACD | <130 and <80 | 1 | <0.0001 | ref | |||
| 130/80–139/89 | 1.36 (1.13–1.62) | 0.0011 | ref | ||||
| ≥140/90 | 2.72 (2.26–3.27) | <0.0001 | <0.0001 | Ref | |||
| MACE | <130 and <80 | 1 | <0.0001 | ref | |||
| 130/80–139/89 | 1.40 (1.08–1.81) | 0.012 | ref | ||||
| ≥140/90 | 3.25 (2.51–4.21) | <0.0001 | <0.0001 | Ref | |||
| 2017 ACC/AHA | ACM | <120 and <80 | 1 | <0.0001 | ref | ||
| 120–129 and <80 | 0.77 (0.69–0.84) | <0.0001 | ref | ||||
| ≥130/80 | 1.15 (1.06–1.24) | 0.0005 | <0.0001 | Ref | |||
| ACD | <120 and <80 | 1 | <0.0001 | ref | |||
| 120–129 and <80 | 0.99 (0.77–1.28) | 0.9098 | ref | ||||
| ≥130/80 | 1.76 (1.42–2.17) | <0.0001 | <0.0001 | Ref | |||
| MACE | <120 and <80 | 1 | <0.0001 | ref | |||
| 120–129 and <80 | 1.14 (0.79–1.65) | 0.4968 | ref | ||||
| ≥130/80 | 2.09 (1.53–2.84) | <0.0001 | <0.0001 | Ref | |||
| Guidelines | 2007–2015 KNAHES Cohorts | ||||||
| Groups | Adjusted HR (95% CI) 2 | p for Trend | Pairwise Comparison p-Value | ||||
| JNC7 | ACM | <130 and <80 | 1 | 0.0234 | ref. | ||
| 130/80–139/89 | 0.97 (0.82–1.15) | 0.7352 | ref. | ||||
| ≥140/90 | 1.24 (1.05–1.46) | 0.0128 | 0.0095 | ref. | |||
| ACD | <130 and <80 | 1 | 0.0022 | ref. | |||
| 130/80–139/89 | 1.00 (0.66–1.51) | 0.9963 | ref. | ||||
| ≥140/90 | 1.83 (1.26–2.65) | 0.0015 | 0.0041 | ref. | |||
| MACE | <130 and <80 | 1 | 0.0482 | ref. | |||
| 130/80–139/89 | 0.91 (0.51–1.62) | 0.7520 | ref. | ||||
| ≥140/90 | 1.73 (1.04–2.90) | 0.0361 | 0.0298 | ref. | |||
| 2017 ACC/AHA | ACM | <120 and <80 | 1 | 0.0592 | ref. | ||
| 120–129 and <80 | 1.37 (1.08–1.74) | 0.0101 | ref. | ||||
| ≥130/80 | 1.18(1.01–1.38) | 0.0407 | 0.1913 | ref. | |||
| ACD | <120 and <80 | 1 | 0.0051 | ref. | |||
| 120–129 and <80 | 2.59 (1.54–4.36) | 0.0003 | ref. | ||||
| ≥130/80 | 1.86 (1.25–2.77) | 0.0022 | 0.1446 | ref. | |||
| MACE | <120 and <80 | 1 | 0.0654 | ref. | |||
| 120–129 and <80 | 2.88 (1.42–5.87) | 0.0034 | ref. | ||||
| ≥130/80 | 1.81 (1.04–3.15) | 0.0363 | 0.1271 | ref. | |||
| 2006–2015 NHIS-HEALS | 2007–2015 KNAHES Cohort | |||||
|---|---|---|---|---|---|---|
| JNC 7 | 2017 ACC/AHA | p-Value | JNC 7 | 2017 ACC/AHA | p-Value | |
| ACM | 0.622 (0.613–0.63) | 0.605 (0.597–0.612) | <0.0001 | 0.566 (0.546–0.584) | 0.57 (0.551–0.586) | 0.4237 |
| ACD | 0.682 (0.666–0.704) | 0.656 (0.643–0.673) | <0.0001 | 0.607 (0.561–0.649) | 0.613 (0.575–0.645) | 0.5854 |
| MACE | 0.692 (0.667–0.716) | 0.663 (0.644–0.686) | <0.0001 | 0.582 (0.533–0.636) | 0.596 (0.544–0.639) | 0.3861 |
© 2019 by the authors. Licensee MDPI, Basel, Switzerland. This article is an open access article distributed under the terms and conditions of the Creative Commons Attribution (CC BY) license (http://creativecommons.org/licenses/by/4.0/).
Share and Cite
Choi, W.-J.; Lee, H.-S.; Hong, J.H.; Chang, H.-J.; Lee, J.-W. Comparison of the JNC7 and 2017 American College of Cardiology/American Heart Association Guidelines for the Management of Hypertension in Koreans: Analysis of Two Independent Nationwide Population-Based Studies. Int. J. Environ. Res. Public Health 2019, 16, 5134. https://0-doi-org.brum.beds.ac.uk/10.3390/ijerph16245134
Choi W-J, Lee H-S, Hong JH, Chang H-J, Lee J-W. Comparison of the JNC7 and 2017 American College of Cardiology/American Heart Association Guidelines for the Management of Hypertension in Koreans: Analysis of Two Independent Nationwide Population-Based Studies. International Journal of Environmental Research and Public Health. 2019; 16(24):5134. https://0-doi-org.brum.beds.ac.uk/10.3390/ijerph16245134
Chicago/Turabian StyleChoi, Won-Jun, Hye-Sun Lee, Jung Hwa Hong, Hyuk-Jae Chang, and Ji-Won Lee. 2019. "Comparison of the JNC7 and 2017 American College of Cardiology/American Heart Association Guidelines for the Management of Hypertension in Koreans: Analysis of Two Independent Nationwide Population-Based Studies" International Journal of Environmental Research and Public Health 16, no. 24: 5134. https://0-doi-org.brum.beds.ac.uk/10.3390/ijerph16245134