Contamination, Sources, and Health Risks Associated with Soil PAHs in Rebuilt Land from a Coking Plant, Beijing, China

Abstract
:1. Introduction
2. Materials and Methods
2.1. Chemicals
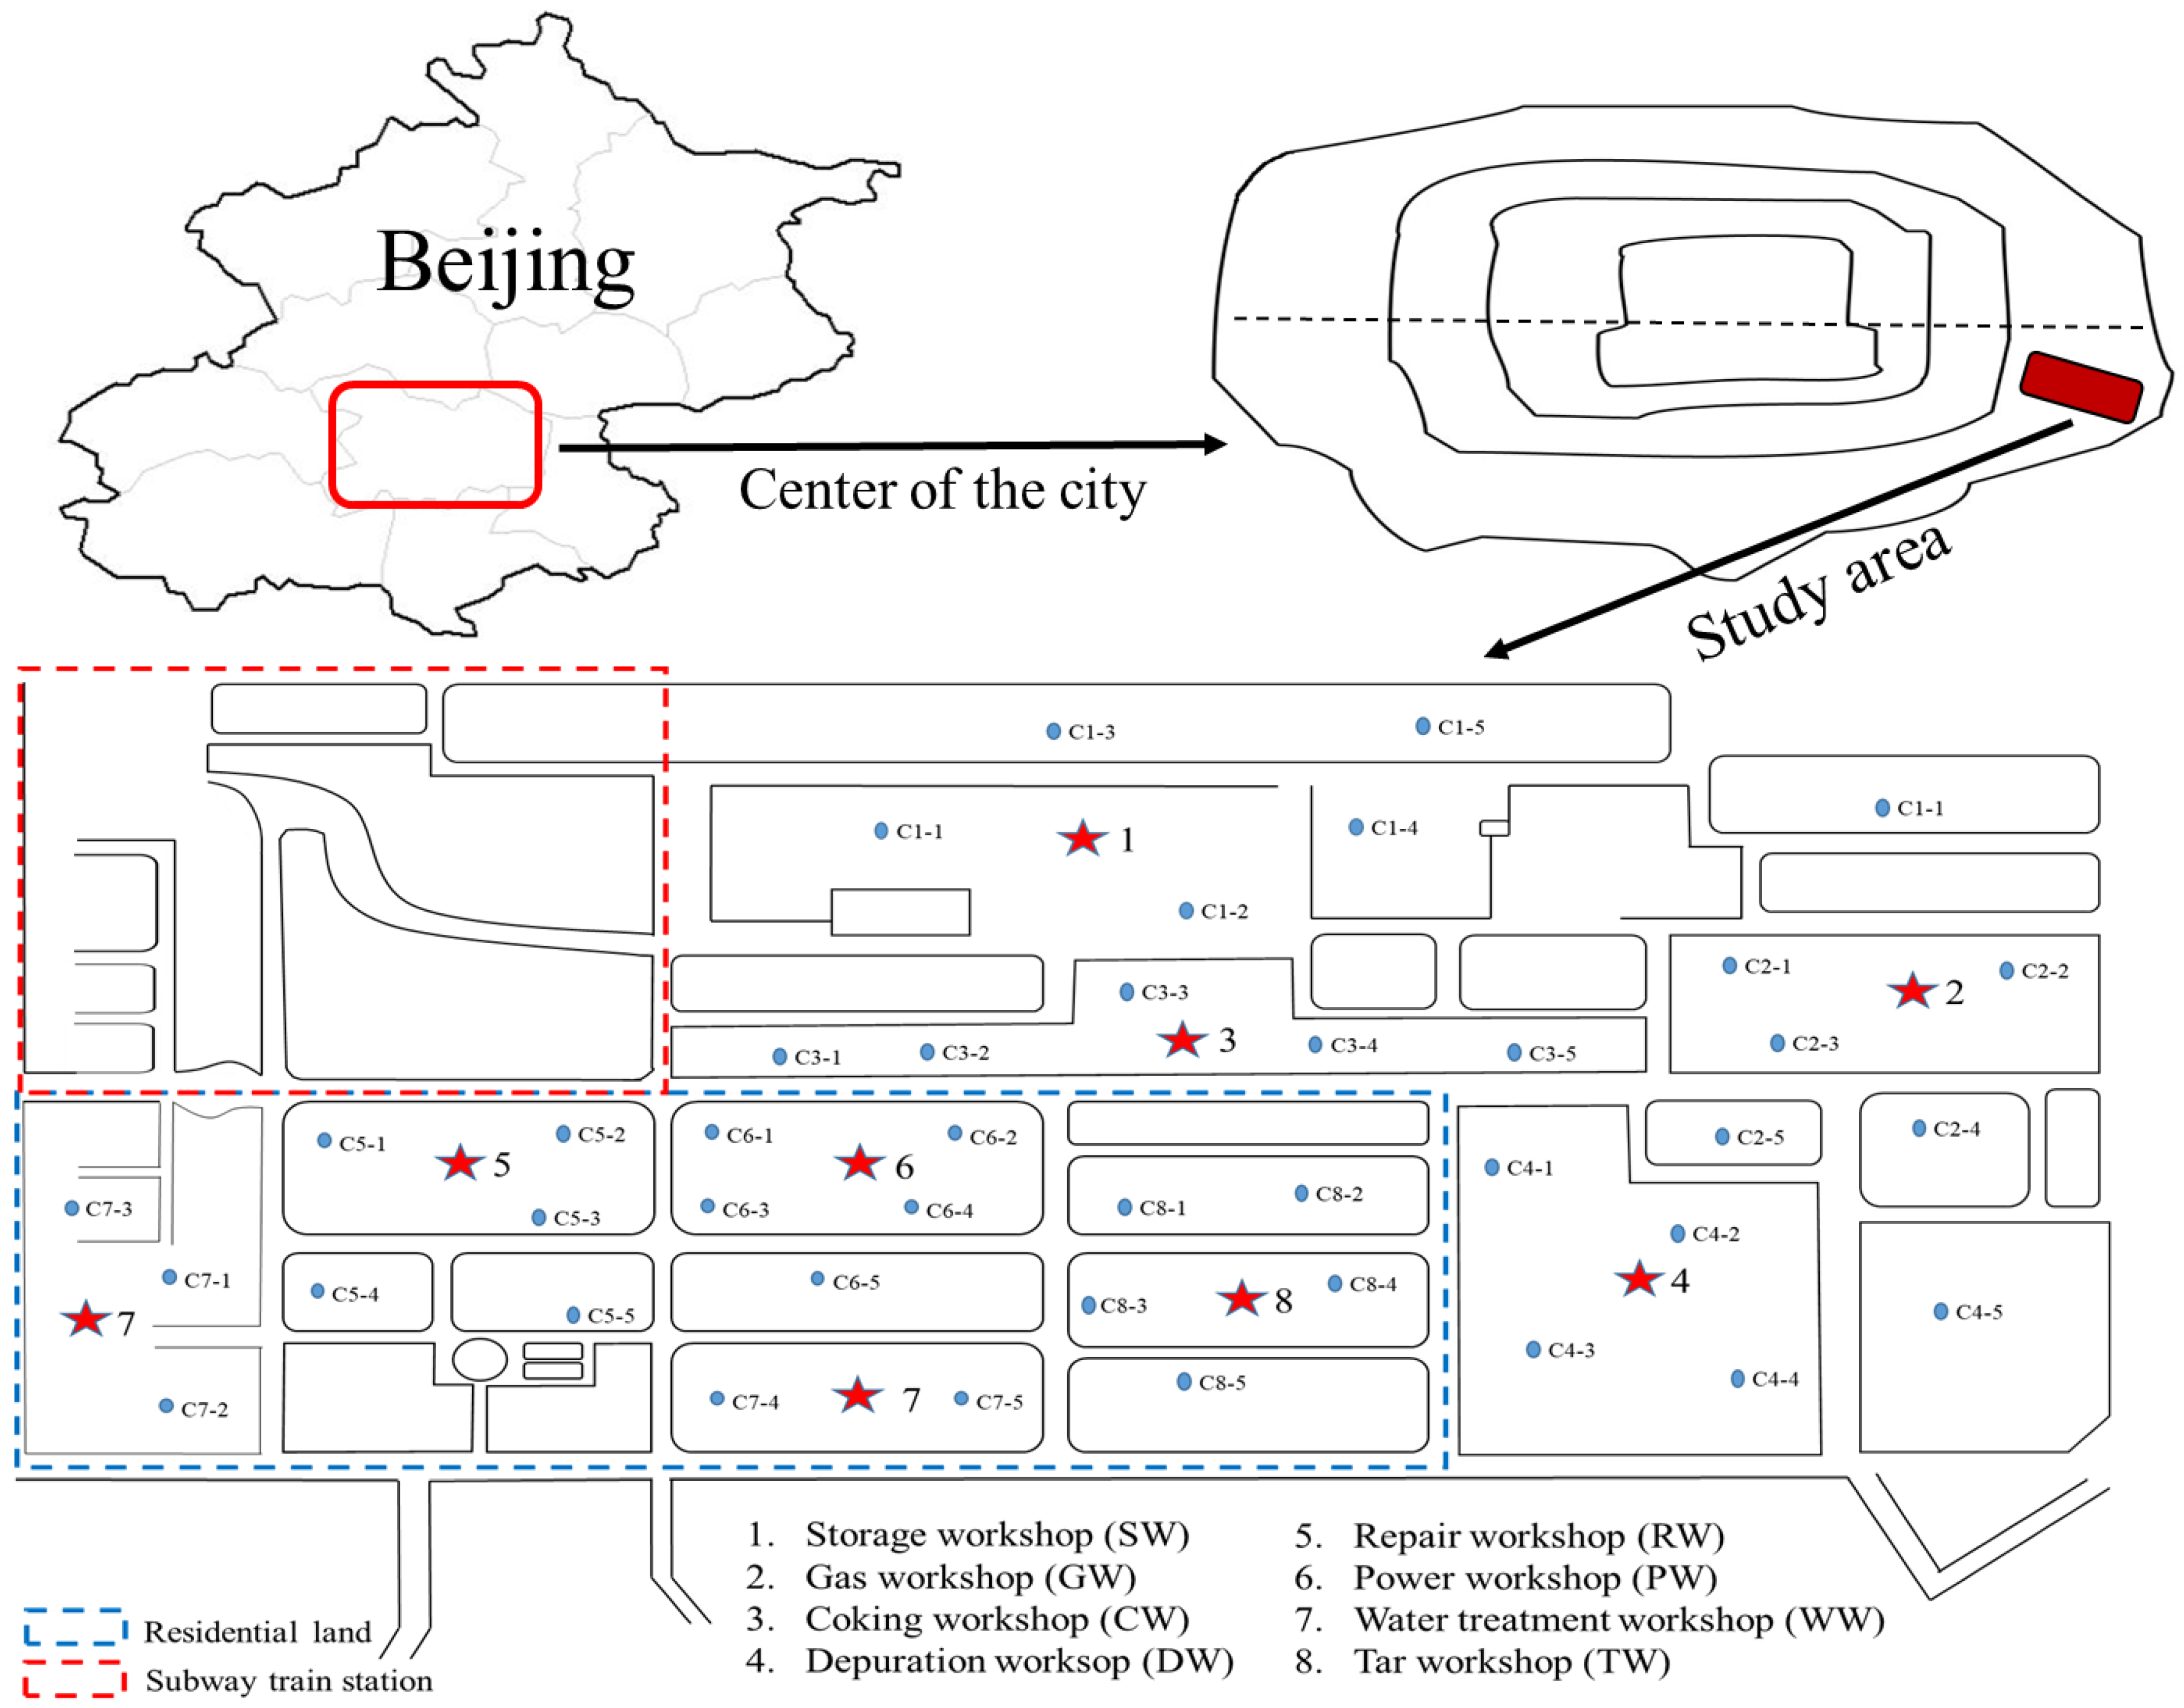
2.2. Soil Sampling
2.3. PAH Analysis
2.4. Quality Assurance and Quality Control
2.5. Genotoxicity Analysis
2.6. Health Risk Assessment
2.7. Statistical Analysis
3. Results and Discussion
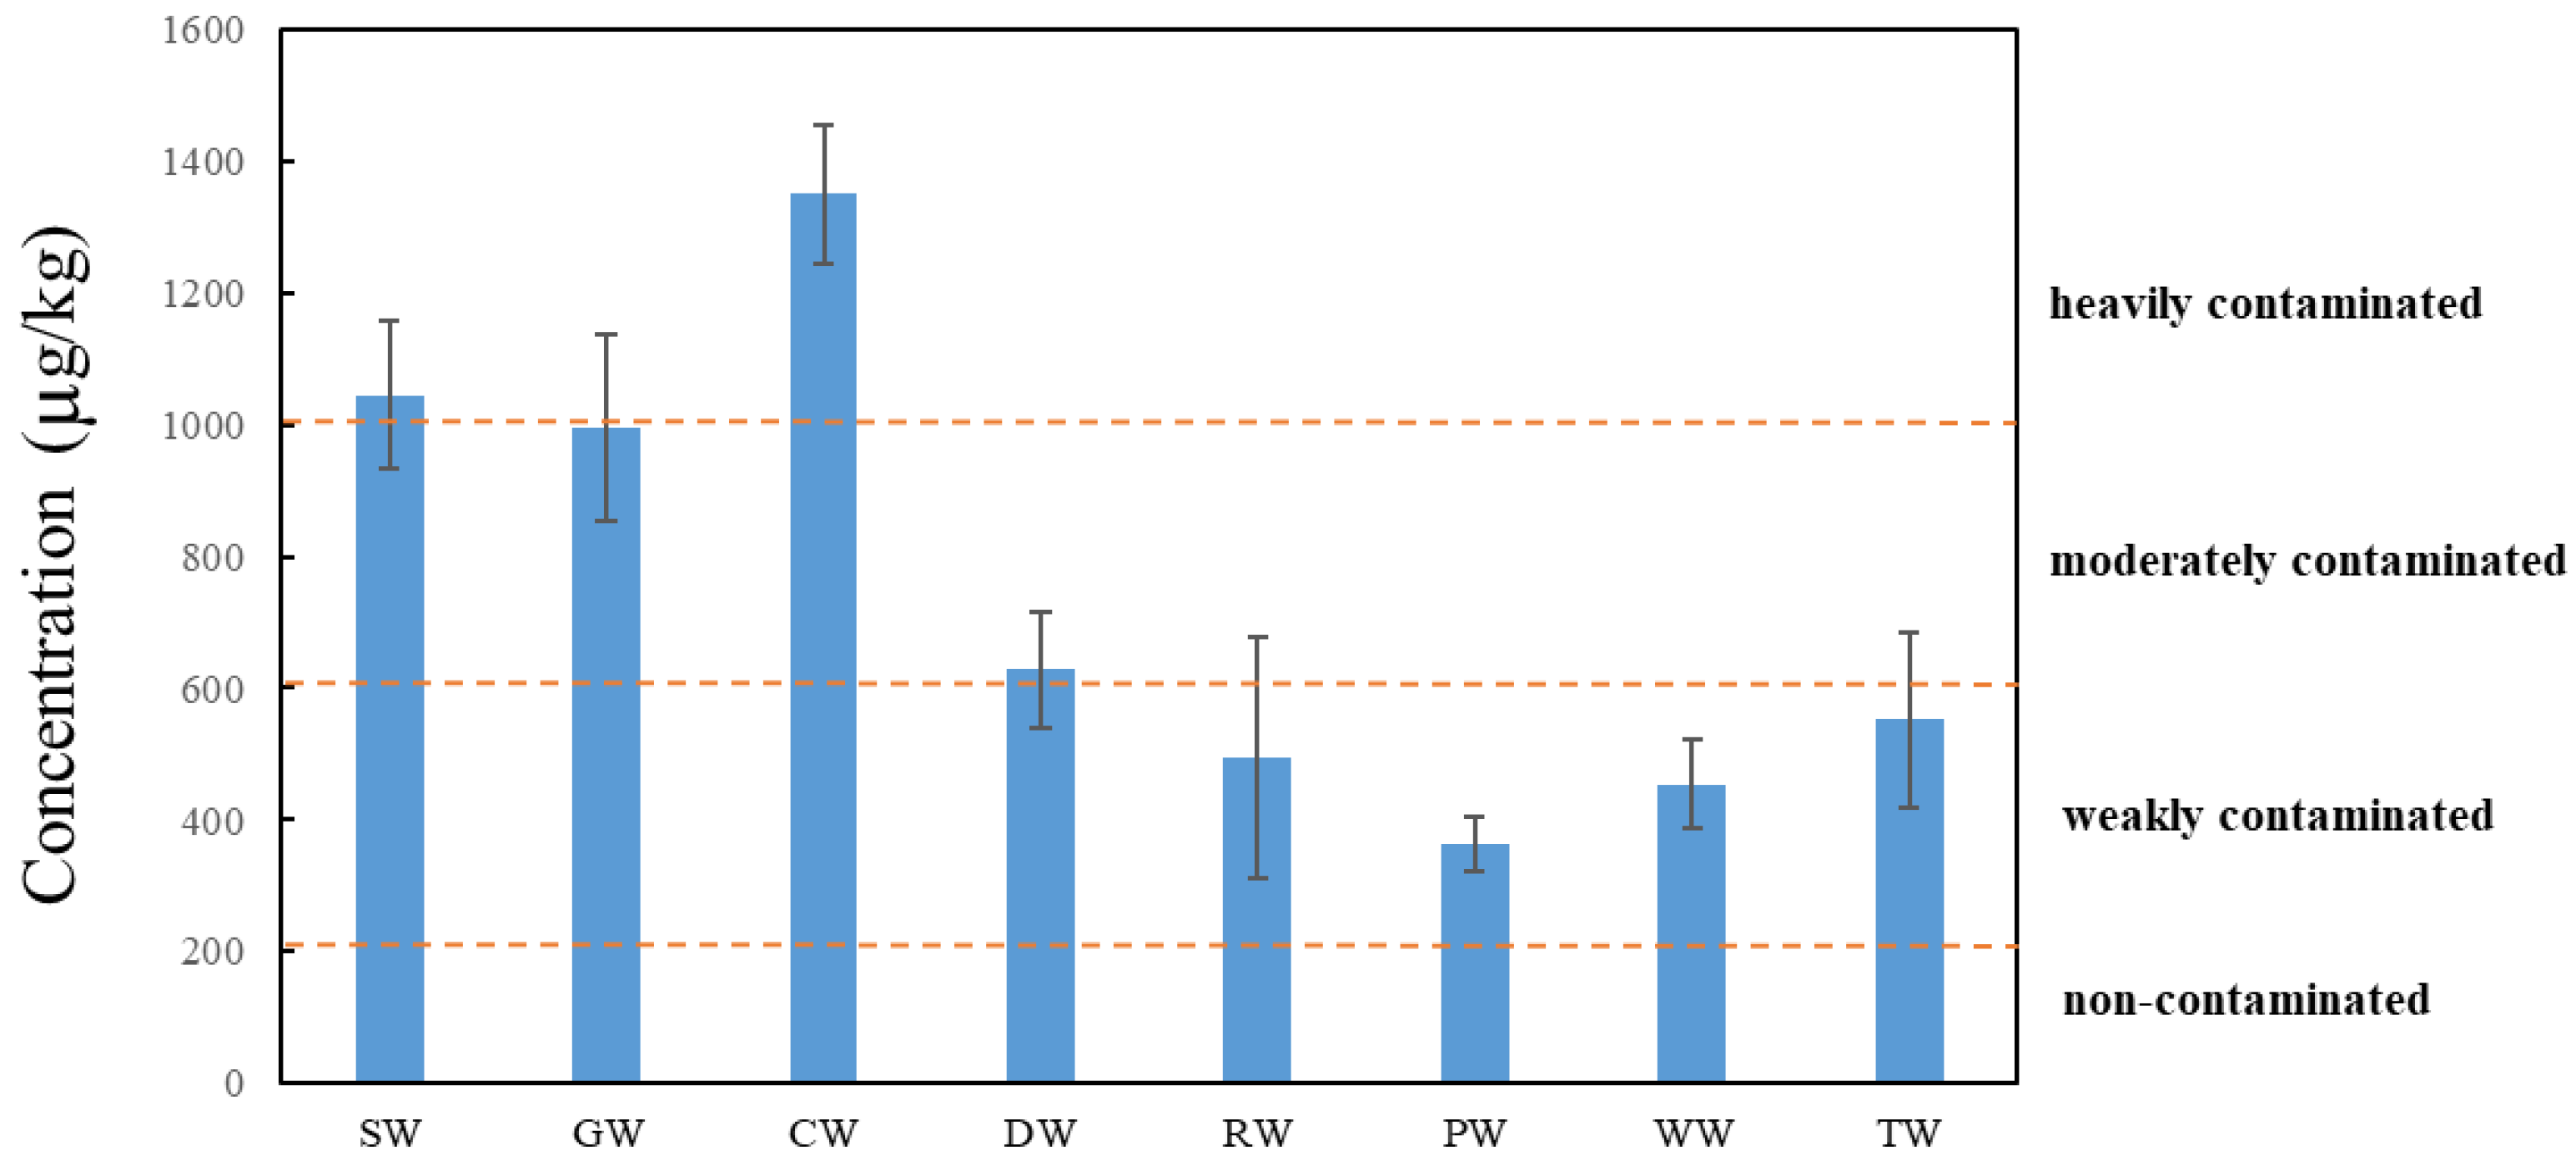
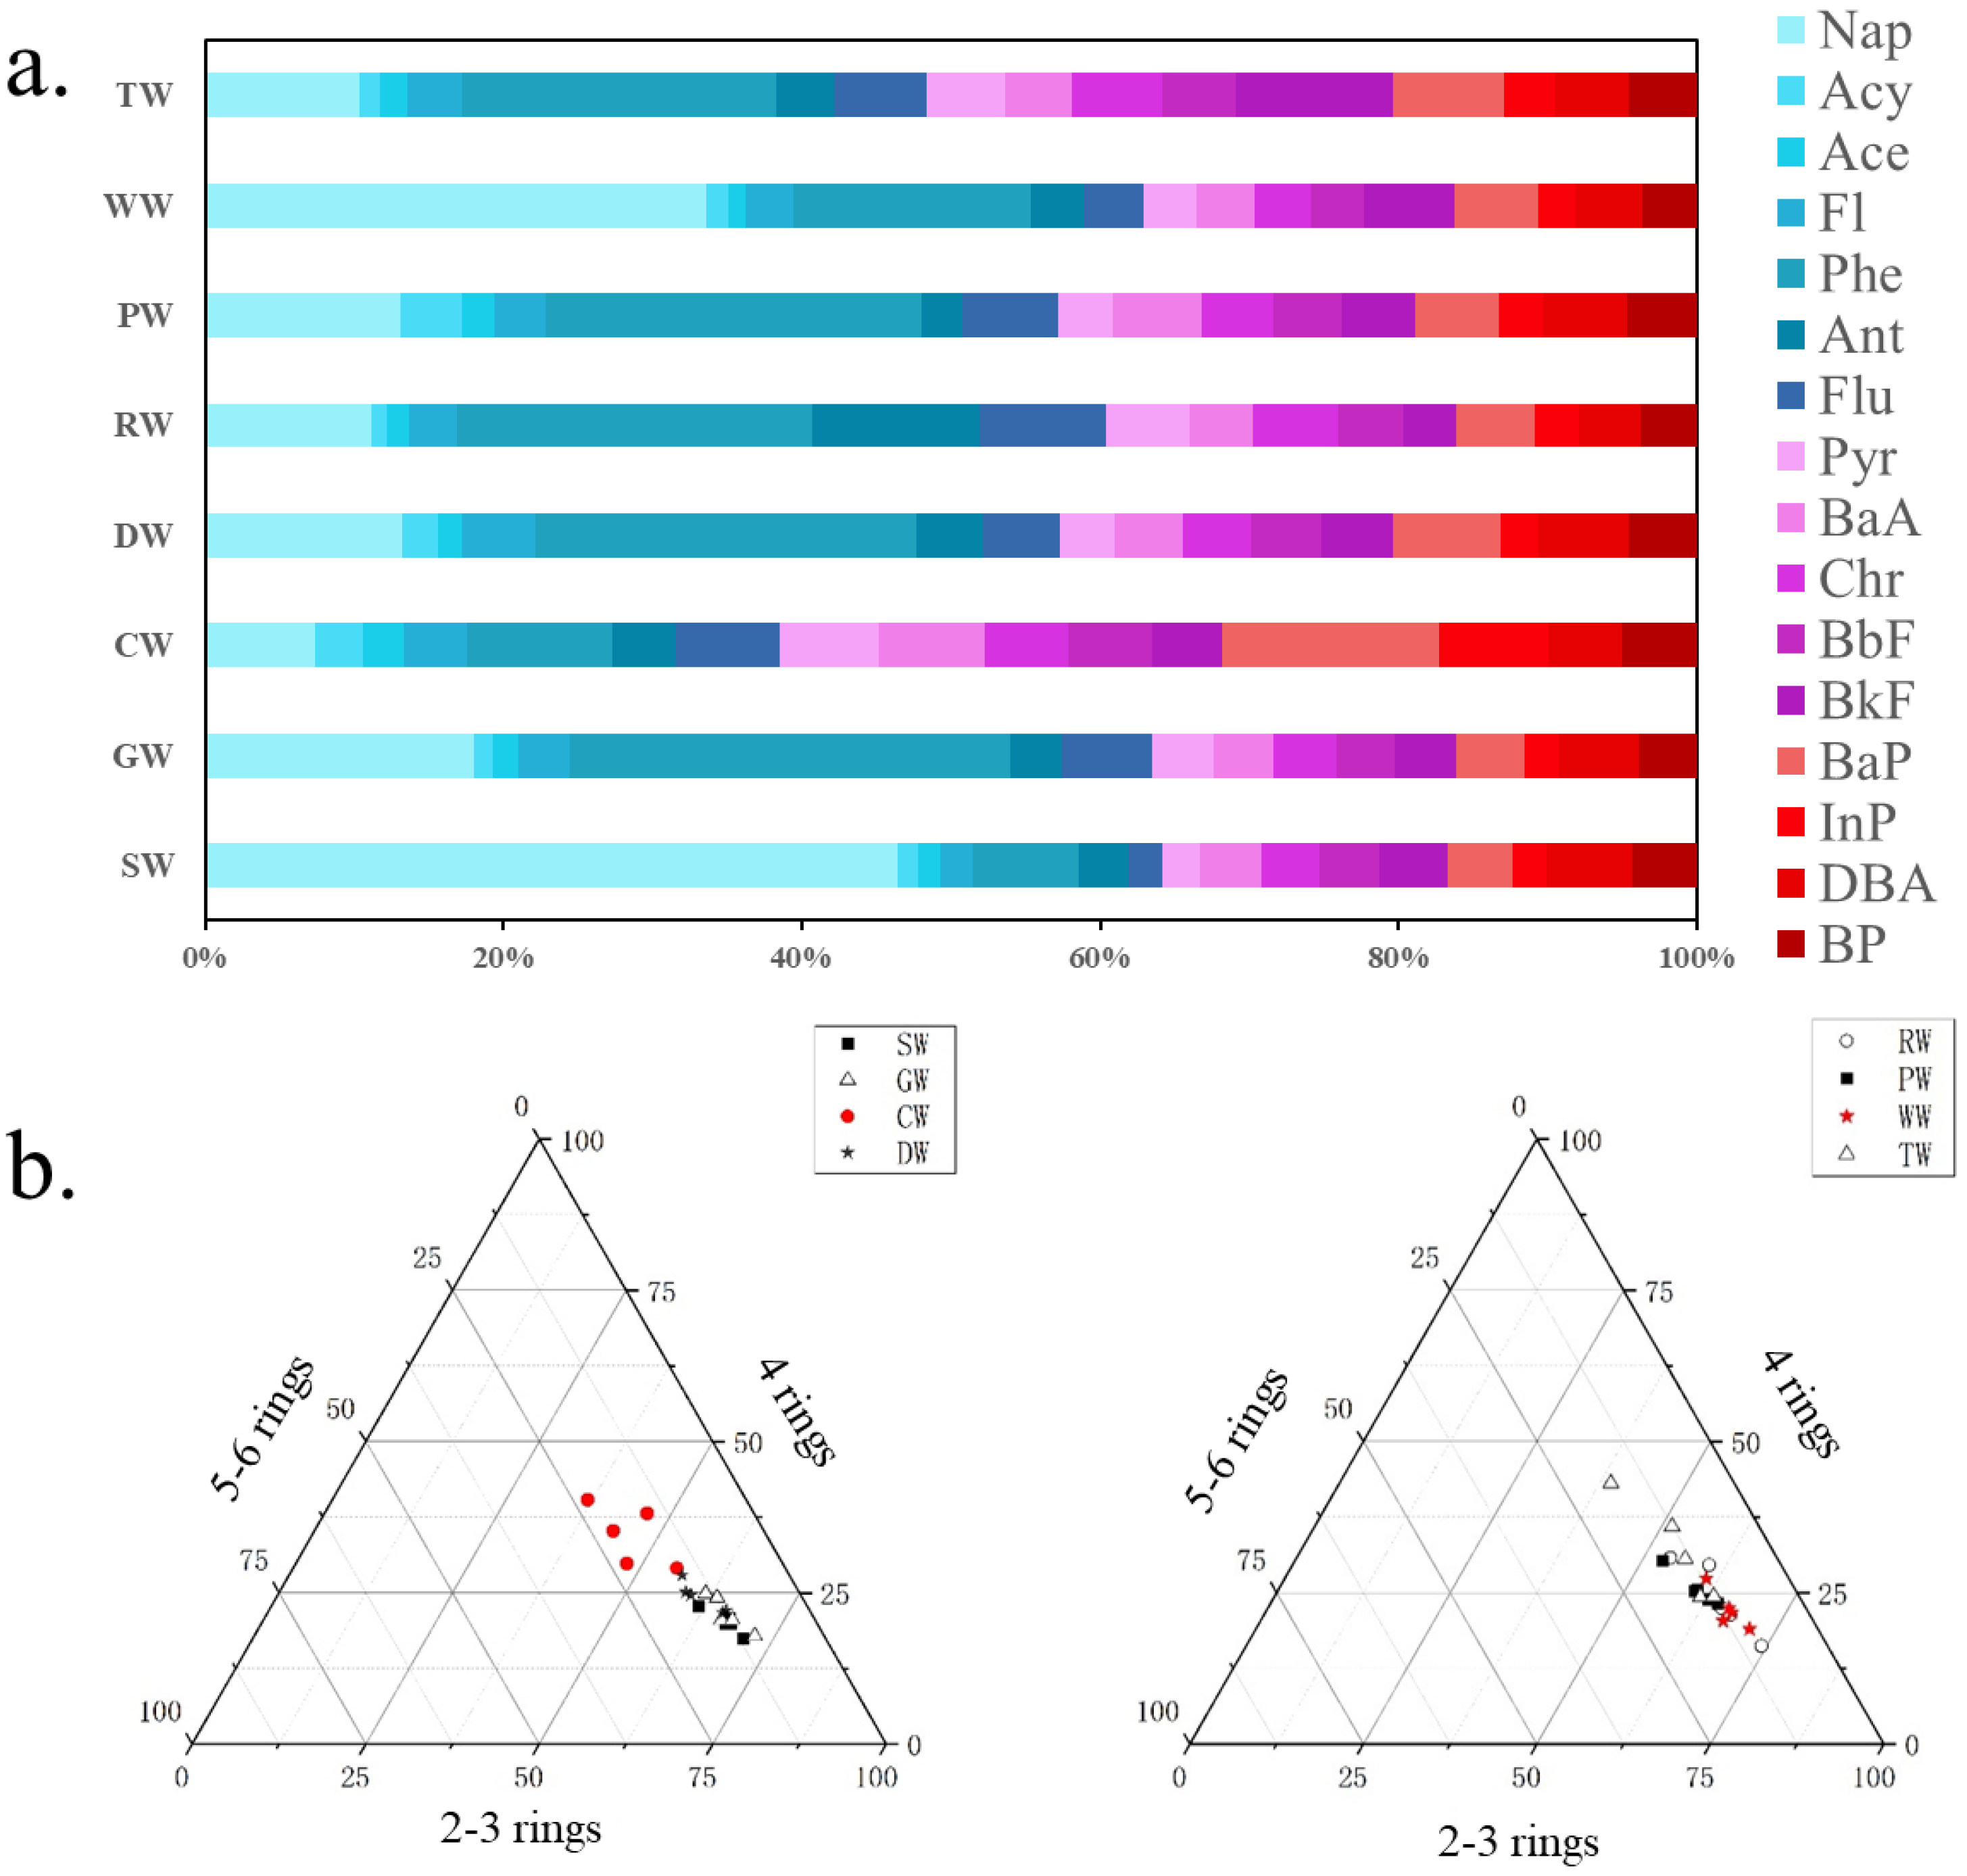
3.1. Concentration and Composition Analysis of PAHs
3.2. Source of PAHs in the CP Area
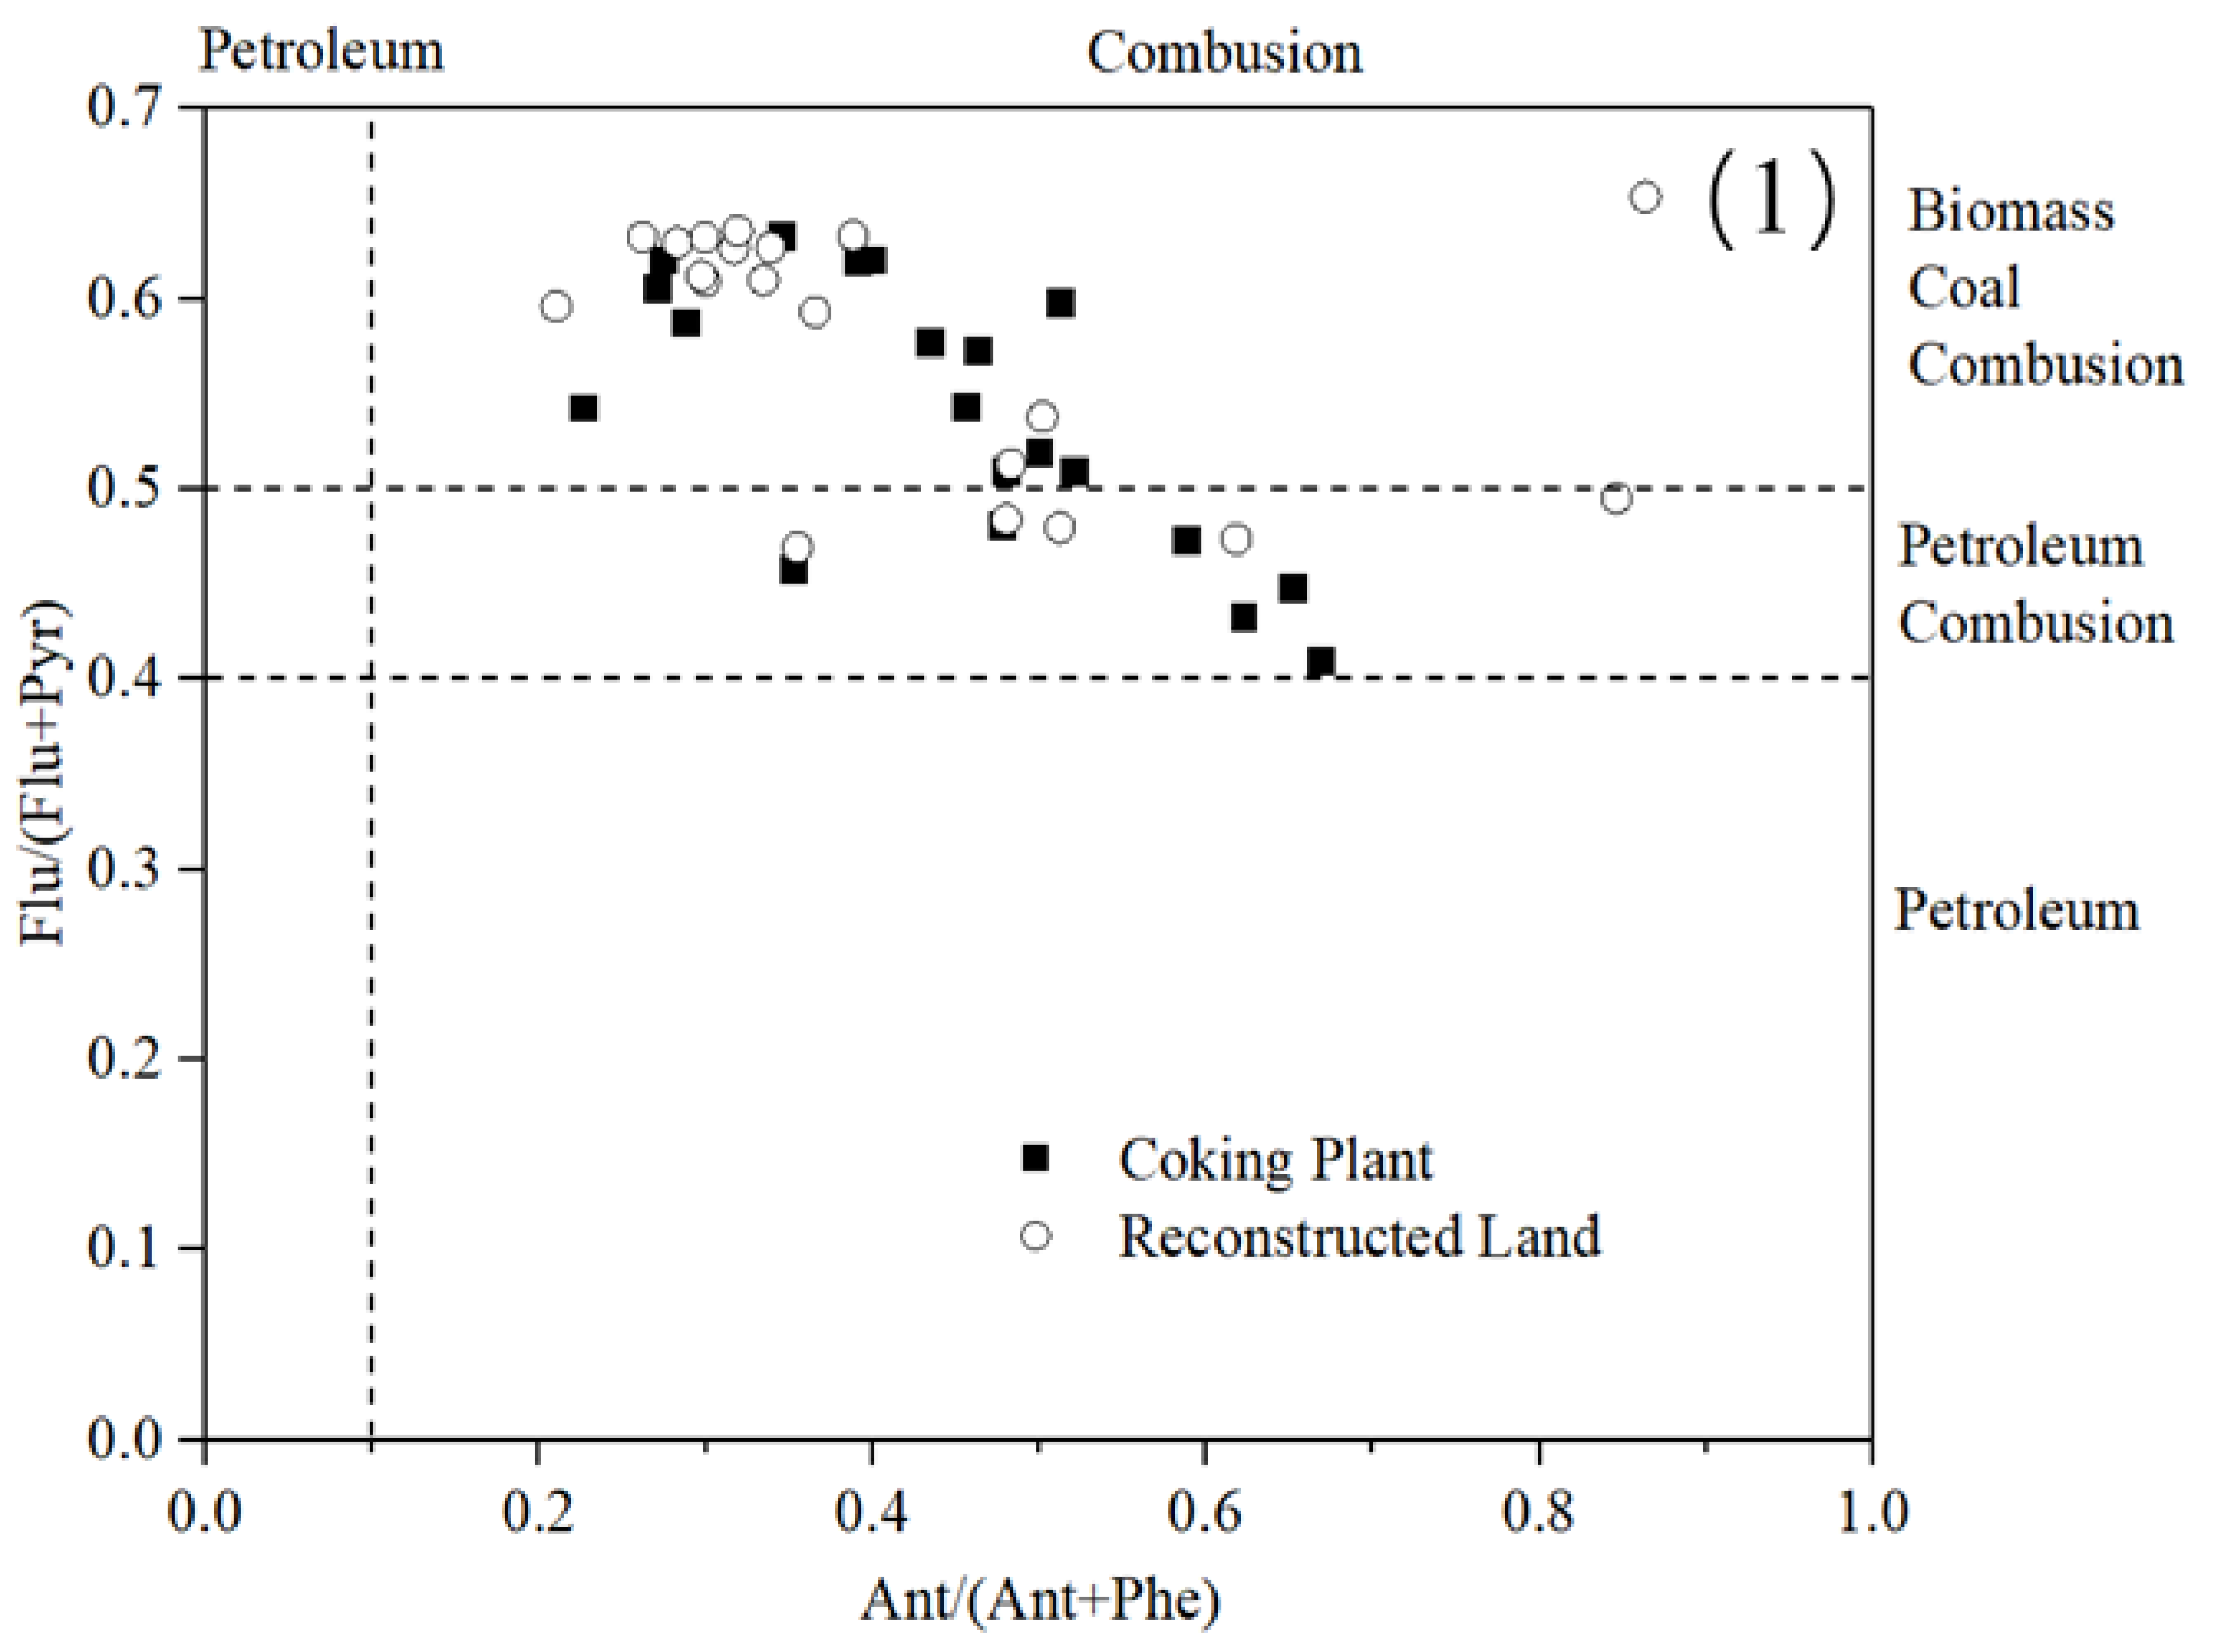
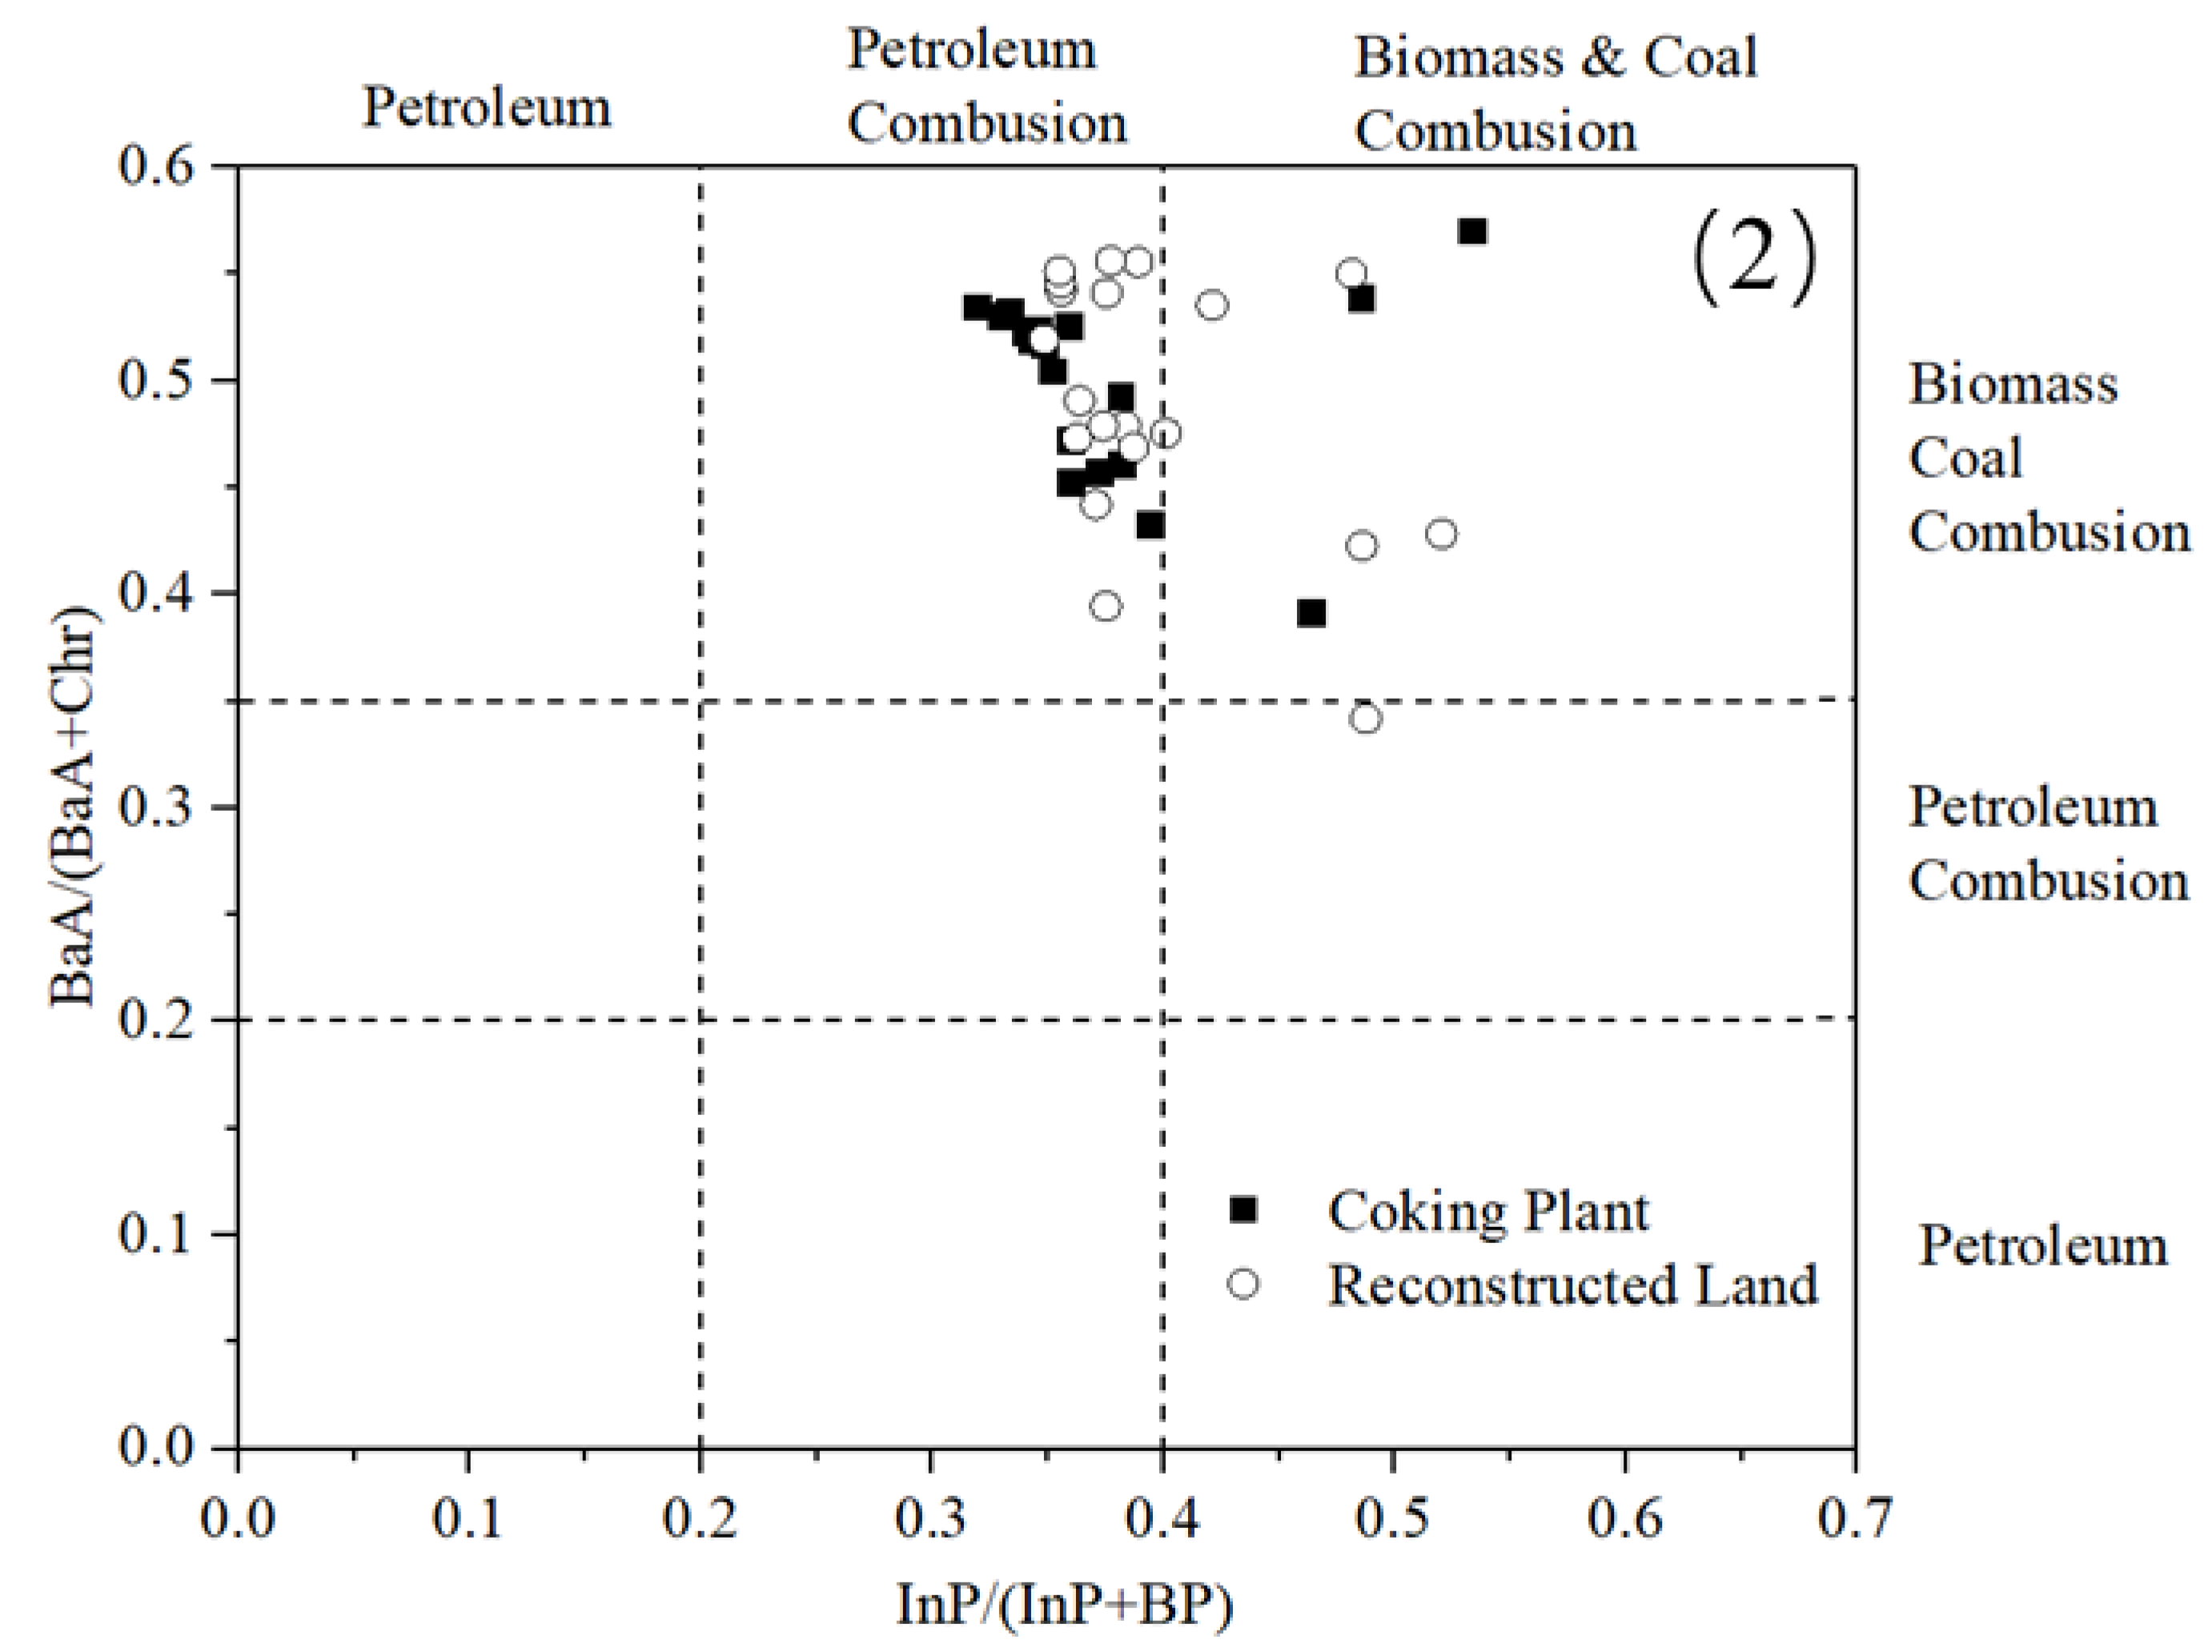
3.2.1. Isomeric Ratios of PAHs
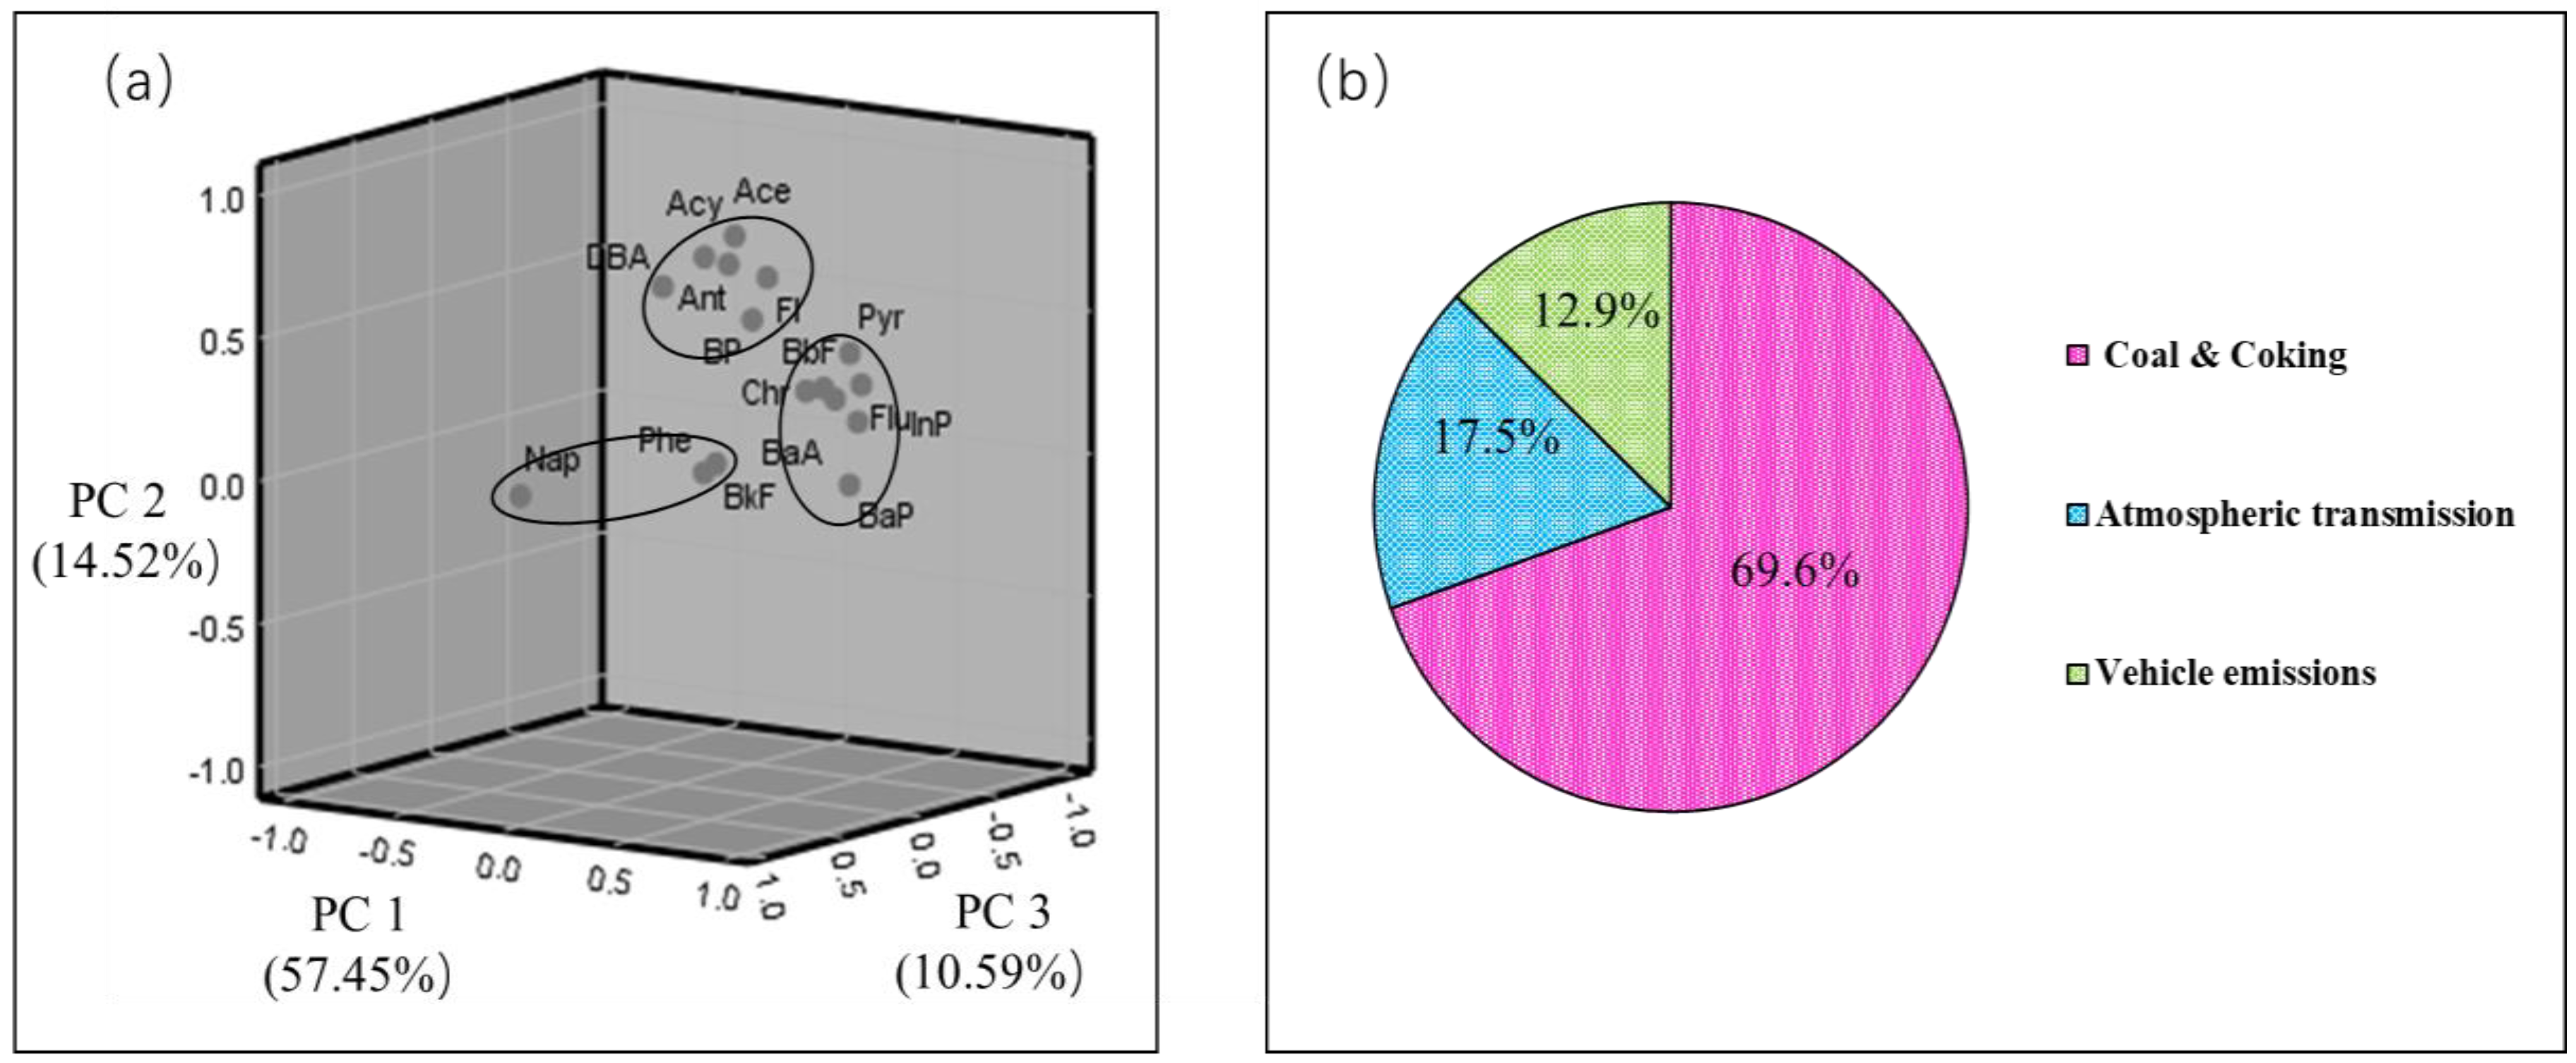
3.2.2. Principal Component Analysis
3.3. Health Risk Assessment
3.3.1. Toxicity Assessment of Pollutants
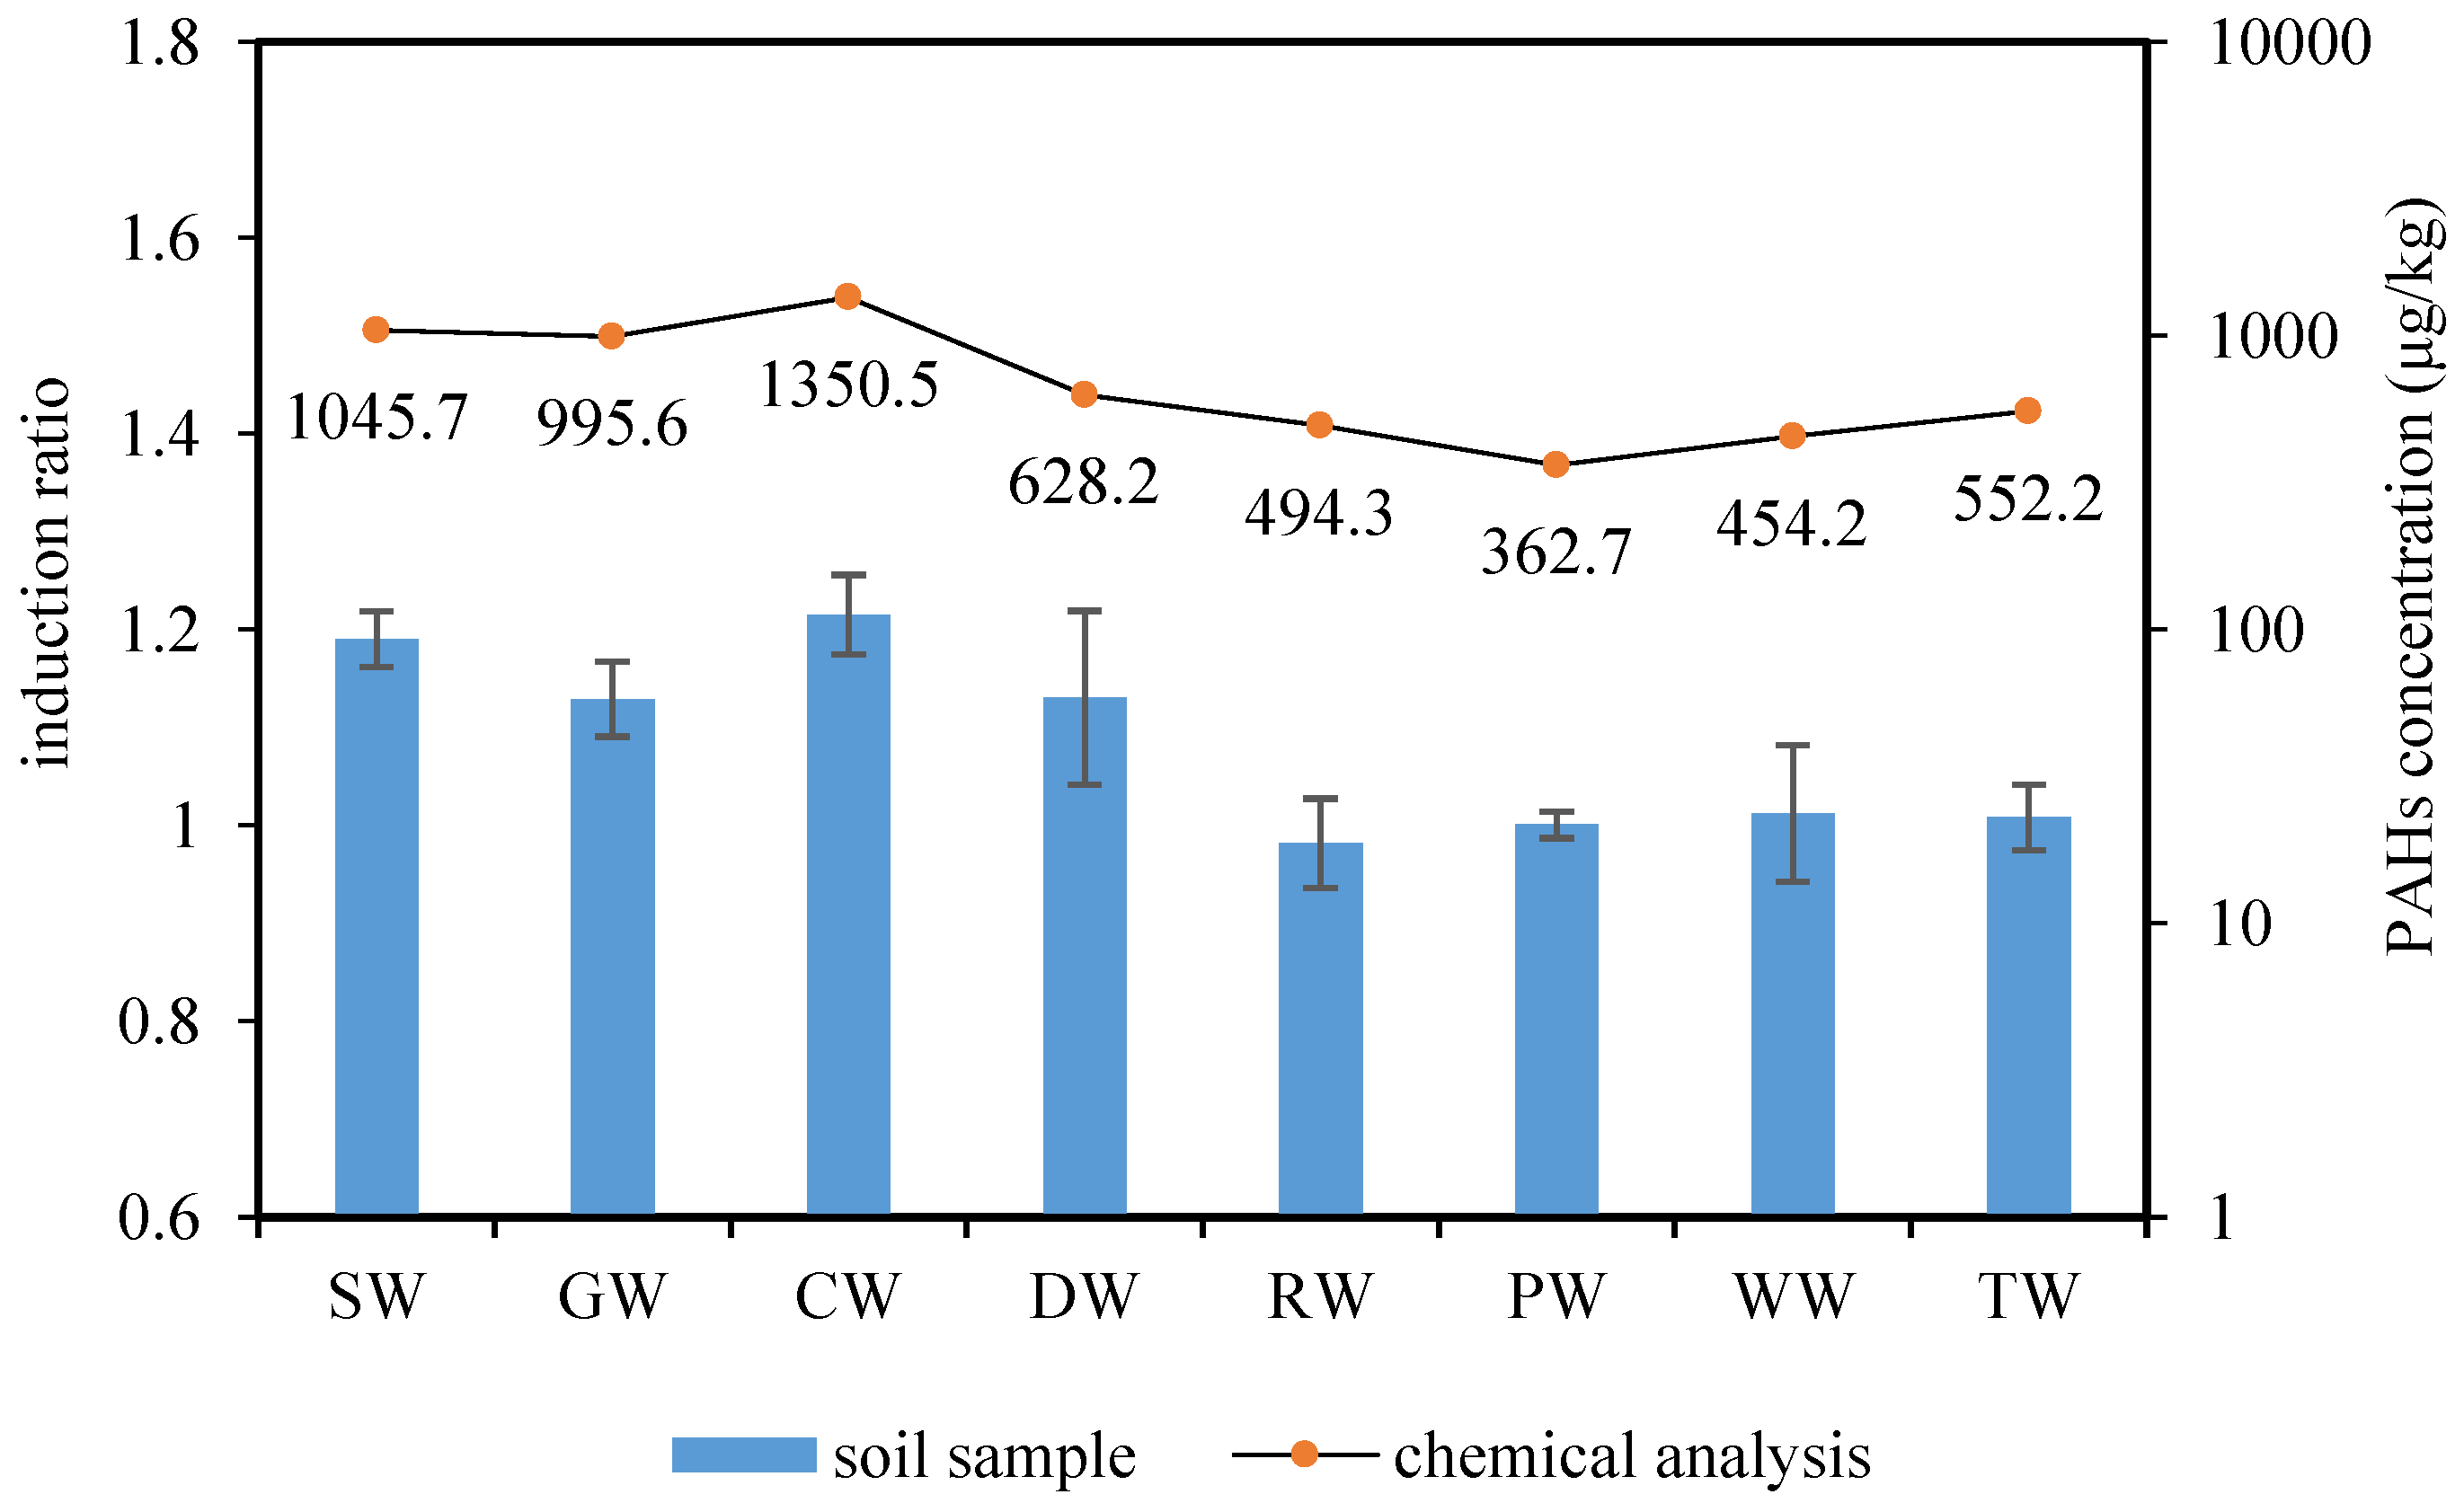
3.3.2. Biological Genotoxicity Analysis
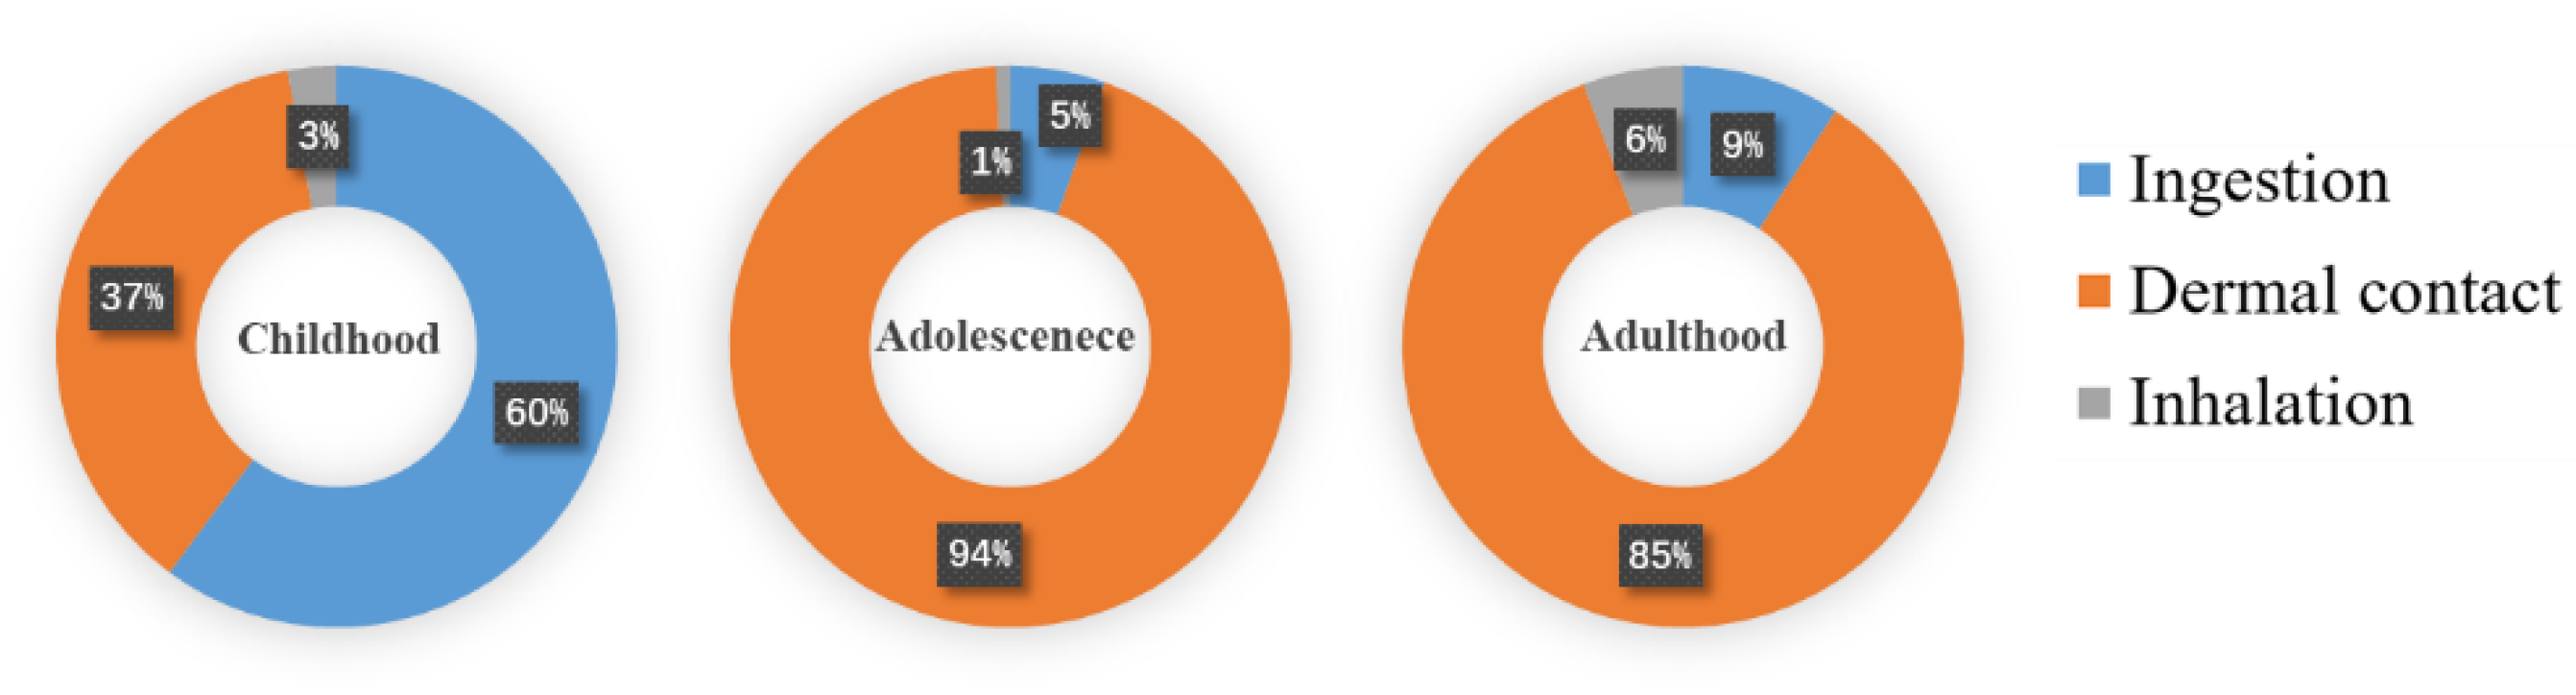
3.3.3. Lifetime Cancer Risk Assessment of the Reconstructed Regional Population
3.3.4. Calculation of Daily Ingestion of Construction Workers
4. Conclusions
Supplementary Materials
Author Contributions
Funding
Acknowledgements
Conflicts of Interest
References
- Barth, J.A.C.; Steidle, D.; Kuntz, D.; Gocht, T.; Mouvet, C.; Tümpling, W.V.; Lobe, I.; Langenhoff, A.; Albrechtsen, H.J.; Janniche, G.S.; et al. Deposition, persistence and turnover of pollutants: First results from the EU project AquaTerra for selected river basins and aquifers. Sci. Total Environ. 2007, 376, 40–50. [Google Scholar] [CrossRef] [PubMed] [Green Version]
- Peng, C.; Chen, W.; Liao, X.; Wang, M.; Ouyang, Z.; Jiao, W.; Bai, Y. Polycyclic aromatic hydrocarbons in urban soils of Beijing: Status, sources, distribution and potential risk. Environ. Pollut. 2011, 159, 802–808. [Google Scholar] [CrossRef] [PubMed]
- Argiriadis, E.; Rada, E.C.; Vecchiato, M.; Zambon, S.; Ionescu, G.; Schiavon, M.; Ragazzi, M.; Gambaro, A. Assessing the influence of local sources on POPs in atmospheric depositions and sediments near Trento (Italy). Atmos. Environ. 2014, 98, 32–40. [Google Scholar] [CrossRef]
- Bortey-Sam, N.; Ikenaka, Y.; Nakayama, S.M.M.; Akoto, O.; Yohannes, Y.B.; Baidoo, E.; Mizukawa, H.; Ishizuka, M. Occurrence, distribution, sources and toxic potential of polycyclic aromatic hydrocarbons (PAHs) in surface soils from the Kumasi Metropolis, Ghana. Sci. Total Environ. 2014, 496, 471–478. [Google Scholar] [CrossRef] [PubMed] [Green Version]
- Shabbaj, I.I.; Alghamdi, M.A.; Khoder, M. Street dust—bound polycyclic aromatic hydrocarbons in a Saudi coastal city: Status, profile, sources, and human health risk assessment. Int. J. Environ. Res. Public Health 2018, 15, 2397. [Google Scholar] [CrossRef] [PubMed]
- Harrison, R.M.; Smith, D.J.T.; Luhana, L. Source apportionment of atmospheric polycyclic aromatic hydrocarbons collected from an urban location in Birmingham, UK. Environ. Sci. Technol. 1996, 30, 825–832. [Google Scholar] [CrossRef]
- Kwon, H.O.; Choi, S.D. Polycyclic aromatic hydrocarbons (PAHs) in soils from a multi-industrial city, South Korea. Sci. Total Environ. 2014, 470, 1494–1501. [Google Scholar] [CrossRef] [PubMed]
- Wang, D.; Ma, J.; Li, H.; Zhang, X. Concentration and Potential Ecological Risk of PAHs in Different Layers of Soil in the Petroleum-Contaminated Areas of the Loess Plateau, China. Int. J. Environ. Res. Public Health 2018, 15, 1785. [Google Scholar] [CrossRef] [PubMed]
- Kamal, A.; Cincinelli, A.; Martellini, T.; Malik, R.N. Linking mobile source-PAHs band biological effects in traffic police officers and drivers in Rawalpindi (Pakistan). Ecotoxicol. Environ. Saf. 2016, 127, 135–143. [Google Scholar] [CrossRef] [PubMed]
- Cao, Y.; Yang, B.; Song, Z.; Wang, H.; He, F.; Han, X. Wheat straw biochar amendments on the removal of polycyclic aromatic hydrocarbons (PAHs) in contaminated soil. Ecotoxicol. Environ. Saf. 2016, 130, 248–255. [Google Scholar] [CrossRef] [PubMed]
- Qin, W.; Zhu, Y.; Fan, F.; Wang, Y.; Liu, X.; Ding, A.; Dou, J. Biodegradation of benzo(a)pyrene by Microbacterium sp. strain under denitrification: Degradation pathway and effects of limiting electron acceptors or carbon source. Biochem. Eng. J. 2017, 121, 131–138. [Google Scholar] [CrossRef]
- Okedeyi, O.O.; Nindi, M.M.; Dube, S.; Awofolu, O.R. Distribution and potential sources of polycyclic aromatic hydrocarbons in soils around coal-fired power plants in South Africa. Environ. Monit. Assess. 2013, 185, 2073–2082. [Google Scholar] [CrossRef] [PubMed]
- Zhang, J.; Qu, C.; Qi, S.; Cao, J.; Zhan, C.; Xing, X.; Zheng, J.; Xiao, W. Polycyclic aromatic hydrocarbons (PAHs) in atmospheric dustfall from the industrial corridor in Hubei Province, Central China. Environ. Geochem. Hlth. 2015, 37, 891–903. [Google Scholar] [CrossRef] [PubMed]
- Suman, S.; Sinha, A.; Tarafdar, A. Polycyclic aromatic hydrocarbons (PAHs) concentration levels, pattern, source identification and soil toxicity assessment in urban traffic soil of Dhanbad, India. Sci. Total Environ. 2016, 545–546, 353–360. [Google Scholar] [CrossRef] [PubMed]
- Jia, J.; Bi, C.; Guo, X.; Wang, X.; Zhou, X.; Chen, Z. Characteristics, identification, and potential risk of polycyclic aromatic hydrocarbons in road dusts and agricultural soils from industrial sites in Shanghai, China. Environ. Sci. Pollut. Res. 2017, 24, 605–615. [Google Scholar] [CrossRef] [PubMed]
- Cao, W.; Qiao, M.; Liu, B.; Zhao, X. Occurrence of parent and substituted polycyclic aromatic hydrocarbons in typical wastewater treatment plants and effluent receiving rivers of Beijing, and risk assessment. J. Environ. Sci. Health Part A 2018, 53, 992–999. [Google Scholar] [CrossRef] [PubMed]
- Jiang, B.; Li, G.; Xing, Y.; Zhang, D.; Jia, J.; Cui, Z.; Luan, X.; Tang, H. A whole-cell bioreporter assay for quantitative genotoxicity evaluation of environmental samples. Chemosphere 2017, 184, 384–392. [Google Scholar] [CrossRef] [PubMed]
- Li, C.; Zhang, D.; Song, Y.; Jiang, B.; Li, G.; Huang, W.E. Whole cell bioreporter for the estimation of oil contamination. Environ. Eng. Manag. J. 2013, 12, 1353–1358. [Google Scholar]
- Song, Y.; Li, G.; Thornton, S.; Thompson, I.; Banwart, S.; Lerner, D.; Huang, W. Optimization of Bacterial Whole Cell Bioreporters for Toxicity Assay of Environmental Samples. Environ. Sci. Technol. 2009, 43, 7931–7938. [Google Scholar] [CrossRef] [PubMed]
- Sun, Y.; Zhao, X.; Zhang, D.; Ding, A.; Chen, C.; Huang, W.E.; Zhang, H. New naphthalene whole-cell bioreporter for measuring and assessing naphthalene in polycyclic aromatic hydrocarbons contaminated site. Chemosphere 2017, 186, 510. [Google Scholar] [CrossRef] [PubMed]
- Song, Y.; Jiang, B.; Tian, S.; Tang, H.; Liu, Z.; Li, C.; Jia, J.; Huang, W.; Zhang, X.; Li, G. A whole-cell bioreporter approach for the genotoxicity assessment of bioavailability of toxic compounds in contaminated soil in China. Environ. Pollut. 2014, 195, 178–184. [Google Scholar] [CrossRef] [PubMed]
- U.S. Environmental Protection Agency (USEPA). Risk Assessment Guidance for Superfund. Human Health Evaluation Manual; USEPA: Washington, DC, USA, 1991.
- Chen, S.C.; Liao, C.M. Health risk assessment on human exposed to environmental polycyclic aromatic hydrocarbons pollution sources. Sci. Total Environ. 2006, 366, 112–123. [Google Scholar] [CrossRef] [PubMed]
- Ali, N.; Imi, I.; Khoder, M.; Shamy, M.; Alghamdi, M.; Al, K.A. Polycyclic aromatic hydrocarbons (PAHs) in the settled dust of automobile workshops, health and carcinogenic risk evaluation. Sci. Total Environ. 2017, 601–602, 478–484. [Google Scholar] [CrossRef] [PubMed]
- Zhao, L.; Hou, H.; Shangguan, Y.; Cheng, B.; Xu, Y.; Zhao, R.; Zhang, Y.; Hua, X.; Huo, X.; Zhao, X. Occurrence, sources, and potential human health risks of polycyclic aromatic hydrocarbons in agricultural soils of the coal production area surrounding Xinzhou, China. Ecotoxicol. Environ. Saf. 2014, 108, 120–128. [Google Scholar] [CrossRef] [PubMed]
- Jiang, Y.; Yves, U.J.; Sun, H.; Hu, X.; Zhan, H.; Wu, Y. Distribution, compositional pattern and sources of polycyclic aromatic hydrocarbons in urban soils of an industrial city, Lanzhou, China. Ecotoxicol. Environ. Saf. 2016, 126, 154–162. [Google Scholar] [CrossRef] [PubMed]
- Cai, Q.Y.; Mo, C.H.; Li, Y.H.; Zeng, Q.Y.; Katsoyiannis, A.; Wu, Q.T.; Férard, J. Occurrence and assessment of polycyclic aromatic hydrocarbons in soils from vegetable fields of the Pearl River Delta, South China. Chemosphere 2007, 68, 159–168. [Google Scholar] [CrossRef] [PubMed]
- Bucheli, T.D.; Blum, F.; Desaules, A.; Gustafsson, Ö. Polycyclic aromatic hydrocarbons, black carbon, and molecular markers in soils of Switzerland. Chemosphere 2004, 56, 1061–1076. [Google Scholar] [CrossRef] [PubMed]
- Honda, K.; Mizukami, M.; Ueda, Y.; Hamada, N.; Seike, N. Residue level of polycyclic aromatic hydrocarbons in Japanese paddy soils from 1959 to 2002. Chemosphere 2007, 68, 1763–1771. [Google Scholar] [CrossRef] [PubMed]
- Agarwal, T.; Khillare, P.S.; Shridhar, V.; Ray, S. Pattern, sources and toxic potential of PAHs in the agricultural soils of Delhi, India. J. Hazard. Mater. 2009, 163, 1033–1039. [Google Scholar] [CrossRef] [PubMed]
- Maliszewska-Kordybach, B. Polycyclic aromatic hydrocarbons in agricultural soils in Poland: Preliminary proposals for criteria to evaluate the level of soil contamination. Appl. Geochem. 1996, 11, 121–127. [Google Scholar] [CrossRef]
- Yunker, M.B.; Macdonald, R.W.; Vingarzan, R.; Mitchell, R.H.; Goyette, D.; Sylvestre, S. PAHs in the Fraser River basin: A critical appraisal of PAH ratios as indicators of PAH source and composition. Org. Geochem. 2002, 33, 489–515. [Google Scholar] [CrossRef]
- Tian, F.; Chen, W.; Qiao, X.; Wang, Z.; Yang, P.; Wang, D.; Ge, L. Sources and seasonal variation of atmospheric polycyclic aromatic hydrocarbons in Dalian, China: Factor analysis with non-negative constraints combined with local source fingerprints. Atmos. Environ. 2009, 43, 2747–2753. [Google Scholar] [CrossRef]
- Dobbins, R.A.; Fletcher, R.A.; Benner, J.B.A.; Hoeft, S. Polycyclic aromatic hydrocarbons in flames, in diesel fuels, and in diesel emissions. Combust. Flame. 2006, 144, 773–781. [Google Scholar] [CrossRef]
- Tahir, N.M.; Seng, T.H.; Ariffin, M.; Suratman, S.; Hoe, L.S. Concentration and distribution of PAHs in soils affected by grassland fire. Malays. J. Anal. Sci. 2006, 10, 41–46. [Google Scholar]
- Dong, T.T.T.; Lee, B.K. Characteristics, toxicity, and source apportionment of polycyclic aromatic hydrocarbons (PAHs) in road dust of Ulsan, Korea. Chemosphere 2009, 74, 1245–1253. [Google Scholar] [CrossRef] [PubMed]
- Ali, N.; Ismail, I.M.; Khoder, M.; Shamy, M.; Alghamdi, M.; Costa, M.; Ali, L.N.; Wang, W.; Eqani, S.A.M.A.S. Polycyclic aromatic hydrocarbons (PAHs) in indoor dust samples from cities of Jeddah and Kuwait: Levels, sources and non-dietary human exposure. Sci. Total Environ. 2016, 573, 1607–1614. [Google Scholar] [CrossRef] [PubMed]


| Parameter | Unit | Child | Adolescent | Adult | |||
|---|---|---|---|---|---|---|---|
| Male | Female | Male | Female | Male | Female | ||
| Body weight (BW) | kg | 17.2 | 16.5 | 47.1 | 44.8 | 60.2 | 53.1 |
| Exposure frequency (EF) | d·year−1 | 350 | 350 | 350 | 350 | 350 | 350 |
| Exposure duration (ED) | year | 6 | 6 | 14 | 14 | 30 | 30 |
| Inhalation rate (IRair) | m3·d−1 | 10.9 | 10.9 | 17.7 | 17.7 | 17.5 | 17.5 |
| Soil intake rate (IRsoil) | mg d−1 | 200 | 200 | 100 | 100 | 100 | 100 |
| Dermal surface exposure (SA) | cm2·d−1 | 1800 | 1800 | 5000 | 5000 | 5000 | 5000 |
| Averaging life span (AT) | year | 25,550 | 25,550 | 25,550 | 25,550 | 25,550 | 25,550 |
| Soil dust produce factor (PEF) | m3·kg−1 | 6.2 × 10⁹ | 6.2 × 10⁹ | 6.2 × 10⁹ | 6.2 × 10⁹ | 6.2 × 10⁹ | 6.2 × 10⁹ |
| Carcinogenic slope factor (CSF) Ingestion | (mg·kg−1·d−1)−1 | 7.3 | 7.3 | 7.3 | 7.3 | 7.3 | 7.3 |
| Carcinogenic slope factor (CSF) Dermal | (mg·kg−1·d−1)−1 | 25 | 25 | 25 | 25 | 25 | 25 |
| Carcinogenic slope factor (CSF) Inhalation | (mg·kg−1·d−1)−1 | 3.85 | 3.85 | 3.85 | 3.85 | 3.85 | 3.85 |
| PAHs | Abbreviation | Max | Min | Mean | SD | Detectable (%) |
|---|---|---|---|---|---|---|
| Naphthalene | Nap | 567.5 | 8.6 | 144.8 | 132.7 | 97.3 |
| Acenapthylene | Acy | 89.1 | 4.2 | 14.9 | 55.4 | 100 |
| Acenapthene | Ace | 71.7 | 3.4 | 14.1 | 62.6 | 100 |
| Fluorene | Fl | 90.5 | 7.6 | 26.1 | 59.2 | 96.5 |
| Phenanthrene | Phe | 365.9 | 22.4 | 132.3 | 214.8 | 96.5 |
| Anthracene | Ant | 128.1 | 9.4 | 31.9 | 73.1 | 96.5 |
| Fluoranthene | Flu | 116.9 | 10.7 | 41.1 | 85.6 | 100 |
| Pyrene | Pyr | 103.4 | 9.2 | 33.3 | 72.5 | 100 |
| * Benzop[a]anthracene | BaA | 178.9 | 13.7 | 36.5 | 134.2 | 100 |
| * Chrysene | Chr | 113.8 | 12.7 | 35.5 | 69.3 | 100 |
| * Ben[b]fluoranthene | BbF | 91.7 | 13.3 | 33.7 | 73.5 | 93.6 |
| * Ben[k]fluoranthene | BkF | 174.9 | 15.4 | 37.9 | 96.4 | 100 |
| * Benzo[a]pyrene | BaP | 502.2 | 13.9 | 55.6 | 239.5 | 93.6 |
| * Indeno[1,2,3-cd]pyrene | InP | 213.1 | 7.8 | 27.1 | 164.6 | 100 |
| * Dibenzo[a,h]anthracene | DBA | 109.6 | 18.7 | 38.3 | 45.8 | 100 |
| Benzo[g,h,i]perylene | BP | 89.6 | 14.5 | 32.5 | 55.8 | 100 |
| ∑16PAHs | - | 3006.9 | 185.5 | 735.6 | 893.7 | - |
| ∑Carcinogenic 7PAHs | - | 1384.2 | 95.5 | 264.6 | 532.6 | - |
| PAHs | Abbreviation | TEFs | BaPeq | |
|---|---|---|---|---|
| RL | CP | |||
| Naphthalene | Nap | 0.001 | 0.07 ± 0.04 | 0.21 ± 0.07 |
| Acenapthylene | Acy | 0.001 | 0.03 ± 0.01 | 0.06 ± 0.01 |
| Acenapthene | Ace | 0.001 | 0.02 ± 0.01 | 0.03 ± 0.01 |
| Fluorene | Fl | 0.001 | 0.02 ± 0.01 | 0.04 ± 0.01 |
| Phenanthrene | Phe | 0.001 | 0.1 ± 0.04 | 0.17 ± 0.04 |
| Anthracene | Ant | 0.01 | 0.5 ± 0.25 | 0.38 ± 0.03 |
| Fluoranthene | Flu | 0.001 | 0.03 ± 0.01 | 0.05 ± 0.01 |
| Pyrene | Pyr | 0.001 | 0.02 ± 0.01 | 0.05 ± 0.01 |
| * Benzop[a]anthracene | BaA | 0.1 | 2.13 ± 0.63 | 5.17 ± 0.18 |
| * Chrysene | Chr | 0.01 | 0.24 ± 0.09 | 0.47 ± 0.06 |
| * Ben[b]fluoranthene | BbF | 0.1 | 2.05 ± 1.12 | 4.68 ± 0.28 |
| * Ben[k]fluoranthene | BkF | 0.1 | 3.02 ± 0.21 | 4.57 ± 0.16 |
| * Benzo[a]pyrene | BaP | 1 | 28.22 ± 5.97 | 83.04 ± 1.86 |
| * Indeno[1,2,3-cd]pyrene | InP | 0.1 | 6.38 ± 0.77 | 4.03 ± 0.13 |
| * Dibenzo[a,h]anthracene | DBA | 1 | 22.21 ± 4.34 | 54.29 ± 2.71 |
| Benzo[g,h,i]perylene | BP | 0.01 | 0.19 ± 0.05 | 0.47 ± 0.03 |
| Σ16PAHs | - | - | 60.1 ± 19.9 | 157.6 ± 33.1 |
| Exposure pathways | Childhood | Adolescence | Adulthood | |||
|---|---|---|---|---|---|---|
| Male | Female | Male | Female | Male | Female | |
| Ingestion | 2.62 × 10⁻⁶ | 2.69 × 10⁻⁶ | 1.56 × 10⁻⁶ | 1.61 × 10⁻⁶ | 2.84 × 10⁻⁶ | 3.08 × 10⁻⁶ |
| Dermal contact | 1.62 × 10⁻⁶ | 1.67 × 10⁻⁶ | 2.67 × 10⁻⁵ | 2.76 × 10⁻⁵ | 4.86 × 10⁻⁵ | 5.29 × 10⁻⁵ |
| Inhalation | 1.21 × 10⁻⁷ | 1.25 × 10⁻⁷ | 2.35 × 10⁻⁷ | 2.43 × 10⁻⁷ | 4.23 × 10⁻⁷ | 4.59 × 10⁻⁷ |
| Total ILCRs | 4.35 × 10⁻⁶ | 4.48 × 10⁻⁶ | 2.85 × 10⁻⁵ | 2.95 × 10⁻⁵ | 5.18 × 10⁻⁵ | 5.64 × 10⁻⁵ |
| Sample ID | Nap | Acy | Ace | Fl | Phe | Ant | Flu | Pyr | BaA | Chr | BbF | BkF | BaP | InP | DBA | BP | Σ16PAHs |
|---|---|---|---|---|---|---|---|---|---|---|---|---|---|---|---|---|---|
| C 1-1 | 0.61 | 0.02 | 0.02 | 0.04 | 0.12 | 0.04 | 0.03 | 0.03 | 0.06 | 0.05 | 0.05 | 0.06 | 0.06 | 0.03 | 0.08 | 0.06 | 1.38 |
| C 1-2 | 0.65 | 0.02 | 0.02 | 0.05 | 0.16 | 0.05 | 0.06 | 0.05 | 0.06 | 0.07 | 0.06 | 0.07 | 0.06 | 0.04 | 0.08 | 0.06 | 1.57 |
| C 1-3 | 0.81 | 0.02 | 0.02 | 0.02 | 0.05 | 0.05 | 0.03 | 0.04 | 0.06 | 0.06 | 0.07 | 0.07 | 0.07 | 0.04 | 0.09 | 0.07 | 1.55 |
| C 1-4 | 0.59 | 0.02 | 0.01 | 0.02 | 0.03 | 0.04 | 0.02 | 0.03 | 0.06 | 0.05 | 0.06 | 0.07 | 0.07 | 0.03 | 0.09 | 0.07 | 1.28 |
| C 1-5 | 0.79 | 0.02 | 0.05 | 0.03 | 0.16 | 0.05 | 0.03 | 0.03 | 0.06 | 0.05 | 0.06 | 0.07 | 0.07 | 0.03 | 0.09 | 0.07 | 1.68 |
| C 2-1 | 0.29 | 0.01 | 0.01 | 0.04 | 0.36 | 0.05 | 0.05 | 0.05 | 0.05 | 0.05 | 0.05 | 0.06 | 0.06 | 0.03 | 0.08 | 0.06 | 1.28 |
| C 2-2 | 0.19 | 0.01 | 0.02 | 0.05 | 0.52 | 0.04 | 0.10 | 0.06 | 0.05 | 0.05 | 0.05 | 0.06 | 0.06 | 0.03 | 0.08 | 0.05 | 1.43 |
| C 2-3 | 0.47 | 0.03 | 0.05 | 0.07 | 0.44 | 0.05 | 0.09 | 0.05 | 0.06 | 0.07 | 0.05 | 0.06 | 0.07 | 0.03 | 0.08 | 0.06 | 1.72 |
| C 2-4 | 0.16 | 0.01 | 0.02 | 0.03 | 0.34 | 0.06 | 0.08 | 0.06 | 0.06 | 0.06 | 0.05 | 0.05 | 0.06 | 0.03 | 0.07 | 0.05 | 1.20 |
| C 2-5 | 0.18 | 0.01 | 0.04 | 0.06 | 0.43 | 0.05 | 0.12 | 0.08 | 0.06 | 0.08 | 0.07 | 0.06 | 0.09 | 0.04 | 0.07 | 0.06 | 1.49 |
| C 3-1 | 0.19 | 0.13 | 0.10 | 0.13 | 0.12 | 0.12 | 0.13 | 0.12 | 0.14 | 0.11 | 0.10 | 0.10 | 0.11 | 0.15 | 0.16 | 0.13 | 2.03 |
| C 3-2 | 0.12 | 0.09 | 0.07 | 0.10 | 0.10 | 0.13 | 0.14 | 0.15 | 0.13 | 0.11 | 0.12 | 0.09 | 0.13 | 0.11 | 0.14 | 0.12 | 1.84 |
| C 3-3 | 0.10 | 0.03 | 0.04 | 0.05 | 0.30 | 0.05 | 0.12 | 0.09 | 0.08 | 0.02 | 0.12 | 0.06 | 0.72 | 0.08 | 0.05 | 0.07 | 1.96 |
| C 3-4 | 0.17 | 0.03 | 0.03 | 0.07 | 0.23 | 0.05 | 0.17 | 0.14 | 0.26 | 0.16 | 0.13 | 0.13 | 0.28 | 0.30 | 0.06 | 0.10 | 2.31 |
| C 3-5 | 0.13 | 0.04 | 0.03 | 0.06 | 0.19 | 0.07 | 0.12 | 0.14 | 0.09 | 0.13 | 0.08 | 0.07 | 0.16 | 0.06 | 0.07 | 0.07 | 1.51 |
| C 4-1 | 0.17 | 0.03 | 0.01 | 0.05 | 0.12 | 0.04 | 0.04 | 0.03 | 0.05 | 0.05 | 0.06 | 0.04 | 0.15 | 0.03 | 0.05 | 0.04 | 0.96 |
| C 4-2 | 0.15 | 0.02 | 0.02 | 0.06 | 0.30 | 0.05 | 0.06 | 0.04 | 0.04 | 0.05 | 0.04 | 0.04 | 0.04 | 0.02 | 0.05 | 0.04 | 1.03 |
| C 4-3 | 0.09 | 0.02 | 0.01 | 0.02 | 0.21 | 0.03 | 0.04 | 0.02 | 0.04 | 0.04 | 0.04 | 0.04 | 0.04 | 0.02 | 0.05 | 0.04 | 0.74 |
| C 4-4 | 0.07 | 0.02 | 0.02 | 0.06 | 0.32 | 0.06 | 0.06 | 0.04 | 0.04 | 0.04 | 0.04 | 0.04 | 0.04 | 0.02 | 0.05 | 0.04 | 0.96 |
| C 4-5 | 0.11 | 0.02 | 0.01 | 0.02 | 0.20 | 0.03 | 0.04 | 0.03 | 0.04 | 0.04 | 0.04 | 0.04 | 0.04 | 0.02 | 0.05 | 0.04 | 0.79 |
| MAX | 0.81 | 0.13 | 0.10 | 0.13 | 0.52 | 0.13 | 0.17 | 0.15 | 0.26 | 0.16 | 0.13 | 0.13 | 0.72 | 0.30 | 0.16 | 0.13 | 2.31 |
| MIN | 0.07 | 0.01 | 0.01 | 0.02 | 0.03 | 0.03 | 0.02 | 0.02 | 0.04 | 0.02 | 0.04 | 0.04 | 0.04 | 0.02 | 0.05 | 0.04 | 0.74 |
© 2019 by the authors. Licensee MDPI, Basel, Switzerland. This article is an open access article distributed under the terms and conditions of the Creative Commons Attribution (CC BY) license (http://creativecommons.org/licenses/by/4.0/).
Share and Cite
Cao, W.; Yin, L.; Zhang, D.; Wang, Y.; Yuan, J.; Zhu, Y.; Dou, J. Contamination, Sources, and Health Risks Associated with Soil PAHs in Rebuilt Land from a Coking Plant, Beijing, China. Int. J. Environ. Res. Public Health 2019, 16, 670. https://0-doi-org.brum.beds.ac.uk/10.3390/ijerph16040670
Cao W, Yin L, Zhang D, Wang Y, Yuan J, Zhu Y, Dou J. Contamination, Sources, and Health Risks Associated with Soil PAHs in Rebuilt Land from a Coking Plant, Beijing, China. International Journal of Environmental Research and Public Health. 2019; 16(4):670. https://0-doi-org.brum.beds.ac.uk/10.3390/ijerph16040670
Chicago/Turabian StyleCao, Wei, Liqin Yin, Dan Zhang, Yingying Wang, Jing Yuan, Yi Zhu, and Junfeng Dou. 2019. "Contamination, Sources, and Health Risks Associated with Soil PAHs in Rebuilt Land from a Coking Plant, Beijing, China" International Journal of Environmental Research and Public Health 16, no. 4: 670. https://0-doi-org.brum.beds.ac.uk/10.3390/ijerph16040670