Short-Term Consumption of Cuban Policosanol Lowers Aortic and Peripheral Blood Pressure and Ameliorates Serum Lipid Parameters in Healthy Korean Participants: Randomized, Double-Blinded, and Placebo-Controlled Study

 ,
, 
Abstract
:1. Introduction
2. Materials and Methods
2.1. Policosanol
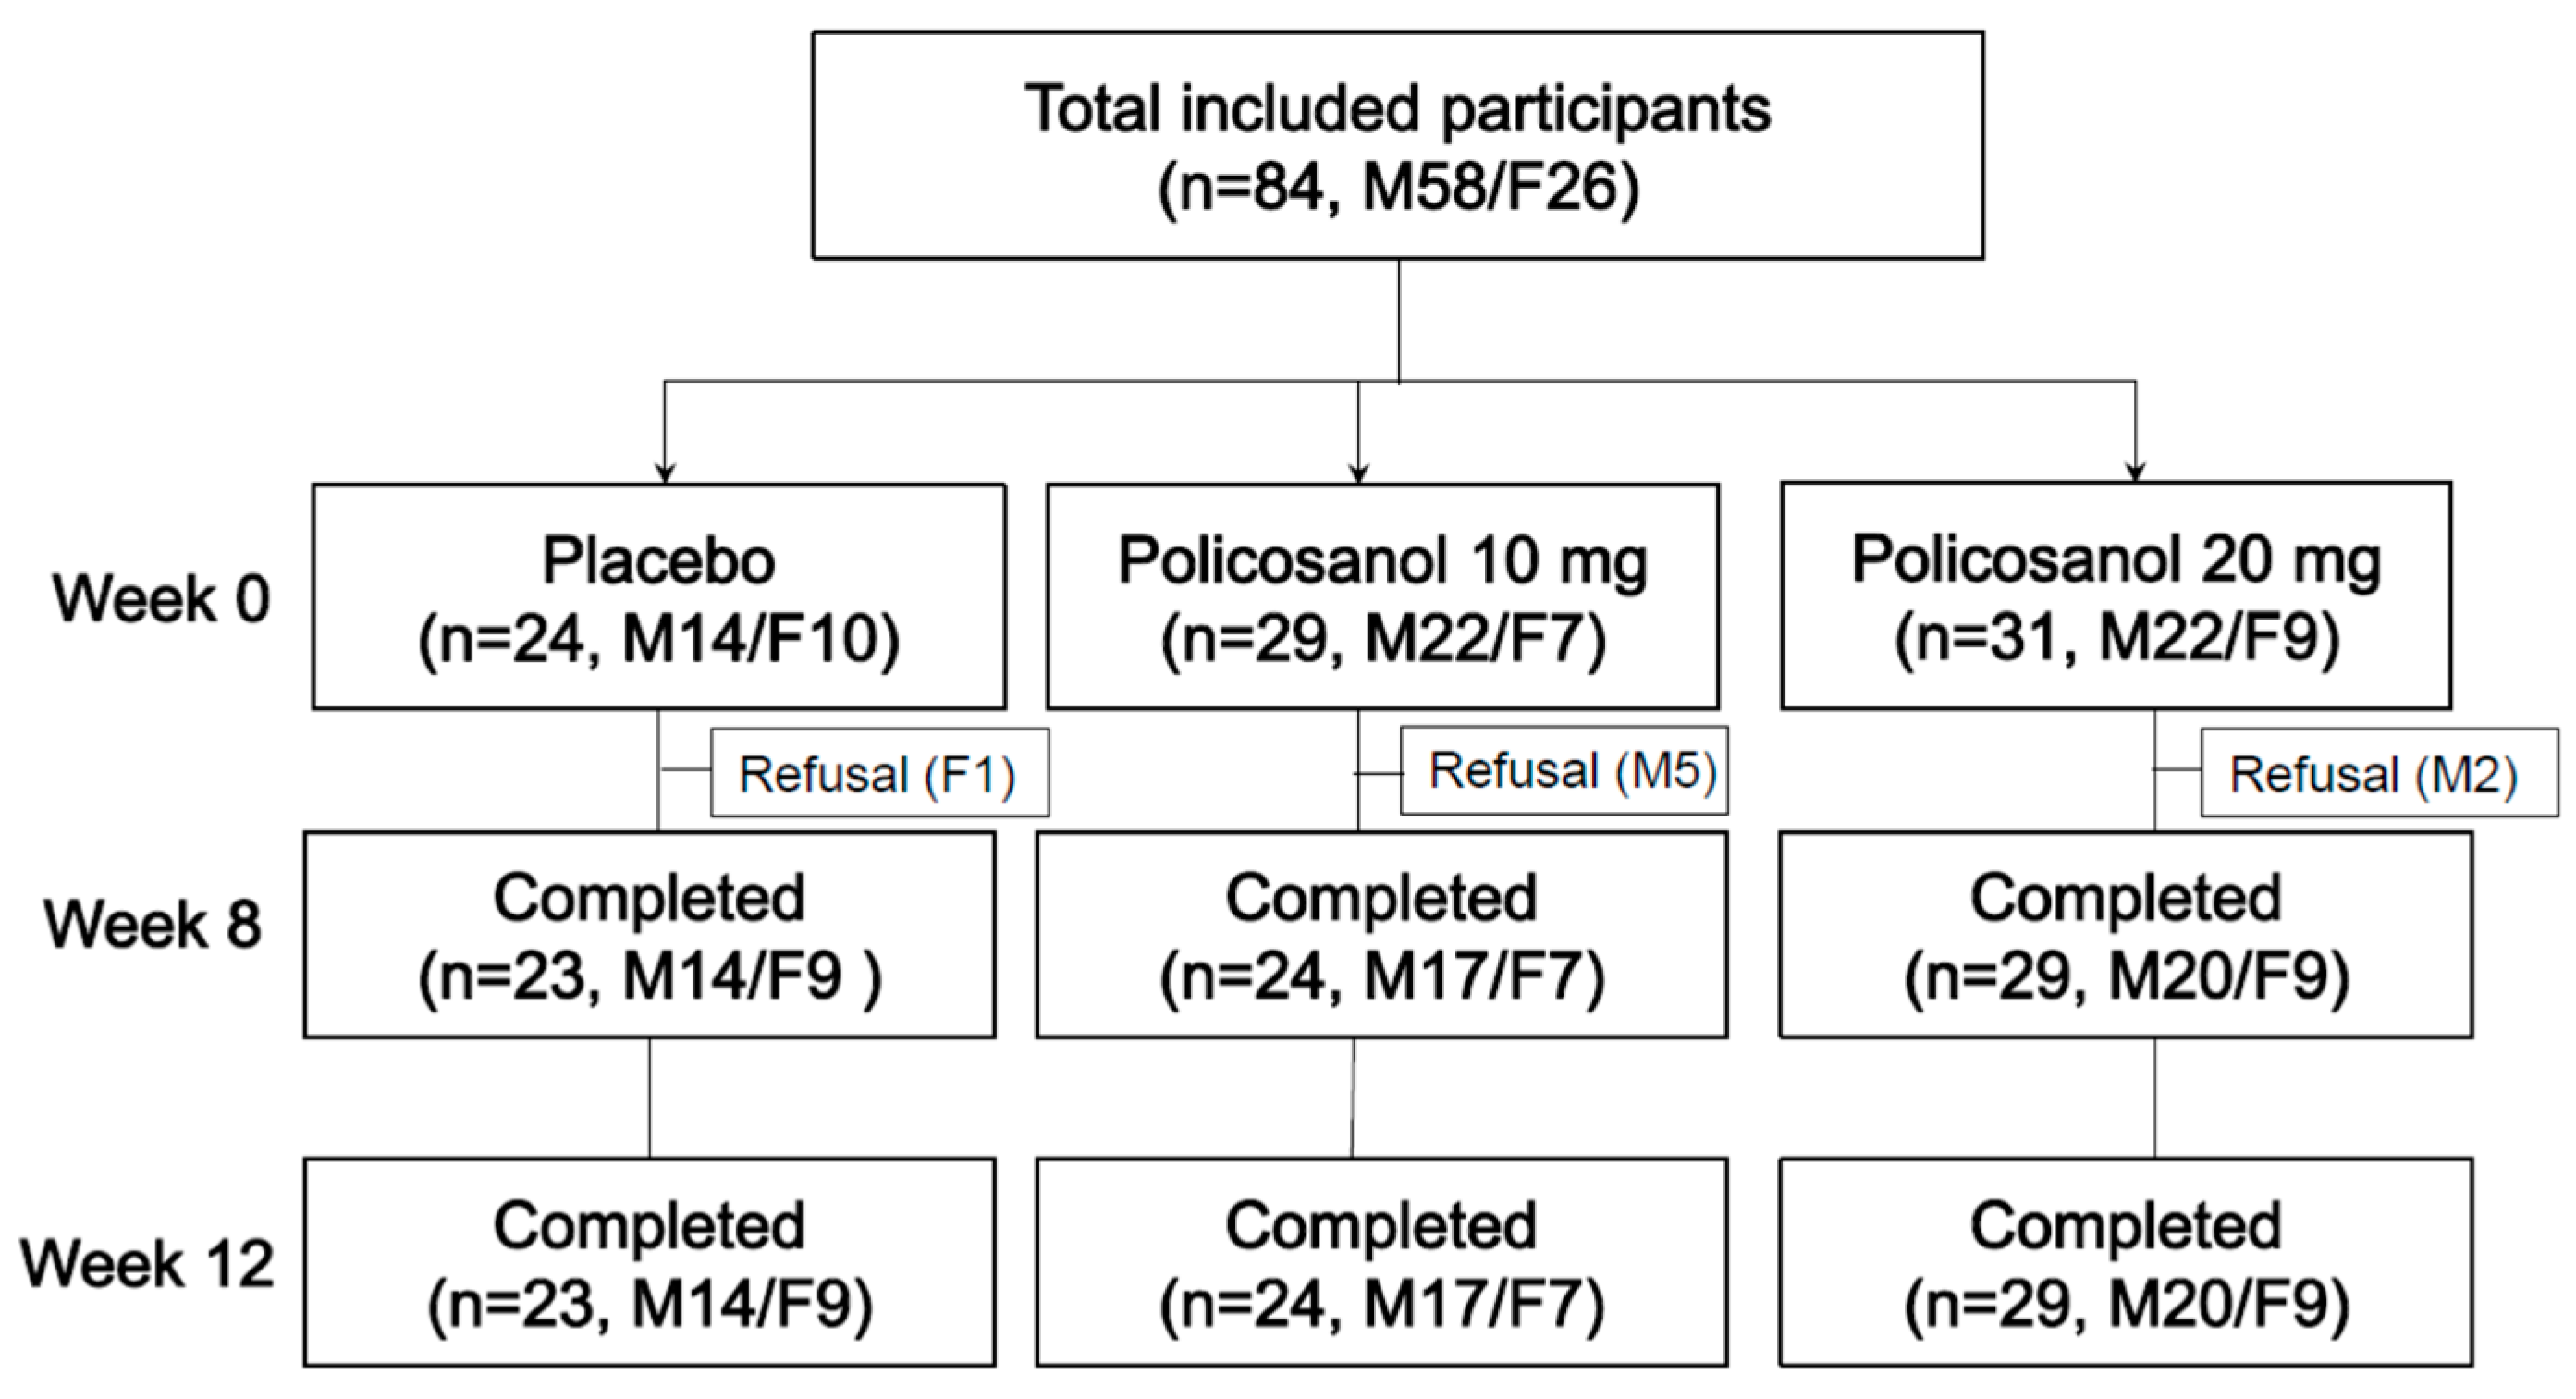
2.2. Participants
2.3. Study Design
2.4. Anthropometric Analysis
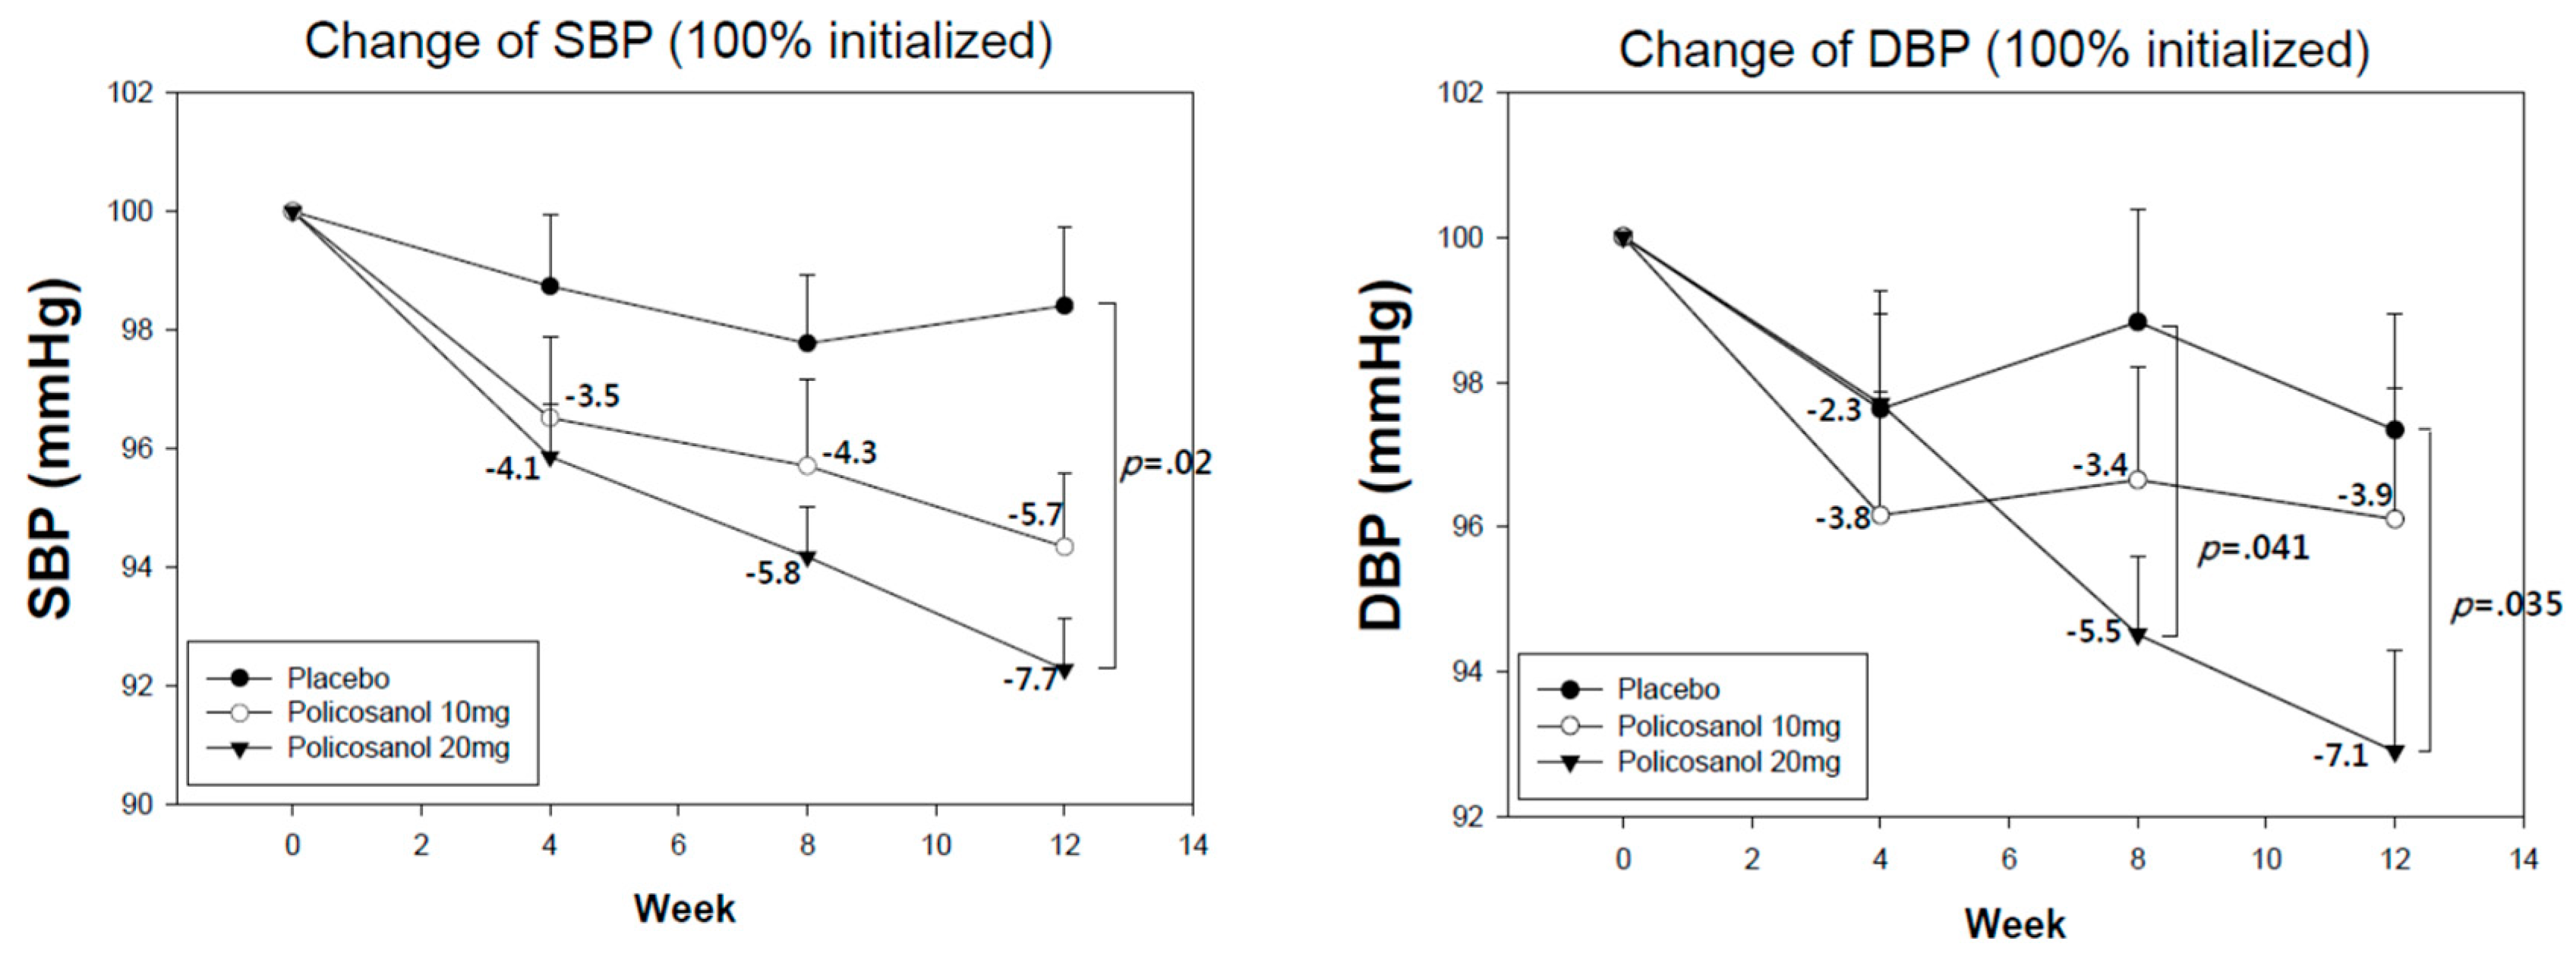
2.5. Measurement of Blood Pressure
2.6. Blood Analysis
2.7. Data Analysis
3. Results
3.1. Comparison of Body Composition and Peripheral BP
3.2. Change in Aortic BP and Mean Arterial Pressure
3.3. Change in Lipid and Aldosterone Profiles
3.4. Correlation Study among Blood Pressure and Lipid Parameters
4. Discussion
5. Conclusions
Supplementary Materials
Author Contributions
Funding
Conflicts of Interest
References
- Nelson, R.H. Hyperlipidemia as a risk factor for cardiovascular disease. Prim. Care 2013, 40, 195–211. [Google Scholar] [CrossRef] [PubMed]
- Lee, J.S.; Chang, P.Y.; Zhang, Y.; Kizer, J.R.; Best, L.G.; Howard, B.V. Triglyceride and HDL-C Dyslipidemia and Risks of Coronary Heart Disease and Ischemic Stroke by Glycemic Dysregulation Status: The Strong Heart Study. Diabetes Care 2017, 40, 529–537. [Google Scholar] [CrossRef] [PubMed] [Green Version]
- McGrowder, D.; Riley, C.; Morrison, E.Y.; Gordon, L. The role of high-density lipoproteins in reducing the risk of vascular diseases, neurogenerative disorders, and cancer. Cholesterol 2011, 2011, 496925. [Google Scholar] [CrossRef] [PubMed]
- Reitz, C.; Tang, M.X.; Schupf, N.; Manly, J.J.; Mayeux, R.; Luchsinger, J.A. Association of higher levels of high-density lipoprotein cholesterol in elderly individuals and lower risk of late-onset Alzheimer disease. Arch. Neurol. 2010, 67, 1491–1497. [Google Scholar] [CrossRef] [PubMed]
- Hirano, M.; Nakanishi, S.; Kubota, M.; Maeda, S.; Yoneda, M.; Yamane, K.; Kira, S.; Sasaki, H.; Kohno, N. Low high-density lipoprotein cholesterol level is a significant risk factor for development of type 2 diabetes: Data from the Hawaii-Los Angeles-Hiroshima study. J. Diabetes Investig. 2014, 5, 501–506. [Google Scholar] [CrossRef] [PubMed]
- Halperin, R.O.; Sesso, H.D.; Ma, J.; Buring, J.E.; Stampfer, M.J.; Gaziano, J.M. Dyslipidemia and the risk of incident hypertension in men. J. Hypertens. 2006, 47, 45–50. [Google Scholar] [CrossRef] [PubMed]
- Sung, K.C.; Park, H.Y.; Kim, M.J.; Reaven, G. Metabolic markers associated with insulin resistance predict type 2 diabetes in Koreans with normal blood pressure or prehypertension. Cardiovasc. Diabetol. 2016, 15, 47. [Google Scholar] [CrossRef] [PubMed]
- Tohidi, M.; Hatami, M.; Hadaegh, F.; Azizi, F. Triglycerides and triglycerides to high-density lipoprotein cholesterol ratio are strong predictors of incident hypertension in Middle Eastern women. J. Hum. Hypertens. 2012, 26, 525–532. [Google Scholar] [CrossRef] [PubMed]
- Xie, D.; Bollag, W.B. Obesity, hypertension and aldosterone: Is leptin the link? J. Endocrinol. 2016, 230, F7–F11. [Google Scholar] [CrossRef] [PubMed]
- Tsai, Y.Y.; Rainey, W.E.; Bollag, W.B. Very low-density lipoprotein (VLDL)-induced signals mediating aldosterone production. J. Endocrinol. 2017, 232, R115–R129. [Google Scholar] [CrossRef] [PubMed] [Green Version]
- Saha, S.; Bornstein, S.R.; Graessler, J.; Kopprasch, S. Crosstalk Between Glycoxidative Modification of Low-Density Lipoprotein, Angiotensin II-Sensitization, and Adrenocortical Aldosterone Release. Horm. Metab. Res. 2015, 47, 855–860. [Google Scholar] [CrossRef] [PubMed]
- Gouni-Berthold, I.; Berthold, H.K. Policosanol: Clinical pharmacology and therapeutic significance of a new lipid-lowering agent. Am. Heart J. 2002, 143, 356–365. [Google Scholar] [CrossRef] [PubMed]
- Menendez, R.; Mas, R.; Amor, A.M.; Gonzalez, R.M.; Fernandez, J.C.; Rodeiro, I.; Zayas, M.; Jimenez, S. Effects of policosanol treatment on the susceptibility of low density lipoprotein (LDL) isolated from healthy volunteers to oxidative modification in vitro. Br. J. Clin. Pharmacol. 2000, 50, 255–262. [Google Scholar] [CrossRef] [PubMed]
- Lim, S.M.; Yoo, J.A.; Lee, E.Y.; Cho, K.H. Enhancement of High-Density Lipoprotein Cholesterol Functions by Encapsulation of Policosanol Exerts Anti-Senescence and Tissue Regeneration Effects Via Improvement of Anti-Glycation, Anti-Apoptosis, and Cholesteryl Ester Transfer Inhibition. Rejuvenat. Res. 2016, 19, 59–70. [Google Scholar] [CrossRef] [PubMed]
- Lee, E.Y.; Yoo, J.A.; Lim, S.M.; Cho, K.H. Anti-Aging and Tissue Regeneration Ability of Policosanol Along with Lipid-Lowering Effect in Hyperlipidemic Zebrafish via Enhancement of High-Density Lipoprotein Functionality. Rejuvenat. Res. 2016, 19, 149–158. [Google Scholar] [CrossRef] [PubMed] [Green Version]
- Kim, J.Y.; Kim, S.M.; Kim, S.J.; Lee, E.Y.; Kim, J.R.; Cho, K.H. Consumption of policosanol enhances HDL functionality via CETP inhibition and reduces blood pressure and visceral fat in young and middle-aged subjects. Int. J. Mol. Med. 2017, 39, 889–899. [Google Scholar] [CrossRef] [PubMed] [Green Version]
- Cho, K.H.; Kim, S.J.; Yadav, D.; Kim, J.Y.; Kim, J.R. Consumption of Cuban Policosanol Improves Blood Pressure and Lipid Profile via Enhancement of HDL Functionality in Healthy Women Subjects: Randomized, Double-Blinded, and Placebo-Controlled Study. Oxid. Med. Cell. Longev. 2018, 2018, 4809525. [Google Scholar] [CrossRef] [PubMed]
- Cho, K.H.; Yadav, D.; Kim, S.J.; Kim, J.R. Blood Pressure Lowering Effect of Cuban Policosanol is Accompanied by Improvement of Hepatic Inflammation, Lipoprotein Profile, and HDL Quality in Spontaneously Hypertensive Rats. Molecules 2018, 23, 1080. [Google Scholar] [CrossRef] [PubMed]
- Kim, S.J.; Yadav, D.; Park, H.J.; Kim, J.R.; Cho, K.H. Long-Term Consumption of Cuban Policosanol Lowers Central and Brachial Blood Pressure and Improves Lipid Profile with Enhancement of Lipoprotein Properties in Healthy Korean Participants. Front. Physiol. 2018, 9, 412. [Google Scholar] [CrossRef] [PubMed]
- Canavaciolo, V.L.G.; Gómez, C.V. “Copycat-policosanols” versus genuine policosanol. Rev. CENIC Cienc. Químicas 2007, 38, 207. [Google Scholar]
- Yadav, D.; Kim, S.J.; Kim, J.R.; Cho, K.H. Correlation among lipid parameters, pulse wave velocity and central blood pressure in young Korean population. Clin. Exp. Hypertens. 2019, 41, 20–27. [Google Scholar] [CrossRef] [PubMed]
- Vlachopoulos, C.; Aznaouridis, K.; O’Rourke, M.F.; Safar, M.E.; Baou, K.; Stefanadis, C. Prediction of cardiovascular events and all-cause mortality with central haemodynamics: A systematic review and meta-analysis. Eur. Heart J. 2010, 31, 1865–1871. [Google Scholar] [CrossRef] [PubMed]
- Grundy, S.M. Metabolic syndrome update. Trends Cardiovasc. Med. 2016, 26, 364–373. [Google Scholar] [CrossRef] [PubMed]
- Materson, B.J.; Garcia-Estrada, M.; Degraff, S.B.; Preston, R.A. Prehypertension is real and can be associated with target organ damage. J. Am. Soc. Hypertens. 2017, 11, 704–708. [Google Scholar] [CrossRef] [PubMed]
- Tsukinoki, R.; Okamura, T.; Watanabe, M.; Kokubo, Y.; Higashiyama, A.; Nishimura, K.; Takegami, M.; Murakami, Y.; Okayama, A.; Miyamoto, Y. Blood pressure, low-density lipoprotein cholesterol, and incidences of coronary artery disease and ischemic stroke in Japanese: The Suita study. Am. J. Hypertens. 2014, 27, 1362–1369. [Google Scholar] [CrossRef] [PubMed]
- Gong, J.; Qin, X.; Yuan, F.; Hu, M.; Chen, G.; Fang, K.; Wang, D.; Jiang, S.; Li, J.; Zhao, Y.; et al. Efficacy and safety of sugarcane policosanol on dyslipidemia: A meta-analysis of randomized controlled trials. Mol. Nutr. Food Res. 2018, 62. [Google Scholar] [CrossRef] [PubMed]
- Sesso, H.D.; Stampfer, M.J.; Rosner, B.; Hennekens, C.H.; Gaziano, J.M.; Manson, J.E.; Glynn, R.J. Systolic and diastolic blood pressure, pulse pressure, and mean arterial pressure as predictors of cardiovascular disease risk in Men. J. Hypertens. 2000, 36, 801–807. [Google Scholar] [CrossRef]
- Yadav, D.; Hyun, D.S.; Ahn, S.V.; Koh, S.B.; Kim, J.Y. A prospective study of the association between total sleep duration and incident hypertension. J. Clin. Hypertens. 2017, 19, 550–557. [Google Scholar] [CrossRef] [PubMed]
- Hsu, C.H.; Chang, J.B.; Liu, I.C.; Lau, S.C.; Yu, S.M.; Hsieh, C.H.; Lin, J.D.; Liang, Y.J.; Pei, D.; Chen, Y.L. Mean arterial pressure is better at predicting future metabolic syndrome in the normotensive elderly: A prospective cohort study in Taiwan. Prev. Med. Rep. 2015, 72, 76–82. [Google Scholar] [CrossRef] [PubMed]


| Variables | Group 1 Placebo (n = 23, M14/F9) | Group 2 Policosanol 10 mg (n = 24, M17/F7) | Group 3 Policosanol 20 mg (n = 29, M20/F9) | ||||
|---|---|---|---|---|---|---|---|
| Age | 31.3 ± 14.2 | 32.4 ± 14.8 | 27.9 ± 10.2 | ||||
| Body composition | Week 0 | Week 8 | Week 0 | Week 8 | Week 0 | Week 8 | |
| BMI (body mass index) | 22.0 ± 2.9 | 22.3 ± 2.8 | 23.0 ± 3.7 | 22.9 ± 3.7 | 23.5 ± 3.0 | 23.2 ± 2.8 * | |
| Subcutaneous fat (kg) | 11.9 ± 4.1 | 12.2 ± 4.2 | 13.5 ± 5.4 | 13.7 ± 5.7 | 13.6 ± 4.6 | 13.2 ± 4.3 * | |
| Visceral fat (kg) | 1.6 ± 1.1 | 1.7 ± 1.1 | 2.0 ± 1.1 | 2.1 ± 1.3 | 1.9 ± 1.0 | 1.8 ± 0.8 * | |
| Peripheral BP (mmHg) | Week 0 | Week 8 | Week 0 | Week 8 | Week 0 | Week 8 | |
| Average | Systolic | 134.4 ± 8.8 | 131.3 ± 10.3 | 135.8 ± 12.3 | 129.8 ± 12.9 ** | 136.3 ± 6.1 | 128.4 ± 9.1 *** |
| Diastolic | 85.4 ± 6.8 | 84.3 ± 8.9 | 84.3 ± 8.5 | 81.3 ± 8.7 * | 84.2 ± 7.3 | 79.5 ± 7.8 *** | |
| Aortic BP (mmHg) | Week 0 | Week 8 | Week 0 | Week 8 | Week 0 | Week 8 | |
| Aortic | Systolic | 123.1 ± 11.8 | 117.1 ± 11.0 ** | 123.0 ± 12.5 | 114.6 ± 11.8 *** | 120.7 ± 8.7 | 114.0 ± 11.2 *** |
| Diastolic | 90.2 ± 7.9 | 87.7 ± 8.5 | 88.5 ± 9.2 | 85.0 ± 8.8 * | 88.6 ± 8.0 | 84.4 ± 9.5 ** | |
| Mean Arterial Pressure | 101.7 ± 6.9 | 100.0 ± 9.1 | 101.5 ± 9.3 | 97.4 ± 9.8 * | 101.6 ± 6.3 | 95.6 ± 7.6 *** | |
| Variables | Group 1 Placebo (n = 23, M14/F9) | Group 2 Policosanol 10 mg (n = 24, M17/F7) | Group 3 Policosanol 20 mg (n = 29, M20/F9) | ||||
|---|---|---|---|---|---|---|---|
| Age | 31.3 ± 14.2 | 32.4 ± 14.8 | 27.9 ± 10.2 | ||||
| Body composition | Week 0 n = 23 | Week 12 n = 23 | Week 0 n = 23 | Week 12 n = 23 | Week 0 n = 29 | Week 12 n = 29 | |
| BMI (body mass index) | 22.0 ± 2.9 | 22.2 ± 2.9 | 23.0 ± 3.8 | 23.1 ± 3.9 | 23.5 ± 3.0 | 23.4 ± 2.8 | |
| Subcutaneous fat (kg) | 11.9 ± 4.1 | 11.7 ± 3.9 | 13.5 ± 5.5 | 14.1 ± 5.6 | 13.6 ± 4.6 | 13.5 ± 4.3 | |
| Visceral fat (kg) | 1.6 ± 1.1 | 1.6 ± 0.9 | 2.0 ± 1.2 | 2.1 ± 1.3 | 1.9 ± 1.0 | 1.9 ± 0.9 | |
| Peripheral BP (mmHg) | Week 0 n = 23 | Week 12 n = 23 | Week 0 n = 24 | Week 12 n = 24 | Week 0 n = 29 | Week 12 n = 29 | |
| Average | Systolic | 134.4 ± 8.8 | 132.1 ± 10.2 | 135.8 ± 12.3 | 127.7 ± 9.6 *** | 136.3 ± 6.1 | 125.8 ± 8.7 *** |
| Diastolic | 85.4 ± 6.8 | 83.1 ± 9.1 | 84.3 ± 8.5 | 80.6 ± 7.3 * | 84.2 ± 7.3 | 78.0 ± 7.7 *** | |
| Aortic BP (mmHg) | Week 0 n = 21 | Week 12 n = 21 | Week 0 n = 24 | Week 12 n = 24 | Week 0 n = 29 | Week 12 n = 29 | |
| Aortic | Systolic | 122.1 ± 11.8 | 117.8 ± 9.0 | 123.0 ± 12.5 | 113.9 ± 8.6 *** | 120.7 ± 8.7 | 110.7 ± 9.0 *** |
| Diastolic | 90.2 ± 8.3 | 87.0 ± 9.3 | 88.5 ± 9.2 | 85.5 ± 7.5 | 88.6 ± 8.0 | 84.1 ± 9.2 ** | |
| Mean Arterial Pressure | 101.7 ± 6.9 | 99.4 ± 9.1 | 101.5 ± 9.3 | 96.3 ± 7.6 ** | 101.6 ± 6.3 | 94.0 ± 7.6 *** | |
| Variables | Groups | 0 Week a | 4 Week b | 8 Week c | 12 Week d | p for Time Differences | F (p) | Sources | F | p |
|---|---|---|---|---|---|---|---|---|---|---|
| Mean ± SD | Mean ± SD | Mean ± SD | Mean ± SD | |||||||
| Systolic BP | Placebo (n = 23) | 134.4 ± 8.8 a | 132.7 ± 10.7 b | 131.3 ± 10.3 c | 132.1 ± 10.2 d | No significance | 1.292 (0.286) | Group | 0.438 | 0.647 |
| Policosanol 10 mg (n = 24) | 135.8 ± 12.3 a | 130.8 ± 12.0 b | 129.8 ± 12.9 c | 127.7 ± 9.6 d | a > b (0.0004) a > c (0.007) a > d (0.0002) b > d (0.025) | 7.675 (<0.001) | Time | 25.44 | <0.001 | |
| Policosanol 20 mg (n = 29) | 136.3 ± 6.1 a | 130.7 ± 9.0 b | 128.2 ± 9.0 c | 125.9 ± 8.6 d | a > b (<0.001) a > c (<0.001) a > d (<0.001) b > c (0.021) b > d (<0.001) c > d (0.007) | 35.687 (<0.001) | Time × Group | 2.81 | 0.012 | |
| p for group differences | 0.753 | 0.770 | 0.631 | 0.020 (Placebo vs. Policosanol 20 mg) | ||||||
| Diastolic BP | Placebo (n = 23) | 85.4 ± 6.8 a | 83.3 ± 8.9 b | 84.3 ± 8.9 c | 83.1 ± 9.1 d | No significance | 1.408 (0.270) | Group | 1.277 | 0.285 |
| Policosanol 10 mg (n = 24) | 84.3 ± 8.5 a | 80.8 ± 7.5 b | 81.3 ± 8.7 c | 80.6 ± 7.3 d | a > b (0.021) a > c (0.042) a > d (0.028) | 3.381 (0.028) | Time | 8.408 | <0.001 | |
| Policosanol 20 mg (n = 29) | 84.2 ± 7.3 a | 82.0 ± 6.9 b | 79.2 ± 7.6 c | 78.0 ± 7.7 d | a > b (0.002) a > c (<0.001) a > d (<0.001) b > c (0.002) b > d (<0.001) | 11.273 (<0.001) | Time × Group | 3.377 | 0.023 | |
| p for group differences | 0.831 | 0.532 | 0.041 (Placebo vs. Policosanol 20 mg) | 0.035 (Placebo vs. Policosanol 20 mg) |
| Variables | Group 1 Placebo (n = 23, M14/F9) | Group 2 Policosanol 10 mg (n = 23, M16/F7) | Group 3 Policosanol 20 mg (n = 28, M19/F9) | |||
|---|---|---|---|---|---|---|
| Blood Profile | Week 0 | Week 12 | Week 0 | Week 12 | Week 0 | Week 12 |
| TC (mg/dL) | 188.1 ± 35.1 | 203.7 ± 40.3 | 183.6 ± 29.9 | 166.1 ± 30.0 * | 186.3 ± 42.5 | 170.3 ± 31.8 * |
| TG (mg/dL) | 87.4 ± 35.2 | 80.5 ± 38.9 | 104.6 ± 70.6 | 116.5 ± 81.1 | 108.3 ± 92.6 | 105.5 ± 73.8 |
| HDL-C (mg/dL) | 39.8 ± 6.9 | 43.5 ± 7.4 | 35.9 ± 6.3 | 41.7 ± 7.9 ** | 36.9 ± 9.4 | 44.2 ± 7.6 ** |
| % HDL-C in TC | 21.9 ± 5.8 | 22.2 ± 6.0 | 20.2 ± 4.7 | 25.9 ± 6.5 ** | 21.3 ± 8.4 | 26.6 ± 6.0 ** |
| TG/HDL-C | 2.3 ± 1.2 | 2.0 ± 1.2 | 3.2 ± 2.7 | 3.0 ± 2.5 | 3.4 ± 3.6 | 2.4 ± 1.6 |
| LDL-C (mg/dL) | 130.8 ± 35.7 | 144.1 ± 37.6 | 126.7 ± 27.5 | 101.2 ± 31.3 ** | 127.8 ± 39.1 | 105.0 ± 32.1 ** |
| LDL-C/HDL-C | 3.4 ± 1.2 | 3.4 ± 1.1 | 3.6 ± 1.0 | 2.5 ± 1.1 ** | 3.8 ± 1.6 | 2.5 ± 0.9 ** |
| Glucose (mg/dL) | 86.3 ± 12.6 | 91.3 ± 11.1 | 97.3 ± 11.0 | 96.3 ± 12.6 | 93.5 ± 14.0 | 95.7 ± 14.5 |
| Aldosterone (ng/dL) | 19.7 ± 13.9 | 20.0 ± 12.6 | 30.0 ± 23.1 | 19.3 ± 9.3 * | 24.7 ± 12.1 | 19.0 ± 9.1 * |
| Variables | Groups | 0 Week a | 4 Week b | 8 Week c | 12 Week d | p for Time Differences | F (p) | Sources | F | p |
|---|---|---|---|---|---|---|---|---|---|---|
| Mean ± SD | Mean ± SD | Mean ± SD | Mean ± SD | |||||||
| TC | Placebo (n = 23) | 188.1 ± 35.1 a | 188.0 ± 30.3 b | 188.9 ± 39.2 c | 203.7 ± 40.3 d | No significant | 1.683 (0.203) | Group | 2.980 | 0.057 |
| Policosanol 10 mg (n = 23) | 183.6 ± 29.9 a | 178.6 ± 33.6 b | 174.9 ± 29.1 c | 166.1 ± 30.0 d | a > d (0.001) b > d (0.010) | 4.994 (0.010) | Time | 2.389 | 0.076 | |
| Policosanol 20 mg (n = 28) | 186.3 ± 42.5 a | 171.4 ± 29.1 b | 170.2 ± 37.2 c | 170.3 ± 31.8 d | a > b (0.005) a > c (0.015) a > d (0.029) | 3.737 (0.024) | Time × Group | 2.997 | 0.009 | |
| p for group differences | 0.915 | 0.169 | 0.167 | 0.0005 (Placebo vs. Policosanol 10 mg, Policosanol 20 mg) | ||||||
| LDL-C | Placebo (n = 23) | 130.8 ± 35.7 a | 126.8 ± 30.5 b | 125.0 ± 26.6 c | 144.1 ± 37.6 d | No significant | 2.346 (0.103) | Group | 3.507 | 0.035 |
| Policosanol 10 mg (n = 23) | 126.7 ± 27.5 a | 120.4 ± 30.9 b | 111.0 ± 29.1 c | 101.2 ± 31.3 d | a > d (<0.001) b > d (0.001) | 8.509 (0.001) | Time | 7.472 | <0.001 | |
| Policosanol 20 mg (n = 28) | 127.8 ± 39.1 a | 112.9 ± 24.9 b | 107.1 ± 40.1 c | 105.0 ± 32.1 d | a > b (0.008) a > c (0.0002) a > d (0.0001) | 7.406 (<0.001) | Time × Group | 4.537 | <0.001 | |
| p for group differences | 0.916 | 0.226 | 0.148 | <0.001 (Placebo vs. Policosanol 10 mg, Policosanol 20 mg) | ||||||
| %HDL-C in TC | Placebo (n = 23) | 21.9 ± 5.8 a | 21.4 ± 5.1 b | 24.1 ± 7.5 c | 22.2 ± 6.0 d | No significant | 1.271 (0.311) | Group | 0.289 | 0.750 |
| Policosanol 10 mg (n = 23) | 20.2 ± 4.7 a | 21.7 ± 7.2 b | 25.2 ± 8.2 c | 25.9 ± 6.5 d | a < c (0.002) a < d (<0.001) b < c (0.026) b < d (0.00007) | 18.749 (<0.001) | Time | 25.886 | <0.001 | |
| Policosanol 20 mg (n = 28) | 21.3 ± 8.4 a | 21.0 ± 4.9 b | 25.7 ± 8.3 c | 26.6 ± 6.0 d | a < c (0.00001) a < d (0.00004) b < c (0.0002) b < d (<0.001) | 16.887 (<0.001) | Time × Group | 3.453 | 0.003 | |
| p for group differences | 0.684 | 0.918 | 0.769 | 0.035 (Placebo vs. Policosanol 10 mg, Policosanol 20 mg) |
© 2019 by the authors. Licensee MDPI, Basel, Switzerland. This article is an open access article distributed under the terms and conditions of the Creative Commons Attribution (CC BY) license (http://creativecommons.org/licenses/by/4.0/).
Share and Cite
Park, H.-J.; Yadav, D.; Jeong, D.-J.; Kim, S.-J.; Bae, M.-A.; Kim, J.-R.; Cho, K.-H. Short-Term Consumption of Cuban Policosanol Lowers Aortic and Peripheral Blood Pressure and Ameliorates Serum Lipid Parameters in Healthy Korean Participants: Randomized, Double-Blinded, and Placebo-Controlled Study. Int. J. Environ. Res. Public Health 2019, 16, 809. https://0-doi-org.brum.beds.ac.uk/10.3390/ijerph16050809
Park H-J, Yadav D, Jeong D-J, Kim S-J, Bae M-A, Kim J-R, Cho K-H. Short-Term Consumption of Cuban Policosanol Lowers Aortic and Peripheral Blood Pressure and Ameliorates Serum Lipid Parameters in Healthy Korean Participants: Randomized, Double-Blinded, and Placebo-Controlled Study. International Journal of Environmental Research and Public Health. 2019; 16(5):809. https://0-doi-org.brum.beds.ac.uk/10.3390/ijerph16050809
Chicago/Turabian StylePark, Hye-Jeong, Dhananjay Yadav, Da-Jeong Jeong, Suk-Jeong Kim, Myung-Ae Bae, Jae-Ryong Kim, and Kyung-Hyun Cho. 2019. "Short-Term Consumption of Cuban Policosanol Lowers Aortic and Peripheral Blood Pressure and Ameliorates Serum Lipid Parameters in Healthy Korean Participants: Randomized, Double-Blinded, and Placebo-Controlled Study" International Journal of Environmental Research and Public Health 16, no. 5: 809. https://0-doi-org.brum.beds.ac.uk/10.3390/ijerph16050809