A Deep Neural Network-Based Method for Early Detection of Osteoarthritis Using Statistical Data

Abstract
:1. Introduction
2. Related Work
3. Materials and Methods
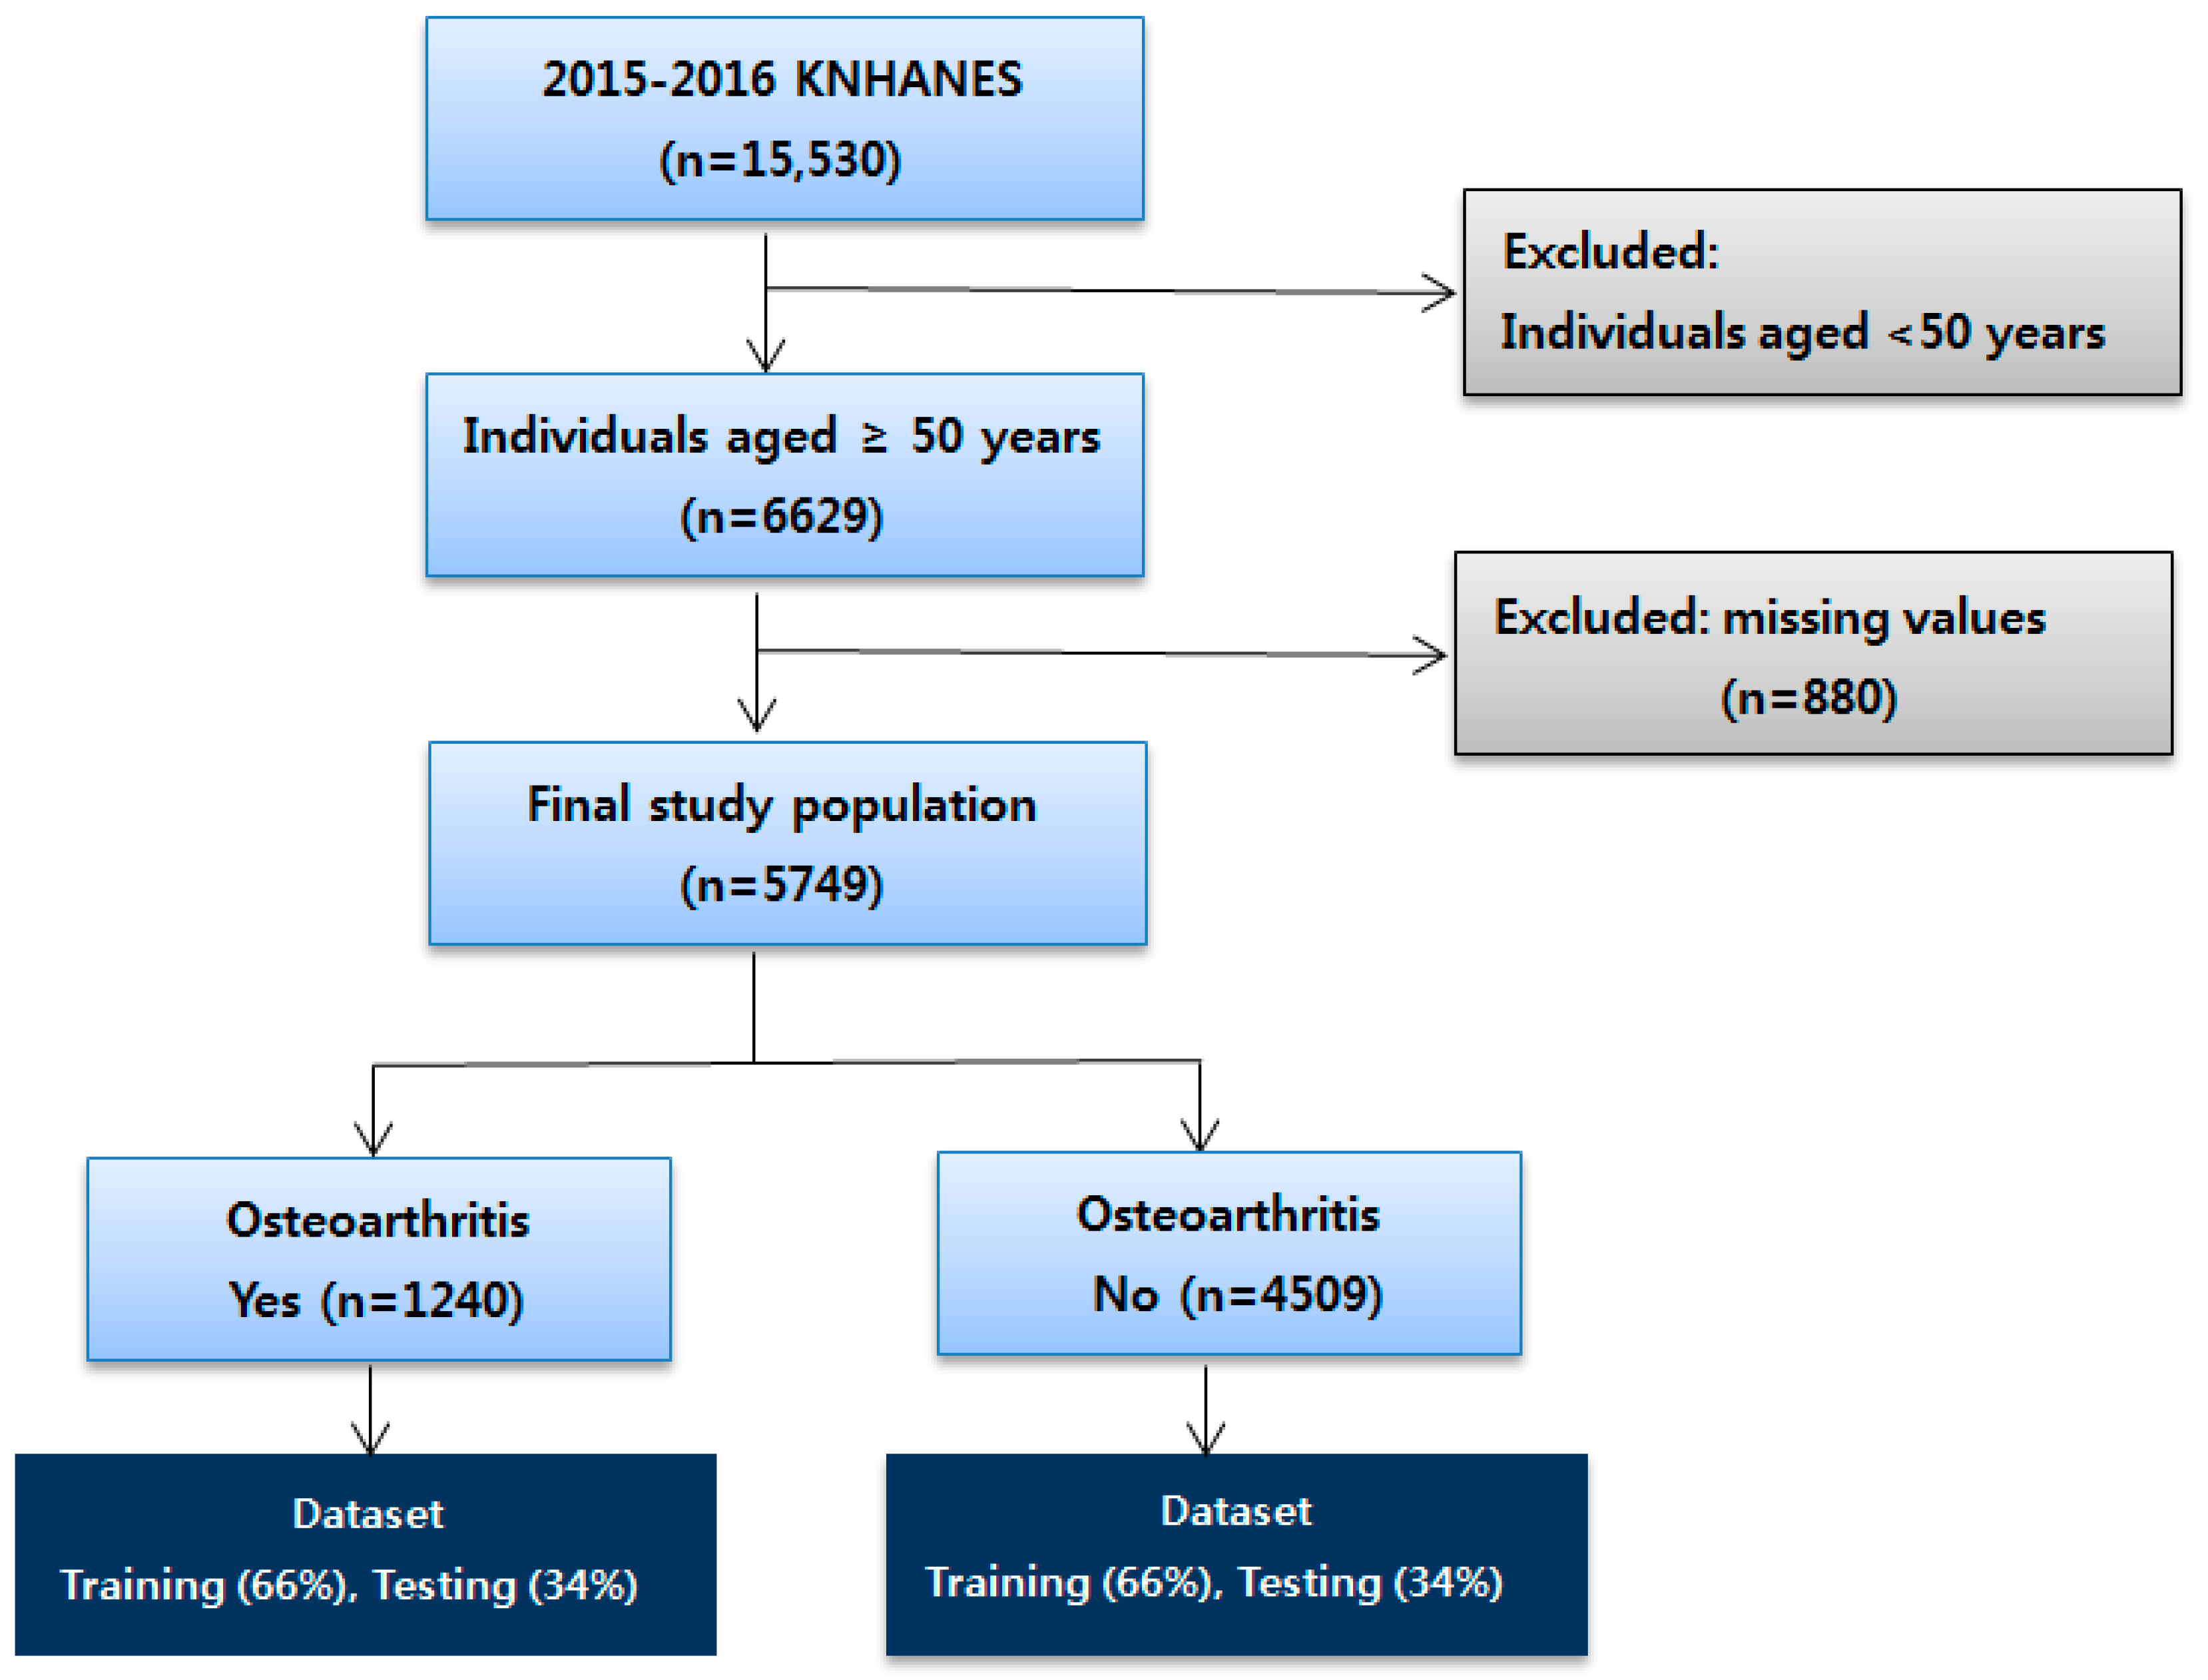
3.1. Data Source
3.2. Main Variables
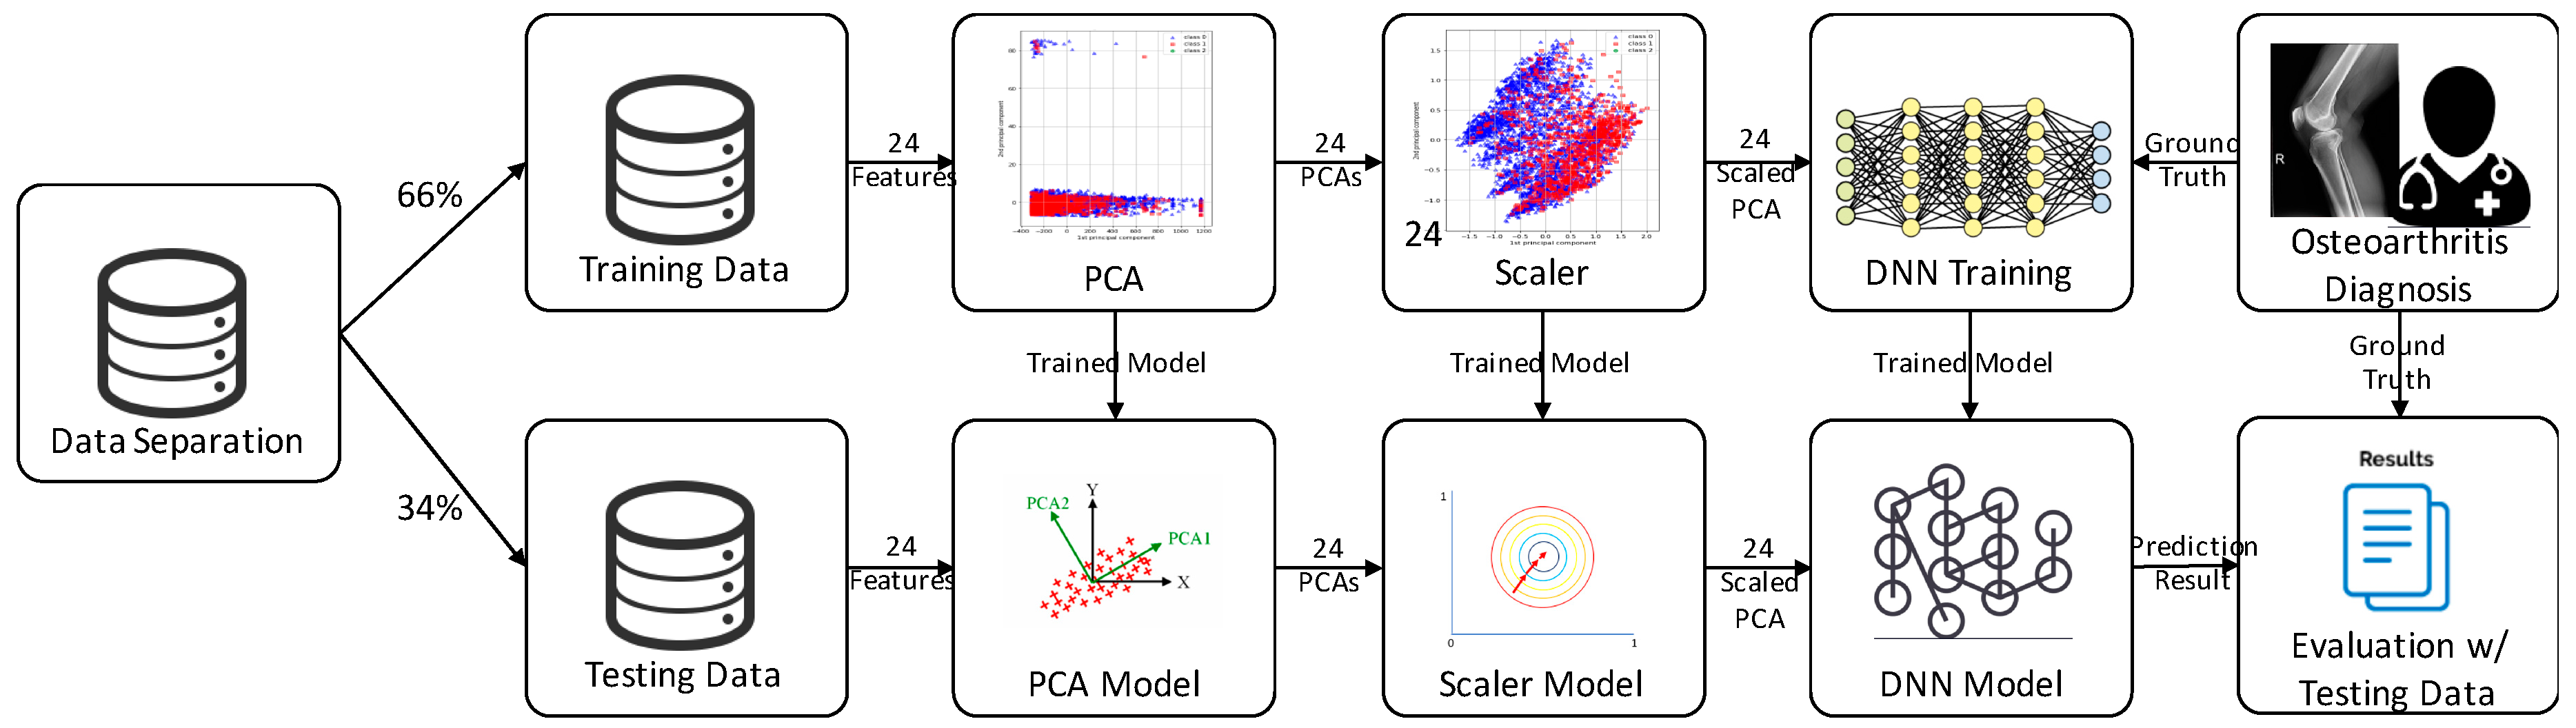
3.3. Methods
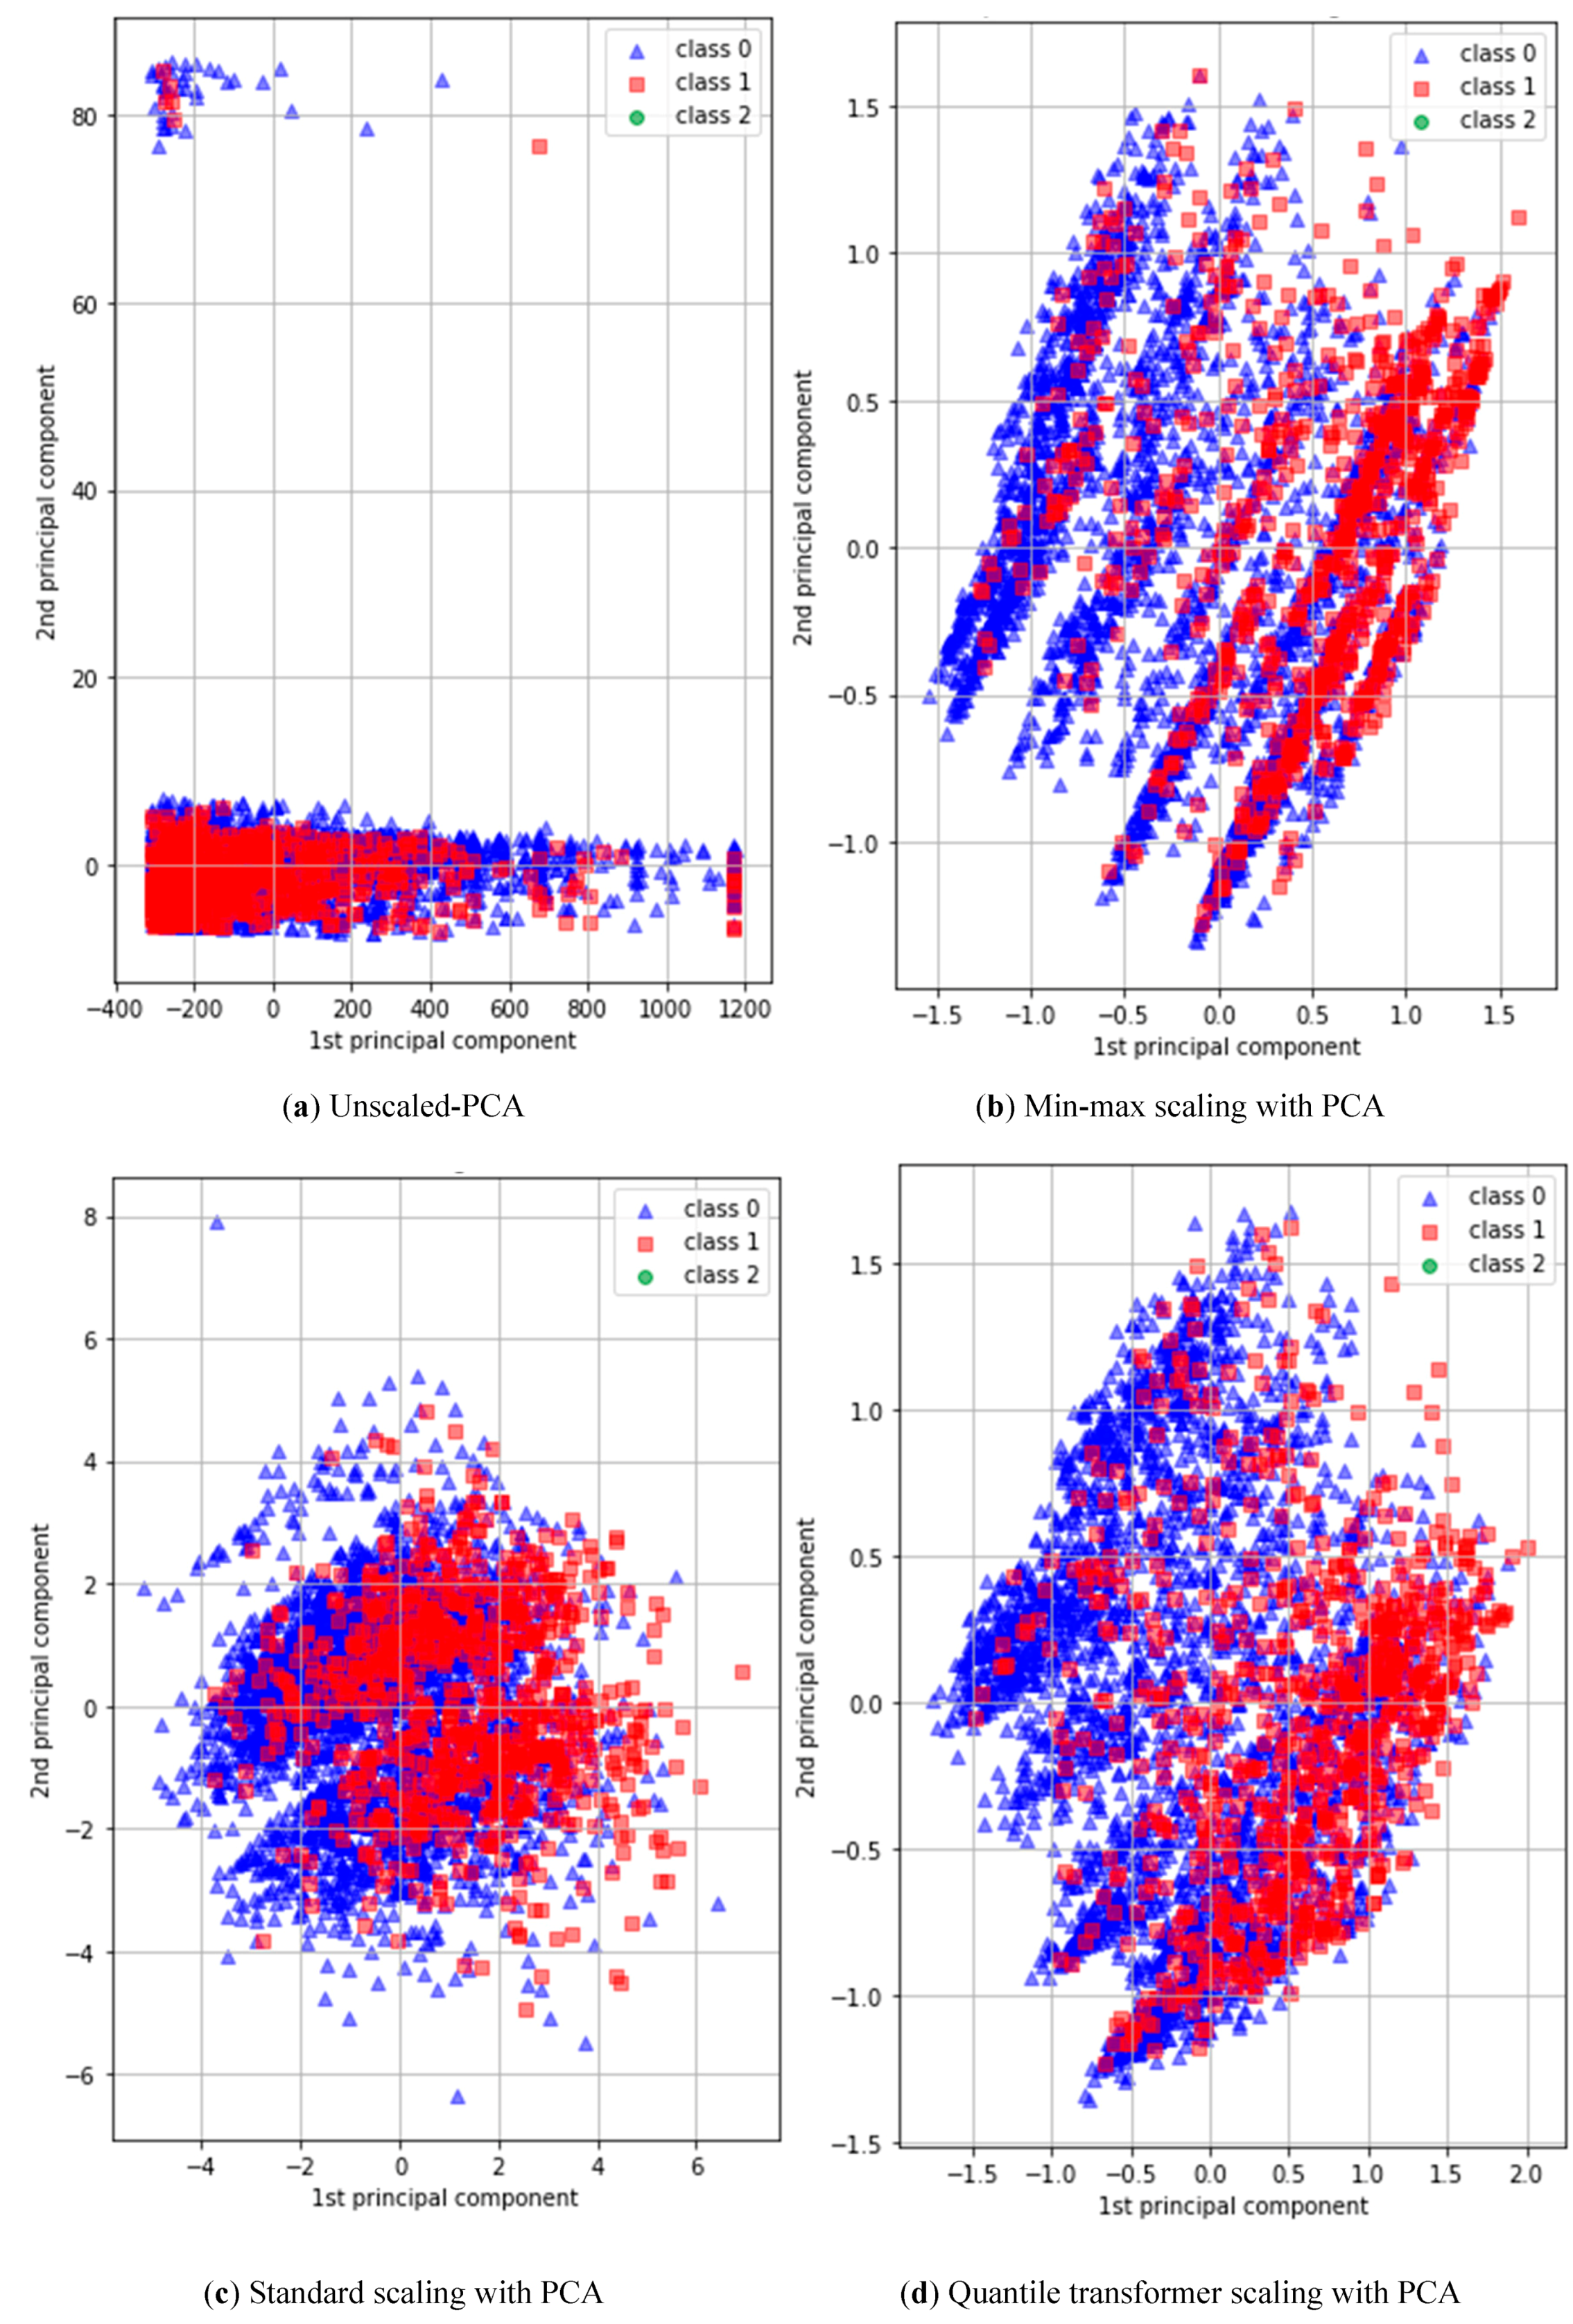
3.4. Preprocessing
3.5. Architecture of Deep Neural Network
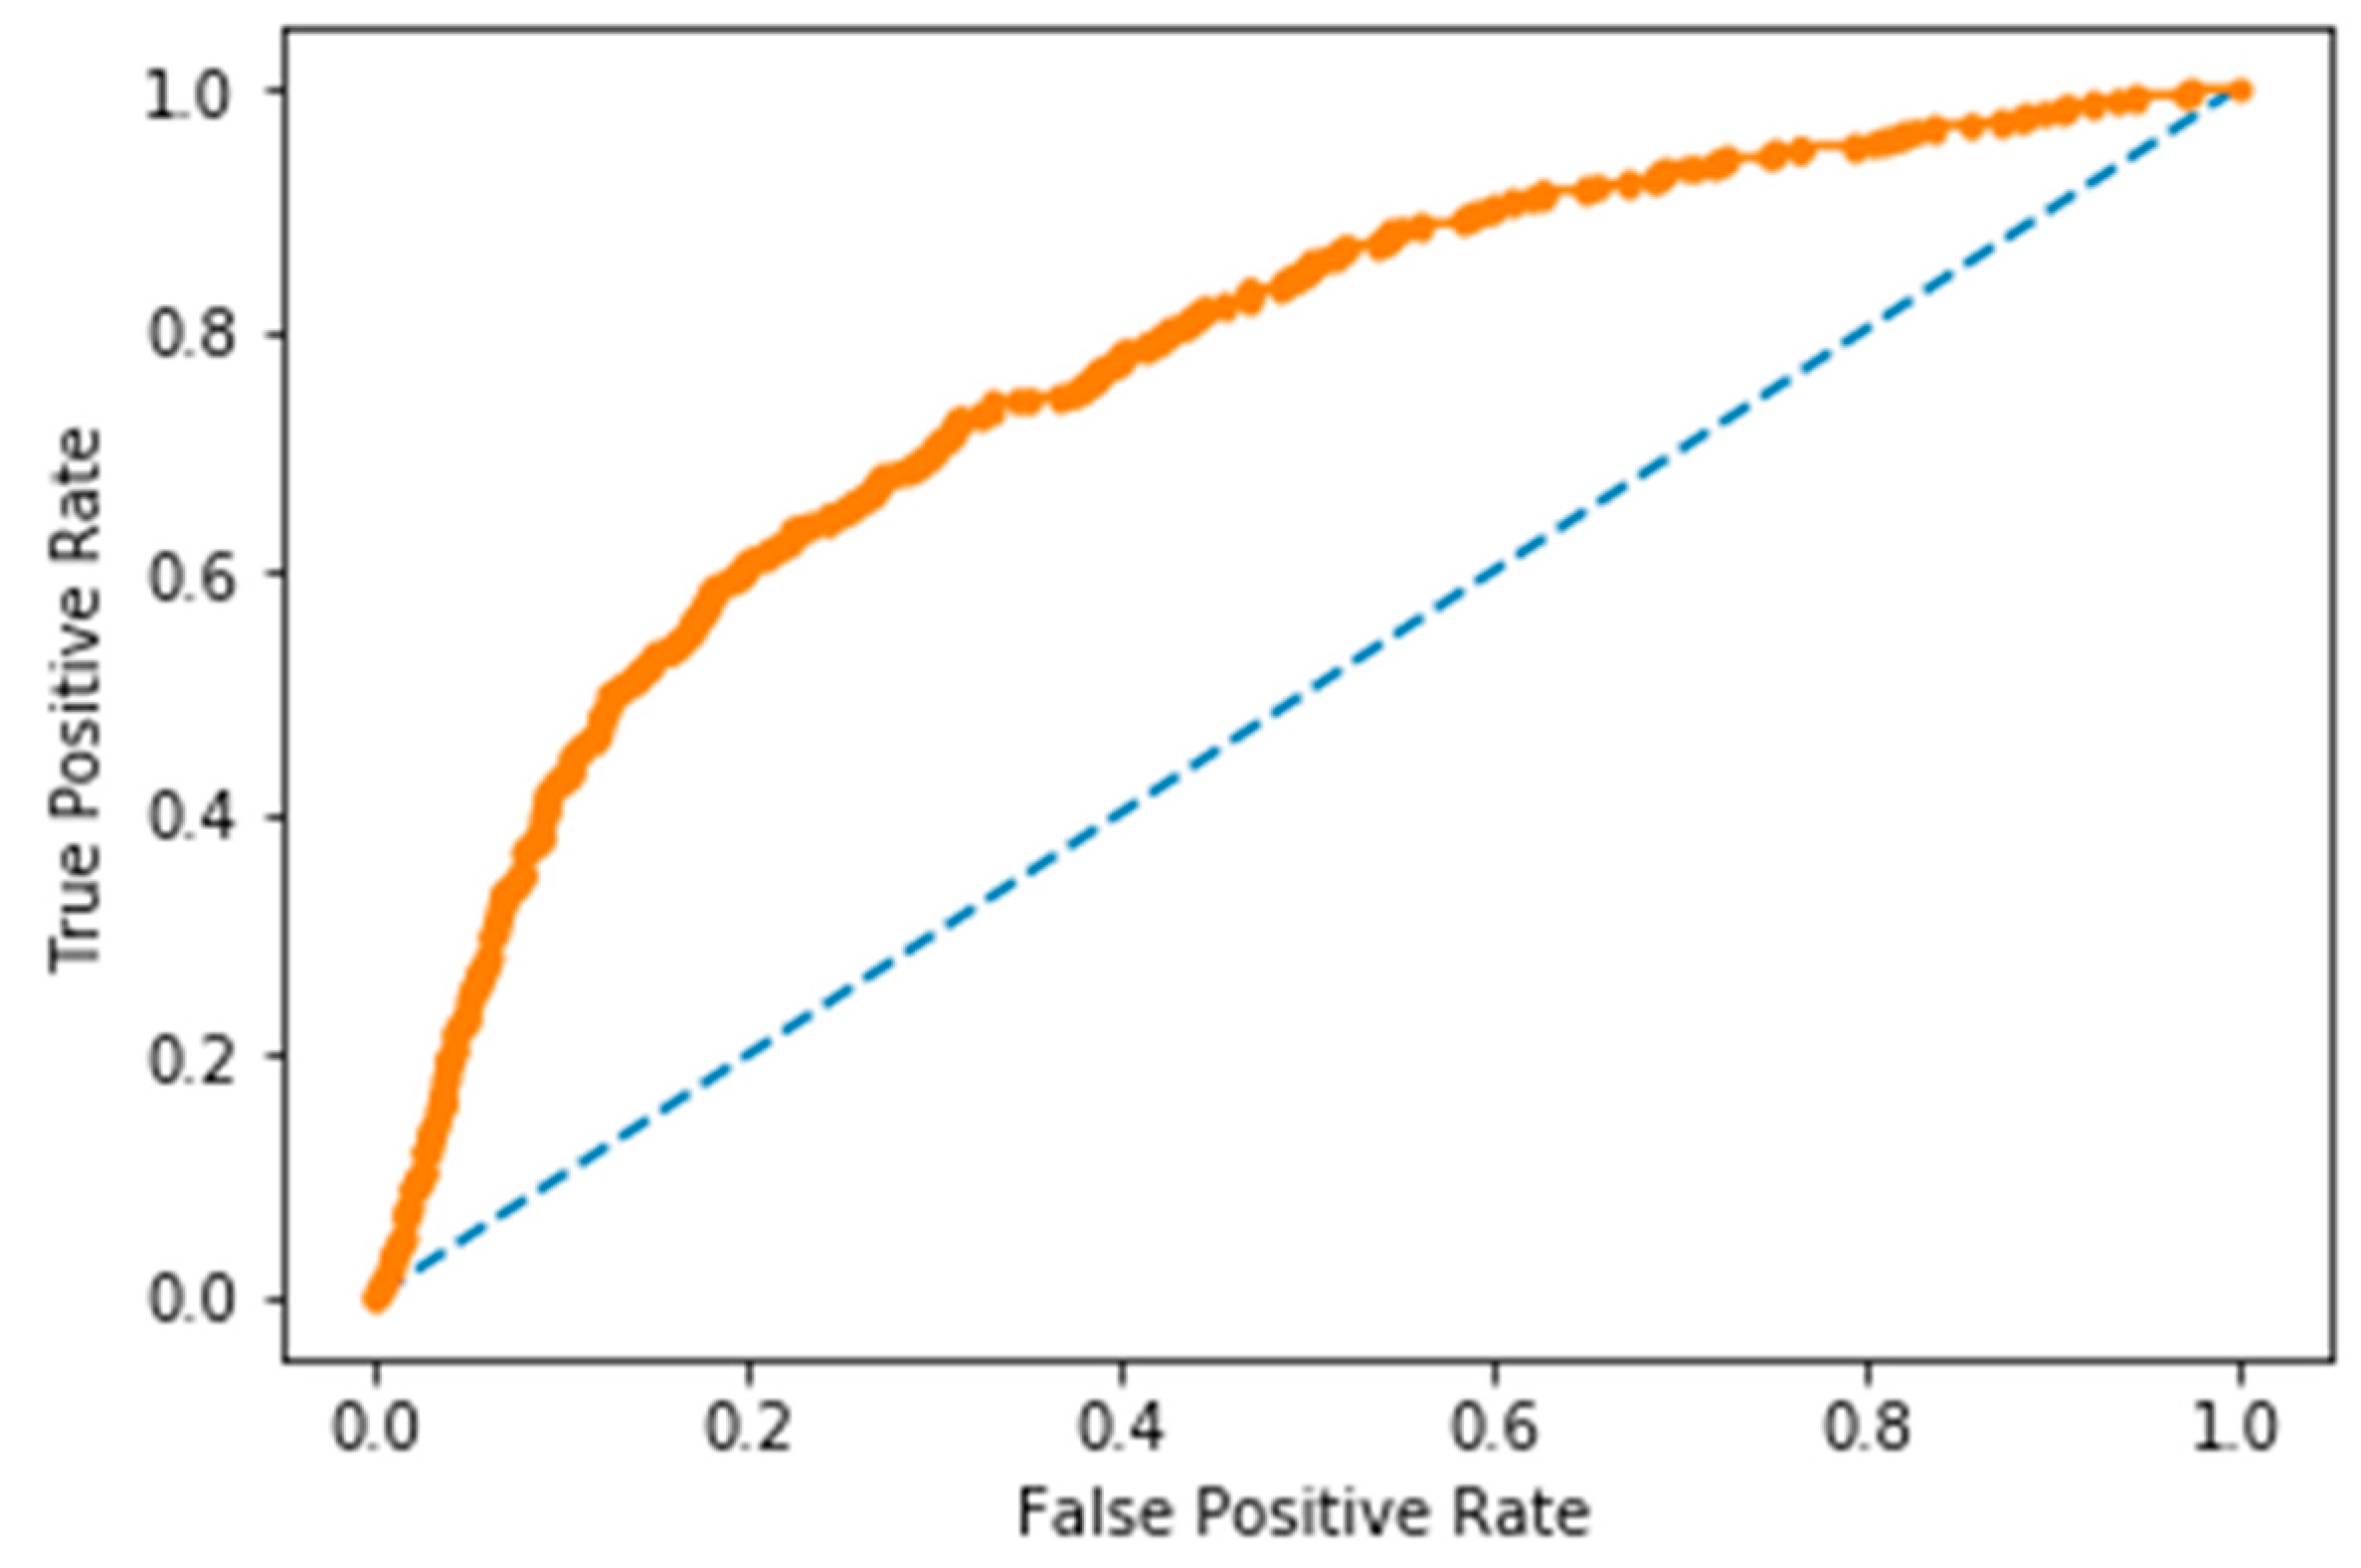
4. Result and Discussion
5. Conclusions and Future Work
Author Contributions
Funding
Conflicts of Interest
References
- Zhang, Y.; Niu, J. Shifting gears in osteoarthritis research towards symptomatic osteoarthritis. Arthritis Rheumatol. 2016, 68, 1797. [Google Scholar] [CrossRef]
- Ezzat, A.M.; Li, L.C. Occupational physical loading tasks and knee osteoarthritis: A review of the evidence. Physiother. Can. 2014, 66, 91–107. [Google Scholar] [CrossRef] [PubMed]
- World Health Organization. Available online: http://www.int/chp/topics/rheumatic/en/ (accessed on 5 February 2016).
- Kang, K.; Shin, J.S.; Lee, J.; Lee, Y.J.; Kim, M.R.; Park, K.B.; Ha, I.H. Association between direct and indirect smoking and osteoarthritis prevalence in Koreans: A cross-sectional study. BMJ Open 2016, 6, e010062. [Google Scholar] [CrossRef] [PubMed]
- Litwic, A.; Edwards, M.H.; Dennison, E.M.; Cooper, C. Epidemiology and burden of osteoarthritis. Br. Med. Bull. 2013, 105, 185–199. [Google Scholar] [CrossRef] [PubMed]
- Blagojevic, M.; Jinks, C.; Jeffery, A.; Jordan, I. Risk factors for onset of osteoarthritis of the knee in older adults: A systematic review and meta-analysis. Osteoarthr. Cartil. 2010, 18, 24–33. [Google Scholar] [CrossRef]
- Seok, H.; Choi, S.J.; Yoon, J.H.; Song, G.G.; Won, J.U.; Kim, J.H.; Jung, J.H. The association between osteoarthritis and occupational clusters in the Korean population: A nationwide study. PLoS ONE 2017, 12, e0170229. [Google Scholar] [CrossRef] [PubMed]
- Byeon, H. The risk factors of laryngeal pathology in Korean adults using a decision tree model. J. Voice 2015, 29, 59–64. [Google Scholar] [CrossRef] [PubMed]
- Chae, S.; Kwon, S.; Lee, D. Predicting infectious disease using deep learning and big data. Int. J. Environ. Res. Public Health 2018, 15, 1596. [Google Scholar] [CrossRef] [PubMed]
- Ravì, D.; Wong, C.; Deligianni, F.; Berthelot, M.; Andreu-Perez, J.; Lo, B.; Yang, G.Z. Deep learning for health informatics. IEEE J. Biomed. Health Inform. 2017, 21, 4–21. [Google Scholar] [CrossRef]
- Litjens, G.; Kooi, T.; Bejnordi, B.E.; Setio, A.A.A.; Ciompi, F.; Ghafoorian, M.; Sánchez, C.I. A survey on deep learning in medical image analysis. Med. Image Anal. 2017, 42, 60–88. [Google Scholar] [CrossRef] [Green Version]
- Andreu-Perez, J.; Poon, C.C.; Merrifield, R.D.; Wong, S.T.; Yang, G.Z. Big data for health. IEEE J. Biomed. Health Inform. 2015, 19, 1193–1208. [Google Scholar] [CrossRef]
- Grotle, M.; Hagen, K.B.; Natvig, B.; Dahl, F.A.; Kvien, T.K. Obesity and osteoarthritis in knee, hip and/or hand: An epidemiological study in the general population with 10 years follow-up. BMC Musculoskelet. Disord. 2008, 9, 132. [Google Scholar] [CrossRef] [PubMed]
- De Klerk, B.M.; Schiphof, D.; Groeneveld, F.P.; Koes, B.W.; van Osch, G.J.M.; van Meurs, J.B.; Bierma-Zeinstra, S.M. No clear association between female hormonal aspects and osteoarthritis of the hand, hip and knee: A systematic review. Rheumatology 2009, 48, 1160–1165. [Google Scholar] [CrossRef] [PubMed]
- Riddle, D.L.; Kong, X.; Fitzgerald, G.K. Psychological health impact on 2-year changes in pain and function in persons with knee pain: Data from the osteoarthritis initiative. Osteoarthr. Cartil. 2011, 19, 1095–1101. [Google Scholar] [CrossRef] [PubMed]
- Ma, X.; Dai, Z.; He, Z.; Ma, J.; Wang, Y.; Wang, Y. Learning traffic as images: A deep convolutional neural network for large-scale transportation network speed prediction. Sensors 2017, 17, 818. [Google Scholar] [CrossRef]
- Izadpanahkakhk, M.; Razavi, S.M.; Taghipour-Gorjikolaie, M.; Zahiri, S.H.; Uncini, A.; Taghipour-Gorjikolaie, M.; Zahiri, S.; Uncini, A. Deep region of interest and feature extraction models for palmprint verification using convolutional neural networks transfer learning. Appl. Sci. 2018, 8, 1210. [Google Scholar] [CrossRef]
- Xu, K.; Feng, D.; Mi, H. Deep convolutional neural network-based early automated detection of diabetic retinopathy using fundus image. Molecules 2017, 22, 2054. [Google Scholar] [CrossRef] [PubMed]
- Steven Eyobu, O.; Han, D.S. Feature representation and data augmentation for human activity classification based on wearable imu sensor data using a deep lstm neural network. Sensors 2018, 18, 2892. [Google Scholar] [CrossRef] [PubMed]
- Jing, L.; Wang, T.; Zhao, M.; Wang, P. An adaptive multi-sensor data fusion method based on deep convolutional neural networks for fault diagnosis of planetary gearbox. Sensors 2017, 17, 414. [Google Scholar] [CrossRef] [PubMed]
- Shaikhina, T.; Lowe, D.; Daga, S.; Briggs, D.; Higgins, R.; Khovanova, N. Machine learning for predictive modelling based on small data in biomedical engineering. IFAC–PapersOnLine 2015, 48, 469–474. [Google Scholar] [CrossRef]
- Khovanova, N.A.; Shaikhina, T.; Mallick, K.K. Neural networks for analysis of trabecular bone in osteoarthritis. Bioinspired Biomim. Nanobiomater. 2015, 4, 90–100. [Google Scholar] [CrossRef] [Green Version]
- Antony, J.; McGuinness, K.; O’Connor, N.E.; Moran, K. Quantifying radiographic knee osteoarthritis severity using deep convolutional neural networks. In Proceedings of the 23rd International Conference on Pattern Recognition (ICPR), Cancun, Mexico, 4–8 December 2016; pp. 1195–1200. [Google Scholar]
- Kobashi, S.; Hossain, B.; Nii, M.; Kambara, S.; Morooka, T.; Okuno, M.; Yoshiya, S. Prediction of post-operative implanted knee function using machine learning in clinical big data. In Proceedings of the International Conference on Machine Learning and Cybernetics (ICMLC), Jeju, Korea, 10–13 July 2016; pp. 195–200. [Google Scholar]
- Ashinsky, B.G.; Bouhrara, M.; Coletta, C.E.; Lehallier, B.; Urish, K.L.; Lin, P.C.; Goldberg, I.G.; Spencer, R.G. Predicting early symptomatic osteoarthritis in the human knee using machine learning classification of magnetic resonance images from the osteoarthritis initiative. J. Orthop. Res. 2017, 35, 2243–2250. [Google Scholar] [CrossRef] [PubMed]
- Lazzarini, N.; Runhaar, J.; Bay-Jensen, A.C.; Thudium, C.S.; Bierma-Zeinstra, S.M.A.; Henrotin, Y.; Bacardit, J. A machine learning approach for the identification of new biomarkers for knee osteoarthritis development in overweight and obese women. Osteoarthr. Cartil. 2017, 25, 2014–2021. [Google Scholar] [CrossRef] [PubMed]
- Xue, Y.; Zhang, R.; Deng, Y.; Chen, K.; Jiang, T. A preliminary examination of the diagnostic value of deep learning in hip osteoarthritis. PLoS ONE 2017, 12, e0178992. [Google Scholar] [CrossRef]
- Tiulpin, A.; Thevenot, J.; Rahtu, E.; Lehenkari, P.; Saarakkala, S. Automatic knee osteoarthritis diagnosis from plain radiographs: A deep learning-based approach. Sci. Rep. 2018, 8, 1727. [Google Scholar] [CrossRef] [PubMed]
- Du, Y.; Almajalid, R.; Shan, J.; Zhang, M. A novel method to predict knee osteoarthritis progression on MRI using machine learning methods. IEEE Trans. Nanobiosci. 2018, 17, 228–236. [Google Scholar] [CrossRef] [PubMed]
- Brahim, A.; Jennane, R.; Riad, R.; Janvier, T.; Khedher, L.; Toumi, H.; Lespessailles, E. A decision support tool for early detection of knee osteoarthritis using x-ray imaging and machine learning: Data from the osteoarthritis initiative. Comput. Med. Imaging Graph. 2019, 73, 11–18. [Google Scholar] [CrossRef]
- Shlens, J. A tutorial on principal component analysis. arXiv, 2014; arXiv:1404.1100. [Google Scholar]
- He, K.; Kaiming, H.; Xiangyu, Z.; Shaoqing, R.; Jian, S. Delving deep into rectifiers: Surpassing human-level performance on imagenet classification. In Proceedings of the IEEE International Conference on Computer Vision (ICCV) Internet, Santiago, Chile, 7–13 December 2015; Available online: http://0-dx-doi-org.brum.beds.ac.uk/10.1109/iccv.2015.123 (accessed on 18 February 2016).
- Srivastava, N.; Hinton, G.; Krizhevsky, A.; Sutskever, I.; Salakhutdinov, R. Dropout: A simple way to prevent neural networks from overfitting. J. Mach. Learn. Res. 2014, 15, 1929–1958. [Google Scholar]
- Kingma, D.P.; Ba, J. Adam: A method for stochastic optimization. arXiv, 2014; arXiv:1412.6980. [Google Scholar]
- Ioffe, S.; Szegedy, C. Batch normalization: Accelerating deep network training by reducing internal covariate shift. arXiv, 2015; arXiv:1502.03167. [Google Scholar]
- Chollet, F. Others: Keras 2015. Available online: https://github.com/fchollet/keras (accessed on 28 January 2019).
- Abadi, M.; Barham, P.; Chen, J.; Chen, Z.; Davis, A.; Dean, J.; Devin, M.; Ghemawat, S.; Irving, G.; Isard, M.; et al. TensorFlow: A system for large-scale machine learning. In Proceedings of the OSDI, Savannah, GA, USA, 2–4 November 2016; pp. 265–283. [Google Scholar]
- Kim, J.; Chu, C.-H. ETD: An extended time delay algorithm for ventricular fibrillation detection. In Proceedings of the 36th Annual International Conference of the IEEE Engineering in Medicine and Biology Society, Chicago, IL, USA, 26–30 August 2014; pp. 6479–6482. [Google Scholar]


| Confusion Matrix | Predicted (T) | Predicted (F) |
|---|---|---|
| Actual (T) | 270 | 135 |
| Actual (F) | 413 | 1137 |
| Feature | Correlation Coefficient | Feature | Correlation Coefficient |
|---|---|---|---|
| Year | −0.023309 | Angina | 0.058126 |
| Region | −0.017512 | Osteoporosis | 0.254714 |
| Sex | 0.261386 | Diabetic mellitus | 0.034071 |
| Age | 0.208991 | Alcohol | -0.160021 |
| Education | −0.24423 | Smoking | 0.190024 |
| Household income | −0.158579 | Physical activity | 0.073899 |
| Married | −0.008994 | BMI | 0.147746 |
| Health status | 0.215611 | BMI group | 0.14497 |
| Hypertension | 0.103292 | Obesity | 0.118041 |
| Dyslipidemia | 0.129874 | Chronic disease count | 0.209151 |
| Stroke | 0.029012 | Region category | −0.012289 |
| Myocardial infarction | 0.016415 | Income quartile | −0.182163 |
© 2019 by the authors. Licensee MDPI, Basel, Switzerland. This article is an open access article distributed under the terms and conditions of the Creative Commons Attribution (CC BY) license (http://creativecommons.org/licenses/by/4.0/).
Share and Cite
Lim, J.; Kim, J.; Cheon, S. A Deep Neural Network-Based Method for Early Detection of Osteoarthritis Using Statistical Data. Int. J. Environ. Res. Public Health 2019, 16, 1281. https://0-doi-org.brum.beds.ac.uk/10.3390/ijerph16071281
Lim J, Kim J, Cheon S. A Deep Neural Network-Based Method for Early Detection of Osteoarthritis Using Statistical Data. International Journal of Environmental Research and Public Health. 2019; 16(7):1281. https://0-doi-org.brum.beds.ac.uk/10.3390/ijerph16071281
Chicago/Turabian StyleLim, Jihye, Jungyoon Kim, and Songhee Cheon. 2019. "A Deep Neural Network-Based Method for Early Detection of Osteoarthritis Using Statistical Data" International Journal of Environmental Research and Public Health 16, no. 7: 1281. https://0-doi-org.brum.beds.ac.uk/10.3390/ijerph16071281