Study on the Livelihood Vulnerability and Compensation Standard of Employees in Relocation Enterprises: A Case of Chemical Enterprises in the Yangtze River Basin

Abstract
:1. Introduction
2. Research Framework
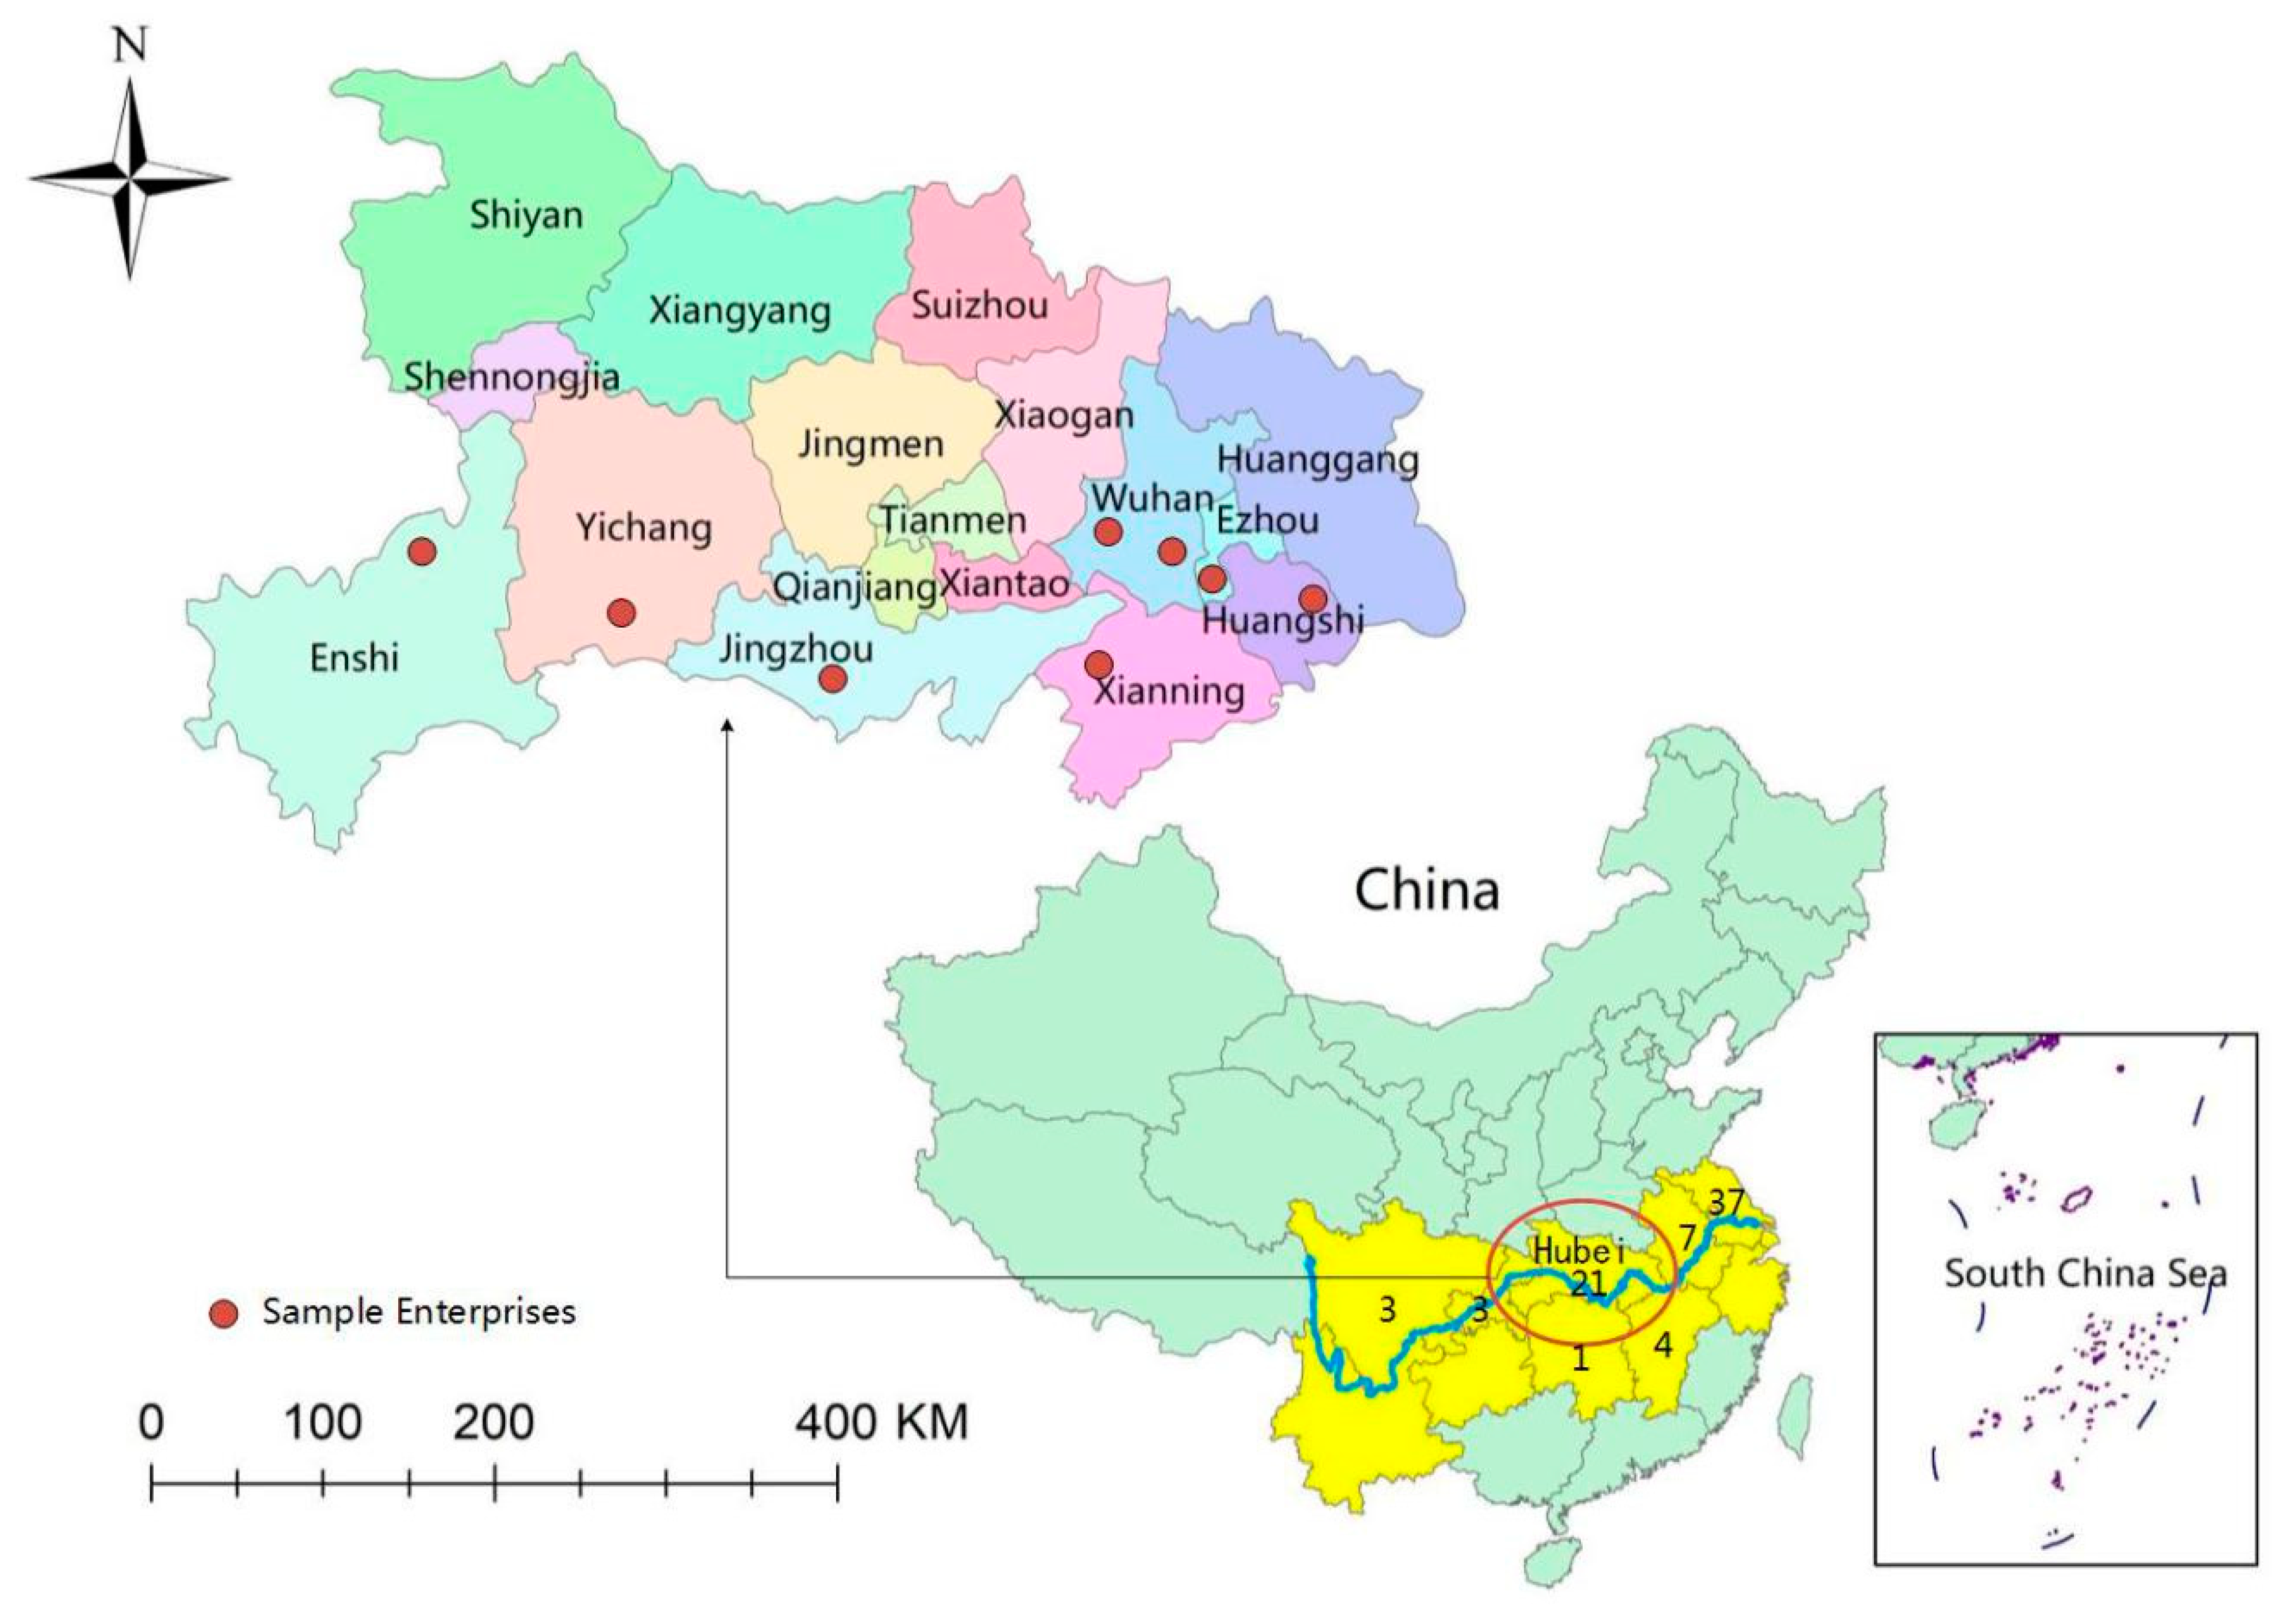
2.1. Research Area
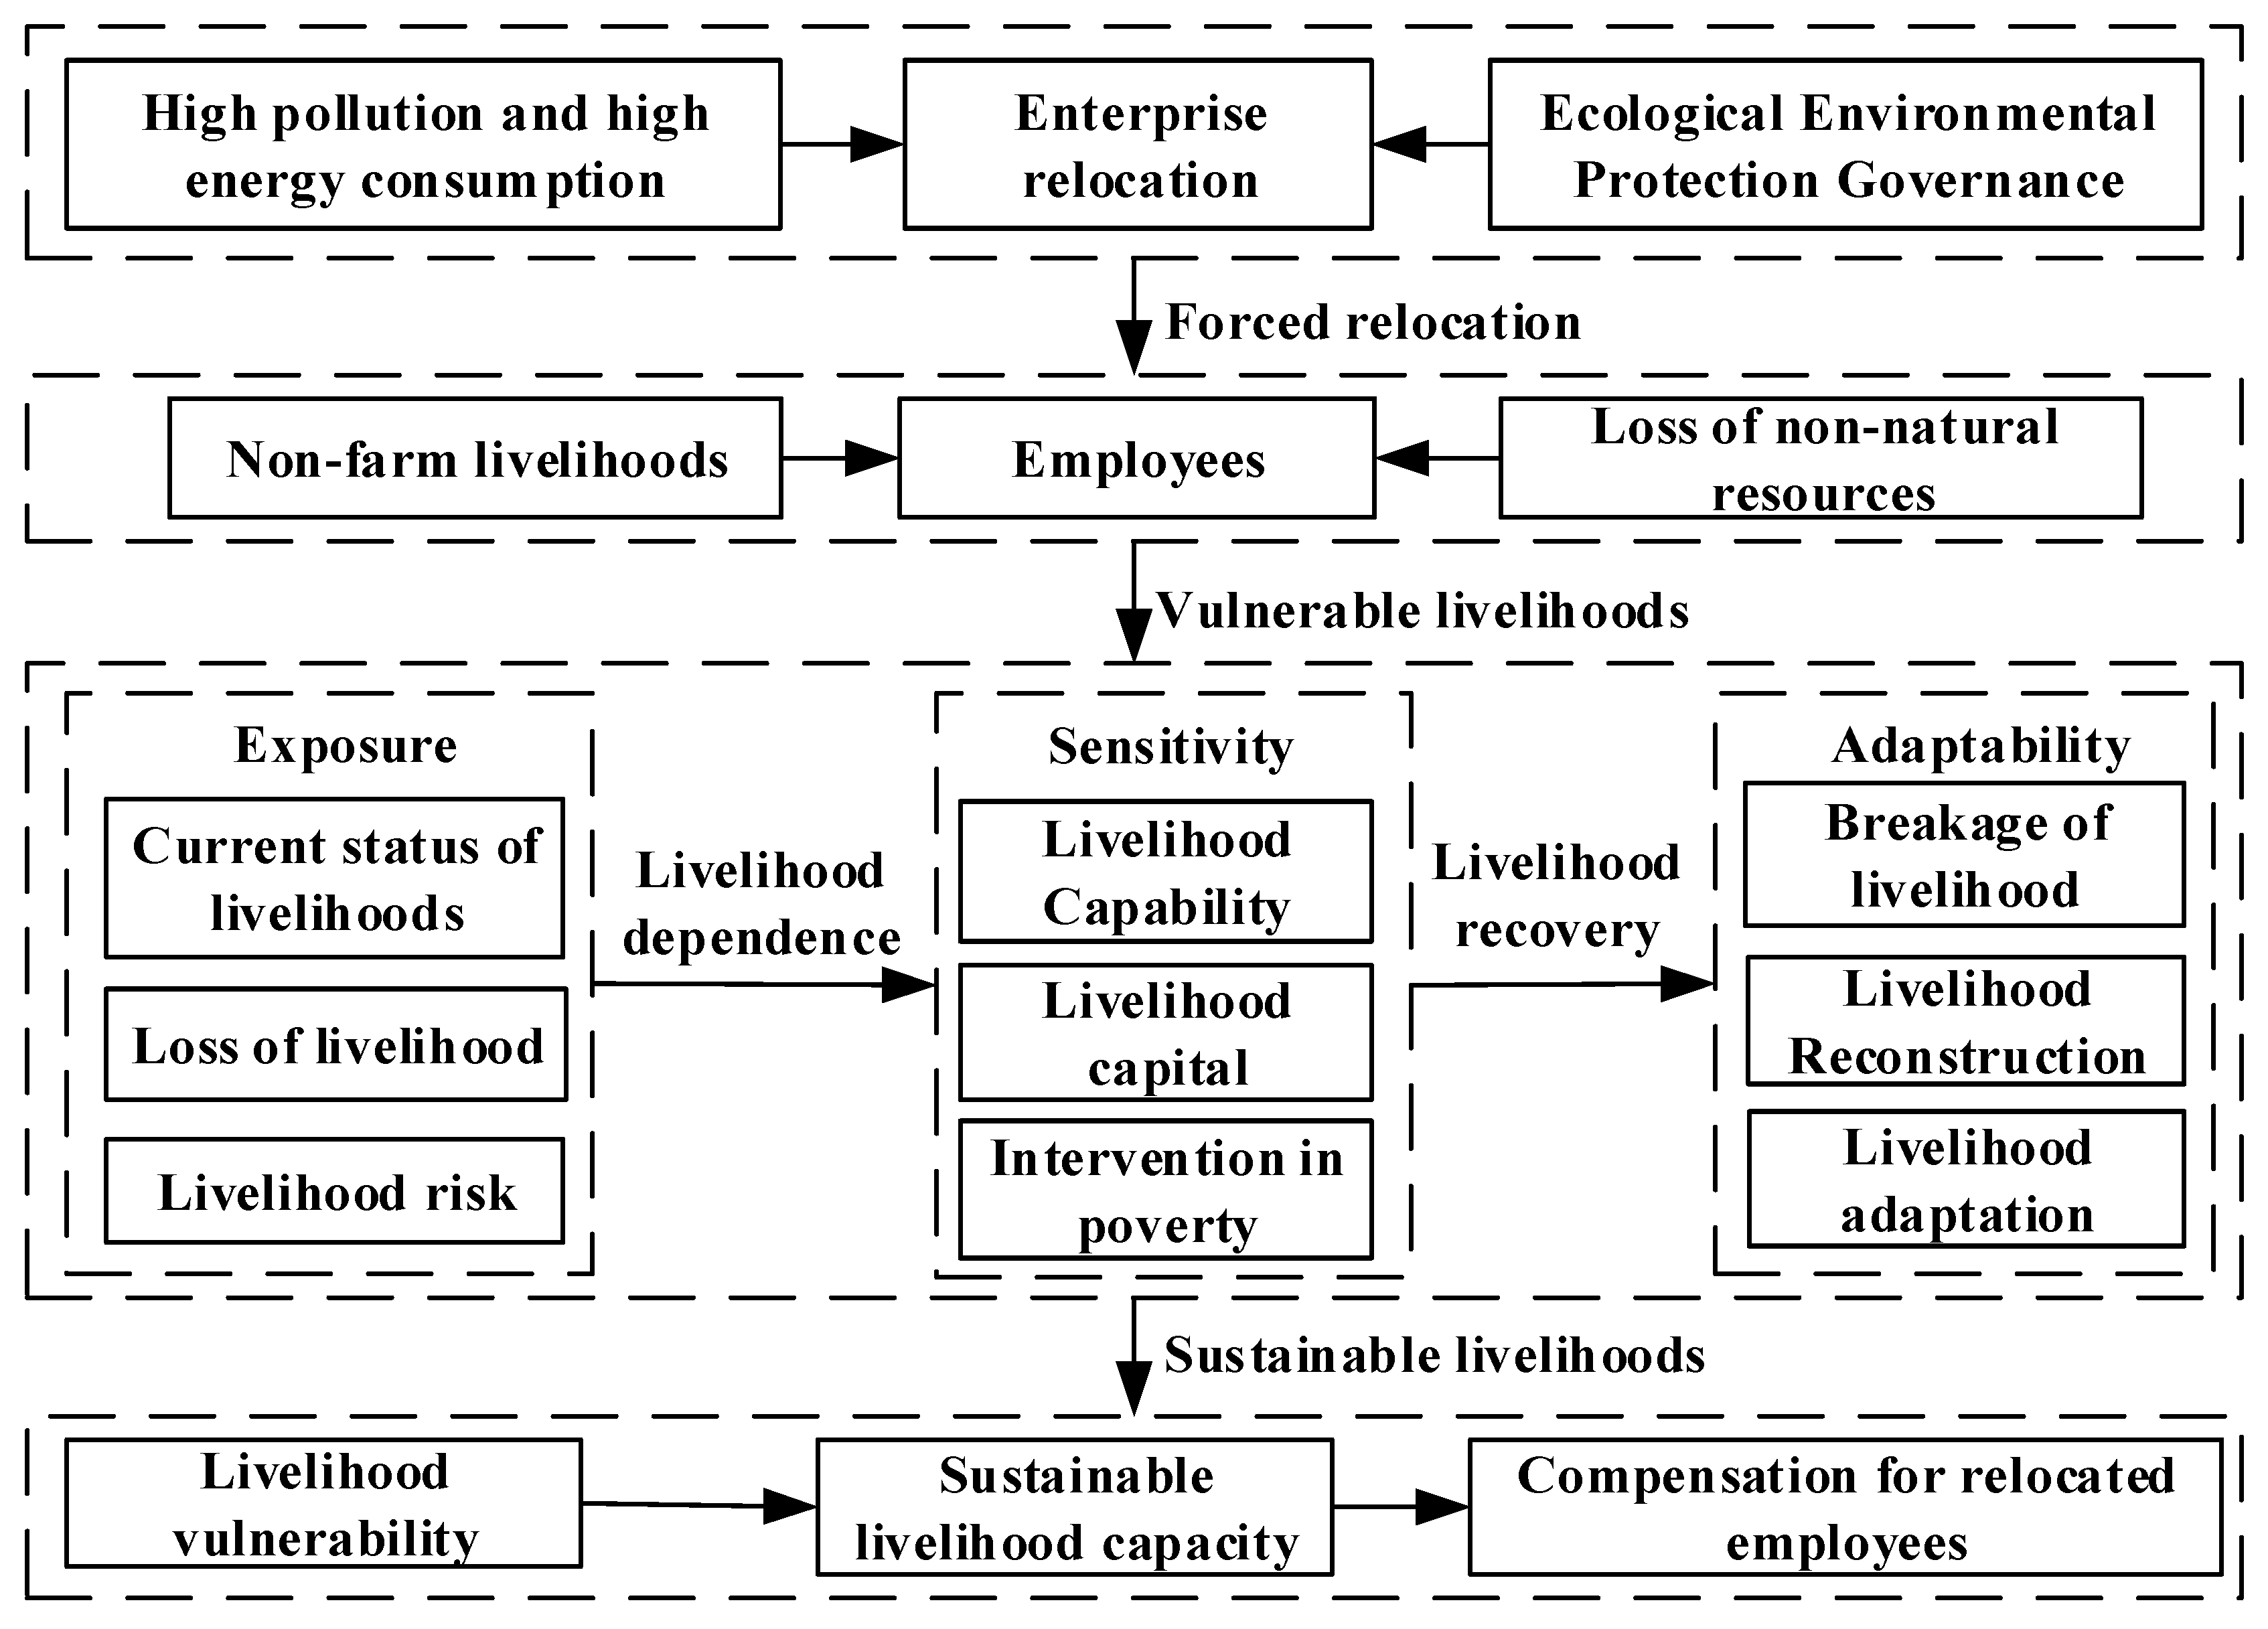
2.2. Research Framework
3. Method and Data Source
3.1. Livelihood Vulnerability Assessment
3.1.1. Framework for Livelihood Vulnerability Analysis
3.1.2. Evaluation Index System of Livelihood Vulnerability
3.1.3. Livelihood Vulnerability Assessment Model
3.2. Sustainable Livelihood Ability Assessment Model
3.3. Compensation Model for Relocated Employees
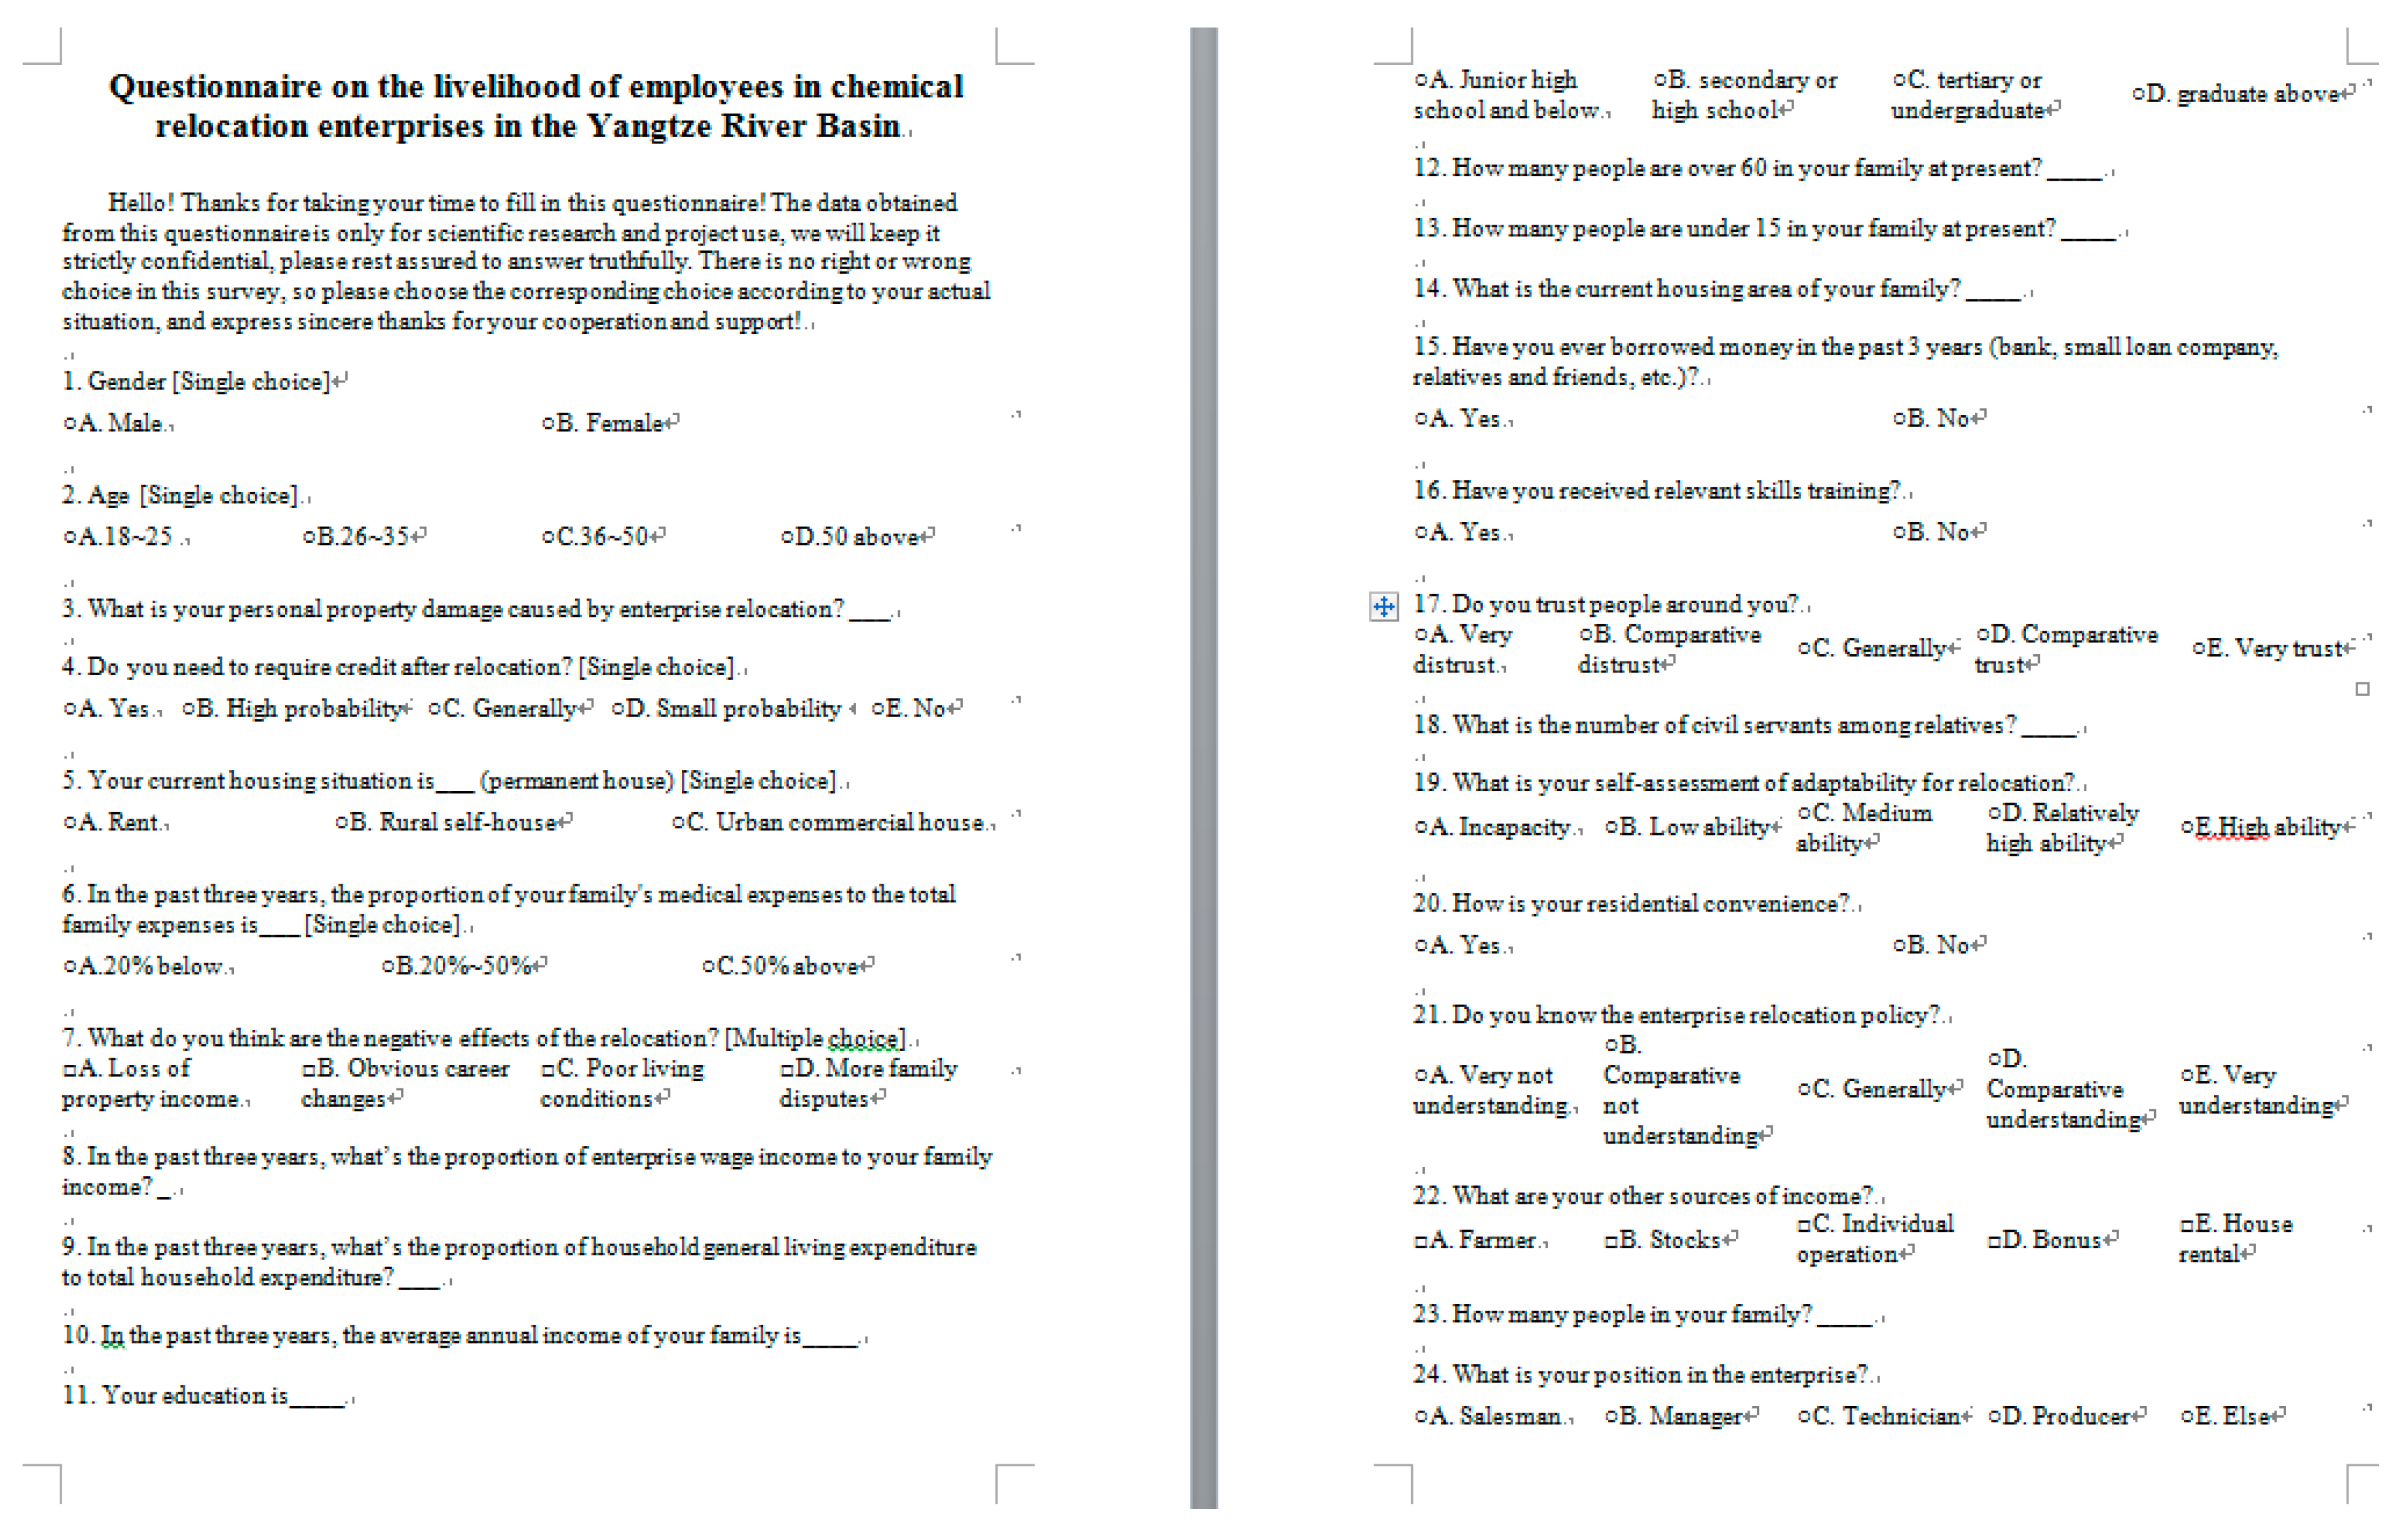
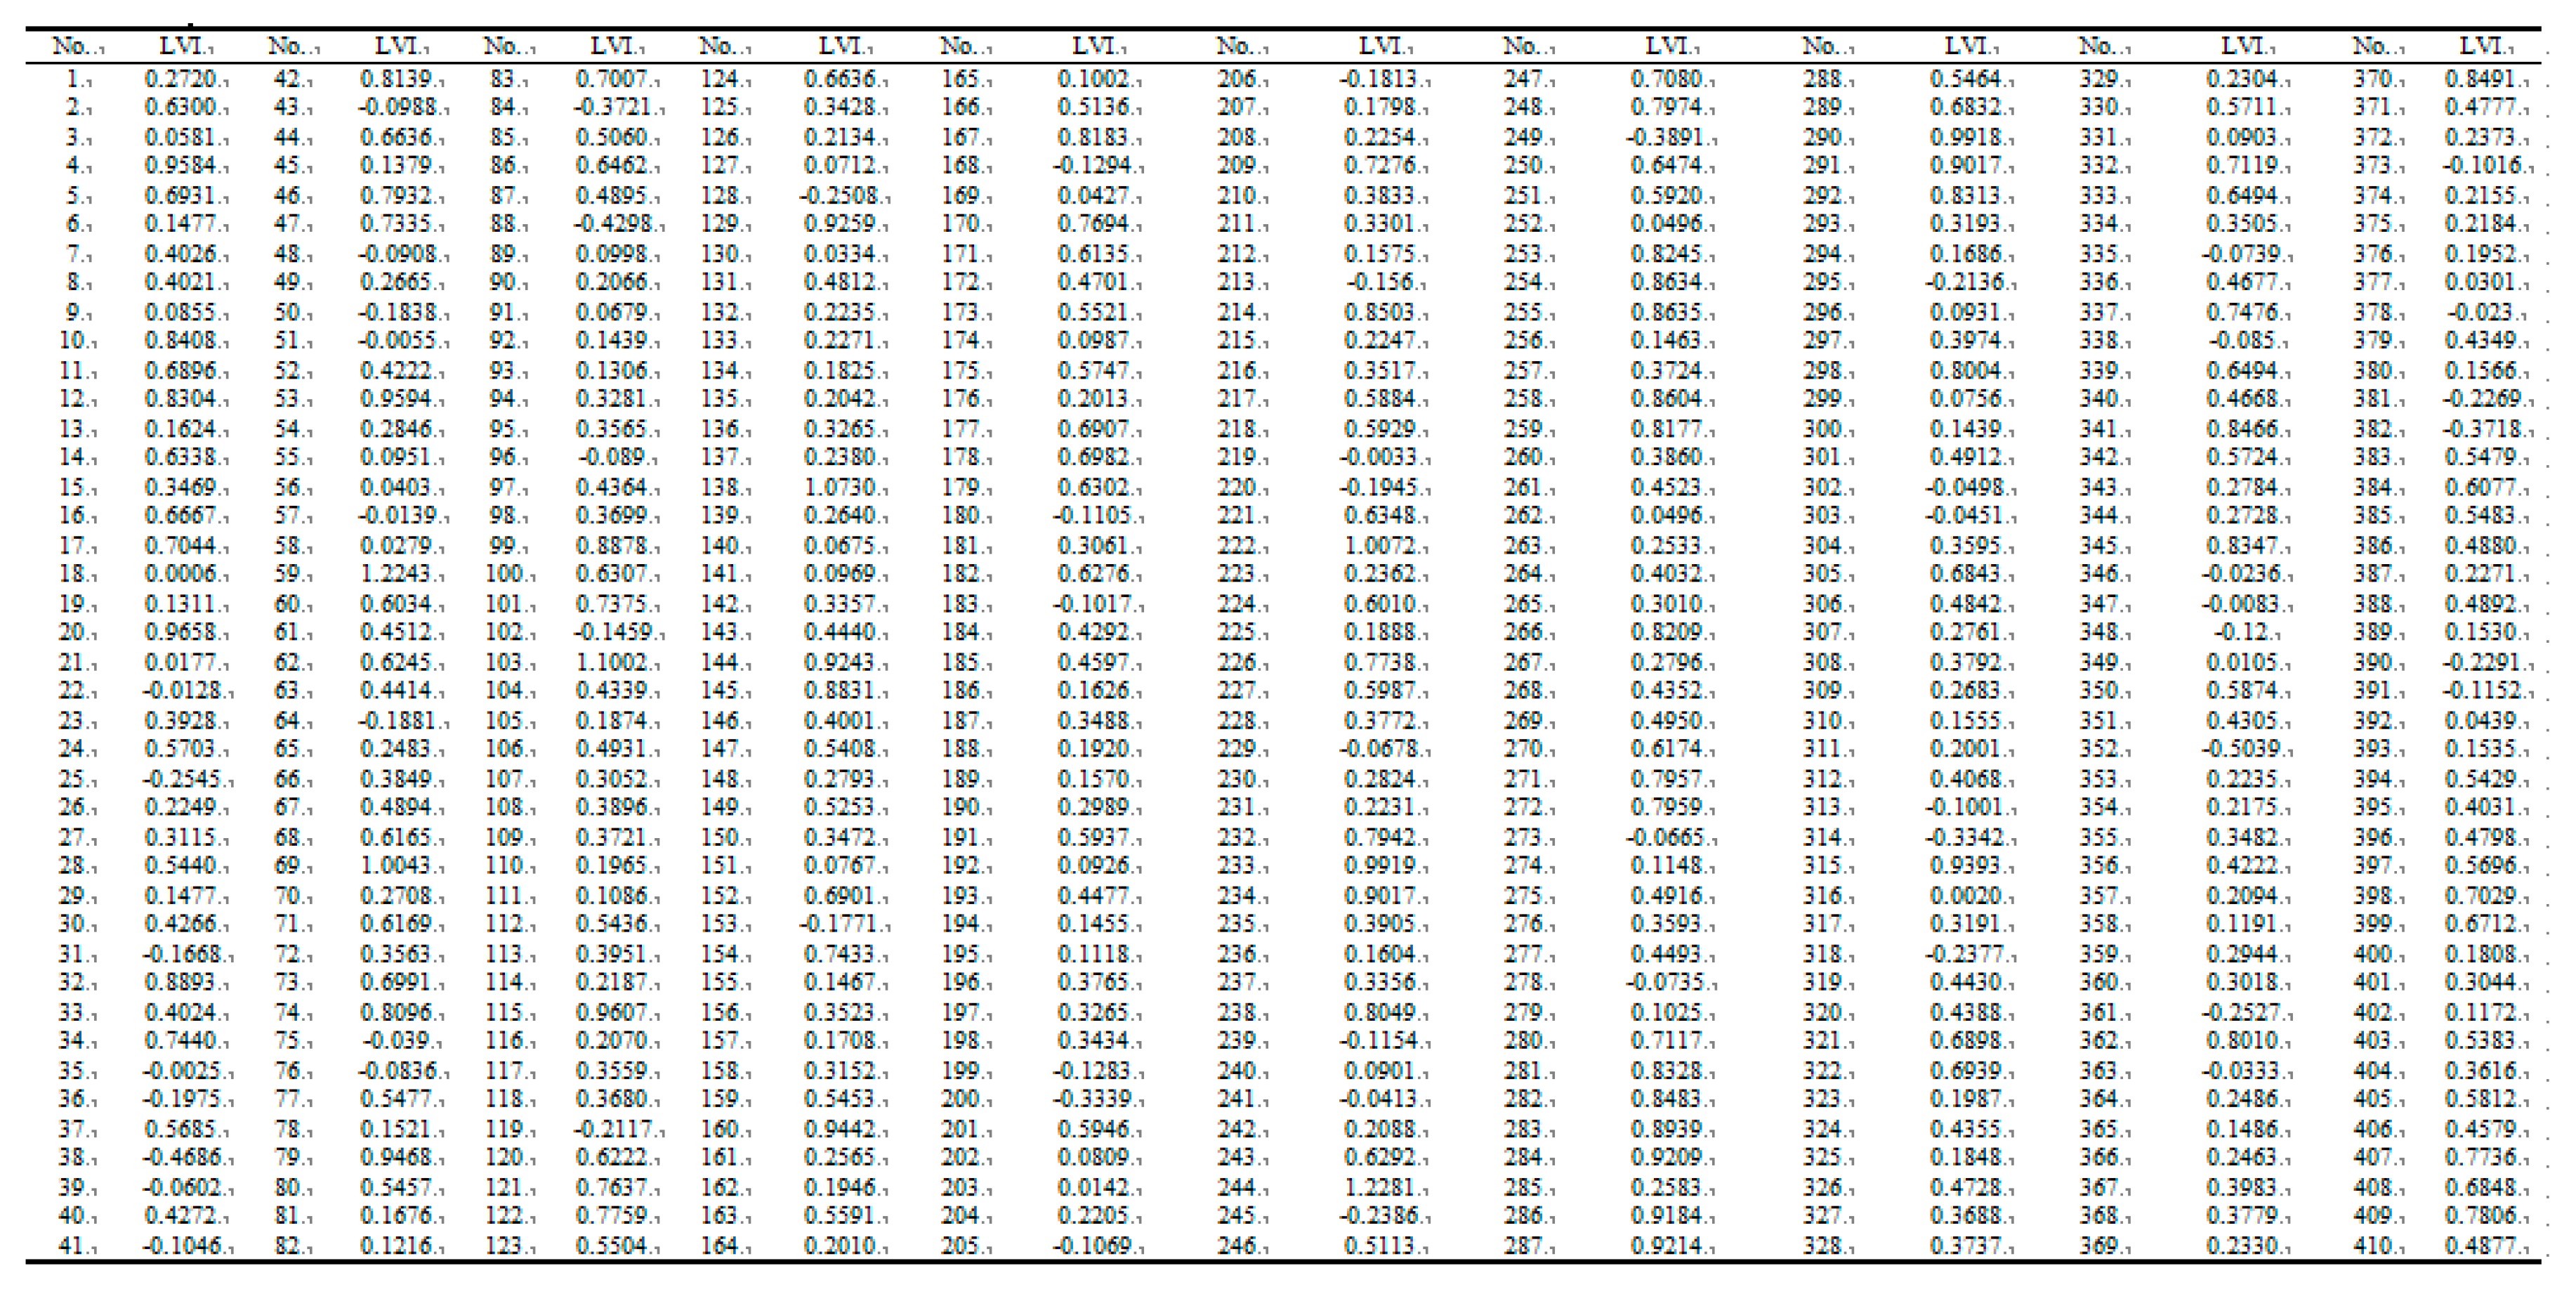
3.4. Data Source
4. Results
4.1. Descriptive Statistical Analysis
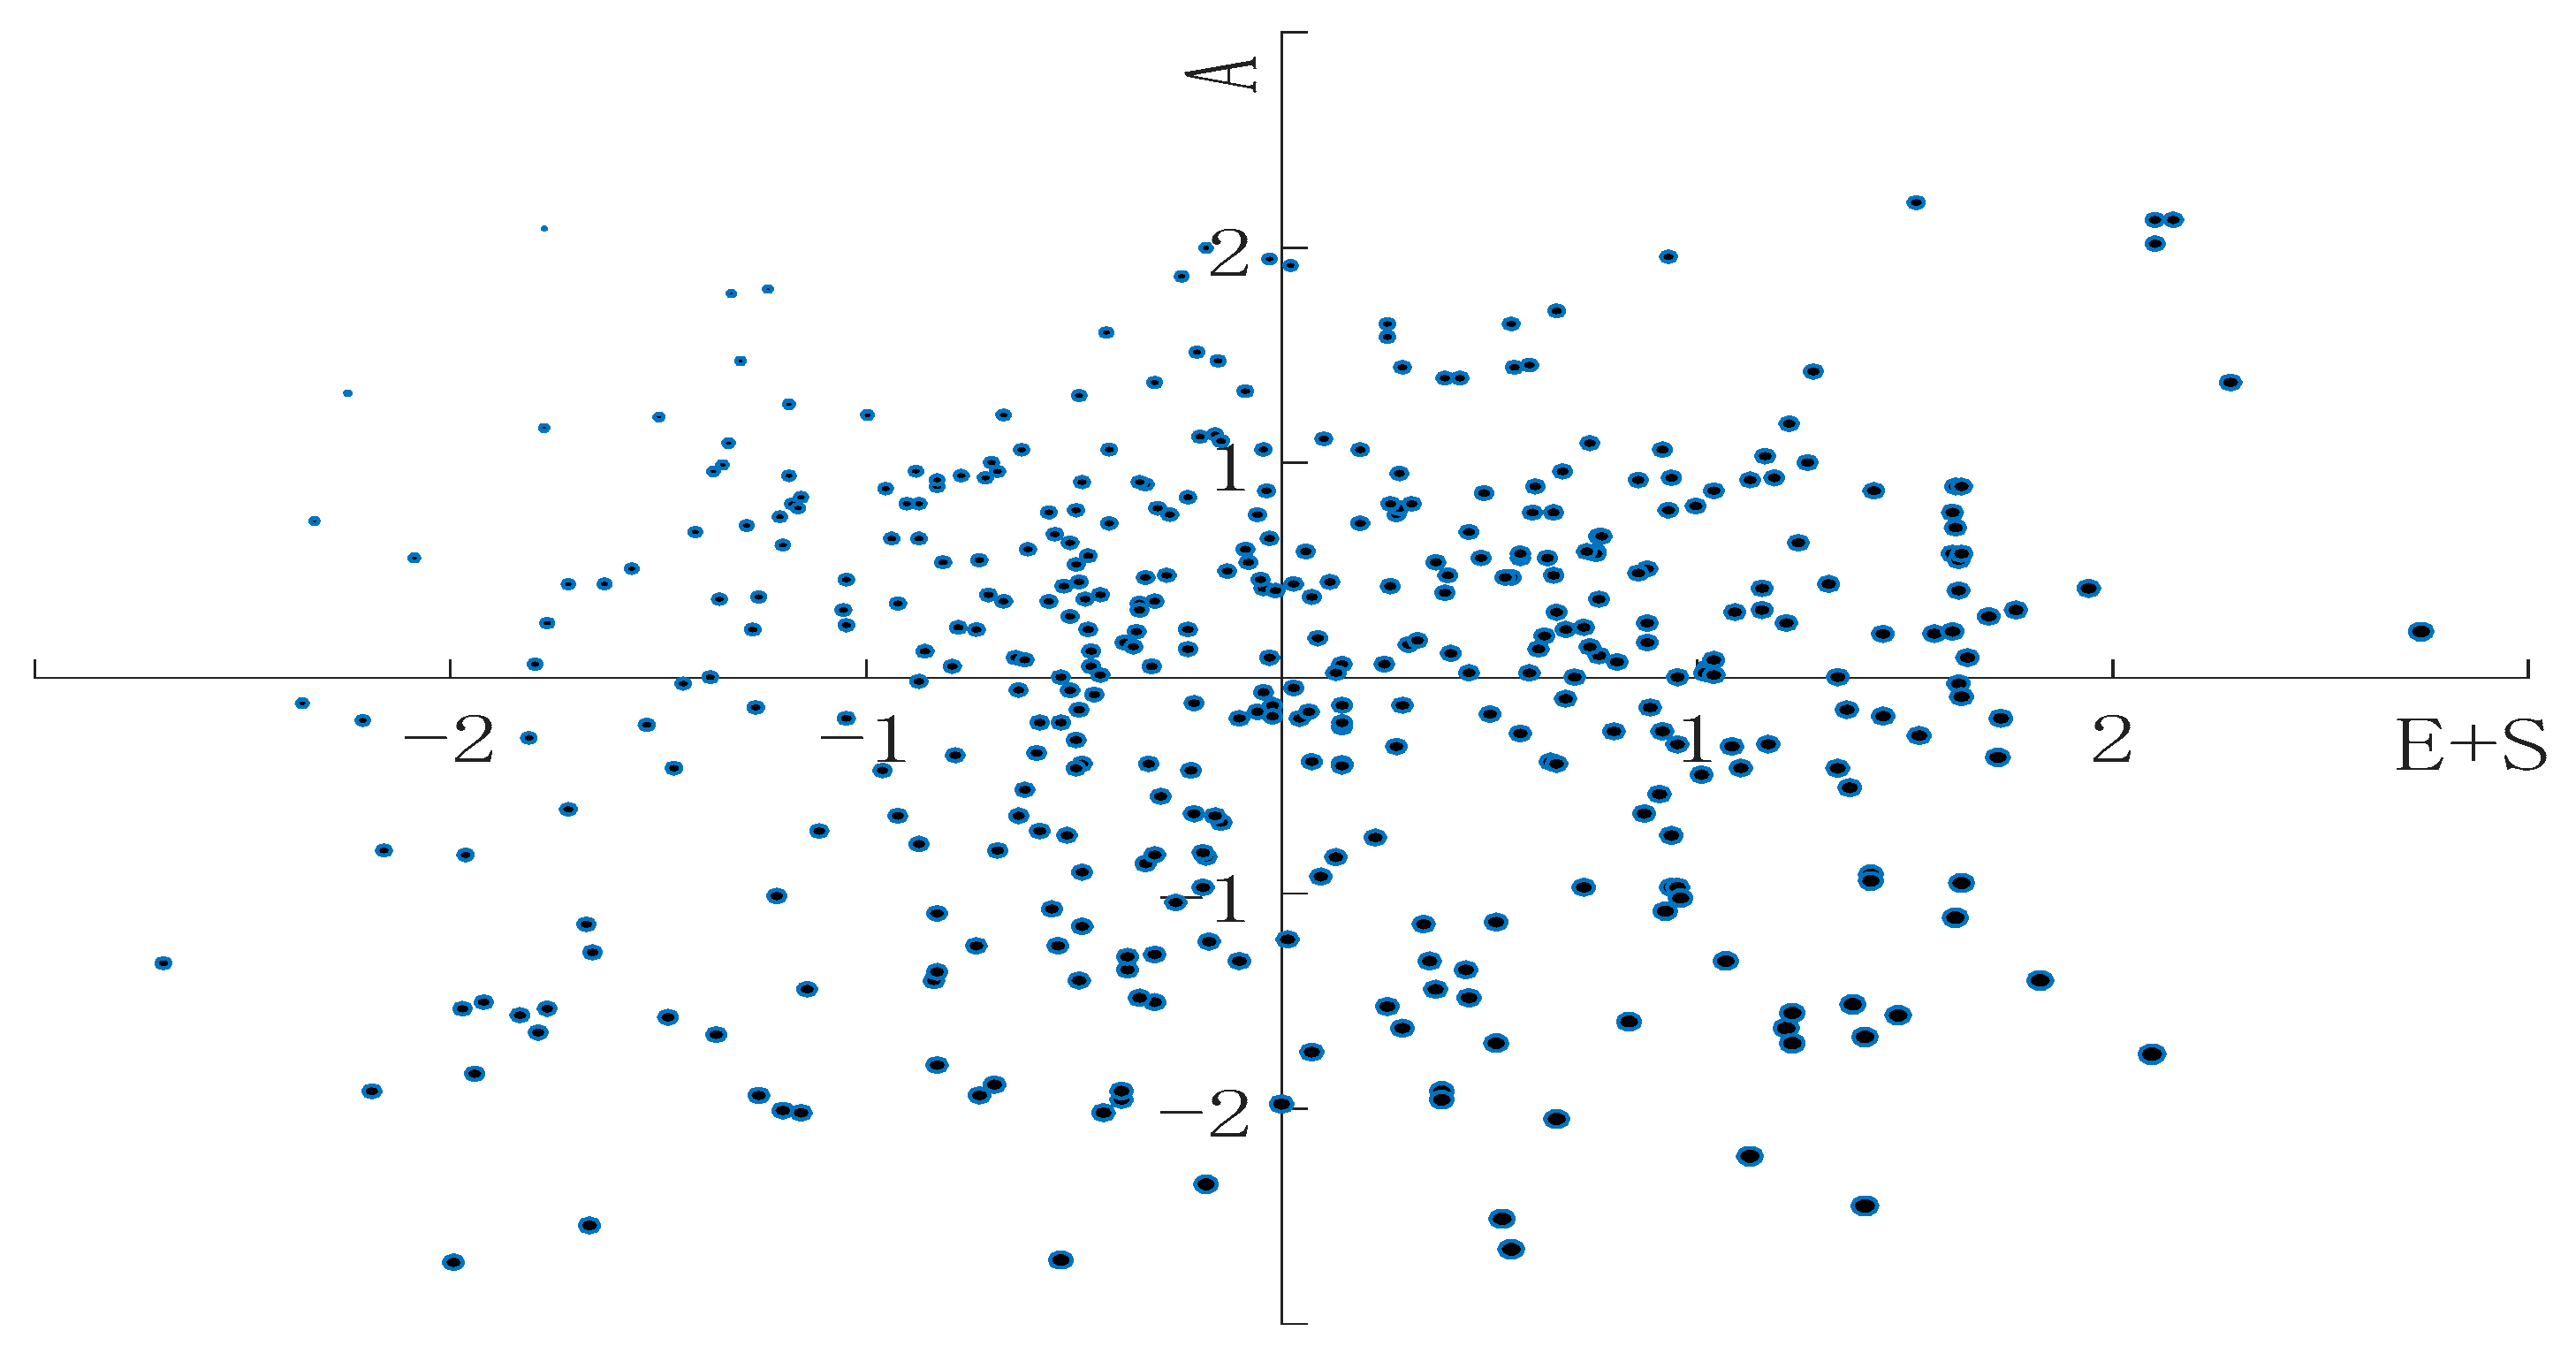
4.2. Analysis of Employees’ Livelihood Vulnerability
4.3. Influencing Factors of Employees’ Livelihood Vulnerability
4.4. Influencing Factors of Employees’ Sustainable Livelihood Ability
4.5. Case Study on Compensation Model of Relocated Employees
4.5.1. Determination of the Fixed Social Capital Compensation Standard
- (1)
- The cost saving from education (OC11): The functional value of relocated employees’ education can be replaced by the cost when the employees enter the talent market to apply for jobs again. According to the survey, every household will search for work every year for three days and enter the talent market three times [42]. The daily missed work fee is 100 CNY, the transportation fee is 30 CNY, and the admission fee of the talent market is 10 CNY each time, so the cost of job-hunting is 420 CNY/year. The sample shows that 49.52% of the interviewees are looking for jobs through the talent market, so the cost saving from education is 207.98 CNY/year;
- (2)
- The cost saving of social network (OC12): This includes the cost of technical training and the balance of human relationship income and expenditure. The cost of technical training can be replaced by training fees. According to the investigation, the minimum fee for skill training for urban employees is more than 600 CNY [43], so the annual fee for training here is 600 CNY. It is known that 24.88% of the surveyed employees obtain technology through social networks, so the cost of technical training saved by each household through social networks is 149.28 CNY every year. In order to maintain their own social network, employees of enterprises will spend a lot of money on some important events, such as marriage, childbirth, promotion of colleagues and passing exams. It will take a long time to balance the payments. Due to the relocation of enterprises and the separation of social networks and spaces, the long-term and balanced geographical relationship between the original closed and stable circle has been destroyed, meaning the important expenditure of enterprise employees cannot be paid back. In the past five years, the average annual personal expenses of the interviewed employees exceeded personal income by 1034 CNY.
4.5.2. Determination of the Variable Opportunity Cost Compensation Standard
5. Discussion
5.1. Employees’ Livelihood Vulnerability
5.2. Influencing Factors of Employees’ Livelihood Vulnerability
5.3. Compensation Model of Relocated Employees
5.4. Limitations
6. Conclusions and Suggestions
6.1. Conclusions
- (1)
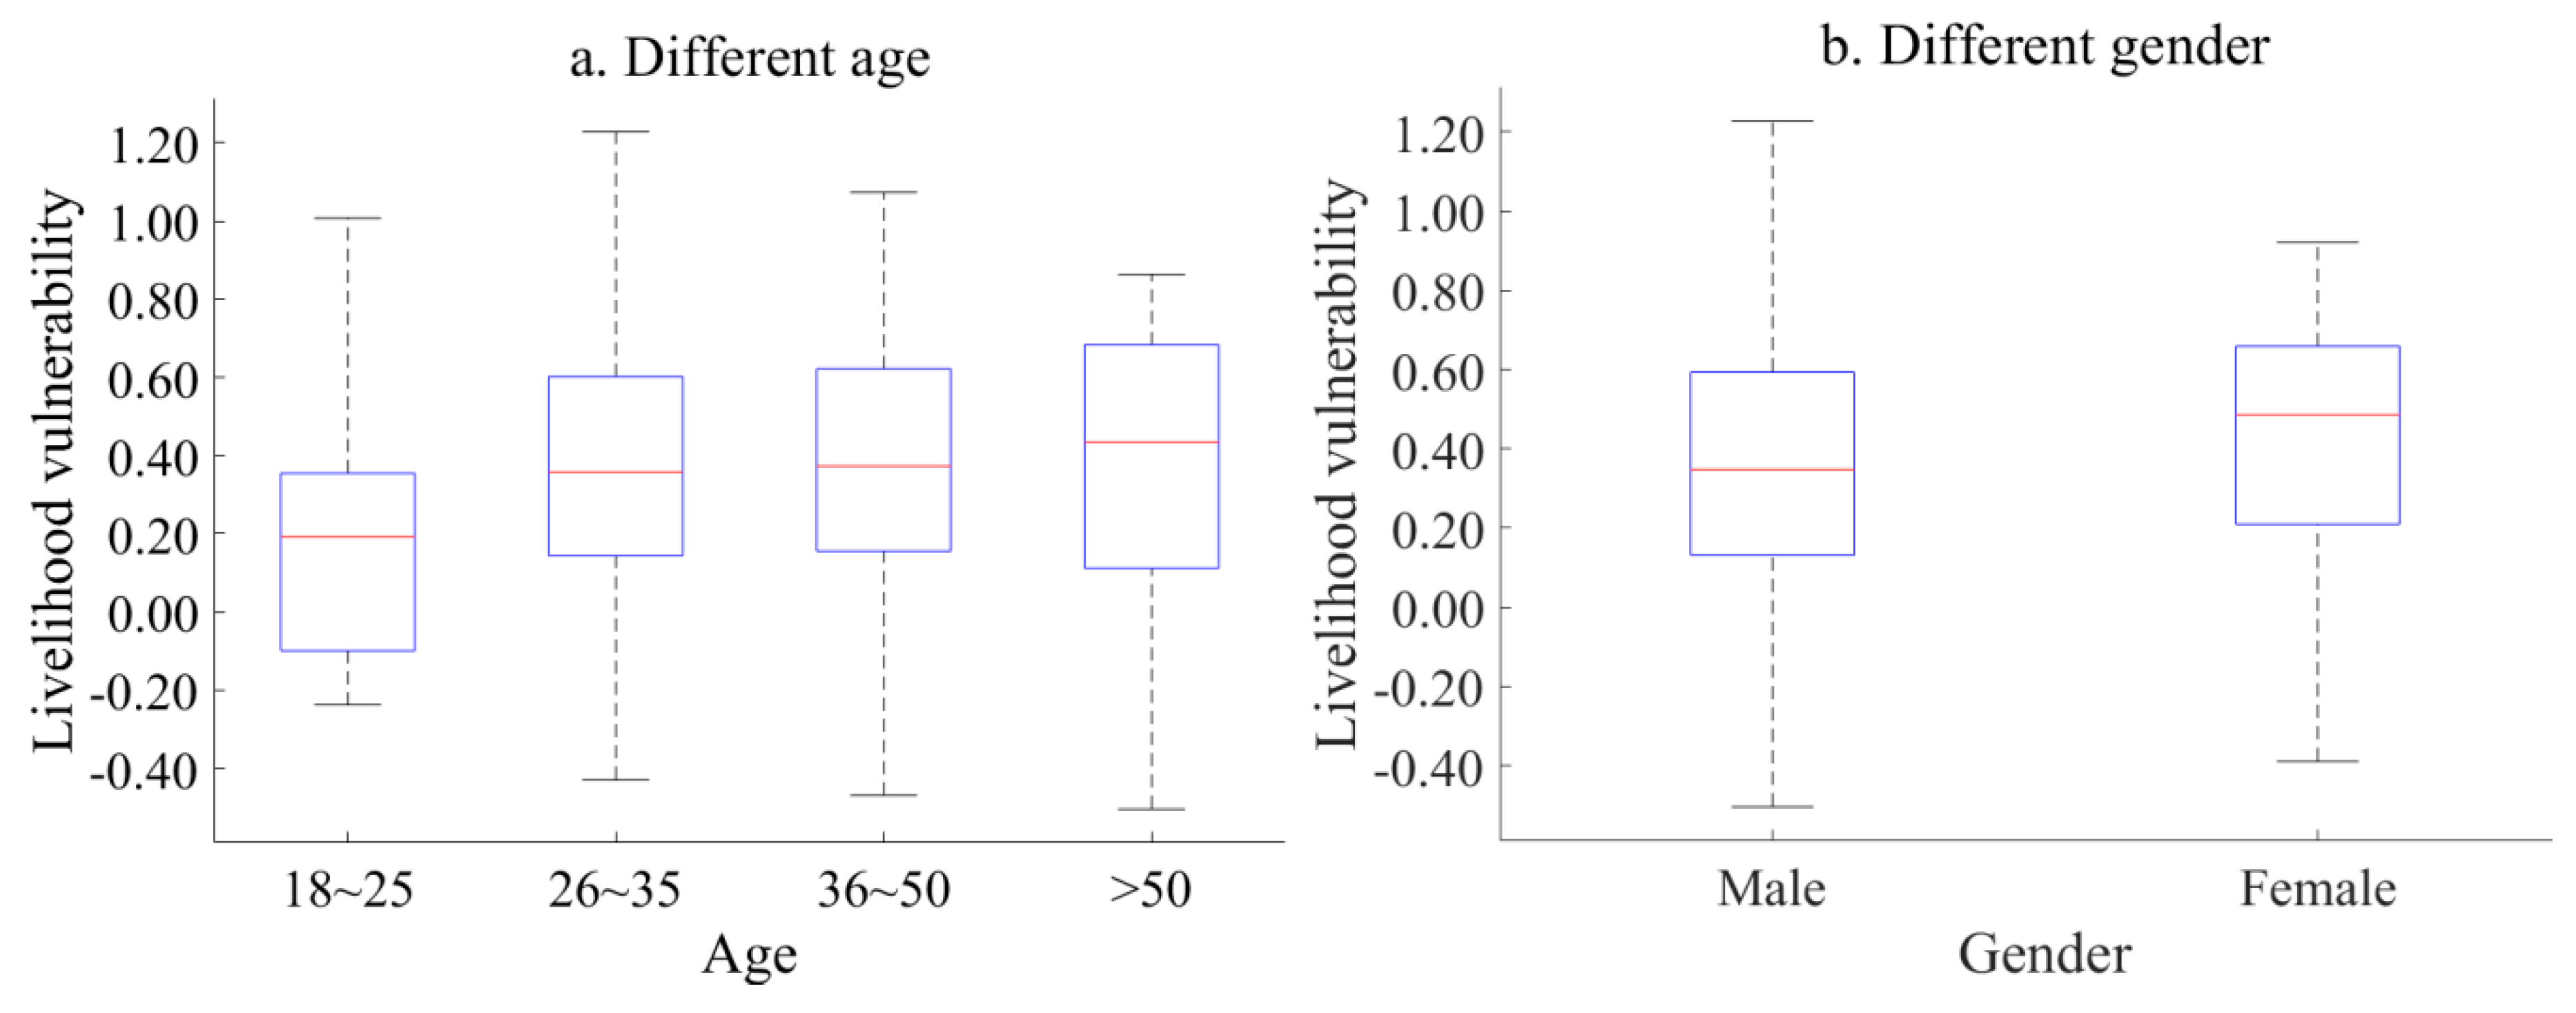
- On the whole, with the increase in age, the livelihood vulnerability index presents a gentle, inverted U-shaped trend. Employees of all ages show a certain degree of livelihood vulnerability;
- (2)
- There are differences in livelihood vulnerability between male and female employees—women’s livelihood vulnerability is relatively concentrated and generally high;
- (3)
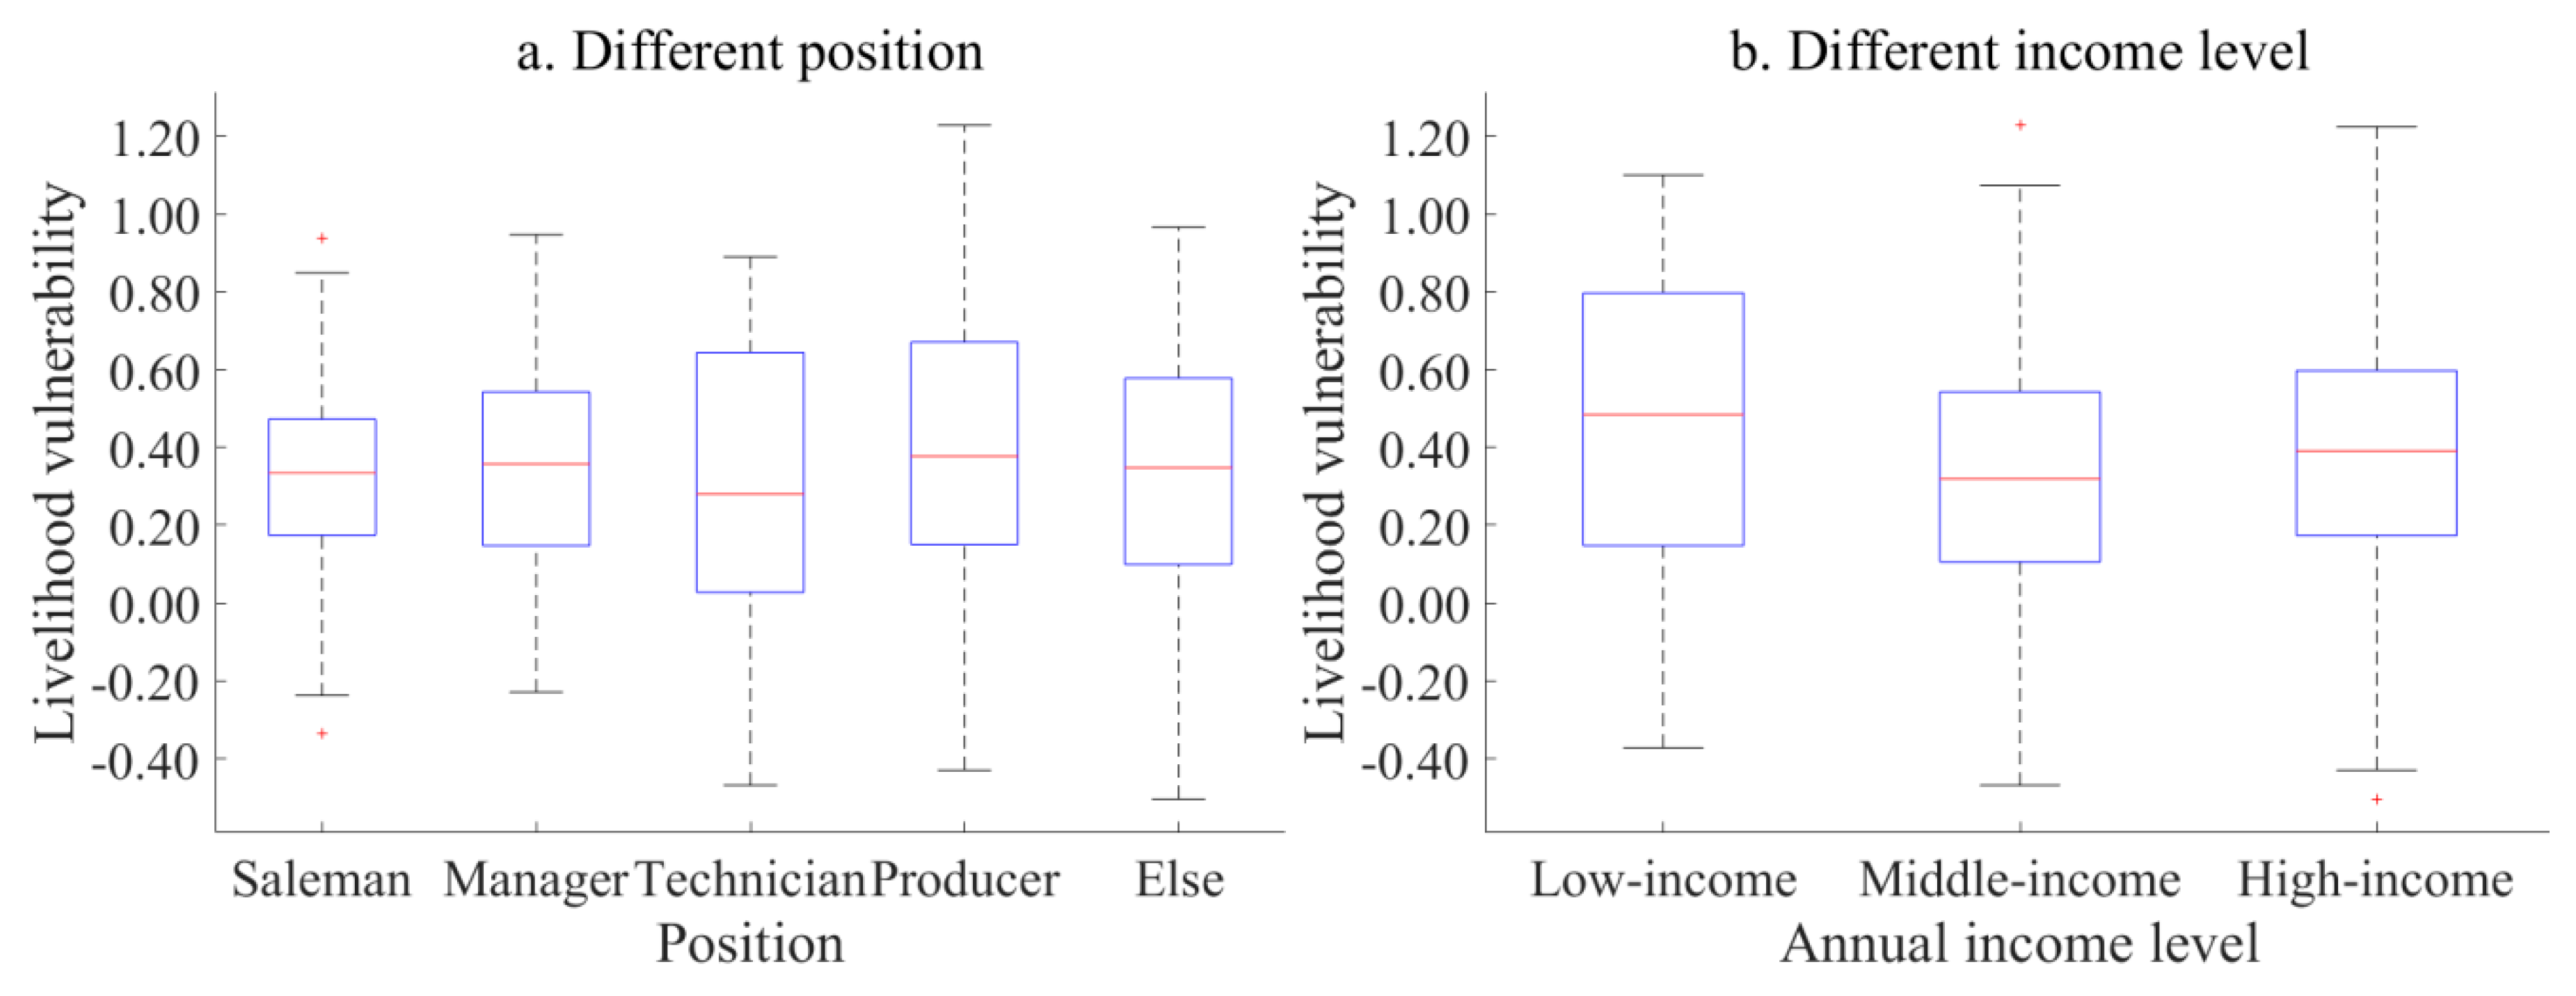
- The livelihood vulnerability of producers is relatively high, and the vulnerability index is unevenly distributed and internally differentiated;
- (4)
- The key obstacle factors affecting the sustainable livelihood of families are: living convenience, adaptability to relocation, policy understanding, children’s burden ratio, education, and annual income per person. If the current living environment is more comfortable and convenient, they will show a lower livelihood vulnerability and higher sustainable livelihood capacity;
- (5)
- In view of the livelihood vulnerability of urban employees in environmental protection relocation enterprises, this paper designs a new compensation standard calculation model— Alternative Opportunity Cost Method—which can better reflect the compensation effect of the opportunity cost within the definition of international existing compensation mechanisms and realize the leap from concept to action.
6.2. Suggestions
Author Contributions
Funding
Acknowledgments
Conflicts of Interest
Appendix A


References
- Fabian, G.; Marselek, S.; Abay-Hamar, E. The interactions of the natural environment and sustainable agricultural production. Gazda Lkoda S Sci. J. Agric. Econ. 2006, 50, 2032–2035. [Google Scholar] [CrossRef]
- Bolgov, M.V.; Demin, A.P. Water-management and environmental problems of the lower Volga and ways to their solution. Water Resour. 2018, 45, 297–305. [Google Scholar] [CrossRef]
- Rathnayake, U.; Azamathulla, H.M. Two consecutive storms and optimal control of urban sewer networks to minimize the pollution load of combined sewer systems. Sustain. Water Resour. Manag. 2017, 3, 33–40. [Google Scholar] [CrossRef]
- Nachtnebel. The Danube river basin environmental programme: Plans and actions for a basin wide approach. Water Policy 2000, 2, 113–129. [Google Scholar] [CrossRef]
- Leslie, L.; Mario, P. The search for solutions to environmental problems in China. Environ. Geol. 2008, 58, 275–283. [Google Scholar] [CrossRef]
- Hu, R.; Li, N.; Liao, Q. Analysis on the problems and countermeasures of the chemical enterprises along the Yangtze River Economic Zone. Environ. Sustain. Dev. 2019, 44, 43–47. [Google Scholar] [CrossRef]
- Notice on Shutting Down Industrial and Mining Enterprises and Related Facilities in the Ningxia Helan Mountain National Nature Reserve in Accordance with Law. Available online: https://www.nxnews.net/sz/qwfb/201707/t20170701_4298371.html (accessed on 1 July 2017).
- Li, W.J.; Ma, L.; Zang, Z.H.; Gao, J.; Li, J.Q. Construction of ecological security patterns based on ecological red line in Erhai Lake Basin of southwestern China. Beijing Linye Daxue Xuebao J. Beijing For. Univ. 2018, 40, 85–95. [Google Scholar] [CrossRef]
- Assan, J.K.; Caminade, C.; Obeng, F. Environmental variability and vulnerable livelihoods: Minimising risks and optimising opportunities for poverty alleviation. J. Int. Dev. 2009, 21, 403–418. [Google Scholar] [CrossRef]
- Parzefall, M.R.; Kuppelwieser, V.G. Understanding the antecedents, the outcomes and the mediating role of social capital: An employee perspective. Hum. Relat. 2012, 65, 447–472. [Google Scholar] [CrossRef]
- Tian, S.Y.; Chen, J.Y. Farmers’ adaptation to climate change within the sustainable livelihood framework. Chin. J. Popul. Resour. Environ. 2014, 24, 31–37. [Google Scholar] [CrossRef]
- Kumar, S.; Willman, A. Healing invisible wounds and rebuilding livelihoods: Emerging lessons for combining livelihood and psychosocial support in fragile and conflict-affected settings. J. Public Health Policy 2016, 37, 32–50. [Google Scholar] [CrossRef] [PubMed]
- Moser, S.C.; Ekstrom, J.A. A framework to diagnose barriers to climate change adaptation. Proc. Natl. Acad. Sci. USA 2010, 107, 22026–22031. [Google Scholar] [CrossRef] [PubMed] [Green Version]
- Heltberg, R.; Jorgensen, S.; Siegel, P.B. Addressing human vulnerability to climate change: Toward a ’No Regrets’ approach. Soc. Sci. Electron. Publ. 2009, 19, 89–99. [Google Scholar] [CrossRef]
- Panthi, J.; Aryal, S.; Dahal, P.; Bhandari, P.; Krakauer, N.Y.; Pandey, V.P. Livelihood vulnerability approach to assessing climate change impacts on mixed agro-livestock smallholders around the Gandaki River Basin in Nepal. Reg. Environ. Chang. 2016, 16, 1121–1132. [Google Scholar] [CrossRef]
- Yuan, Z.; Wan, G. An empirical analysis of household vulnerability in rural China. J. Asia Pac. Econ. 2006, 11, 196–212. [Google Scholar] [CrossRef]
- Hinkel, J. Indicators of vulnerability and adaptive capacity: Towards a clarification of the science-policy interface. Glob. Environ. Chang. 2011, 21, 198–208. [Google Scholar] [CrossRef]
- Huang, X.J.; Huang, X.; He, Y.B.; Yang, X.J. Assessment of livelihood vulnerability of land-lost farmers in urban fringes: A case study of Xi’an, China. Habitat Int. 2017, 59, 1–9. [Google Scholar] [CrossRef]
- Wang, X.; Hao, F.; Cheng, H.; Yang, S.; Zhang, X.; Bu, Q. Estimating non-point source pollutant loads for the large-scale basin of the Yangtze River in China. Environ. Earth Sci. 2011, 63, 1079–1092. [Google Scholar] [CrossRef]
- Wei, Y.; Wang, S.; Fang, Y.; Nawaz, Z. Integrated assessment on the vulnerability of animal husbandry to snow disasters under climate change in the Qinghai-Tibetan Plateau. Glob. Planet. Chang. 2017, 157, 139–152. [Google Scholar] [CrossRef]
- Füssel, H.M.; Klein, R.J.T. Climate change vulnerability assessments: An evolution of conceptual thinking. Clim. Chang. 2006, 75, 301–329. [Google Scholar] [CrossRef]
- Eakin, H.; Luers, A.L. Assessing the vulnerability of social-environmental systems. Soc. Sci. Electron. Publ. 2006, 5, 365–394. [Google Scholar] [CrossRef] [Green Version]
- LI, H.; Zhang, P.Y. Vulnerability of urban employment of mining cities in Northeast China. Geogr. Res. 2009, 28, 751–760. [Google Scholar] [CrossRef]
- Paavola, J. Livelihoods, vulnerability and adaptation to climate change in Morogoro, Tanzania. Environ. Sci. Policy 2008, 11, 642–654. [Google Scholar] [CrossRef]
- Simane, B.; Zaitchik, B.F.; Mesfin, D. Building climate resilience in the Blue Nile/Abay Highlands: A framework for action. Int. J. Environ. Res. Public Health 2012, 9, 610–631. [Google Scholar] [CrossRef] [PubMed]
- IPCC. Climate Change 2001: Impacts, Adaptation, and Vulnerability: Contribution of Working Group II to the Third Assessment Report; Cambridge University Press: Cambridge, UK, 2001. [Google Scholar]
- Diop, S.; Guisse, A.; Sene, C.; Cisse, B.; Diop, N.R.; Ka, S.D.; Cisse, A.G.; Sambou, S.; Ndiaye, O.; Fandohan, A.B. Combating desertification and improving local livelihoods through the GGWI in the Sahel Region: The example of Senegal. J. Resour. Ecol. 2018, 9, 257–266. [Google Scholar] [CrossRef]
- Huong, N.T.L.; Yao, S.; Fahad, S. Assessing household livelihood vulnerability to climate change: The case of Northwest Vietnam. Hum. Ecol. Risk Assess. 2018, 25, 1157–1175. [Google Scholar] [CrossRef]
- Young, O.R.; Berkhout, F.; Gallopin, G.C.; Janssen, M.A.; Ostrom, E.; Leeuw, S.v.d. The globalization of socio-ecological systems: An agenda for scientific research. Glob. Environ. Chang. 2006, 16, 304–316. [Google Scholar] [CrossRef]
- Reed, M.S.; Podesta, G.; Fazey, I.; Geeson, N.; Hessel, R.; Hubacek, K.; Letson, D.; Nainggolan, D.; Prell, C.; Rickenbach, M.G. Combining analytical frameworks to assess livelihood vulnerability to climate change and analyse adaptation options. Ecol. Econ. 2013, 94, 66–77. [Google Scholar] [CrossRef] [Green Version]
- Costa, D.M.D.; Belinato, G.; Brito, T.G.; Paiva, A.P.; Balestrassi, P.P. Weighted principal component analysis combined with Taguchi’s signal-to-noise ratio to the multiobjective optimization of dry end milling process: A comparative study. J. Braz. Soc. Mech. Sci. Eng. 2016, 39, 1–19. [Google Scholar] [CrossRef]
- Shen, P.; You, H.Y.; Wu, C.F. A Study on Obstacle Diagnosis and Support System of Sustainable Urban Land Use of Huangshi City in Hubei Province. In Proceedings of the 18th International Symposium on Advancement of Construction Management and Real Estate, Xi’an, China, 19 October 2013; pp. 139–146. [Google Scholar] [CrossRef]
- Dai, M.; Liu, Y.N.; Jiang, S.Y. The standard of eco-compensation under major function oriented zoning: An analysis based on the opportunity cost & sampled from Fogang County. Chin. J. Popul. Resour. Environ. 2013, 23, 18–22. [Google Scholar] [CrossRef]
- Vincens, N.; Emmelin, M.; Stafström, M. Social capital, income inequality and the social gradient in self-rated health in Latin America: A fixed effects analysis. Soc. Sci. Med. 2017, 196, 115–122. [Google Scholar] [CrossRef] [PubMed]
- Sadri, A.M.; Ukkusuri, S.V.; Lee, S.; Clawson, R.; Aldrich, D.; Nelson, M.S.; Seipel, J.; Kelly, D. The role of social capital, personal networks, and emergency responders in post-disaster recovery and resilience: A study of rural communities in Indiana. Nat. Hazards 2018, 90, 1377–1406. [Google Scholar] [CrossRef]
- Pretty, J.; Ward, H. Social capital and the environment. World Dev. 2001, 29, 209–227. [Google Scholar] [CrossRef]
- Coleman, J.S. Social capital in the creation of human capital. Am. J. Sociol. 1988, 94, S95–S120. [Google Scholar] [CrossRef]
- Vinogradov, E.; Kolvereid, L.; Timoshenko, K. Predicting entrepreneurial intentions when satisfactory employment opportunities are scarce. Educ. Train. 2013, 55, 719–737. [Google Scholar] [CrossRef]
- Ahn, H.; Roll, S.J.; Zeng, W.; Frey, J.J.; Reiman, S.; Ko, J. Impact of income inequality on workers’ life satisfaction in the U.S.: A multilevel analysis. Soc. Indic. Res. 2016, 128, 1347–1363. [Google Scholar] [CrossRef]
- Singh, P.K.; Nair, A. Livelihood vulnerability assessment to climate variability and change using fuzzy cognitive mapping approach. Clim. Chang. 2014, 127, 475–491. [Google Scholar] [CrossRef] [Green Version]
- Tjoe, Y. Measuring the livelihood vulnerability index of a dry region in Indonesia. World J. Sci. Technol. Sustain. Dev. 2016, 13, 250–274. [Google Scholar] [CrossRef] [Green Version]
- Brooks, R.C. Marketing yourself for the perfect job: Hard work, talent, and a well-planned campaign will help you prepare yourself for a competitive job market. IEEE Potentials 2013, 4, 8–9. [Google Scholar] [CrossRef]
- Hum, D.; Simpson, W. Closing the wage gap: Economic assimilation of Canadian immigrants reconsidered. J. Int. Migr. Integr. 2000, 1, 427–441. [Google Scholar] [CrossRef]
- Tearne, J.E.; Robinson, M.; Jacoby, P.; Allen, K.L.; Cunningham, N.K.; Li, J.; McLean, N.J. Older maternal age is associated with depression, anxiety, and stress symptoms in young adult female offspring. J. Abnorm. Psychol. 2016, 125, 1–10. [Google Scholar] [CrossRef] [PubMed] [Green Version]
- Franzen, A. Social networks and labour market outcomes: The non-monetary benefits of social capital. Eur. Sociol. Rev. 2006, 22, 353–368. [Google Scholar] [CrossRef] [Green Version]


| Dimensions | Indices | Weights 1 | Meaning and Assignment of Indices | Mean | Standard Deviation |
|---|---|---|---|---|---|
| Expose (E) | Property loss (E1) | 0.0250 | Amount of personal property damage caused by enterprise relocation/CNY | 28,825.27 | 20,469.92 |
| Credit possibilities (E2) | 0.0300 | Possibility of staff requiring credit after relocation. Sure = 1, larger = 2, generally = 3, smaller = 4, no = 5. | 2.83 | 1.48 | |
| Housing situation (E3) | 0.0524 | Rent = 1, rural self-house = 2, urban commercial house = 3 | 2.36 | 0.71 | |
| Sensitivity (S) | Health (S1) | 0.0159 | Medical expenses accounted for less than 20% of total household income = 1, 20%–50% = 2, more than 50% of total household income = 3. | 1.53 | 0.66 |
| Negative effects of relocation (S2) | 0.0475 | Number of options for investigating the negative impact of relocation on employees | 1.93 | 0.98 | |
| Income dependence (S3) | 0.0066 | The proportion of enterprise wage income to family income | 0.70 | 0.26 | |
| Dependence on living expenses (S4) | 0.0035 | The proportion of household general living expenditure to total household expenditure | 0.50 | 0.23 | |
| Adaptability (A) | Annual income per person (A1) | 0.0608 | Annual income per person in family/CNY | 34,232.68 | 20,940.80 |
| Education (A2) | 0.0797 | Junior high school and below = 1, secondary or high school = 2, tertiary or undergraduate = 3, graduate above = 4 | 2.45 | 0.61 | |
| Old age burden ratio (A3) | 0.0407 | Number of elderly people over 60 years of age | 1.69 | 1.23 | |
| Children’s burden ratio (A4) | 0.0627 | Number of children under 15 | 0.75 | 0.63 | |
| Housing area (A5) | 0.0608 | Household housing area/m2 | 108.62 | 24.89 | |
| Credit capital (A6) | 0.0098 | In the past three years, whether there has been any experience of borrowing money (banks, small loan companies, relatives and friends, etc.); yes = 1, no = 0. | 0.64 | 0.48 | |
| Skills training (A7) | 0.0326 | Yes = 1, no = 0 | 0.84 | 0.37 | |
| Trust in people around (A8) | 0.0996 | Very distrust = 1, comparative distrust = 2, generally = 3, comparative trust = 4, very trust = 5 | 3.62 | 0.77 | |
| Social network (A9) | 0.0215 | Number of civil servants among relatives | 0.97 | 1.87 | |
| Self-assessment of adaptability for relocation (A10) | 0.1173 | Incapacity = 1, low ability = 2, medium ability = 3, relatively high ability = 4, high ability = 5 | 3.13 | 0.77 | |
| Residential convenience (A11) | 0.1111 | Yes = 1, no = 0 | 0.68 | 0.47 | |
| Understanding of Enterprise Relocation Policy (A12) | 0.1157 | Very not understanding = 1, comparative not understanding = 2, generally = 3, comparative understanding = 4, very understanding = 5 | 3.49 | 0.89 | |
| Livelihood Diversity (A13) | 0.0068 | Number of livelihood activities of employee families | 1.43 | 0.63 |
| Statistical Items | Number | Percentage % | Statistical Items | Number | Percentage % | ||
|---|---|---|---|---|---|---|---|
| Gender | Male | 346 | 84.39 | Education | Junior high school and below | 21 | 5.12 |
| Female | 64 | 15.61 | Secondary or high school | 186 | 45.37 | ||
| Age | 18~25 | 19 | 4.63 | Diploma or undergraduate | 199 | 48.54 | |
| 26~35 | 188 | 45.85 | Postgraduate and above | 4 | 0.98 | ||
| 36~50 | 182 | 44.39 | Number of families | 1~3 | 117 | 28.54 | |
| Over 50 | 21 | 5.12 | 4~6 | 261 | 63.66 | ||
| Position | Salesman | 40 | 9.76 | 7 and above | 32 | 7.80 | |
| Manager | 54 | 13.17 | Annual income per person (CNY) | 10,000 and below | 83 | 20.24 | |
| technician | 48 | 11.71 | 10,000~50,000 | 183 | 44.63 | ||
| Producer | 201 | 49.02 | 50,000 and above | 144 | 35.12 | ||
| Else | 67 | 16.34 | |||||
| Position | Number of Families | Number of Families Over 60 Years Old | Number of Families under 15 Years Old | Annual Income Per Person (CNY) | Housing Area (m2) |
|---|---|---|---|---|---|
| Salesman | 3.75 | 2.08 | 0.63 | 46,800.00 | 103.33 |
| Manager | 4.26 | 1.57 | 0.78 | 37,583.33 | 114.26 |
| technician | 4.65 | 1.56 | 0.73 | 40,104.17 | 109.60 |
| Producer | 4.72 | 1.70 | 0.81 | 28,653.73 | 108.72 |
| Else | 4.42 | 1.58 | 0.67 | 36,559.70 | 106.20 |
| Type | (E + S) | (A) | (LVI) | Sample | ||||
|---|---|---|---|---|---|---|---|---|
| Attribute | Mean | Attribute | Mean | Attribute | Mean | Number | Percent | |
| I | High | 1.1575 | High | 0.5805 | Middle | 0.5770 | 118 | 28.78% |
| II | Low | 0.6389 | High | 0.5794 | Low | 0.0595 | 123 | 30.00% |
| III | Low | 0.5925 | Low | 0.4088 | Middle | 0.1837 | 91 | 22.20% |
| IV | High | 1.1383 | Low | 0.4138 | High | 0.7245 | 78 | 19.02% |
| Total | - | 0.8729 | - | 0.5104 | - | 0.3625 | 410 | 100% |
| Variables | E | S | A | LVI |
|---|---|---|---|---|
| Gender | 0.012541 (0.014876) | −0.059302 * (0.034018) | −0.002832 (0.002413) | −0.043929 (0.037558) |
| Age | 0.008224 (0.008147) | −0.021641 (0.018631) | −0.000709 (0.001321) | −0.012708 (0.020569) |
| Annual income per person | 2.28 × 10⁻⁸ (2.49 × 10⁻⁷) | −7.26 × 10⁻⁷ (5.69 × 10⁻⁷) | 7.61 × 10⁻⁷ *** (4.03 × 10⁻⁸) | −1.46 × 10⁻⁶ ** (6.28 × 10⁻⁷) |
| Education | −0.007789 (0.009368) | 0.010760 (0.021464) | 0.031304 *** (0.001520) | −0.049853 ** (0.023653) |
| Old age burden ratio | −0.004780 (0.004434) | 0.002863 (0.01014) | 0.008381 *** (0.000719) | −0.016024 ** (0.011195) |
| Children’s burden ratio | −0.009361 (0.008856) | −0.020553 (0.020252) | 0.016794 *** (0.001436) | −0.046707 ** (0.022359) |
| Housing area | 0.000284 (0.000212) | −0.001237 ** (0.000484) | 0.000424 *** (0.000034) | −0.001377 *** (0.000535) |
| Trust in people around | 0.017488 ** (0.007317) | 0.024142 (0.016733) | 0.033005 *** (0.001187) | 0.008625 ** (0.018474) |
| Social network | −0.003407 (0.002667) | −0.013168 ** (0.006098) | 0.001940 *** (0.000433) | −0.018414 *** (0.006733) |
| Self-assessment of relocation adaptability | 0.005287 (0.006921) | −0.000868 (0.015828) | 0.033270 *** (0.001123) | −0.028851 * (0.017474) |
| Residential convenience | 0.036357 *** (0.011383) | −0.033057 (0.026032) | 0.140885 *** (0.001846) | −0.137586 *** (0.028742) |
| Understanding of enterprise relocation policy | 0.011409 * (0.006333) | −0.022437 (0.014482) | 0.035590 *** (0.001027) | −0.046618 *** (0.015989) |
| Livelihood diversity | 0.035010 *** (0.008140) | −0.036123* (0.018615) | 0.004872 *** (0.001320) | −0.005984 (0.020551) |
| Number of families | −0.008838 ** (0.004201) | 0.022550 ** (0.009608) | 0.000630 (0.000681) | 0.013082 (0.010607) |
| Position | 0.015718 *** (0.004629) | 0.012566 (0.010586) | 0.000712 (0.000751) | 0.027572 ** (0.011687) |
| R2 | 0.8195 | 0.1066 | 0.9777 | 0.4586 |
| F | 111.48 | 2.93 | 1076.87 | 20.80 |
| Rank | Employees with Low Adaptability | Category III Employees | Category IV Employees | |||
|---|---|---|---|---|---|---|
| Obstacle Factors | Obstacle Degree | Obstacle Factors | Obstacle Degree | Obstacle Factors | Obstacle Degree | |
| 1 | Residential convenience | 0.1581 | Residential convenience | 0.1564 | Residential convenience | 0.1602 |
| 2 | Relocation adaptability | 0.1327 | Relocation adaptability | 0.1357 | Relocation adaptability | 0.1291 |
| 3 | Understanding of enterprise relocation policy | 0.1160 | Understanding of enterprise relocation policy | 0.1148 | Understanding of enterprise relocation policy | 0.1173 |
| 4 | Children’s burden ratio | 0.1129 | Children’s burden ratio | 0.1104 | Children’s burden ratio | 0.1158 |
| 5 | Education | 0.0913 | Education | 0.0923 | Annual income per person | 0.0908 |
| Variables | Variable Meanings | Variable Descriptions |
|---|---|---|
| OC11 | Cost savings from education | The cost for employees to enter the talent market and apply for jobs again |
| OC12 | Cost saving of social network | Including the cost of technical training and the balance of human relationship income and expenditure |
| OC21 | Housing area | The main influencing factor is the annual income of the family |
| OC22 | Annual income per person | The main influencing factor is salary |
| OC23 | Children’s burden ratio | The cost can be replaced by the education investment of the staff to the children. The main influencing factors include the annual income of the family and the education of the parents |
| OC24 | Living convenience | The main influencing factors include shopping convenience (number of supermarkets and shopping malls nearby), medical convenience (distance to hospital), transportation convenience (distance to bus station, downtown and workplace) |
© 2020 by the authors. Licensee MDPI, Basel, Switzerland. This article is an open access article distributed under the terms and conditions of the Creative Commons Attribution (CC BY) license (http://creativecommons.org/licenses/by/4.0/).
Share and Cite
Zhao, X.; Chi, C.; Gao, X.; Duan, Y.; He, W. Study on the Livelihood Vulnerability and Compensation Standard of Employees in Relocation Enterprises: A Case of Chemical Enterprises in the Yangtze River Basin. Int. J. Environ. Res. Public Health 2020, 17, 363. https://0-doi-org.brum.beds.ac.uk/10.3390/ijerph17010363
Zhao X, Chi C, Gao X, Duan Y, He W. Study on the Livelihood Vulnerability and Compensation Standard of Employees in Relocation Enterprises: A Case of Chemical Enterprises in the Yangtze River Basin. International Journal of Environmental Research and Public Health. 2020; 17(1):363. https://0-doi-org.brum.beds.ac.uk/10.3390/ijerph17010363
Chicago/Turabian StyleZhao, Xu, Chen Chi, Xin Gao, Yuefang Duan, and Weijun He. 2020. "Study on the Livelihood Vulnerability and Compensation Standard of Employees in Relocation Enterprises: A Case of Chemical Enterprises in the Yangtze River Basin" International Journal of Environmental Research and Public Health 17, no. 1: 363. https://0-doi-org.brum.beds.ac.uk/10.3390/ijerph17010363