Analysis of the Dimensions of Quality of Life in Colombian University Students: Structural Equation Analysis

 , and
, and
Abstract
:1. Introduction
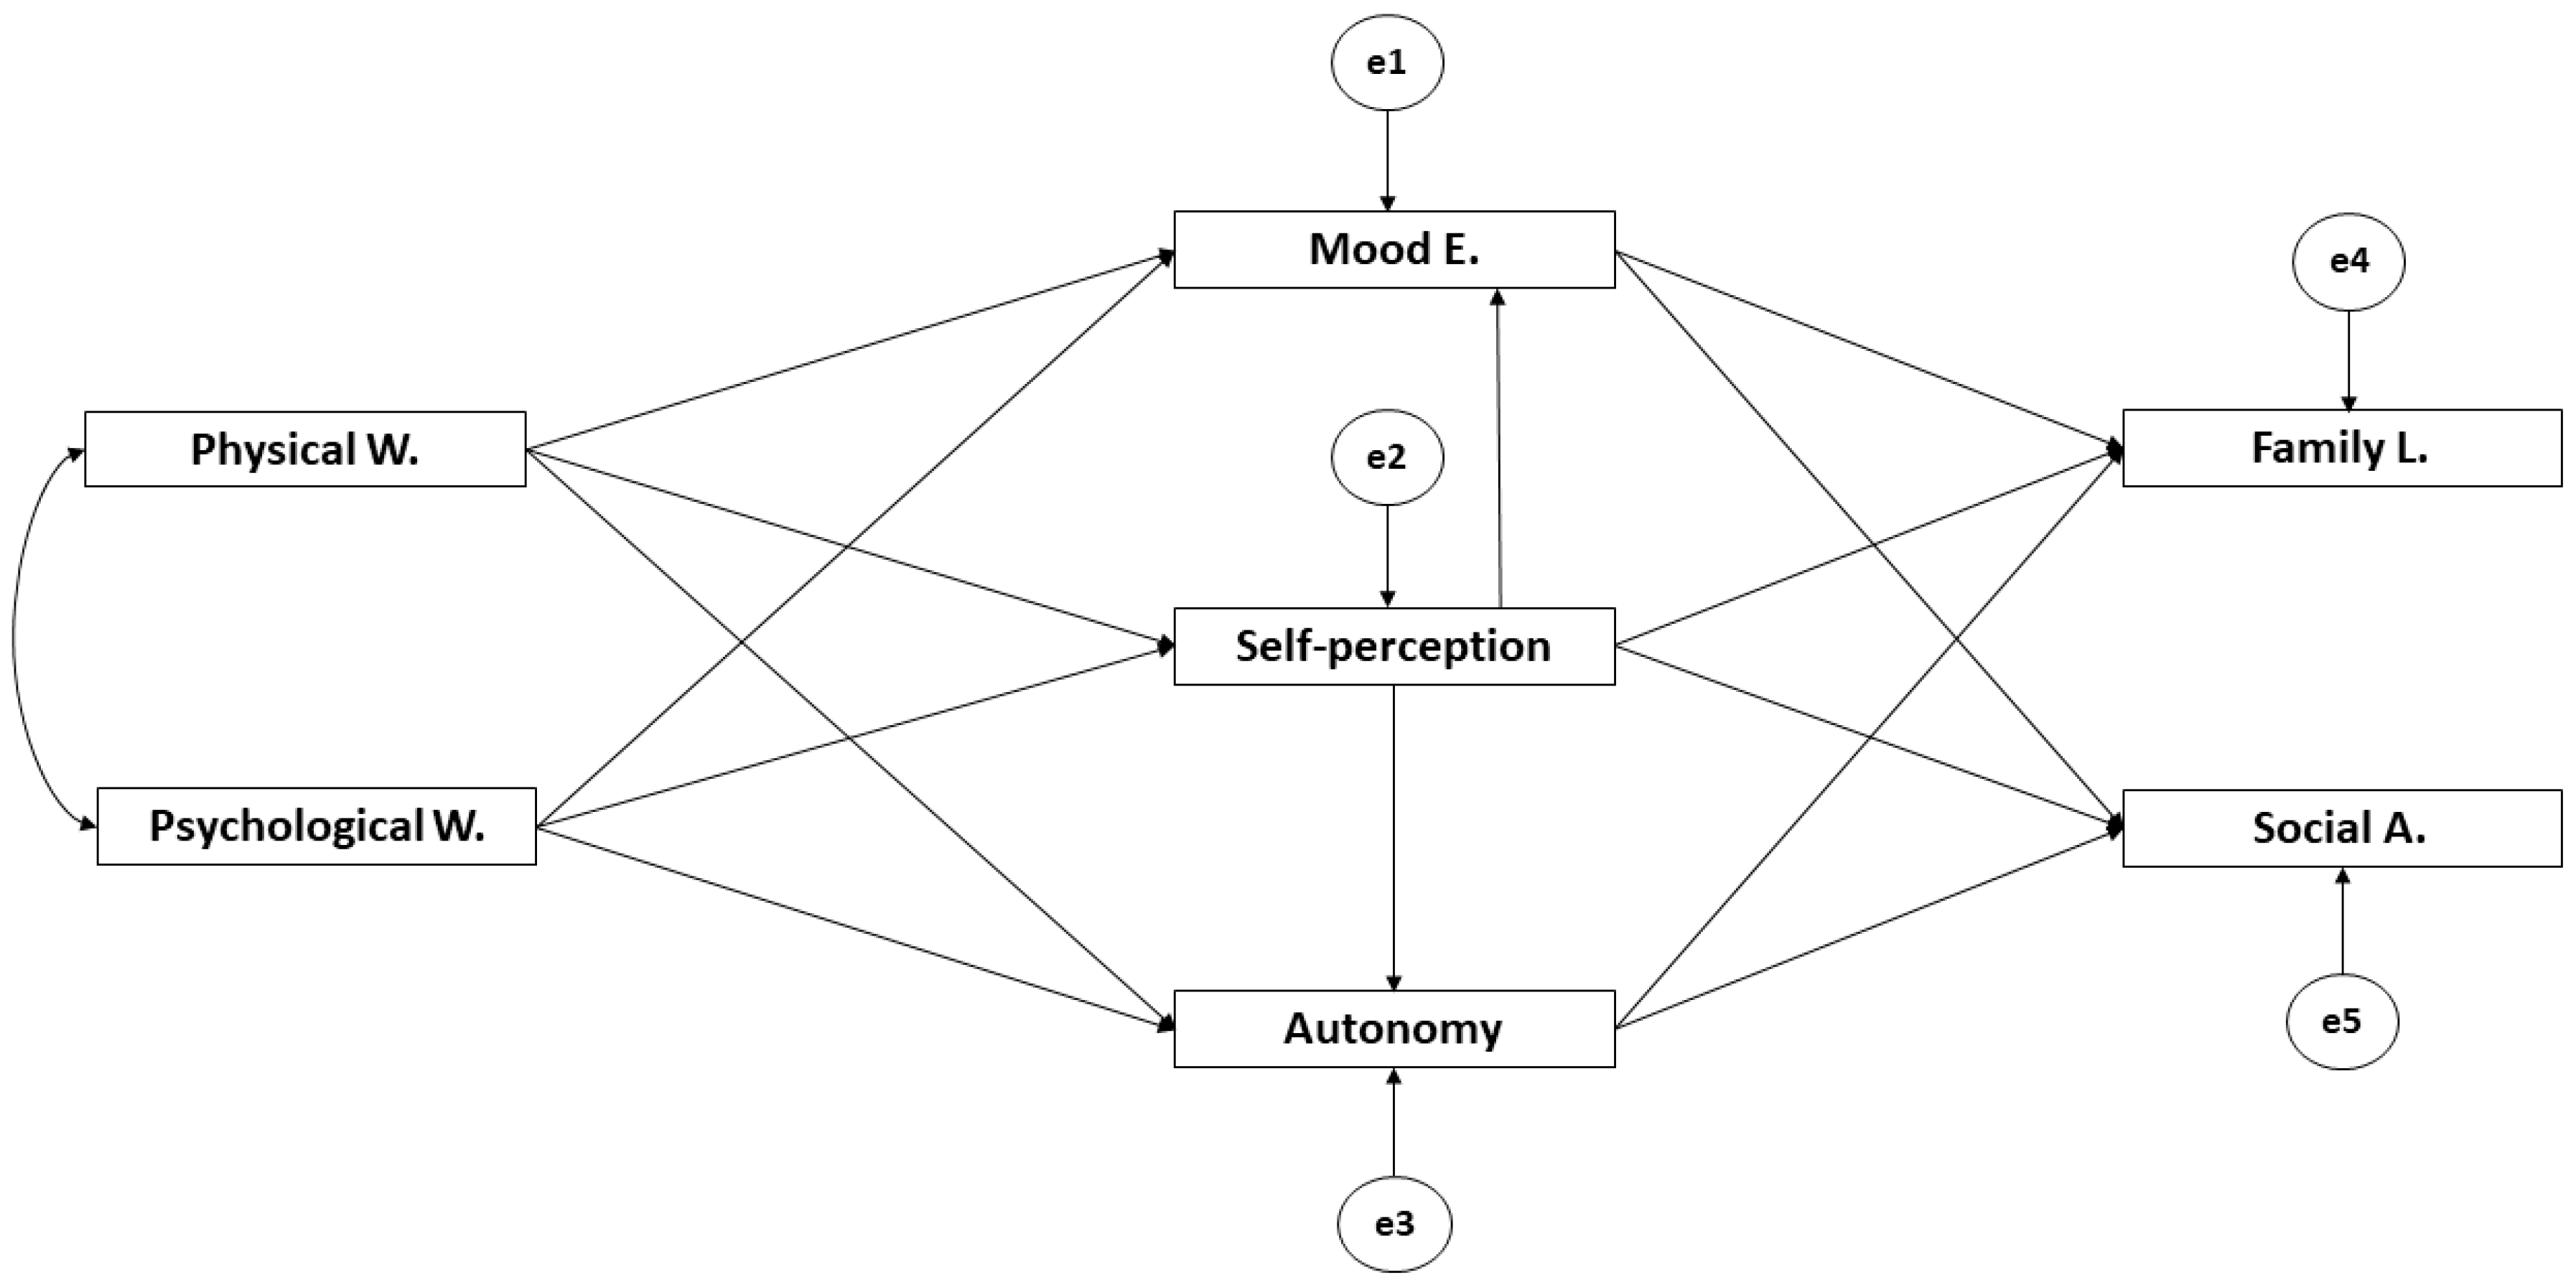
- Define and contrast an explicative model about the relationship between variables that make up quality of life and those which comprise the KIDSCREEN-52 questionnaire.
- Analyze the existing associations between variables of quality of life and those from the KIDSCREEN-52 questionnaire through a structural equation analysis.
2. Materials and Methods
2.1. Design and Participants
- Inclusion criteria:
- ○
- Aged between 17 and 18 years old.
- ○
- Not suffering from diseases or pathology that prevent participation in the investigation.
- Inclusion criteria:
- ○
- If underage, not receiving informed consent from parents or legal tutors.
- ○
- Suffering from any disease or pathology that prevents participation in the investigation.
2.2. Variables and Instrument
- ○
- Physical Wellbeing (5 items)
- ○
- Psychological Wellbeing (6 items)
- ○
- Mood and Emotions (7 items)
- ○
- Autonomy (5 items)
- ○
- Self-Perception (5 items)
- ○
- Parent Relationship and Family Life (6 items)
- ○
- Friends and Social Support (6 items)
- ○
- Scholar Environment (6 items)
- ○
- Social Acceptance (3 items)
- ○
- Economic Resources (3 items)
2.3. Procedures
2.4. Data Analysis
3. Results
4. Discussion
5. Conclusions
Author Contributions
Funding
Conflicts of Interest
References
- Rivera Rojas, F.; Ceballos Vásquez, P.; Vilchez Barboza, V. Calidad de Vida Relacionada con Salud y Riesgos Psicosociales: Conceptos relevantes para abordar desde la Enfermería. Index De Enfermería 2017, 26, 58–61. [Google Scholar]
- Robles-Espinoza, A.I.; Rubio-Jurado, B.; la Rosa-Galván, D.; Vanessa, E.; Nava-Zavala, A.H. Generalidades y conceptos de calidad de vida en relación con los cuidados de salud. El Residente 2016, 11, 120–125. [Google Scholar]
- Bautista-Rodríguez, L.M. La calidad de vida como concepto. Revista Ciencia y Cuidado 2017, 14, 5–8. [Google Scholar] [CrossRef] [Green Version]
- Noriega, C.; Velasco, C.; Pérez Rojo, G.; Carretero, I.; Chulián, A.; López Martínez, J. Calidad de vida, bienestar psicológico y valores en personas mayores. Revista Clínica Contemporánea 2019, 8, 1–3. [Google Scholar] [CrossRef]
- Duran, S.E.; García, J.; Prieto, R. Influencia de la Calidad de Vida en el rendimiento del estudiante universitario. Calidad De Vida Inclusión Social y Bienestar Humano 2017, 90, 1–15. [Google Scholar]
- Blanco, M.G. Calidad de vida relacionada con la salud. Revista de Obstetricia y Ginecología de Venezuela 2018, 78, S4–S12. [Google Scholar]
- Beranuy Fargues, M.; Pérez-Sancho, C.; Gutiérrez-Ortega, M.; Pérez-Lorenzo, J.F.; Baridon-Chauvie, D.; González-Cabrera, J. Calidad de Vida relacionada con la Salud y ciberbullying en una muestra de adolescentes. In Proceedings of the III Congreso Internacional de Inteligencia Emocional y Bienestar, Zaragoza, Spain, 18 September 2018. [Google Scholar]
- Higuita-Gutiérrez, L.F.; Cardona-Arias, J.A. Calidad de vida de adolescentes escolarizados de Medellín-Colombia, 2014. Rev. Fac. Nac. Salud Pública 2016, 34, 145–155. [Google Scholar] [CrossRef] [Green Version]
- Merino, J.F.R.; Canut, M.T.L.; Fernández, A.M.U.; del Olmo, E.Z.; Oller, O.V.; Sábado, J.T. Calidad de vida relacionada con la salud en escolares de educación primaria: Estudio transversal. Rev. Iberoamericana de Enfermería Comunitaria RIdEC 2017, 10, 23–30. [Google Scholar]
- Durán, S.; Castillo, M. Diferencias en la calidad de vida de estudiantes universitarios de diferente año de ingreso del campus Antumapu. Rev. Chilen Nutr. 2009, 36, 200–209. [Google Scholar] [CrossRef] [Green Version]
- Flores, N.L.; Balmori, Y.S.; Vera, N.F.; Gutiérrez, H.J. Salud, calidad de vida y entorno universitario en estudiantes mexicanos de una universidad pública. Rev. Promocion Salud. 2015, 20, 102–117. [Google Scholar] [CrossRef]
- Yasartürk, F.; Akyüz, H.; Gönülates, S. The Investigation of the Relationship between University Students’ Levels of Life Quality and Leisure Satisfaction. Univ. J. Ed. Res. 2019, 7, 739–745. [Google Scholar] [CrossRef] [Green Version]
- Holt, E.W.; Lombard, Q.K.; Best, N.; Smiley-Smith, S.; Quinn, J.E. Active and passive use of green space, health, and well-being amongst university students. Int. J. Environ. Res. Public Health 2019, 16, 424. [Google Scholar] [CrossRef] [PubMed] [Green Version]
- Gómez, R.D.M. Redes sociales y comunicación universitaria: Los desafíos de la Universidad Veracruzana en la época de Internet. Rev. Ensayos Pedagógicos 2016, 11, 37–53. [Google Scholar]
- Rochín Virués, D.M. Reflexiones de una vida dedicada a la docencia. Rev. Electrónica De Psicología Iztacala 2019, 22, 713–760. [Google Scholar]
- Ruiz Sánchez, J.; Cruz Rodríguez, M. Elementos para una crítica de las tendencias recientes de medición del desarrollo y la calidad de vida. Región y Sociedad 2017, 29, 301–321. [Google Scholar]
- Ravens-Sieberer, U.; Auquier, P.; Erhart, M.; Gosch, A.; Rajmil, L.; Bruil, J.; Kilroe, J. The KIDSCREEN-27 quality of life measure for children and adolescents: Psychometric results from a cross-cultural survey in 13 European countries. Qual. Life Res. 2007, 16, 1347–1356. [Google Scholar] [CrossRef]
- Aymerich, M.; Berra, S.; Guillamón, I.; Herdman, M.; Alonso, J.; Ravens-Sieberer, U.; Rajmil, L. Desarrollo de la versión en español del KIDSCREEN: Un cuestionario de calidad de vida para la población infantil y adolescente. Gaceta Sanit. 2005, 19, 93–102. [Google Scholar] [CrossRef] [Green Version]
- Marsh, H.W. Handbook of Sport Psychology, 3rd ed.; Tenenbaum, G., Eklund, R.C., Eds.; John Wiley & Sons, Inc.: Hoboken, NJ, USA, 2014. [Google Scholar] [CrossRef]
- Kim, Y.; Park, H.R. Structural Equation Model of Health-Related Quality of Life in School Age Children with Asthma. J. Korean Acad. Nurs. 2018, 48, 96–108. [Google Scholar] [CrossRef]
- Haraldstad, K.; Kvarme, L.G.; Christophersen, K.A.; Helseth, S. Associations between self-efficacy, bullying and health-related quality of life in a school sample of adolescents: A cross-sectional study. BMC Public Health 2019, 19, 757. [Google Scholar] [CrossRef] [Green Version]
- Oh, E.; Gill, D.L. An Examination of the Mediating Role of Physical Self-Worth on the Relationship between Physical Activity and Quality of Life in Korean Adolescents. Korean Soc. Sport Psychol. 2018, 29, 61–71. [Google Scholar] [CrossRef]
- Degoy, E.; Berra, S. Differences in health-related quality of life by academic performance in children of the city of Cordoba-Argentina. Qual. Life Res. 2018, 27, 1463–1471. [Google Scholar] [CrossRef] [PubMed]
- Aadland, K.N.; Aadland, E.; Andersen, J.R.; Lervåg, A.; Moe, V.F.; Resaland, G.K.; Ommundsen, Y. Executive function, behavioral self-regulation, and school related well-being did not mediate the effect of school-based physical activity on academic performance in numeracy in 10-year-old children. The active smarter kids (ASK) study. Front. Psychol. 2018, 9, 245. [Google Scholar] [CrossRef] [PubMed] [Green Version]
- Gaspar, T.; De Matos, M.G.; Batista-Foguet, J.; Pais Ribeiro, J.L.; Leal, I. Parent–child perceptions of quality of life: Implications for health intervention. J. Fam. Stud. 2010, 16, 143–154. [Google Scholar] [CrossRef]
- Chan, J.S.; Liu, G.; Liang, D.; Deng, K.; Wu, J.; Yan, J.H. Special issue–therapeutic benefits of physical activity for mood: A systematic review on the effects of exercise intensity, duration, and modality. J. Psychol. 2019, 153, 102–125. [Google Scholar] [CrossRef]
- Diaz, K.M.; Duran, A.T.; Colabianchi, N.; Judd, S.E.; Howard, V.J.; Hooker, S.P. Potential effects on mortality of replacing sedentary time with short sedentary bouts or physical activity: A national cohort study. Am. J. Epidemiol. 2019, 188, 537–544. [Google Scholar] [CrossRef]
- Eigenschenk, B.; Thomann, A.; McClure, M.; Davies, L.; Gregory, M.; Dettweiler, U.; Inglés, E. Benefits of outdoor sports for society. A systematic literature review and reflections on evidence. Int. J. Environ. Res. Public Health 2019, 16, 937. [Google Scholar] [CrossRef] [Green Version]
- Singh, A.S.; Saliasi, E.; Van Den Berg, V.; Uijtdewilligen, L.; De Groot, R.H.; Jolles, J.; Ericsson, I. Effects of physical activity interventions on cognitive and academic performance in children and adolescents: A novel combination of a systematic review and recommendations from an expert panel. Br. J. Sports Med. 2019, 53, 640–647. [Google Scholar] [CrossRef] [Green Version]
- Schellenberg, B.J.; Verner-Filion, J.; Gaudreau, P.; Bailis, D.S.; Lafrenière, M.A.K.; Vallerand, R.J. Testing the dualistic model of passion using a novel quadripartite approach: A look at physical and psychological well-being. J. Personal. 2019, 87, 163–180. [Google Scholar] [CrossRef]
- Alamdarloo, G.H.; Shojaee, S.; Asadmanesh, E.; Shahin, H.S.; Rangani, A.; Negahdarifard, S. A comparison of psychological well-being in athlete and non-athlete women. Baltic J. Health Phys. Act. 2019, 11, 109–116. [Google Scholar] [CrossRef]
- Schmidt, S.K.; Reinboth, M.S.; Resaland, G.K.; Bratland-Sanda, S. Changes in Physical Activity, Physical Fitness and Well-Being Following a School-Based Health Promotion Program in a Norwegian Region with a Poor Public Health Profile: A Non-Randomized Controlled Study in Early Adolescents. Int. J. Environ. Res. Public Health 2020, 17, 896. [Google Scholar] [CrossRef] [Green Version]
- Grasaas, E.; Helseth, S.; Fegran, L.; Stinson, J.; Småstuen, M.; Haraldstad, K. Health-related quality of life in adolescents with persistent pain and the mediating role of self-efficacy: A cross-sectional study. Health Qual. Life Outcomes 2020, 18, 19. [Google Scholar] [CrossRef] [PubMed] [Green Version]
- Martínez-Monteagudo, M.C.; Delgado, B.; Inglés, C.J.; García-Fernández, J.M. Cyberbullying in the university setting. Relationship with family environment and emotional intelligence. Comput. Hum. Behav. 2019, 91, 220–225. [Google Scholar] [CrossRef]
- Pérez-Fuentes, M.D.C.; Molero Jurado, M.D.M.; Barragán Martín, A.B.; Gázquez Linares, J.J. Family functioning, emotional intelligence, and values: Analysis of the relationship with aggressive behavior in adolescents. Int. J. Environ. Res. Public Health 2019, 16, 478. [Google Scholar] [CrossRef] [PubMed] [Green Version]
- Winter, K.; Morrison, F.; Cree, V.; Ruch, G.; Hadfield, M.; Hallett, S. Emotional labour in social workers’ encounters with children and their families. Br. J. Social Work 2019, 49, 217–233. [Google Scholar] [CrossRef] [Green Version]
- Nie, Q.; Tian, L.; Huebner, E.S. Relations among Family Dysfunction, Loneliness and Life Satisfaction in Chinese Children: A Longitudinal Mediation Model. Child Indic. Res. 2019, 1–24. [Google Scholar] [CrossRef]
- Wiegand-Grefe, S.; Sell, M.; Filter, B.; Plass-Christl, A. Family functioning and psychological health of children with mentally ill parents. Int. J. Environ. Res. Public Health 2019, 16, 1278. [Google Scholar] [CrossRef] [Green Version]
- Segrin, C.; Kauer, T.B.; Burke, T.J. Indirect effects of family cohesion on emerging adult perfectionism through anxious rearing and social expectations. J. Child Fam. Stud. 2019, 28, 2280–2285. [Google Scholar] [CrossRef]
- Amesberger, G.; Finkenzeller, T.; Müller, E.; Würth, S. Aging-related changes in the relationship between the physical self-concept and the physical fitness in elderly individuals. Scand. J. Med. Sci. Sports 2019, 29, 26–34. [Google Scholar] [CrossRef] [Green Version]
- Maricuțoiu, L.P.; Payne, B.K.; Iliescu, D. It works both ways. Enhancing explicit self-esteem using the self-reference task. J. Exp. Soc. Psychol. 2019, 80, 8–16. [Google Scholar] [CrossRef]
- Machin, J.E.; Adkins, N.R.; Crosby, E.; Farrell, J.R.; Mirabito, A.M. The marketplace, mental well-being, and me: Exploring self-efficacy, self-esteem, and self-compassion in consumer coping. J. Bus. Res. 2019, 100, 410–420. [Google Scholar] [CrossRef]
- Wetherall, K.; Robb, K.A.; O’Connor, R.C. Social rank theory of depression: A systematic review of self-perceptions of social rank and their relationship with depressive symptoms and suicide risk. J. Affect. Disord. 2019, 246, 300–319. [Google Scholar] [CrossRef] [PubMed] [Green Version]
- Kim, H.; Di Domenico, S.I.; Connelly, B.S. Self–other agreement in personality reports: A meta-analytic comparison of self-and informant-report means. Psychol. Sci. 2019, 30, 129–138. [Google Scholar] [CrossRef]
- Klusmann, V.; Sproesser, G.; Wolff, J.K.; Renner, B. Positive self-perceptions of aging promote healthy eating behavior across the life span via social-cognitive processes. J. Gerontol. Ser. B 2019, 74, 735–744. [Google Scholar] [CrossRef] [PubMed]
- Girme, Y.U.; Overall, N.C.; Hammond, M.D. Facilitating autonomy in interdependent relationships: Invisible support facilitates highly avoidant individuals’ autonomy. J. Fam. Psychol. 2019, 33, 154. [Google Scholar] [CrossRef] [PubMed]
- Pavlidis, K.; McCauley, E. Autonomy and relatedness in family interactions with depressed adolescents. J. Abnorm. Child Psychol. 2001, 29, 11–21. [Google Scholar] [CrossRef] [PubMed]
- Castro-Sánchez, M.; Zurita-Ortega, F.; Ramírez-Granizo, I.; Ubago-Jiménez, J.L. Relación entre la inteligencia emocional y los niveles de ansiedad en deportistas. J. Sport Health Res. 2020, 12, 42–53. [Google Scholar]
- Juhaňák, L.; Zounek, J.; Záleská, K.; Bárta, O.; Vlčková, K. The relationship between the age at first computer use and students’ perceived competence and autonomy in ICT usage: A mediation analysis. Comput. Educ. 2019, 141, 103614. [Google Scholar] [CrossRef]
- Emre, O.; De Spiegeleare, S. The role of work–life balance and autonomy in the relationship between commuting, employee commitment and well-being. Int. J. Hum. Resour. Manag. 2019, 1–25. [Google Scholar] [CrossRef]
- Castro-Sánchez, M.; Zurita-Ortega, F.; Zafra-Santos, E.; Rodríguez-Fernández, S.; Chacón-Cuberos, R.; Valdivia-Moral, P. Motivation in the practice of judo in non-professional athletes. Rev. Int. De Med. y Cienc. De La Act. Física y el Deporte 2019, 19, 243–258. [Google Scholar] [CrossRef]
- Díaz, X.M.; Mena, C.B.; Celis-Morales, C.; Salas, C.; Valdivia-Moral, P. Effect of a Healthy Eating and Physical Activity Intervention Program on Childhood Obesity. Nutr. Hosp. 2015, 32, 110–117. [Google Scholar] [CrossRef]


| Relationship between Variables | R.W. | S.R.W. | |||||
|---|---|---|---|---|---|---|---|
| Estimations | E.E. | C.R. | p | Estimations | |||
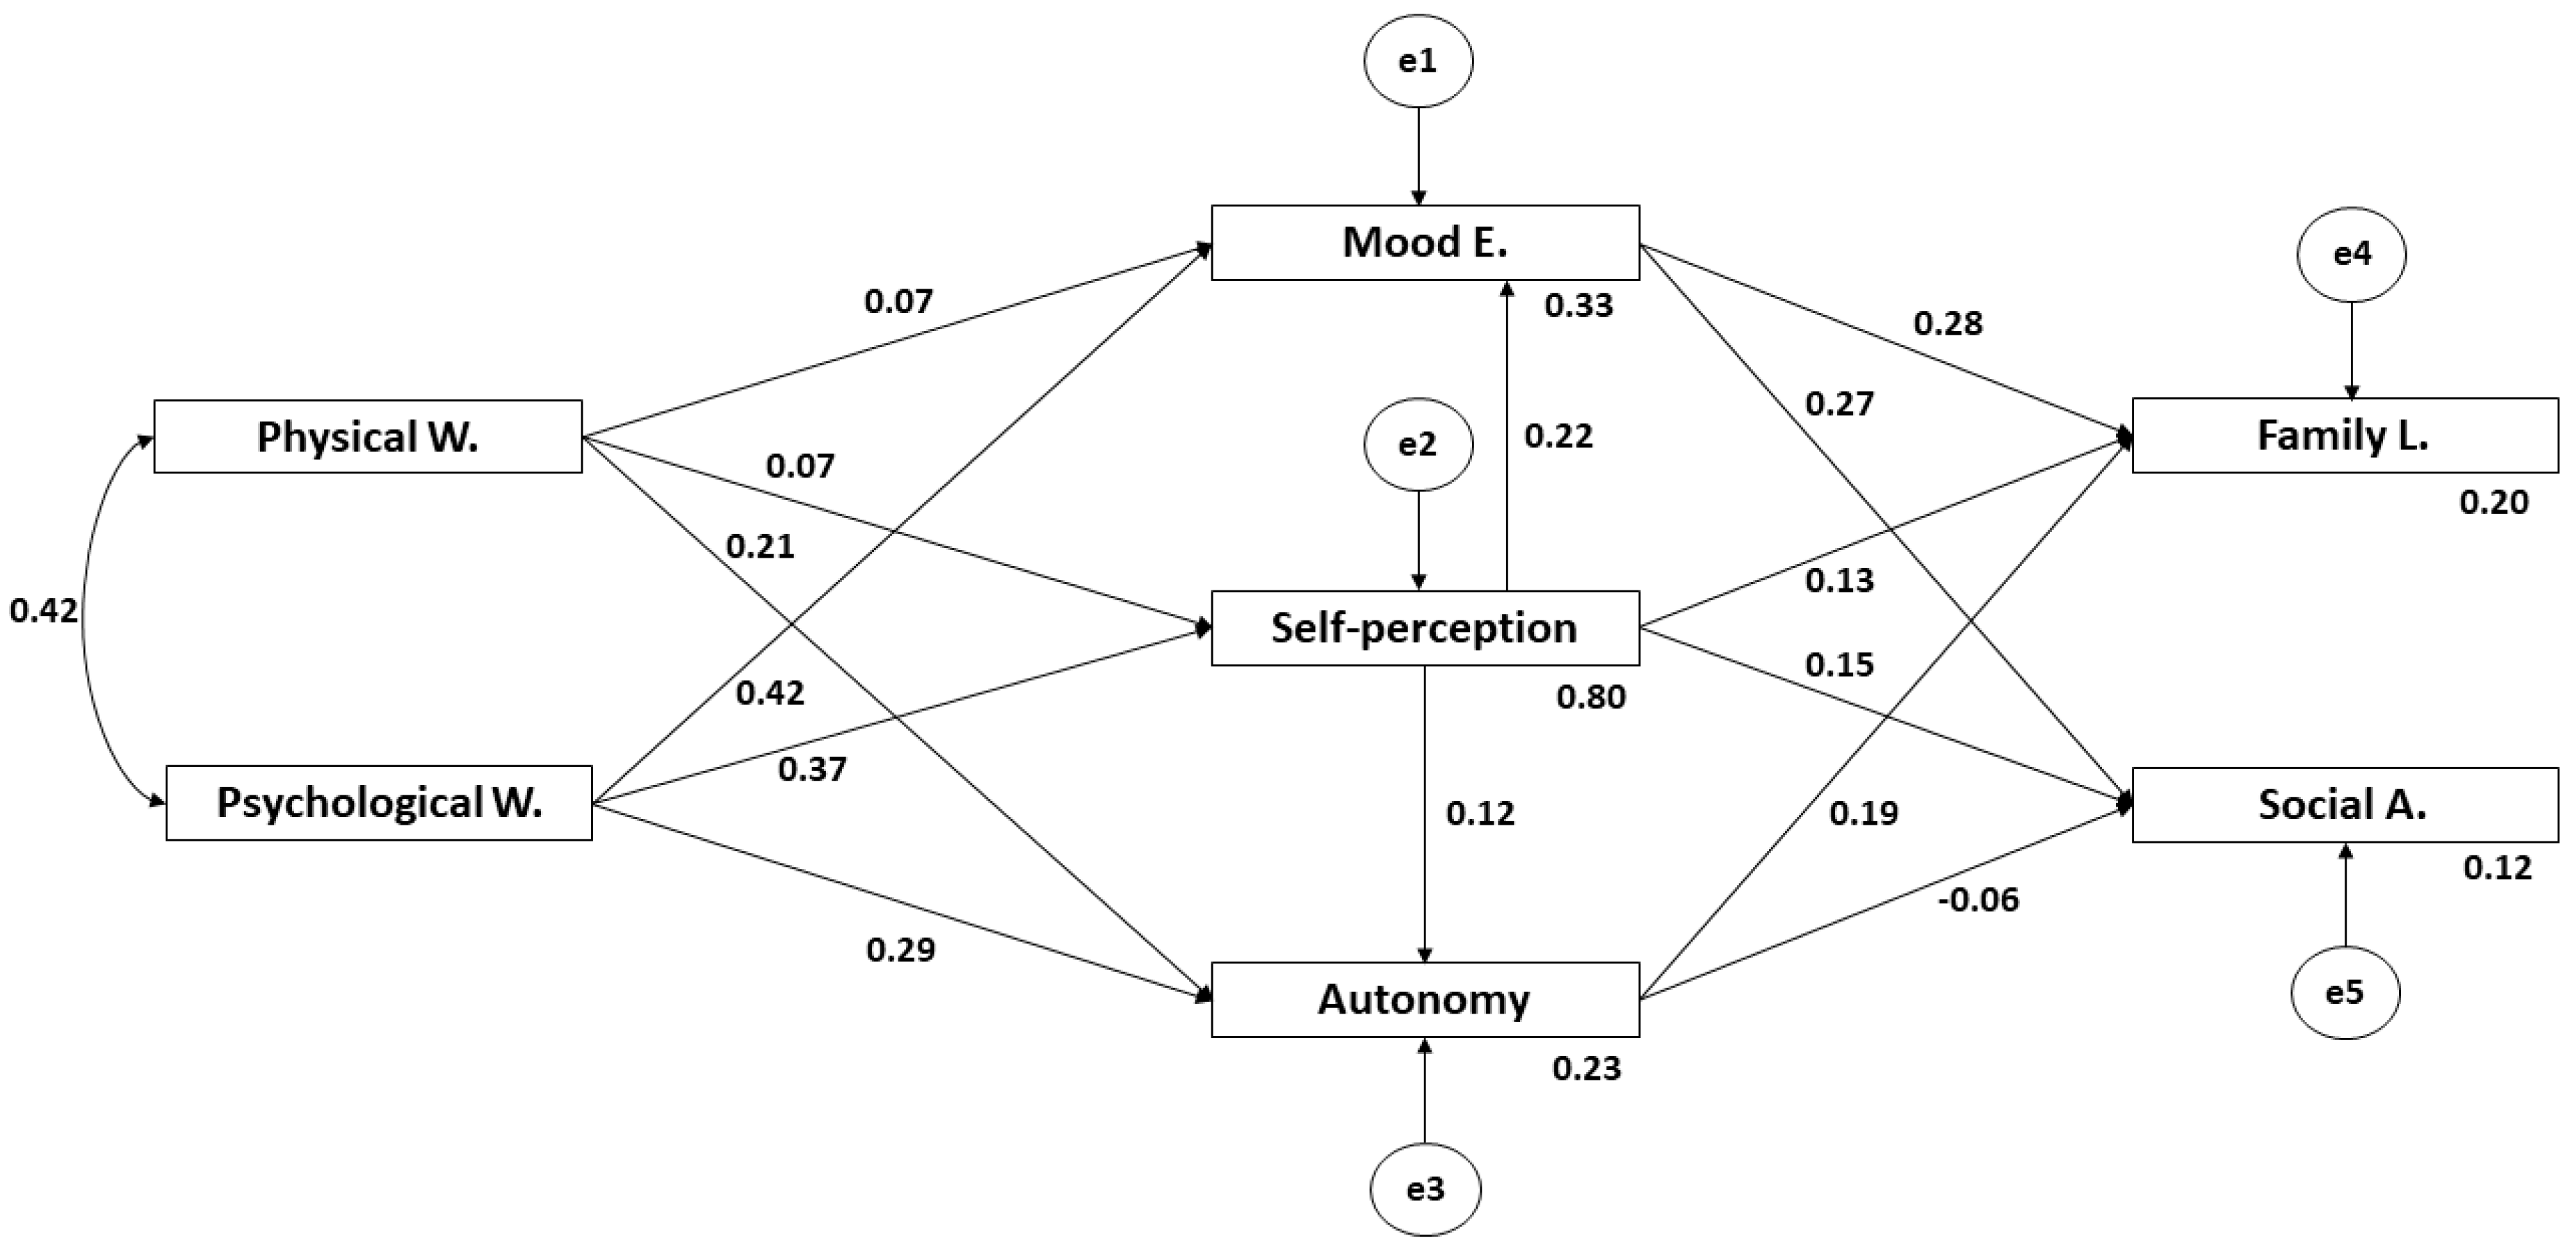
| Self-Perception | ← | Physical W. | 0.055 | 0.019 | 2904 | * | 0.072 |
| Self-Perception | ← | Psychological W. | 0.295 | 0.020 | 15.071 | *** | 0.375 |
| Mood E. | ← | Physical W. | 0.060 | 0.019 | 3092 | * | 0.069 |
| Autonomy | ← | Physical W. | 0.194 | 0.022 | 8743 | *** | 0.210 |
| Autonomy | ← | Psychological W. | 0.272 | 0.024 | 11.238 | *** | 0.287 |
| Mood E. | ← | Psychological W. | 0.373 | 0.021 | 17.548 | *** | 0.417 |
| Autonomy | ← | Self-perception | 0.141 | 0.029 | 4932 | *** | 0.117 |
| Mood E. | ← | Self-perception | 0.253 | 0.025 | 10.049 | *** | 0.222 |
| Family L. | ← | Mood E. | 0.334 | 0.029 | 11.500 | *** | 0.282 |
| Family L. | ← | Self-Perception | 0.175 | 0.033 | 5275 | *** | 0.130 |
| Social A. | ← | Self-Perception | 0.217 | 0.038 | 5759 | *** | 0.149 |
| Family L. | ← | Autonomy | 0.208 | 0.026 | 7960 | *** | 0.186 |
| Social A. | ← | Autonomy | −0.075 | 0.030 | −2.532 | * | −0.062 |
| Social A. | ← | Mood E. | 0.350 | 0.033 | 10.641 | *** | 0.274 |
| Physical W. | Psychological W. | 33.434 | 2.117 | 15.792 | *** | 0.423 | |
© 2020 by the authors. Licensee MDPI, Basel, Switzerland. This article is an open access article distributed under the terms and conditions of the Creative Commons Attribution (CC BY) license (http://creativecommons.org/licenses/by/4.0/).
Share and Cite
Arcila-Arango, J.-C.; Castro-Sánchez, M.; Espoz-Lazo, S.; Cofre-Bolados, C.; Zagalaz-Sánchez, M.L.; Valdivia-Moral, P. Analysis of the Dimensions of Quality of Life in Colombian University Students: Structural Equation Analysis. Int. J. Environ. Res. Public Health 2020, 17, 3578. https://0-doi-org.brum.beds.ac.uk/10.3390/ijerph17103578
Arcila-Arango J-C, Castro-Sánchez M, Espoz-Lazo S, Cofre-Bolados C, Zagalaz-Sánchez ML, Valdivia-Moral P. Analysis of the Dimensions of Quality of Life in Colombian University Students: Structural Equation Analysis. International Journal of Environmental Research and Public Health. 2020; 17(10):3578. https://0-doi-org.brum.beds.ac.uk/10.3390/ijerph17103578
Chicago/Turabian StyleArcila-Arango, Juan-Cancio, Manuel Castro-Sánchez, Sebastian Espoz-Lazo, Cristian Cofre-Bolados, Maria Luisa Zagalaz-Sánchez, and Pedro Valdivia-Moral. 2020. "Analysis of the Dimensions of Quality of Life in Colombian University Students: Structural Equation Analysis" International Journal of Environmental Research and Public Health 17, no. 10: 3578. https://0-doi-org.brum.beds.ac.uk/10.3390/ijerph17103578