1. Introduction
In 2018, the fine particulate matter concentration in Korea was 24 μg/m
3, which is the second highest concentration after Chile when compared to other members of the Organization for Economic Co-operation and Development. This level was approximately two times higher than other advanced countries such as the UK, Japan, and France [
1].
One reason for the increasing concentration of fine particulate matter may be the increase in secondary aerosols. The substances that are involved in the secondary generation of particulate matter include NH
3, SOx, NOx, and volatile organic compounds [
2,
3,
4,
5]. To reduce air pollutants such as particulate matter, several policies have been implemented in Korea [
6,
7,
8]. however, these policies only focus only on the management of NOx and SOx. There is insufficient research regarding the identification of the emission source or the application of the emission factor of NH
3 in Korea.
In Korea, an inventory of air pollutants has been established, which is categorized into manufacturing industry combustion, energy industry combustion, nonindustry combustion, production process, off-road mobile pollution sources, agricultural sources, waste treatment sources, biological combustion, and other sources. Of the air pollutants, NH
3 emission levels of Liquefied Natural Gas (LNG) power are the second highest, after bituminous coal power, in the energy industry combustion category. The 1994 U.S. Environmental Protection Agency (EPA) values were applied to the LNG power plant NH
3 emission factor, which indicates the difficulty of incorporating the unique characteristics in Korea [
9,
10].
In Korea, the NH3 emission source in the production process category at a power plant also includes NH3 emissions due to selective catalytic reduction (SCR). Therefore, the purpose of this study was to analyze and assess NH3 emissions at LNG power facilities in Korea relevant to the emission factor formulation or uncertainty analysis. This study also examined the differences between the currently applied EPA values and emission factors in the U.S. and the application of emission factors in Korea to determine whether the differences are reflected with respect to NH3 emission levels in the two countries.
2. Methods
2.1. Selection of Objective Facilities
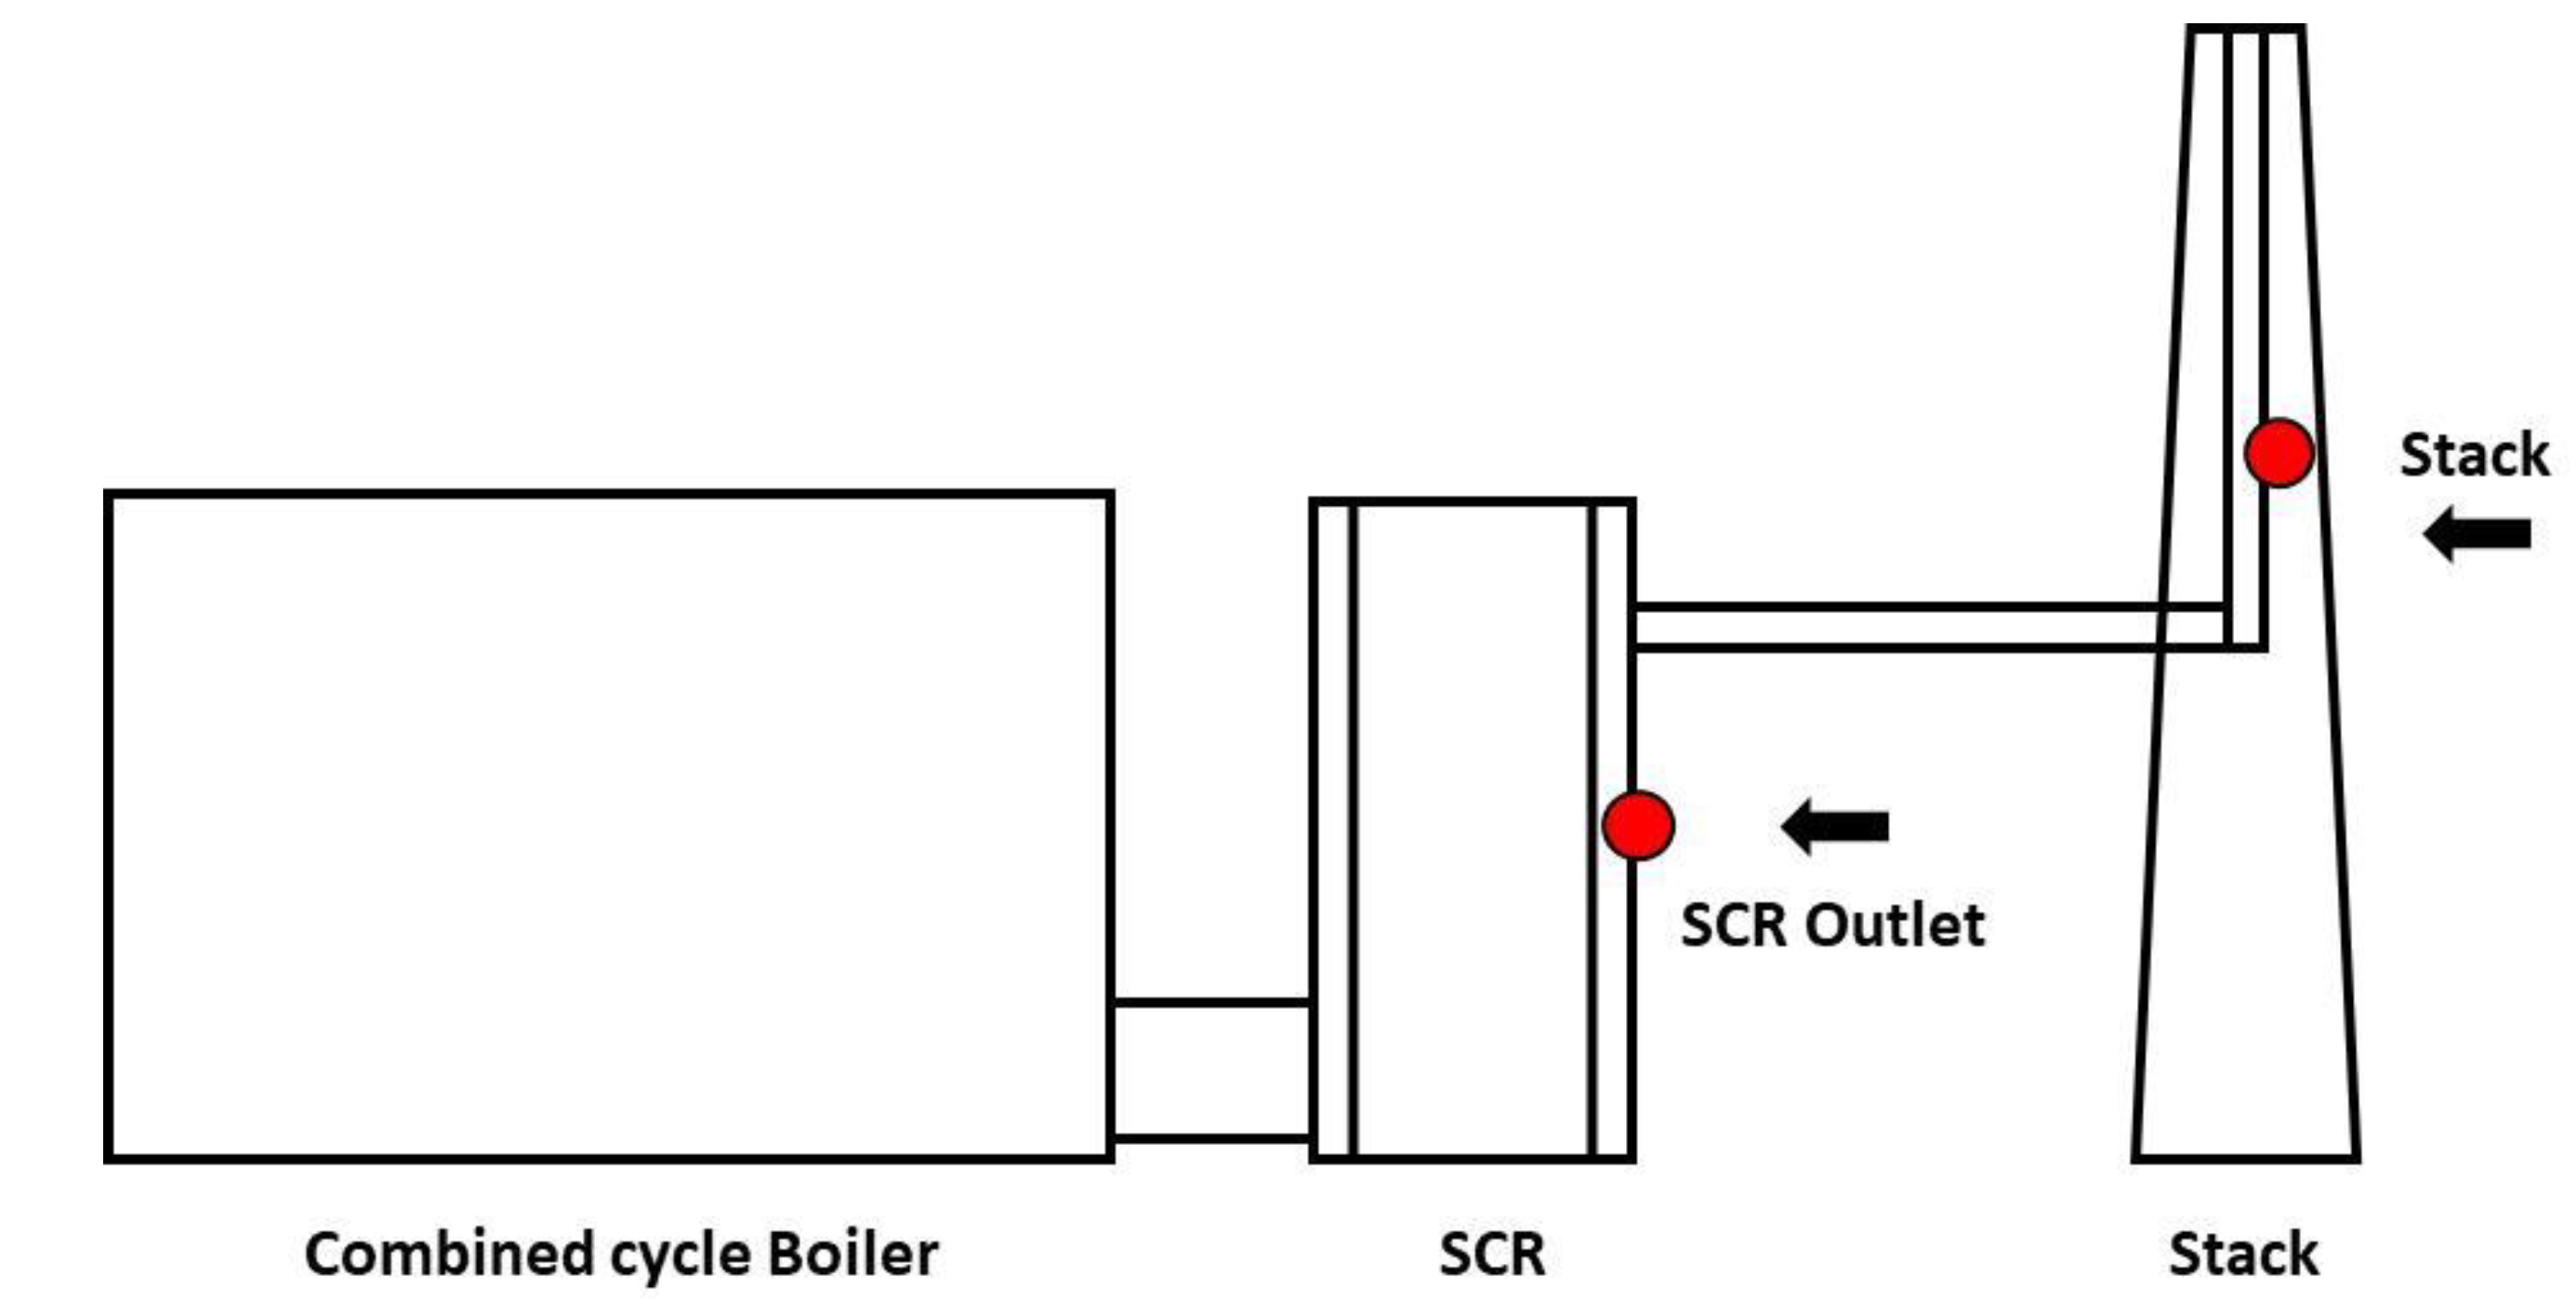
Since most LNG power plants in Korea are almost combined cycle power plants, the sampling target was for LNG combined cycle power plants, and it was difficult to obtain cooperation from the power plants, so only two sites could conduct research. This study collected a minimum of three NH
3 samples from two LNG power plants to identify the NH
3 emission source characteristics. The power generation capacity, daily average fuel consumption, daily average flow rate and number of samples from the power plants are presented in
Table 1.
Additional NH
3 sampling at one of the power plants was concurrently carried out at the SCR outlet to analyze the differences in NH
3 emission sources, with the purpose of potential inventory improvement. Air pollution prevention facilities installed only SCRs, which are NOx reduction facilities, at both LNG plants A and B. The approximate sampling location and related schematic diagram are shown in
Figure 1.
2.2. NH3 Analysis at LNG Power Plants
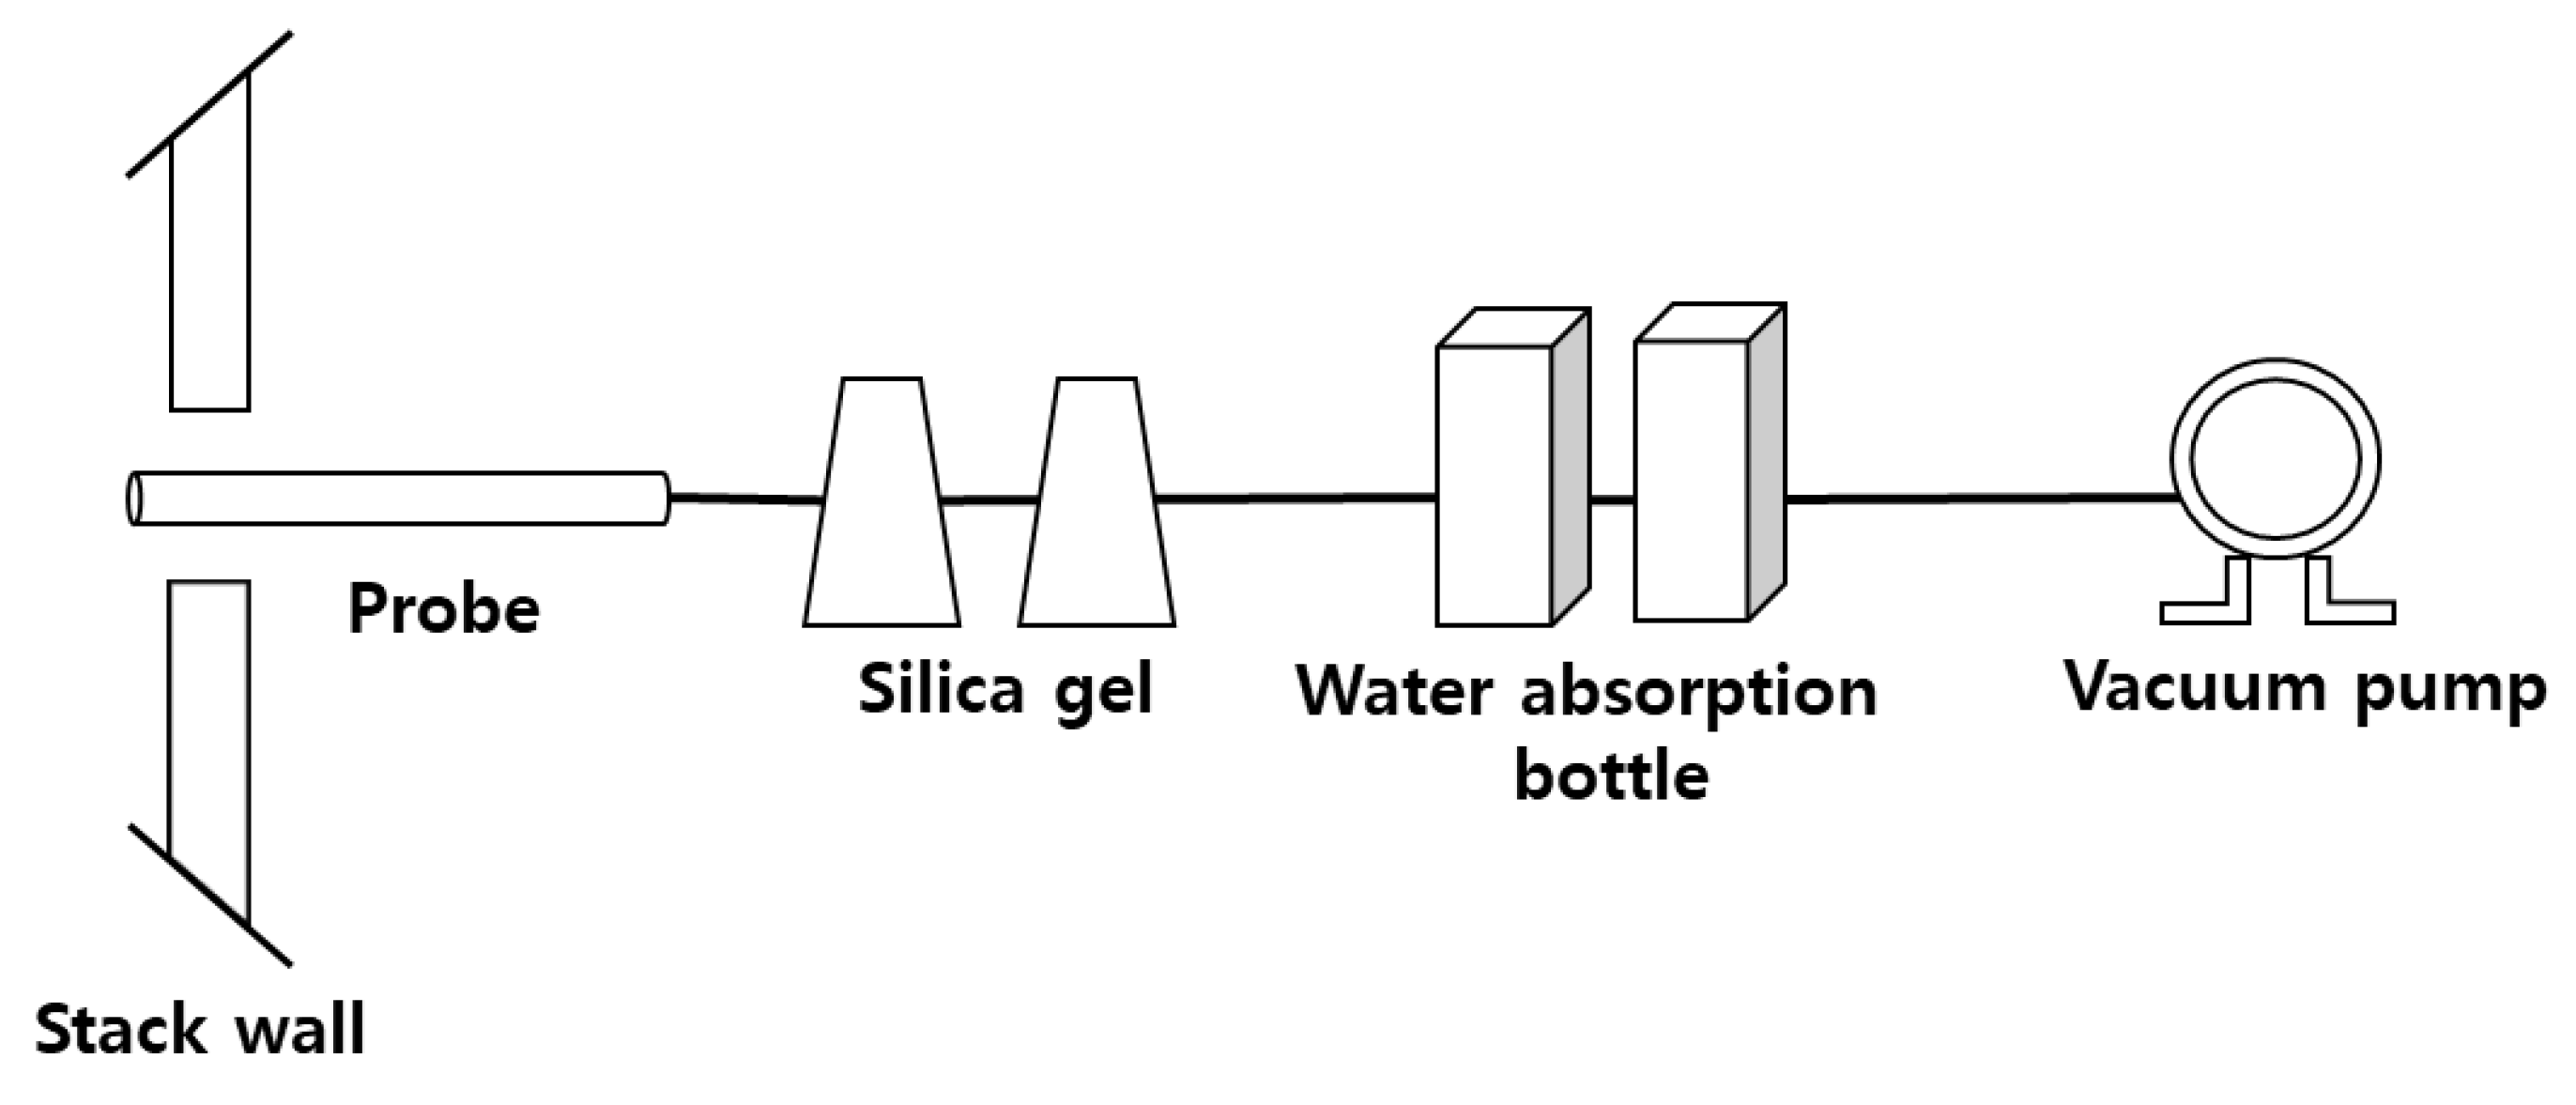
To measure the NH
3 concentration at an LNG power plant, the indophenol method suggested in the odor and air process test methods was used. The indophenol method quantifies NH
3 concentrations based on the absorbance of indophenols generated during the reaction with NH
4+ ions in the analytic sample upon addition of sodium hypochlorite and phenol-sodium nitroprusside solutions. For NH
3 sampling, an NH
3 absorbent (50 mL boric acid solution) was placed in two 50 mL flasks and exhaust gas was added using a minipump at a rate of 4 L/min for 20 min, for a total of 80 L. To remove the moisture from the exhaust gas, a bottle containing silica gel was placed at the entrance of the NH
3 sampling device.
Figure 2 shows a schematic diagram of the NH
3 sampling process. After NH
3 collection, the outside diameter of the absorbent was measured at 640 nm using a spectrophotometer. NH
3 sampling was performed at the power plant stack and the SCR outlet for power plant A and only at the stack for power plant B.
2.3. Development of NH3 Emission Factor
The NH
3 emission factor formula is shown in Equation (1). The development of the NH
3 factor utilized the emission-based emission factor development method, which is a method used for the development of the NH
3 emission factor for bituminous coal power plants and coke of NH
3 emission factor [
11,
12]. This method calculates emissions by multiplying the flow rate of a combustion facility by ammonia concentration and dividing it by fuel consumption to obtain a fuel consumption-based emission factor. In the case of ammonia concentration, the ammonia concentration on the basis of the measurement was calculated and the corresponding flow rate and fuel consumption were provided from the LNG power plant.
where
is emission factor (ton NH
3/10
6Nm
3);
is NH
3 concentration in exhaust gas (ppm, NH
3 μmol/air mol);
is molecular weight of NH
3 (constant) = 17.031 (g/mol NH
3);
is one mole ideal gas volume in standardized condition (constant) = 22.4 (m
3/air mol);
is daily accumulated flow rate (Sm
3/day) (based on dry combustion gas); and
is daily fuel consumption (Nm
3/day).
2.4. Uncertainty Analysis by Monte Carlo Simulation
The Monte Carlo simulation was utilized to estimate the uncertainty of the NH
3 emission factor. This method evaluates the uncertainty by generating random numbers and assigning a probability density function (PDF) to each variable [
13,
14]. The Intergovernmental Panel on Climate Change (IPCC) recommends the Monte Carlo simulation as a Tier 2 method of estimating the uncertainty of greenhouse gas (GHG) emission factors. As shown in
Figure 3, the analysis based on the Monte Carlo simulation involves four steps. The first step selects the appropriate model and composes the NH
3 emission factor estimate work sheet. In the second step, the PDF conformance of the input variable required for development of the NH
3 emission factor is tested. The significance level for the hypothesis testing was set to 5%. In addition, based on the conformance tests of the NH
3 emission concentration, the PDF of the emission flow rate and fuel consumption (which are necessary to determine the NH
3 emission factor) are estimated. The Monte Carlo simulation is performed in step three, where Crystal Ball is used for random sampling simulation. In step four, the uncertainty range is estimated based on the simulated results at a 95% confidence interval.
3. Results and Discussion
3.1. Characteristics of NH3 Emissions
The NH
3 concentration results at power plants A and B are presented in
Table 2. The mean NH
3 concentration at power plant A was 0.05 ppm with a standard deviation of 0.03 ppm. The mean NH
3 concentration at the SCR outlet at power plant A was 0.04 ppm with a standard deviation of 0.02 ppm. The mean NH
3 concentration at power plant B was 0.18 ppm with a standard deviation of 0.17 ppm, which is three times higher than that of power plant A. This is attributed to additional NH
3 utilized in the SCR process at power plant A, which reduces the NO
x concentration; however, the reduction of the unreacted NH
3 leads to its emission through the stack [
11,
12,
15]. Therefore, when the NO
x concentration is relatively low, the concentration of NH
3 being emitted through the stack is higher.
To verify this result, the NO
x data corresponding to the period of measurement at both power plants were obtained for comparison; the NO
x concentrations at power plants A and B were 7.62 and 4.43 ppm, respectively. The higher NH
3 emission at power plant B is believed to be the result of the additional NH
3 being used to reduce the level of NO
x, allowing a higher concentration of NH
3 to escape. This suggests that the related studies also showed the effects of NO
x reduction, and thus the relationship between NO
x and NH
3 is inversely proportional [
11,
12,
15]. Therefore, it is judged that the impact of the reduction of NO
x will be greater.
Currently in Korea, NH
3 emission sources from LNG power plants are divided into two processes, energy fuel combustion and production, for the purpose of estimating the level of NH
3 emissions. For the power plants utilized in this study, a separate SCR installation was not required and no additional processes following the SCR process caused exhaust gas emission through the stack, which led to the hypothesis that there would be no significant differences. To verify this, the mean distribution of the NH
3 concentration based on the SCR and stack measurements at power plant A were compared by statistical analysis utilizing the SPSS 21(IBM) software. In general, when the number of samples is small, a nonparametric analysis can be carried out [
16,
17]. Therefore, due to the small number of NH
3 samples at the SCR outlet and stack of power plant A, this study performed the comparison through mean correspondence utilizing the Wilcoxon signed-rank test, which is used for nonparametric distributions. The Wilcoxon signed-rank test compares the sum of the higher ranks, the median, and the sum of the lower ranks, after subtracting the median from the sample data and converting the resulting values into rank data. Therefore, the test takes into account sample data that are higher or lower than the median and the relative data size [
18,
19,
20].
The results of the Wilcoxon signed-rank test, presented in
Table 3, show that the level of significance was greater than 0.05, which indicates no significant difference in the median range of the NH
3 concentration between the SCR outlet and the stack of both power plants, preserving the null hypothesis. Based on these results, it is not necessary to estimate the NH
3 emission levels at LNG power plants separately for the energy fuel combustion and industrial process sectors.
3.2. NH3 Emission Factor and Comparison of NH3 Emissions
For this study, a total of 21 NH
3 samples were collected at the stacks of power plants A and B, and an NH
3 emission factor was calculated for the power plants. An NH
3 emission factor was also calculated for the SCR outlet at power plant A. The emission factor results are presented in
Table 4.
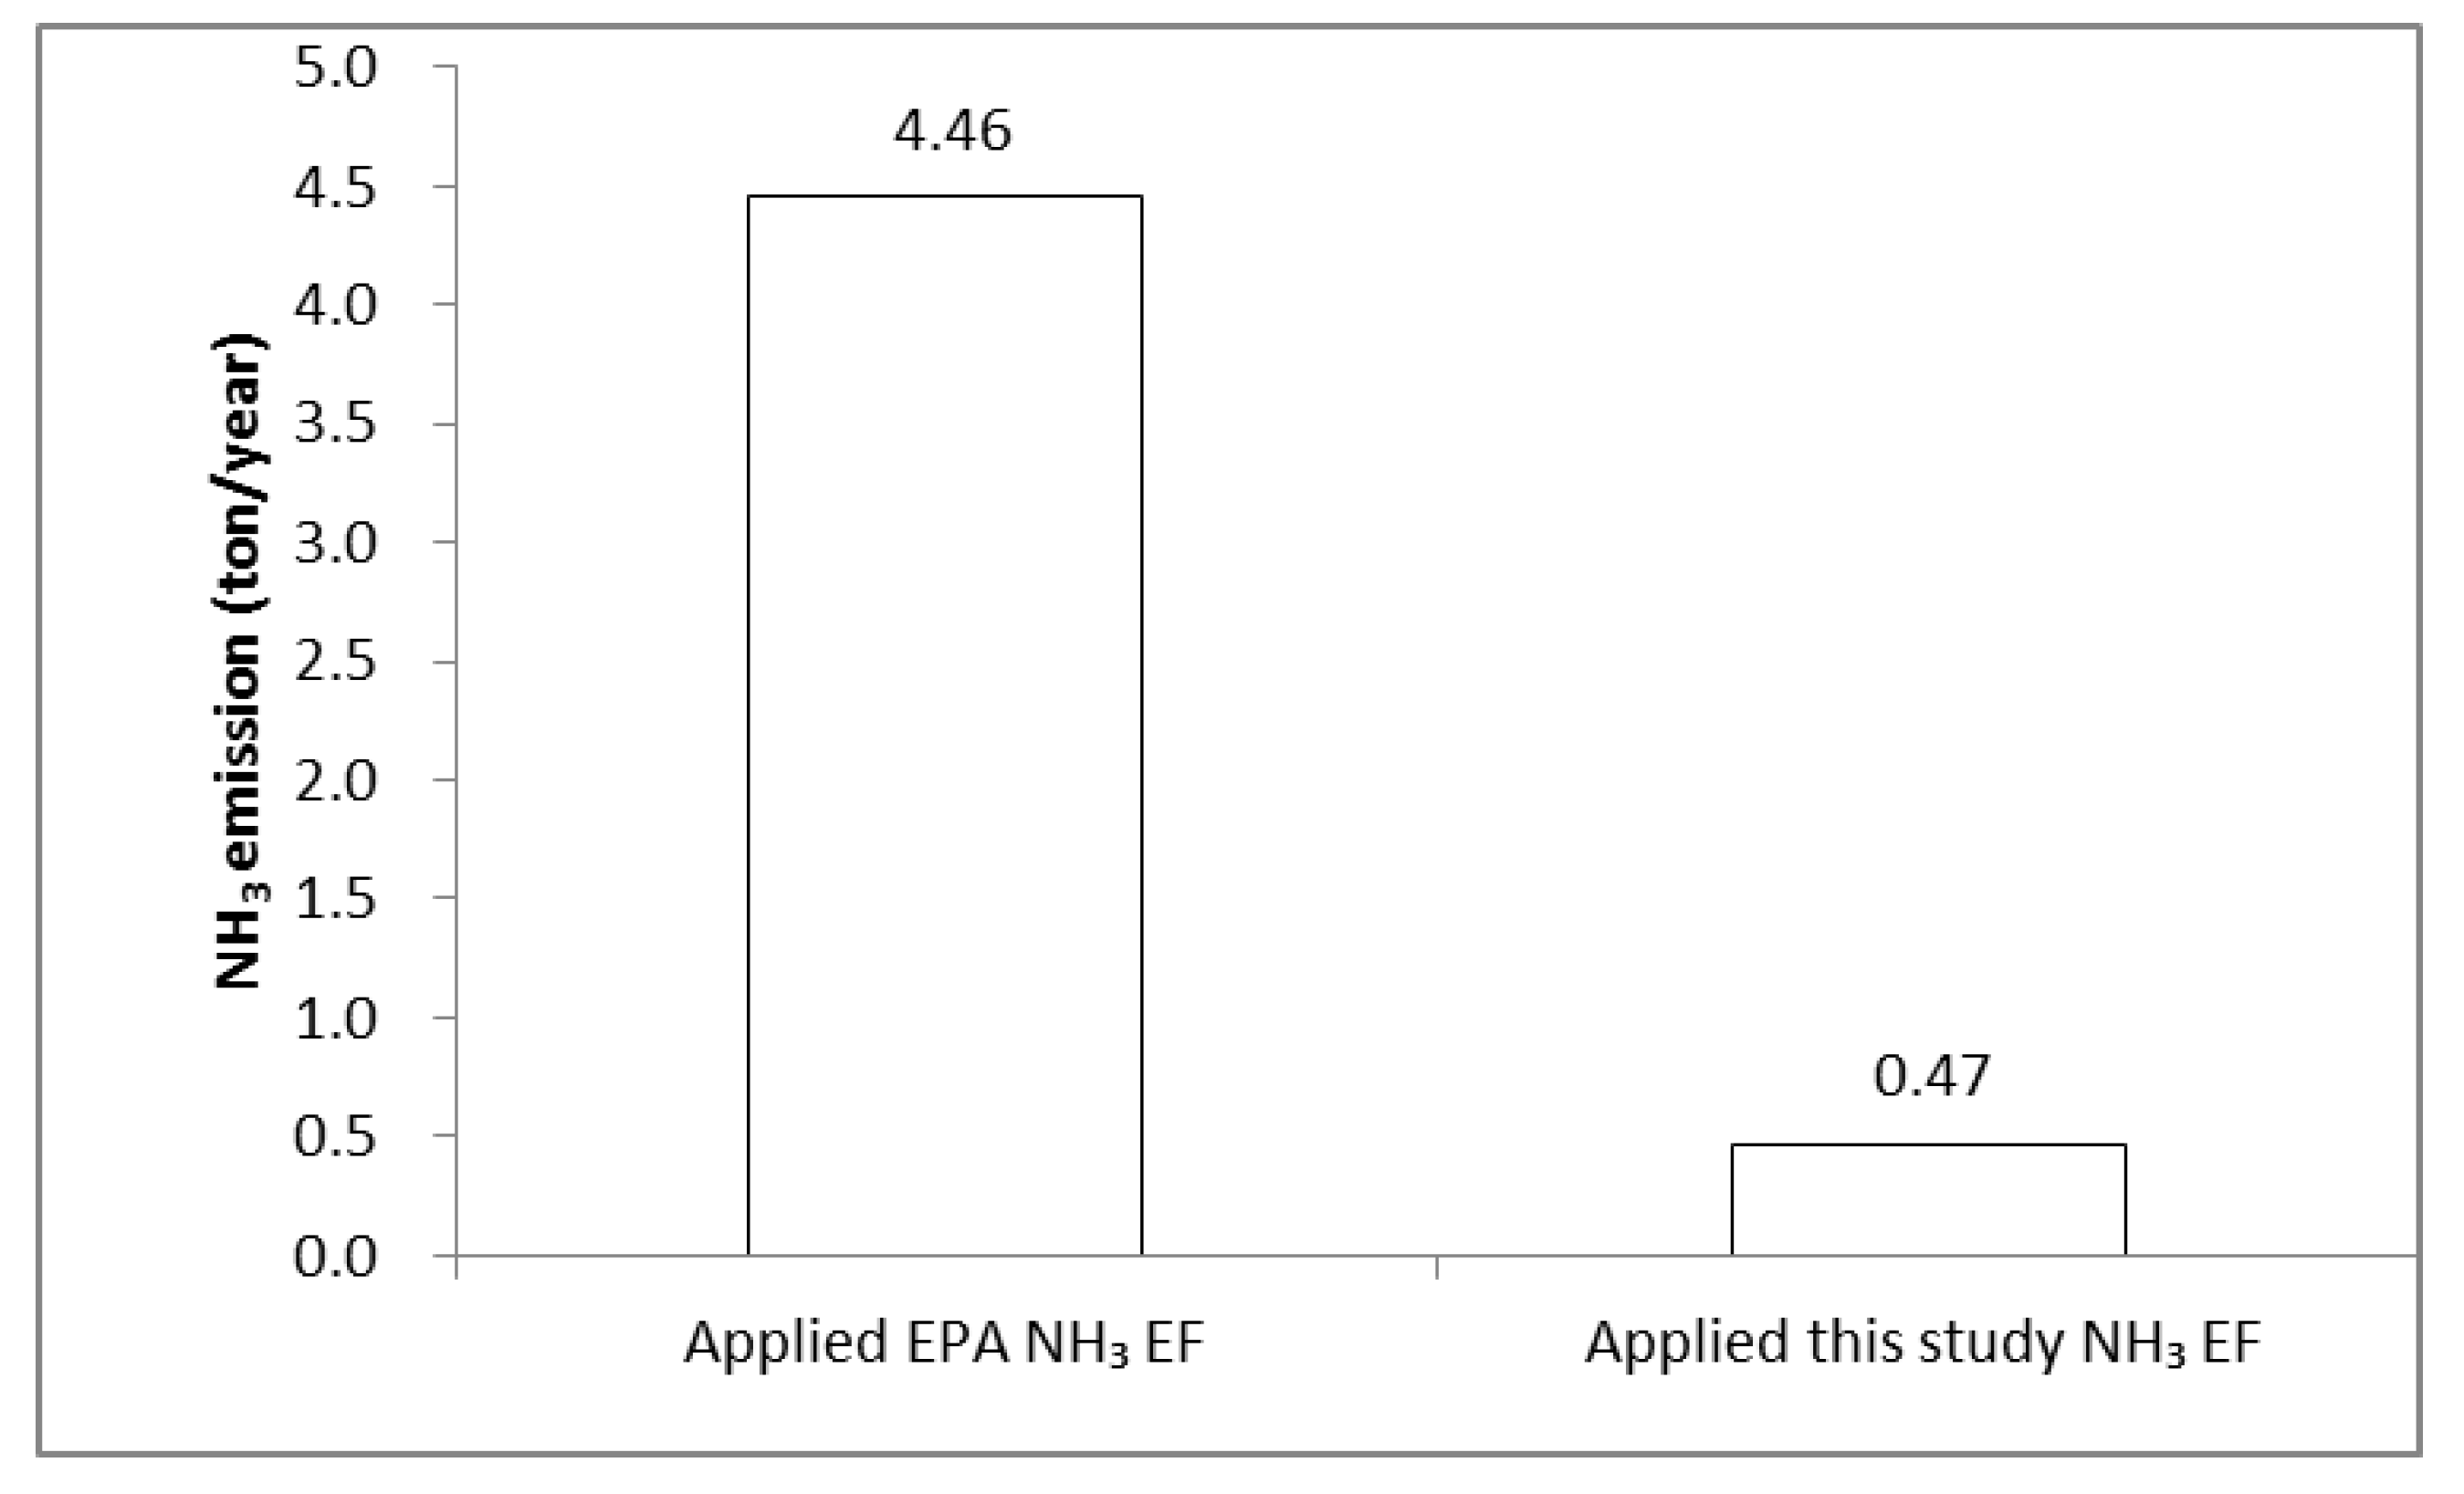
The results showed that the NH3 emission factor for the power plant stacks was 0.0054 ton NH3/m3, which is approximately nine times less than the U.S. EPA NH3 emission factor of 0.051 ton NH3/m3, currently applied in national statistics in Korea for LNG fuels in the industrial energy combustion sector. The SCR emission factor for power plant A was 0.0010 ton NH3/m3, which is considerably lower than 0.146 ton NH3/m3, the U.S. EPA NH3 emission factor currently applied in national statistics in Korea for LNG fuels in the industrial process sector. The results indicated substantial differences from the U.S. EPA emission factors currently applied in national statistics in Korea; therefore, an NH3 emission factor that incorporates Korean characteristics should be developed.
The emission factor for the LNG stack developed in this study and the EPA emission factor applied in conventional statistics in Korea were applied (fuel consumption of Korean LNG power plants in 2016: 87,395,623 Nm
3/year), and the differences in the NH
3 emission levels for LNG power plants were compared. The results of this comparison are presented in
Figure 4.
The NH3 emission level estimated by applying the emission factor developed in this study was 0.47 ton NH3/year, a difference of approximately 3.99 ton from the NH3 emission level estimated by applying the conventional EPA emission factor of 4.46 ton NH3/year. Thus, NH3 emission factors reflecting the characteristics in Korea should be developed in order to improve the reliability of the inventory
3.3. Uncertainty of NH3 Emission Factor
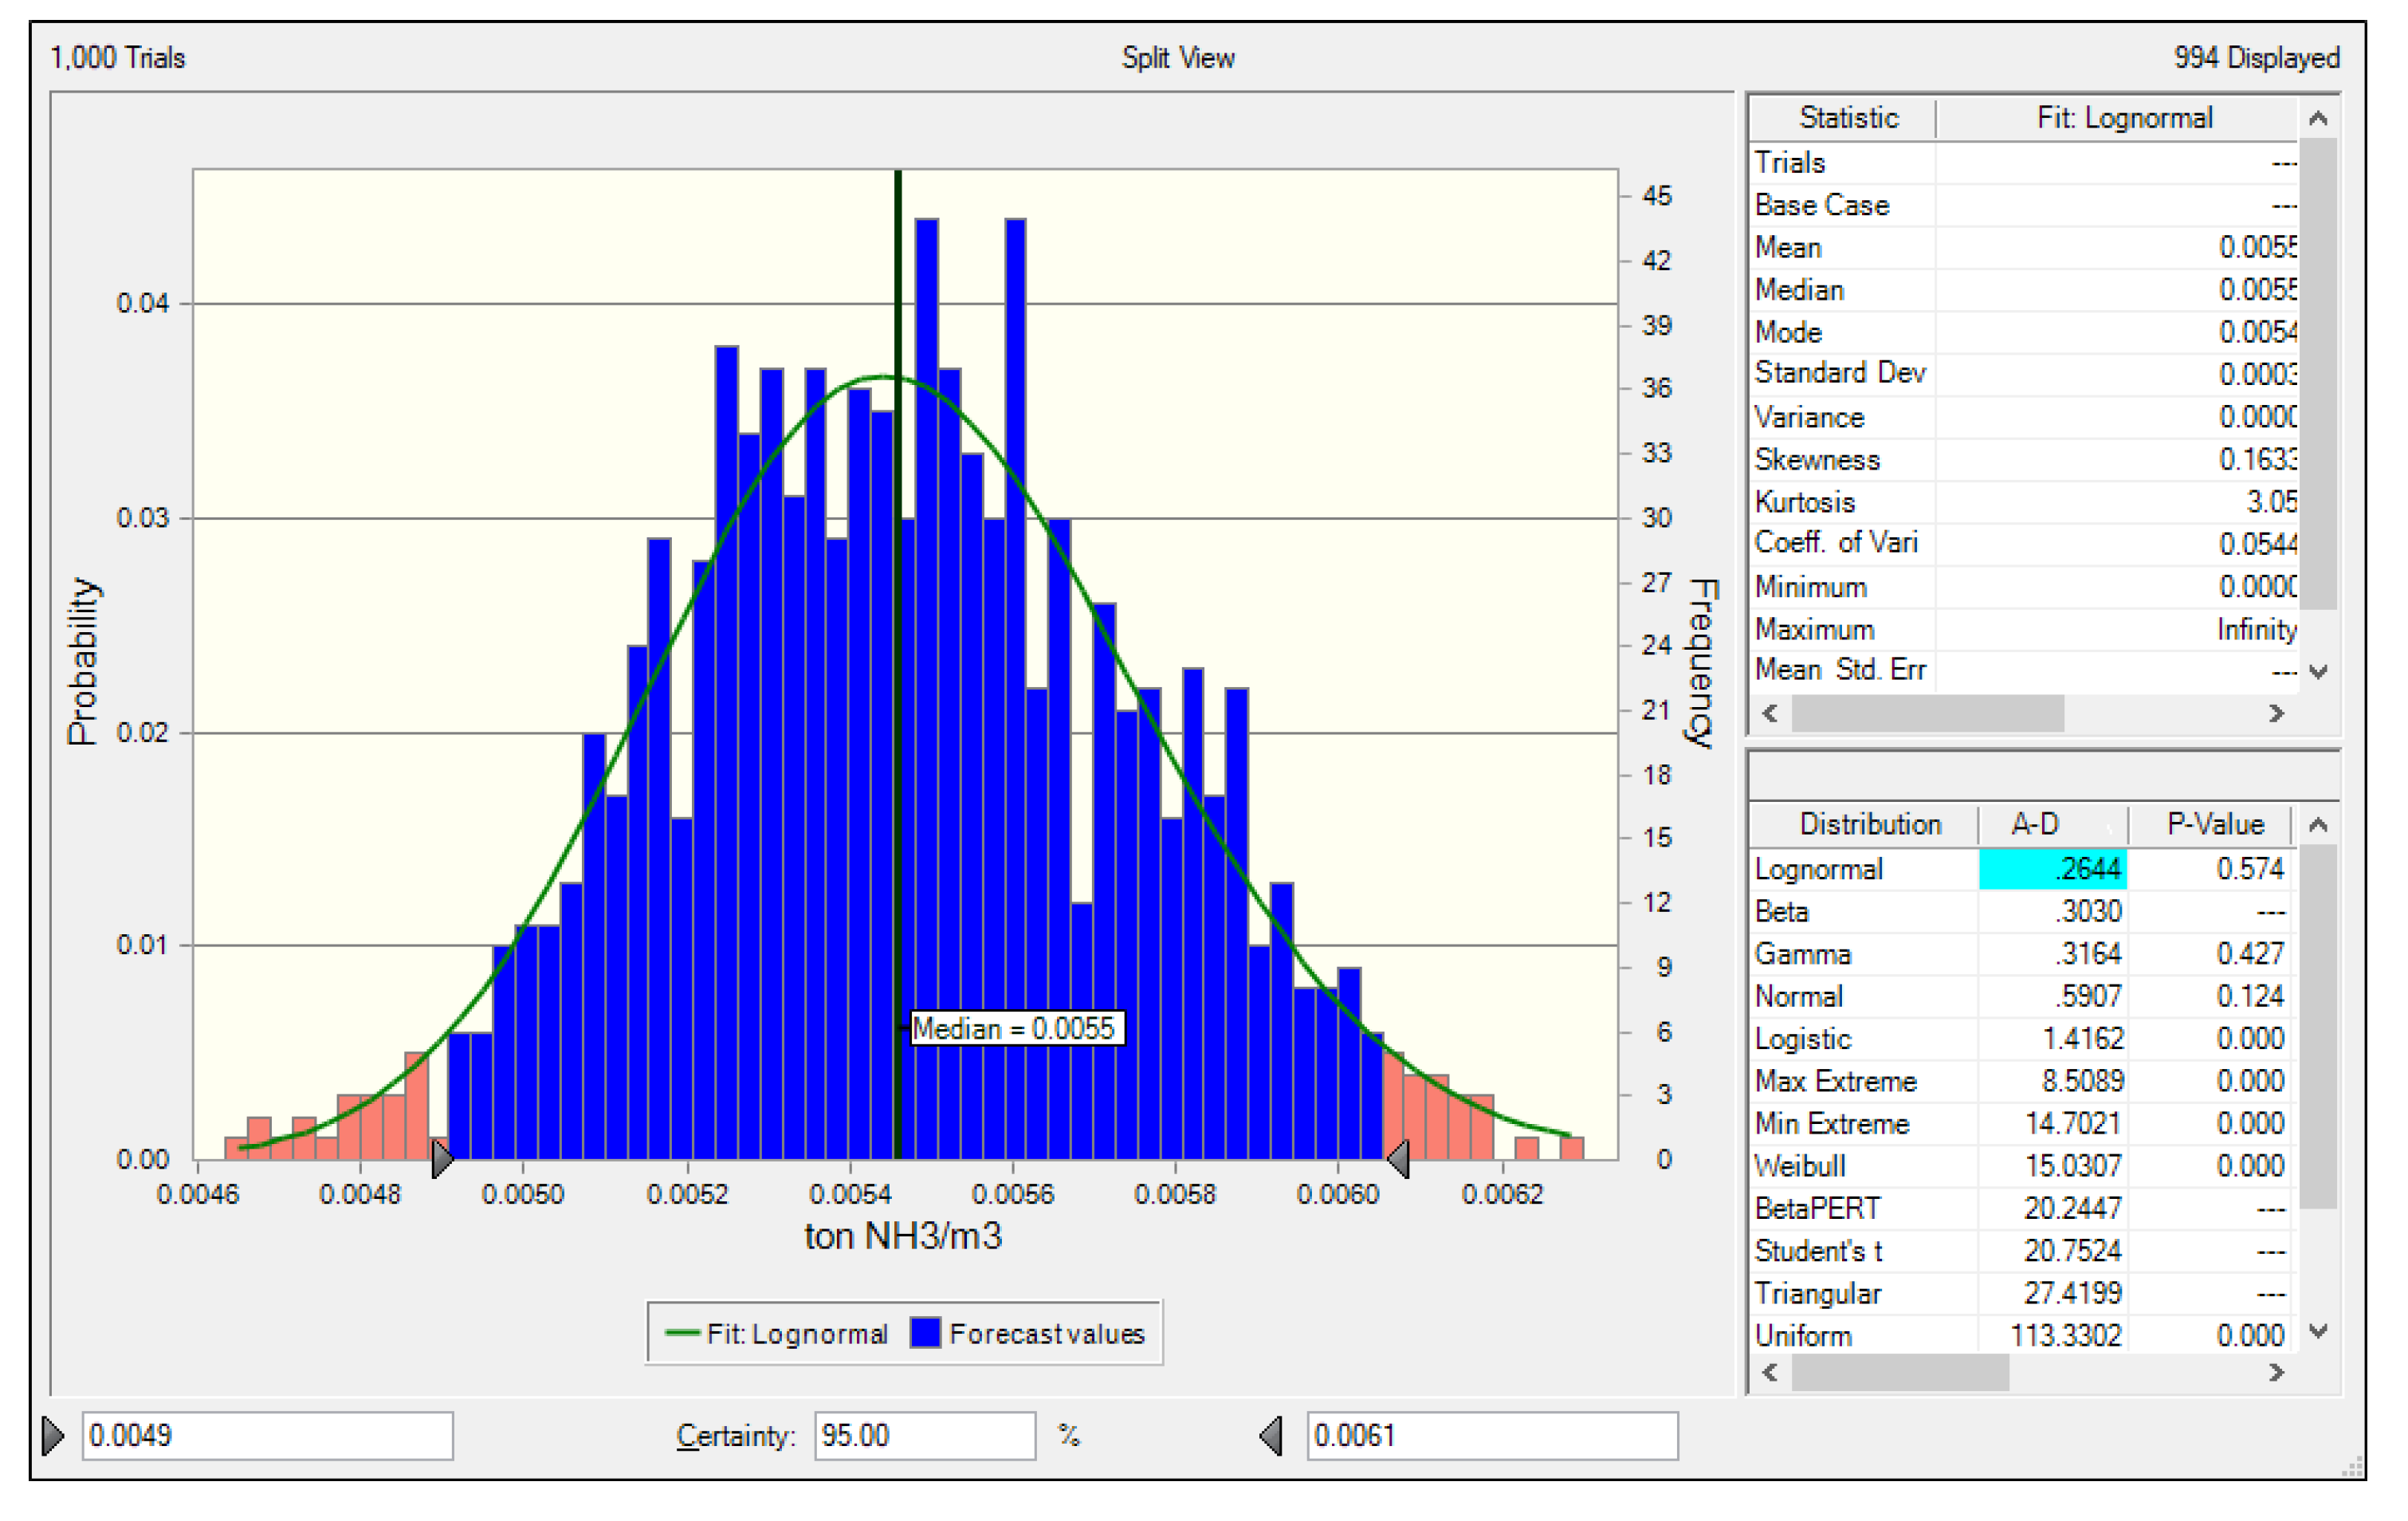
The Monte Carlo simulation was used to estimate the uncertainty of the NH
3 emission factor for LNG power plants developed in this study, and the results are presented in
Figure 5 and
Figure 6. The PDF of the NH
3 emission factor for the LNG power plant stack developed in this study indicated a lognormal distribution. The median was 0.0055 ton NH
3/10
6Nm
3 at a 95% confidence level, the lower 2.5% was 0.0049 ton NH
3/10
6Nm
3, and the upper 97.5% was 0.0061 ton NH
3/10
6Nm
3. Using these values, the estimated uncertainty range of the NH
3 emission factor was ±10.91% at a 95% confidence level.
The PDF of the NH3 emission factor for the SCR outlet of the LNG power plant also indicated a lognormal distribution. The median was 0.0010 ton NH3/106Nm3 at a 95% confidence level, the lower 2.5% was 0.0009 ton NH3/106Nm3, and the upper 97.5% was 0.0012 ton NH3/106Nm3. Using these values, the estimated uncertainty range of the NH3 emission factor was –10% to +20% at a 95% confidence level, which is a slightly higher range than that of the LNG stack.
Currently, the NH
3 uncertainty range and numerical values are not available, which makes case comparison difficult. In Korea, the uncertainty of air pollutants is evaluated by the DARS (Data Attribute Rating System). Although the data rating system suggests several methods for converting various characteristics of the inventory into scores, such scores are based on the decision of experts and consequently dependent on subjective assessments, which poses limitations to the application of such scores as uncertainty values in practice [
21]. Consequently, a quantitative assessment would be possible if the uncertainty range could be provided for air pollutants as it is for GHGs.
4. Conclusions
This study developed the NH3 emission factor for LNG power facilities in Korea by analyzing the emission characteristics from two LNG power plants using methods such as uncertainty analysis and comparing the differences in NH3 emission levels between the developed emission factors, which reflect the characteristics in Korea, and the U.S. EPA values currently applied in Korea. The study also analyzed the potential inventory improvement based on the differences in NH3 emissions from different sources.
Analyzing the NH3 concentrations at the LNG power plants showed a mean of 0.05 and 0.18 ppm for power plants A and B, respectively, indicating a substantial difference in the NH3 concentration, which was caused by the influence of the NOx concentration. In addition, the NH3 concentration at the SCR outlet of power plant A was 0.04 ppm, showing no significant difference from the 0.05 ppm concentration at the stack. Furthermore, the statistical comparison found no difference between the emission factor based on NH3 concentration at the SCR outlet versus the stack as the final outlet. Therefore, it is preferable to apply the NH3 emission factor at the stack.
The estimation showed that the NH3 emission factor for the LNG power plants was 0.0054 ton NH3/106Nm3, which is approximately nine times less than the EPA NH3 emission factor of 0.051 ton NH3/106Nm3 for LNG fuels of the industrial energy combustion sector currently applied in national statistics in Korea. The SCR emission factor for LNG power plants was 0.0010 ton NH3/106Nm3, which is considerably lower than the EPA NH3 emission factor of 0.146 ton NH3/106Nm3 currently applied in national statistics in Korea for the LNG fuels of the industrial process sector. Furthermore, comparing the NH3 emission levels after applying the NH3 emission factor developed in this study to the EPA NH3 emission factor showed a difference of 3.99 ton NH3/year. This indicated the need for developing an emission factor that incorporates the unique characteristics in Korea.
The uncertainty range of the LNG stack NH3 emission factor developed in this study was ±10.91% at a 95% confidence level, while that of the SCR NH3 emission factor was –10% to +20% at a 95% confidence level, indicating a slightly higher uncertainty range than the LNG stack. At present, quantitative analysis of air pollutants is difficult because numerical values of the uncertainty are not available. However, quantitative analysis might be possible using the methods applied in this study to estimate uncertainty.
Two power plants were utilized in this study to investigate the NH3 emission factor and characteristics. This study’s significance mentioned the necessity of developing an NH3 emission factor that reflects the national characteristics by showing the difference and related characteristics between the NH3 emission factor and the measurement-based emission factor related to LNG plants currently applied in Korea. In addition, there are not many studies related to the NH3 emission from power plants, so it makes sense that a value that can be actually referenced was presented while presenting the relevant concentration range. However, it was not able to proceed due to certain consultation limitations with the power plant, such as seasonal effects and plant size-specific effects. In the future, if research is conducted on more LNG plants under smooth consultation, an NH3 emission factor that reflects Korea’s characteristics will be developed, and it will also help improve NH3 emission inventory reliability.
Author Contributions
All authors contributed to the research presented in this work. Their contributions are presented below. Conceptualization, E.-C.J.; methodology and writing—original draft preparation, S.K.; data curation, S.-D.K. All authors have read and agreed to the published version of the manuscript.
Funding
This work is supported by Korea Ministry of Environment (MOE) and Korea Environment Corporation
Acknowledgments
This work is financially supported by Korea Ministry of Environment (MOE) as Graduate School specialized in Climate Change.
Conflicts of Interest
The authors declare no conflict of interest.
References
- IQAir AirVisual. 2018 WORLD AIR QUALITY REPORT Region & City PM2.5 Ranking; IQAir AirVisual: Goldach, Swiss, 2019. [Google Scholar]
- Weixiang, Z.; Philip, K.H. Source apportionment for ambient particles in the San Gorgonio wilderness. Atmos. Environ. 2004, 38, 5901–5910. [Google Scholar] [CrossRef]
- Gibson, M.D.; Pierce, J.R.; Waugh, D.; Kuchta, J.S.; Chisholm, L.; Duck, T.J.; Hopper, J.T.; Beauchamp, S.; King, G.H.; Franklin, J.E.; et al. Identifying the sources driving observed PM2.5 temporal variability over Halifax, Nova Scotia, during BORTAS-B. Atmos. Chem. Phys. 2013, 13, 7199–7213. [Google Scholar] [CrossRef] [Green Version]
- Ahmad, M.; Cheng, S.; Yu, Q.; Qin, W.; Zhang, Y.; Chen, J. Chemical and source characterization of PM2.5 in summertime in severely polluted Lahore, Pakistan. Atmos. Res. 2020, 234, 104715. [Google Scholar] [CrossRef]
- Agarwal, A.; Satsangi, A.; Lakhani, A.; Kumari, K.M. Seasonal and spatial variability of secondary inorganic aerosols in PM2.5 at Agra: Source apportionment through receptor models. Chemosphere 2020, 242, 125–132. [Google Scholar] [CrossRef] [PubMed]
- Environmental Preservation Association. POLICY & ISSUES Environment column: Air Pollutant Total Management System. Environ. Inf. 2015, 416, 2–5. [Google Scholar]
- Rhee, V.A. Reveiw of the Special Act on the Seoul Metropolitan Air Improvement: The Total Mass emissions Managements and the Tradable Permit Programs. Public Law J. 2007, 8, 255–280. [Google Scholar]
- Moon, T.H.; Hur, J.W. Linking the Total Pollution Load Management System (TPLMS) and the Total Industrial Site Volume Control System (ISVCS) in the Capital Region, Korea. J. Korea Plan. Assoc. 2009, 44, 19–30. [Google Scholar]
- NIER (National Institute of Environmental Research in Korea). 2016 National Air Pollutants Emission; National Institute of Environmental Research in Korea: Incheon, Korea, 2019.
- U.S. Environmental Protection Agency. Development and Selection of Ammonia Emission Factors Final Report; U.S. Environmental Protection Agency: Washington, DC, USA, 1994.
- Kang, S.M.; Hong, Y.J.; Kim, S.D.; Jeon, E.C. Ammonia Emission Factors and Uncertainties of Coke Oven Gases in Iron and Steel Industries. Sustainability 2020, 12, 3518. [Google Scholar] [CrossRef]
- Kang, S.M.; Kim, S.D.; Jeon, E.C. Emission Characteristics of Ammonia at Bituminous Coal Power Plant. Energies 2020, 13, 1534. [Google Scholar] [CrossRef] [Green Version]
- Law, A.M.; Kelton, W.D. Simulation Modeling and Analysis; McGraw-Hill: New York, NY, USA, 1991. [Google Scholar]
- Winiwarter, W.; Rypdal, K. Assessing the uncertainty associated with national greenhouse gas emission inventories: A case study for Austria. Atmos. Environ. 2001, 35, 5425–5440. [Google Scholar] [CrossRef]
- Zhang, L.; Pierce, J.; Leung, V.L.; Wang, D.; Epling, W.S. Characterization of Ceria’s Interaction with NOx and NH3. J. Phys. Chem. C 2013, 117, 8282–8289. [Google Scholar] [CrossRef]
- De Winter, P.; Cahusac, P.M. Starting out in Statistics: An Introduction for Students of Human Health, Disease, and Psychology; John Wiley & Sons: Hoboken, NJ, USA, 2014. [Google Scholar]
- Gibbons, J.D.; Chakraborti, S. Nonparametric Statistical Inference Fourth Edition, Revised and Expanded; Marcel Dekker: New York, NY, USA, 2003. [Google Scholar]
- Jijun, S. SPSS/AMOS Statistical Analysis Method; 21st Century History: Paju, Korea, 2015. [Google Scholar]
- Moon, Y.I. A Study on Wilcoxon Signed-Rank Statistic. Ph.D. Thesis, Dankook University Graduate School, Yongin-si, Gyeonggi-do, Korea, 1995. [Google Scholar]
- Taheri, S.M.; Hesamian, G. A generalization of the Wilcoxon signed-rank test and its applications. Stat. Papers. 2013, 54, 457–470. [Google Scholar] [CrossRef]
- IPCC. The 2006 IPCC Guidelines for National Greenhouse Gas Inventories. In General Guidance and Reporting; IPCC: Geneva, Switzerland, 2006. [Google Scholar]
© 2020 by the authors. Licensee MDPI, Basel, Switzerland. This article is an open access article distributed under the terms and conditions of the Creative Commons Attribution (CC BY) license (http://creativecommons.org/licenses/by/4.0/).


