Revising BMI Cut-Off Points for Obesity in a Weight Management Setting in Lebanon


Abstract
:1. Introduction
2. Materials and Methods
- Females:
- 20–39 years: BF% ≥ 39%
- 40–59 years: BF% ≥ 40%
- 60–79 years: BF% ≥ 42%
- Males:
- 20–39 years: BF% ≥ 25%
- 40–59 years: BF% ≥ 28%
- 60–79 years: BF% ≥ 30%
Statistical Analysis
3. Results
4. Discussion
5. Conclusions
Supplementary Materials
Author Contributions
Funding
Conflicts of Interest
References
- Reilly, J.J.; El-Hamdouchi, A.; Diouf, A.; Monyeki, A.; Somda, S.A. Determining the worldwide prevalence of obesity. Lancet 2018, 391, 1773–1774. [Google Scholar] [CrossRef]
- Pi-Sunyer, X. The medical risks of obesity. Postgrad Med. 2009, 121, 21–33. [Google Scholar] [CrossRef] [PubMed]
- Sarwer, D.B.; Polonsky, H.M. The Psychosocial Burden of Obesity. Endocrinol. Metab. Clin. N. Am. 2016, 45, 677–688. [Google Scholar] [CrossRef] [PubMed]
- El Ghoch, M.; Calugi, S.; Dalle Grave, R. The Effects of Low-Carbohydrate Diets on Psychosocial Outcomes in Obesity/Overweight: A Systematic Review of Randomized, Controlled Studies. Nutrients 2016, 8, 402. [Google Scholar] [CrossRef] [Green Version]
- Abdelaal, M.; le Roux, C.W.; Docherty, N.G. Morbidity and mortality associated with obesity. Ann. Transl. Med. 2017, 5, 161. [Google Scholar] [CrossRef] [Green Version]
- Wadden, T.A.; Tronieri, J.S.; Butryn, M.L. Lifestyle modification approaches for the treatment of obesity in adults. Am. Psychol. 2020, 75, 235–251. [Google Scholar] [CrossRef] [PubMed]
- Toplak, H.; Woodward, E.; Yumuk, V.; Oppert, J.M.; Halford, J.C.; Fruhbeck, G. 2014 EASO Position Statement on the Use of Anti-Obesity Drugs. Obes. Facts 2015, 8, 166–174. [Google Scholar] [CrossRef]
- Fried, M.; Yumuk, V.; Oppert, J.M.; Scopinaro, N.; Torres, A.J.; Weiner, R.; Yashkov, Y.; Fruhbeck, G. European Association for the Study of O, International Federation for the Surgery of Obesity—European, C. Interdisciplinary European Guidelines on metabolic and bariatric surgery. Obes Facts 2013, 6, 449–468. [Google Scholar] [CrossRef]
- World Health Organization. Obesity: Preventing and Managing the Global Epidemic; World Health Organization: Geneva, Switzerland, 1998. [Google Scholar]
- Weir, C.B.; Jan, A. BMI Classification Percentile and Cut Off Points; StatPearls: Treasure Island, NV, USA, 2020. [Google Scholar]
- Pasco, J.A.; Holloway, K.L.; Dobbins, A.G.; Kotowicz, M.A.; Williams, L.J.; Brennan, S.L. Body mass index and measures of body fat for defining obesity and underweight: A cross-sectional, population-based study. BMC Obes. 2014, 1, 9. [Google Scholar] [CrossRef] [Green Version]
- Deurenberg, P.; Weststrate, J.A.; Seidell, J.C. Body mass index as a measure of body fatness: Age- and sex-specific prediction formulas. Br. J. Nutr. 1991, 65, 105–114. [Google Scholar] [CrossRef] [Green Version]
- Garn, S.M.; Leonard, W.R.; Hawthorne, V.M. Three limitations of the body mass index. Am. J. Clin. Nutr. 1986, 44, 996–997. [Google Scholar] [CrossRef] [PubMed]
- Misra, A. Revisions of cutoffs of body mass index to define overweight and obesity are needed for the Asian-ethnic groups. Int. J. Obes. Relat. Metab. Disord. 2003, 27, 1294–1296. [Google Scholar] [CrossRef] [Green Version]
- Expert Panel on Detection, Evaluation, and Treatment of High Blood Cholesterol in Adults. Executive Summary of The Third Report of The National Cholesterol Education Program (NCEP) Expert Panel on Detection, Evaluation, and Treatment of High Blood Cholesterol In Adults (Adult Treatment Panel III). JAMA 2001, 285, 2486–2497. [Google Scholar] [CrossRef] [PubMed]
- Verney, J.; Schwartz, C.; Amiche, S.; Pereira, B.; Thivel, D. Comparisons of a Multi-Frequency Bioelectrical Impedance Analysis to the Dual-Energy X-Ray Absorptiometry Scan in Healthy Young Adults Depending on their Physical Activity Level. J. Hum. Kinet. 2015, 47, 73–80. [Google Scholar] [CrossRef] [PubMed] [Green Version]
- Gallagher, D.; Heymsfield, S.B.; Heo, M.; Jebb, S.A.; Murgatroyd, P.R.; Sakamoto, Y. Healthy percentage body fat ranges: An approach for developing guidelines based on body mass index. Am. J. Clin. Nutr. 2000, 72, 694–701. [Google Scholar] [CrossRef] [PubMed]
- Mandrekar, J.N. Receiver operating characteristic curve in diagnostic test assessment. J. Thorac. Oncol. 2010, 5, 1315–1316. [Google Scholar] [CrossRef] [Green Version]
- Mandrekar, J.N. Simple statistical measures for diagnostic accuracy assessment. J. Thorac. Oncol. 2010, 5, 763–764. [Google Scholar] [CrossRef] [Green Version]
- Sinaga, M.; Worku, M.; Yemane, T.; Tegene, E.; Wakayo, T.; Girma, T.; Lindstrom, D.; Belachew, T. Optimal cut-off for obesity and markers of metabolic syndrome for Ethiopian adults. Nutr. J. 2018, 17, 109. [Google Scholar] [CrossRef] [Green Version]
- Rahman, M.; Berenson, A.B. Accuracy of current body mass index obesity classification for white, black, and Hispanic reproductive-age women. Obstet. Gynecol. 2010, 115, 982–988. [Google Scholar] [CrossRef] [Green Version]
- Wollner, M.; Paulo Roberto, B.B.; Alysson Roncally, S.C.; Jurandir, N.; Edil, L.S. Accuracy of the WHO’s body mass index cut-off points to measure gender- and age-specific obesity in middle-aged adults living in the city of Rio de Janeiro, Brazil. J. Public Health Res. 2017, 6, 904. [Google Scholar]
- Hunma, S.; Ramuth, H.; Miles-Chan, J.L.; Schutz, Y.; Montani, J.P.; Joonas, N.; Dulloo, A.G. Body composition-derived BMI cut-offs for overweight and obesity in Indians and Creoles of Mauritius: Comparison with Caucasians. Int. J. Obes. (Lond.) 2016, 40, 1906–1914. [Google Scholar] [CrossRef] [PubMed] [Green Version]
- Almajwal, A.M.; Al-Baghli, N.A.; Batterham, M.J.; Williams, P.G.; Al-Turki, K.A.; Al-Ghamdi, A.J. Performance of body mass index in predicting diabetes and hypertension in the Eastern Province of Saudi Arabia. Ann. Saudi. Med. 2009, 29, 437–445. [Google Scholar] [CrossRef] [PubMed] [Green Version]
- WHO Expert Consultation. Appropriate body-mass index for Asian populations and its implications for policy and intervention strategies. Lancet 2004, 363, 902. [Google Scholar]


| Demographics | Total N = 442 | Males N = 134 | Females N = 308 | Significance |
|---|---|---|---|---|
| Age (years) | 34.7 (14.7) | 33.4(14.0) | 35.3(15.0) | 0.196 |
| X2 = 1.77; p = 0.412 | ||||
| 20–39 | 285 (64.5) | 92 (68.7) | 193 (62.7) | |
| 40–59 | 128 (29.0) | 33 (24.6) | 95 (30.8) | |
| 60–80 | 29 (6.56) | 9 (6.7) | 20 (6.5) | |
| Marital status | X2 = 7.961; p = 0.0005 | |||
| Unmarried | 232 (53.0) | 84 (63.2) | 148 (48.5) | |
| Married | 206 (47.0) | 49 (36.8) | 157 (51.5) | |
| Employment | X2 = 45.971; p < 0.0001 | |||
| Unemployed | 263 (59.8) | 48 (35.8) | 215 (70.3) | |
| Employed | 177 (40.2) | 86 (64.2) | 91 (29.7) | |
| Anthropometrics | ||||
| Weight (Kg) | 85.0 (18.7) | 95.0 (23.2) | 80.9 (14.1) | p < 0.0001 |
| Height (cm) | 163.7 (9.5) | 174.3 (6.8) | 159.1 (6.2) | p < 0.0001 |
| BMI Kg/m2 £ | 31.8 (6.2) | 31.3 (7.3) | 32.0 (5.6) | p = 0.298 |
| X2 = 26.676; p < 0.0001 | ||||
| Normal weight | 66 (14.9) | 36 (26.9) | 30 (9.7) | |
| With overweight | 110 (24.9) | 21 (15.7) | 89 (28.9) | |
| With Obesity | 266 (60.2) | 77 (57.5) | 189 (61.4) | |
| BF (Kg) | 32.3 (12.04) | 28.4 (15.3) | 34.0 (9.9) | p = 0.00014 |
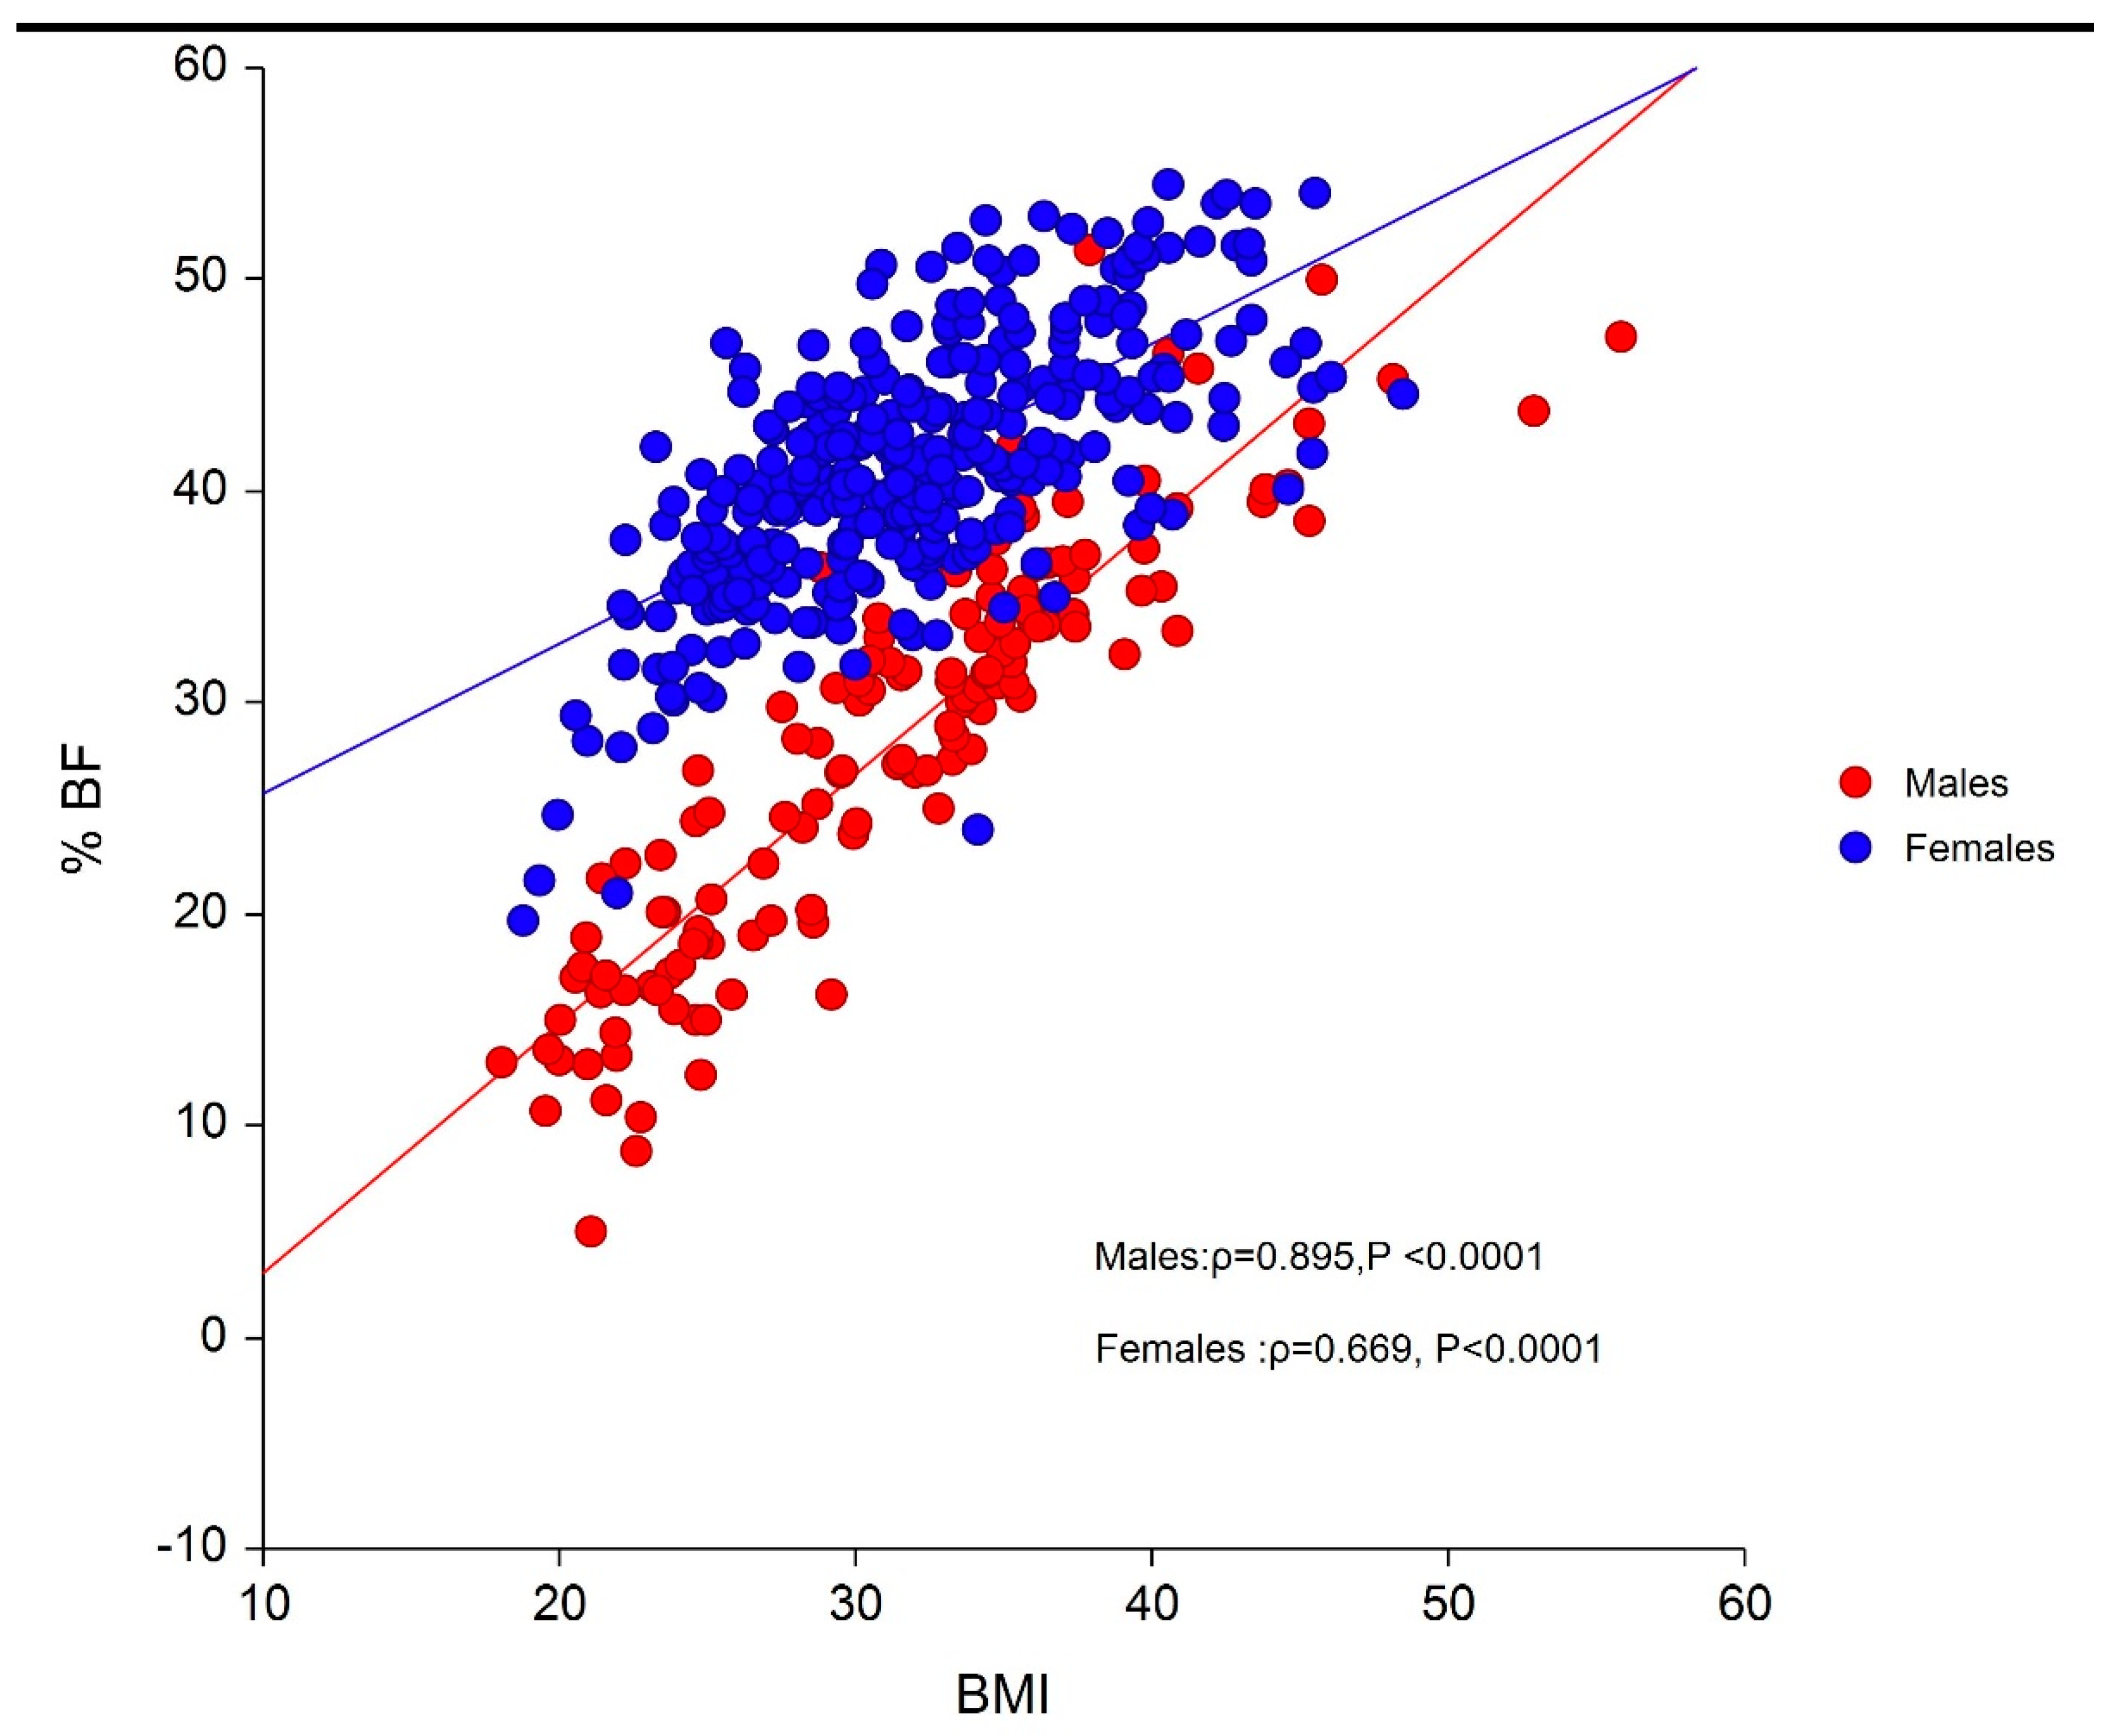
| BF% ¥ | 37.3 (9.5) | 28.1 (9.7) | 41.3 (6.0) | p < 0.0001 |
| X2 = 1.432; p = 0.231 | ||||
| Without obesity | 240 (54.3) | 67 (50.0) | 173 (56.2) | |
| With obesity | 202 (45.7) | 67 (50.0) | 135 (43.8) | |
| Cardiometabolic disease | X2 = 0.294; p = 0.588 | |||
| No | 319(73.2) | 95 (71.4) | 224 (73.9) | |
| Yes | 117(26.8) | 38 (28.6) | 79 (26.1) | |
| Diabetes | X2 = 0.002; p = 0.967 | |||
| No | 376 (90.4) | 114 (90.5) | 262 (90.3) | |
| Yes | 40 (9.6) | 12 (9.5) | 28 (9.7) | |
| Dyslipidemia | X2 = 0.032; p = 0.858 | |||
| No | 343 (82.3) | 103 (81.8) | 240 (82.5) | |
| Yes | 74 (17.8) | 23 (18.3) | 51 (17.5) | |
| Hypertension | X2 = 0.001; p = 0.980 | |||
| No | 380 (87.2) | 116 (87.2) | 264 (87.1) | |
| Yes | 56 (12.8) | 17 (12.8) | 39 (12.9) |
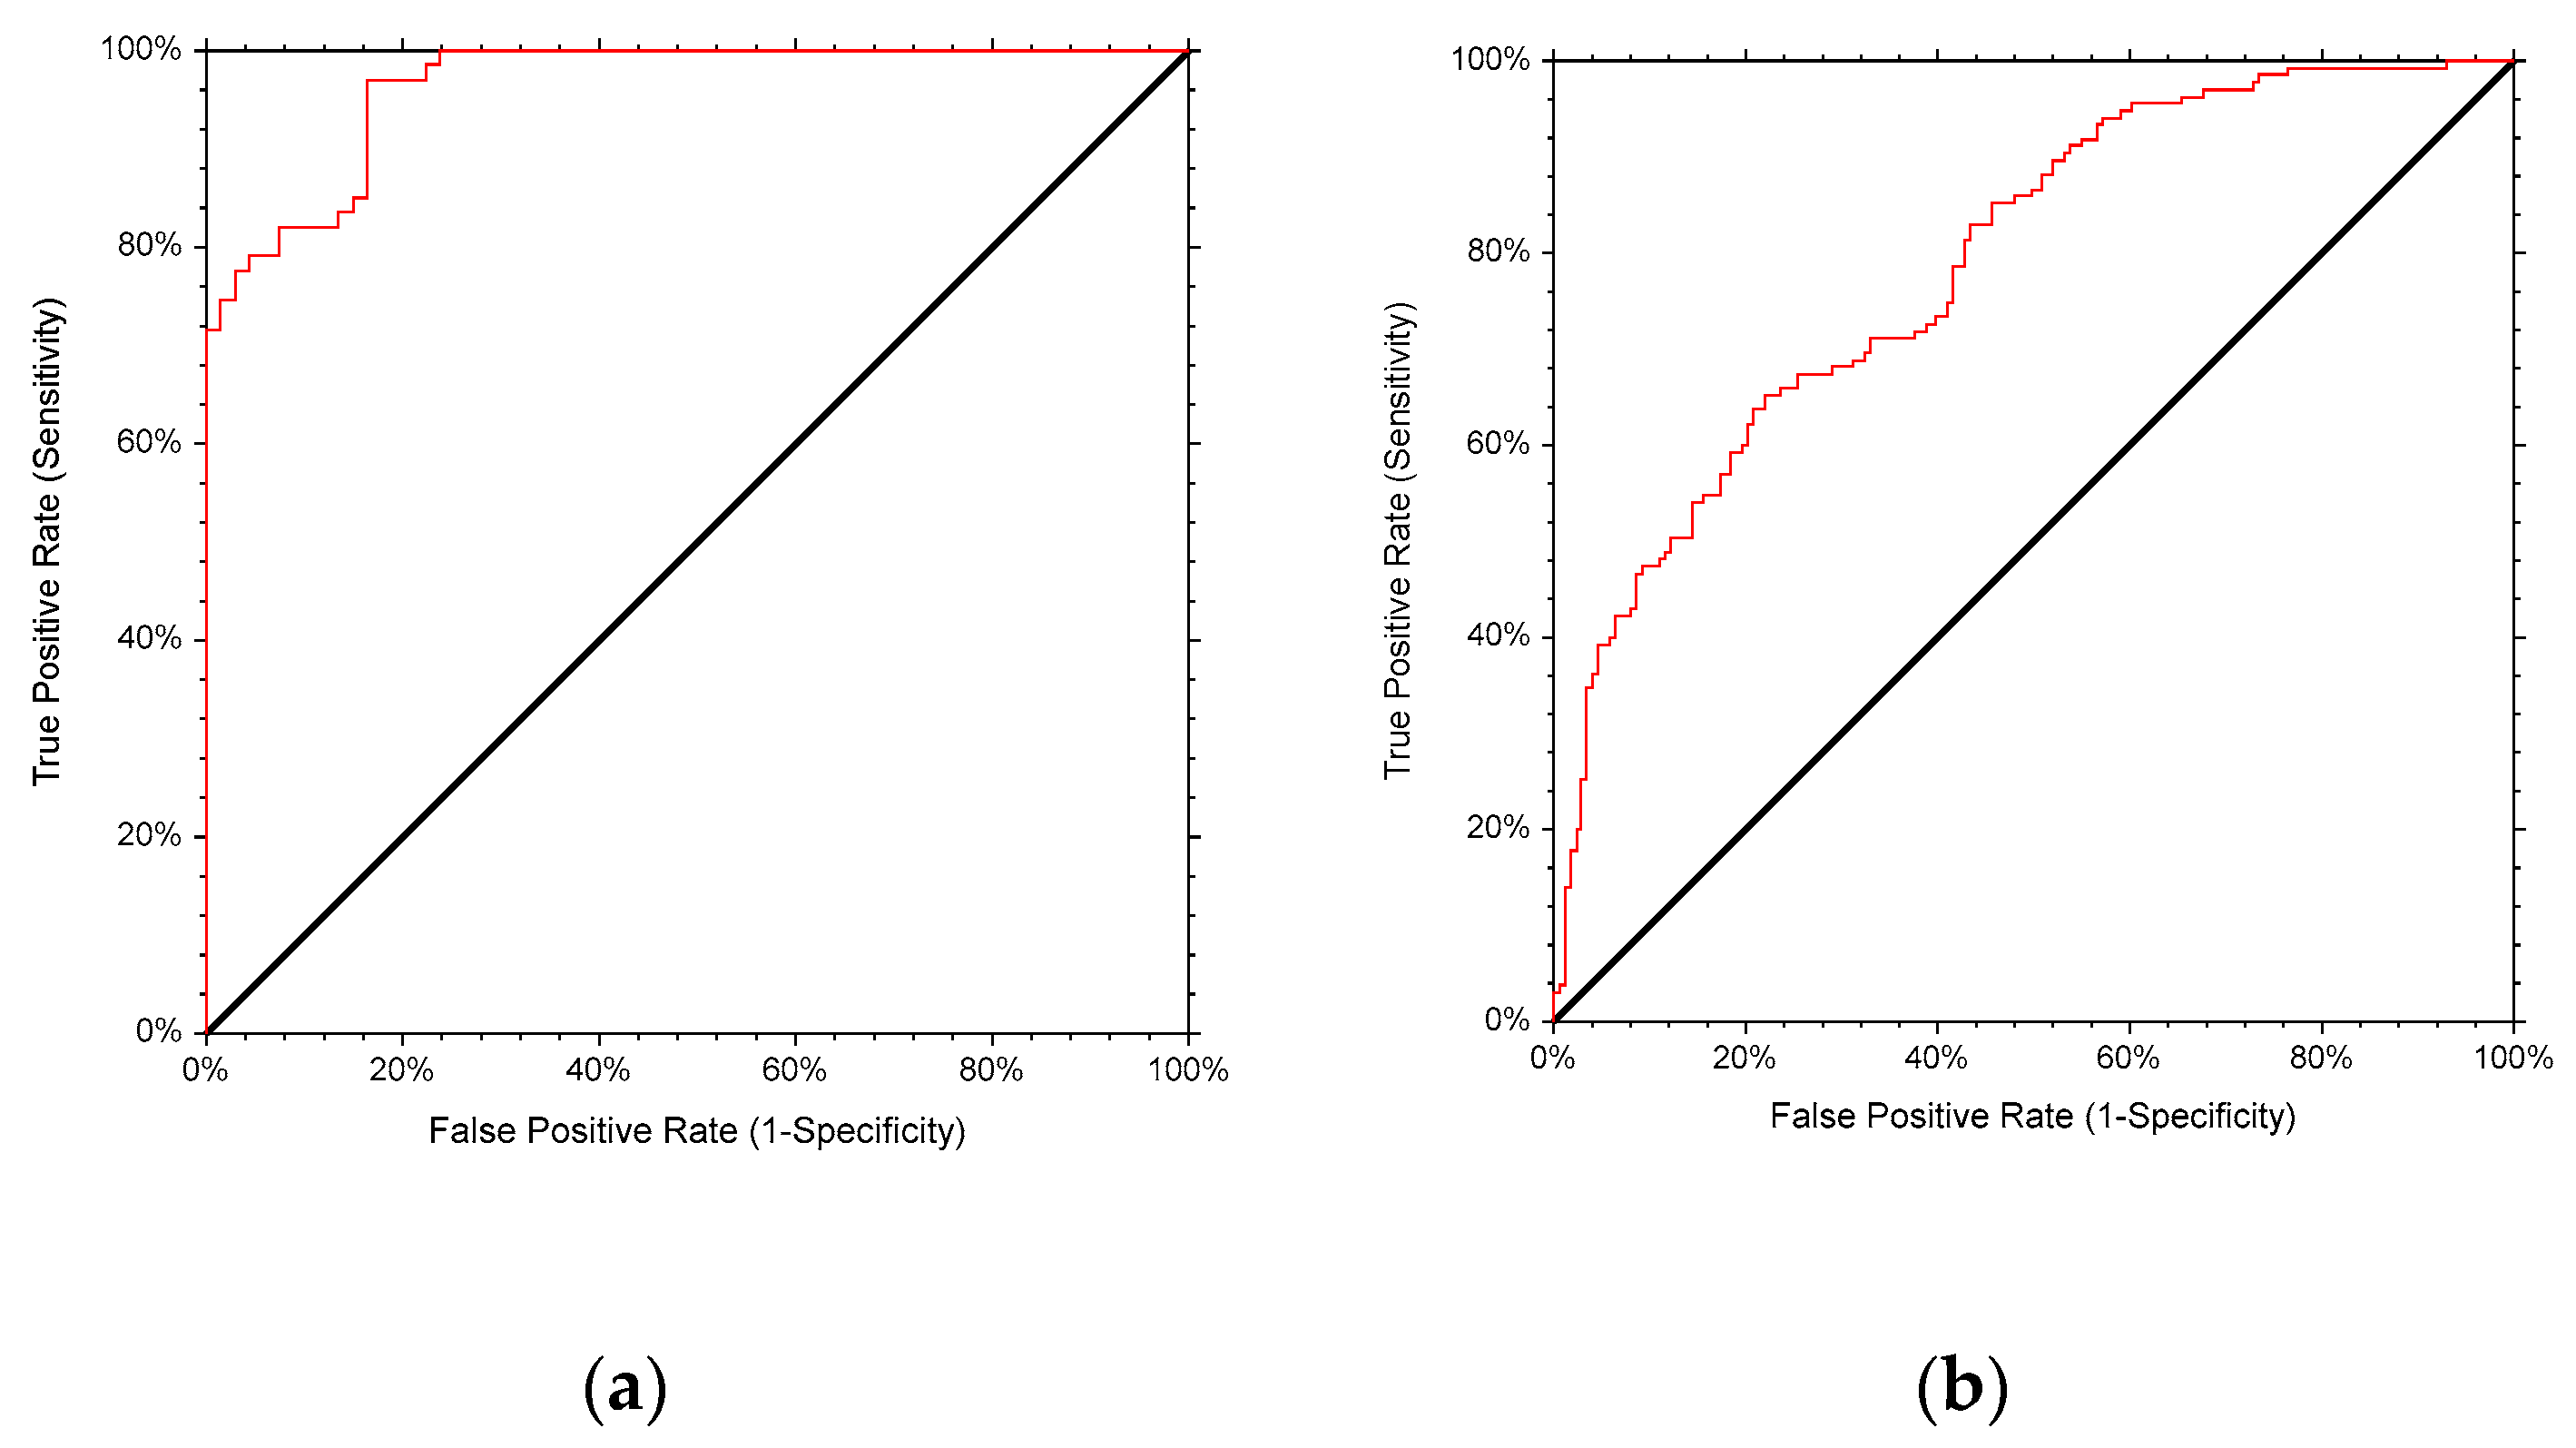
| Sex | N | AUC | 95%CI | P Value | Sensitivity | Specificity | Cut Off | Specificity at 90% Sensitivity | Cut-off at 90% Sensitivity |
|---|---|---|---|---|---|---|---|---|---|
| Males | 134 | 0.965 | 0.930–0.983 | <0.0001 | 0.851 | 0.851 | 31.53 | 0.836 | 30.48 |
| Females | 308 | 0.789 | 0.733–0.833 | <0.0001 | 0.719 | 0.624 | 31.44 | 0.468 | 28.85 |
© 2020 by the authors. Licensee MDPI, Basel, Switzerland. This article is an open access article distributed under the terms and conditions of the Creative Commons Attribution (CC BY) license (http://creativecommons.org/licenses/by/4.0/).
Share and Cite
Itani, L.; Kreidieh, D.; El Masri, D.; Tannir, H.; Chehade, L.; El Ghoch, M. Revising BMI Cut-Off Points for Obesity in a Weight Management Setting in Lebanon. Int. J. Environ. Res. Public Health 2020, 17, 3832. https://0-doi-org.brum.beds.ac.uk/10.3390/ijerph17113832
Itani L, Kreidieh D, El Masri D, Tannir H, Chehade L, El Ghoch M. Revising BMI Cut-Off Points for Obesity in a Weight Management Setting in Lebanon. International Journal of Environmental Research and Public Health. 2020; 17(11):3832. https://0-doi-org.brum.beds.ac.uk/10.3390/ijerph17113832
Chicago/Turabian StyleItani, Leila, Dima Kreidieh, Dana El Masri, Hana Tannir, Leila Chehade, and Marwan El Ghoch. 2020. "Revising BMI Cut-Off Points for Obesity in a Weight Management Setting in Lebanon" International Journal of Environmental Research and Public Health 17, no. 11: 3832. https://0-doi-org.brum.beds.ac.uk/10.3390/ijerph17113832