Monitoring and Assessment of Water Level Fluctuations of the Lake Urmia and Its Environmental Consequences Using Multitemporal Landsat 7 ETM+ Images

 , ,
, ,  , ,
, ,  , ,
, ,  and
and
Abstract
:1. Introduction
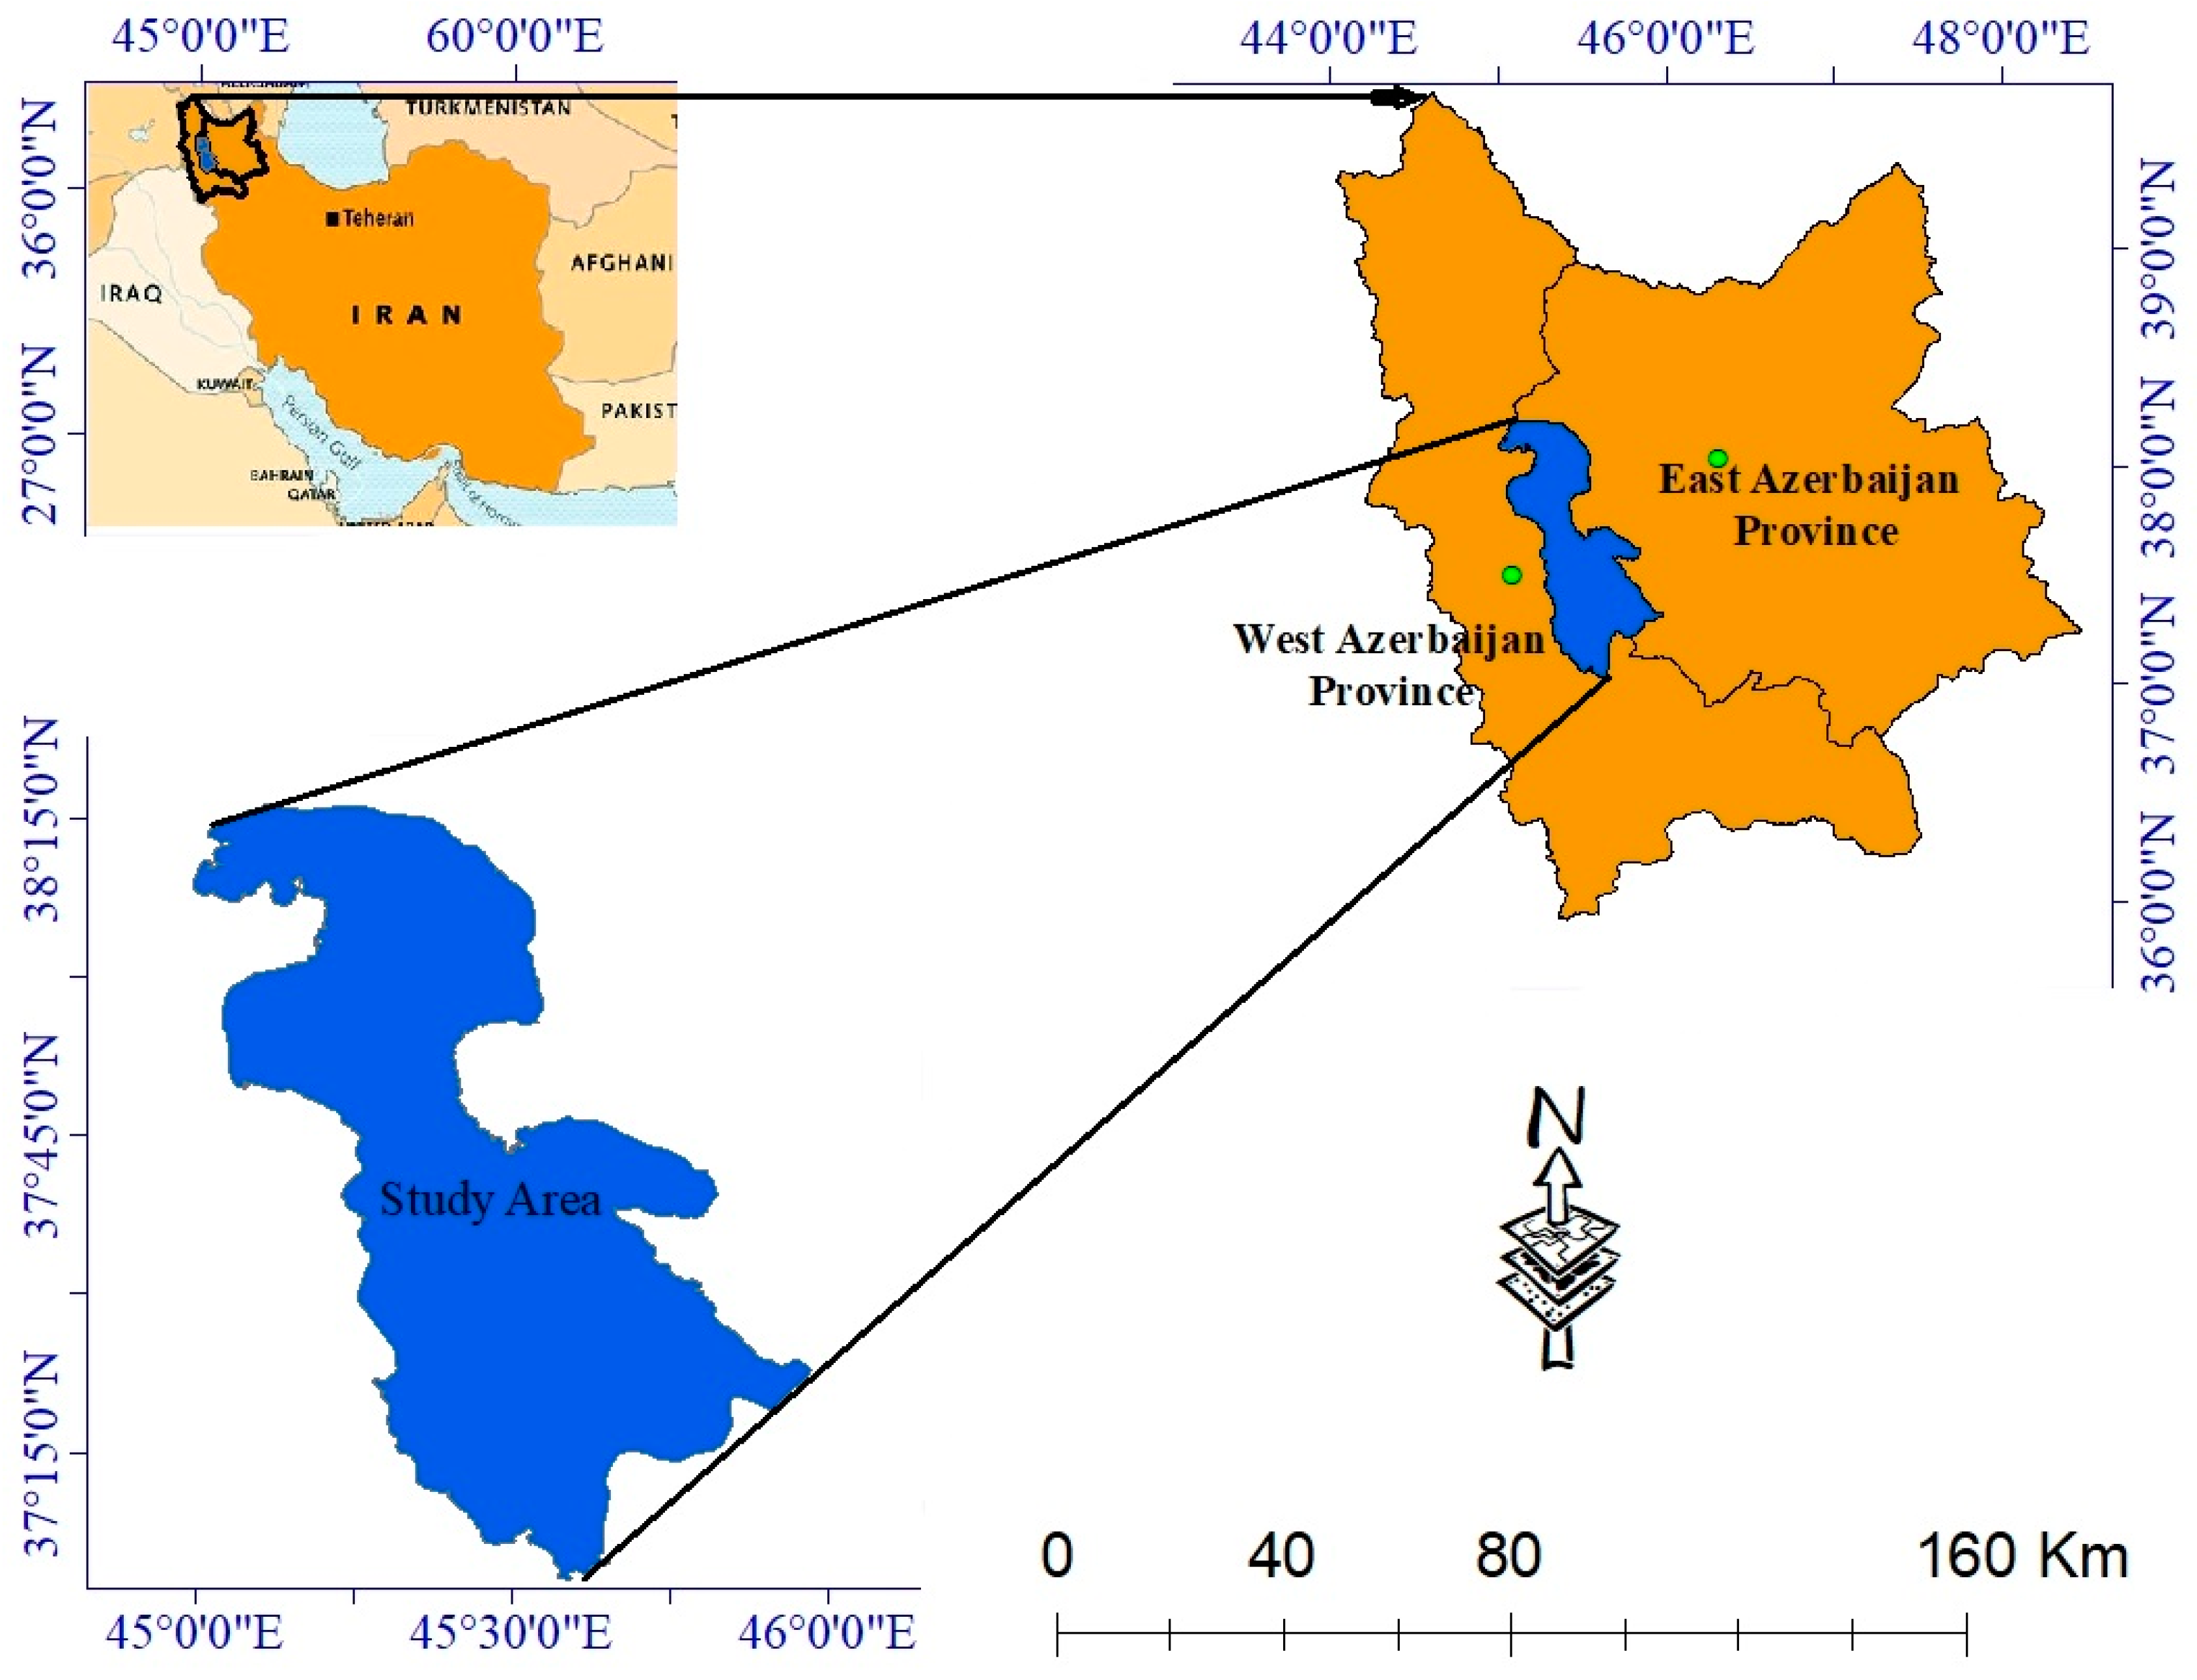
2. Study Area
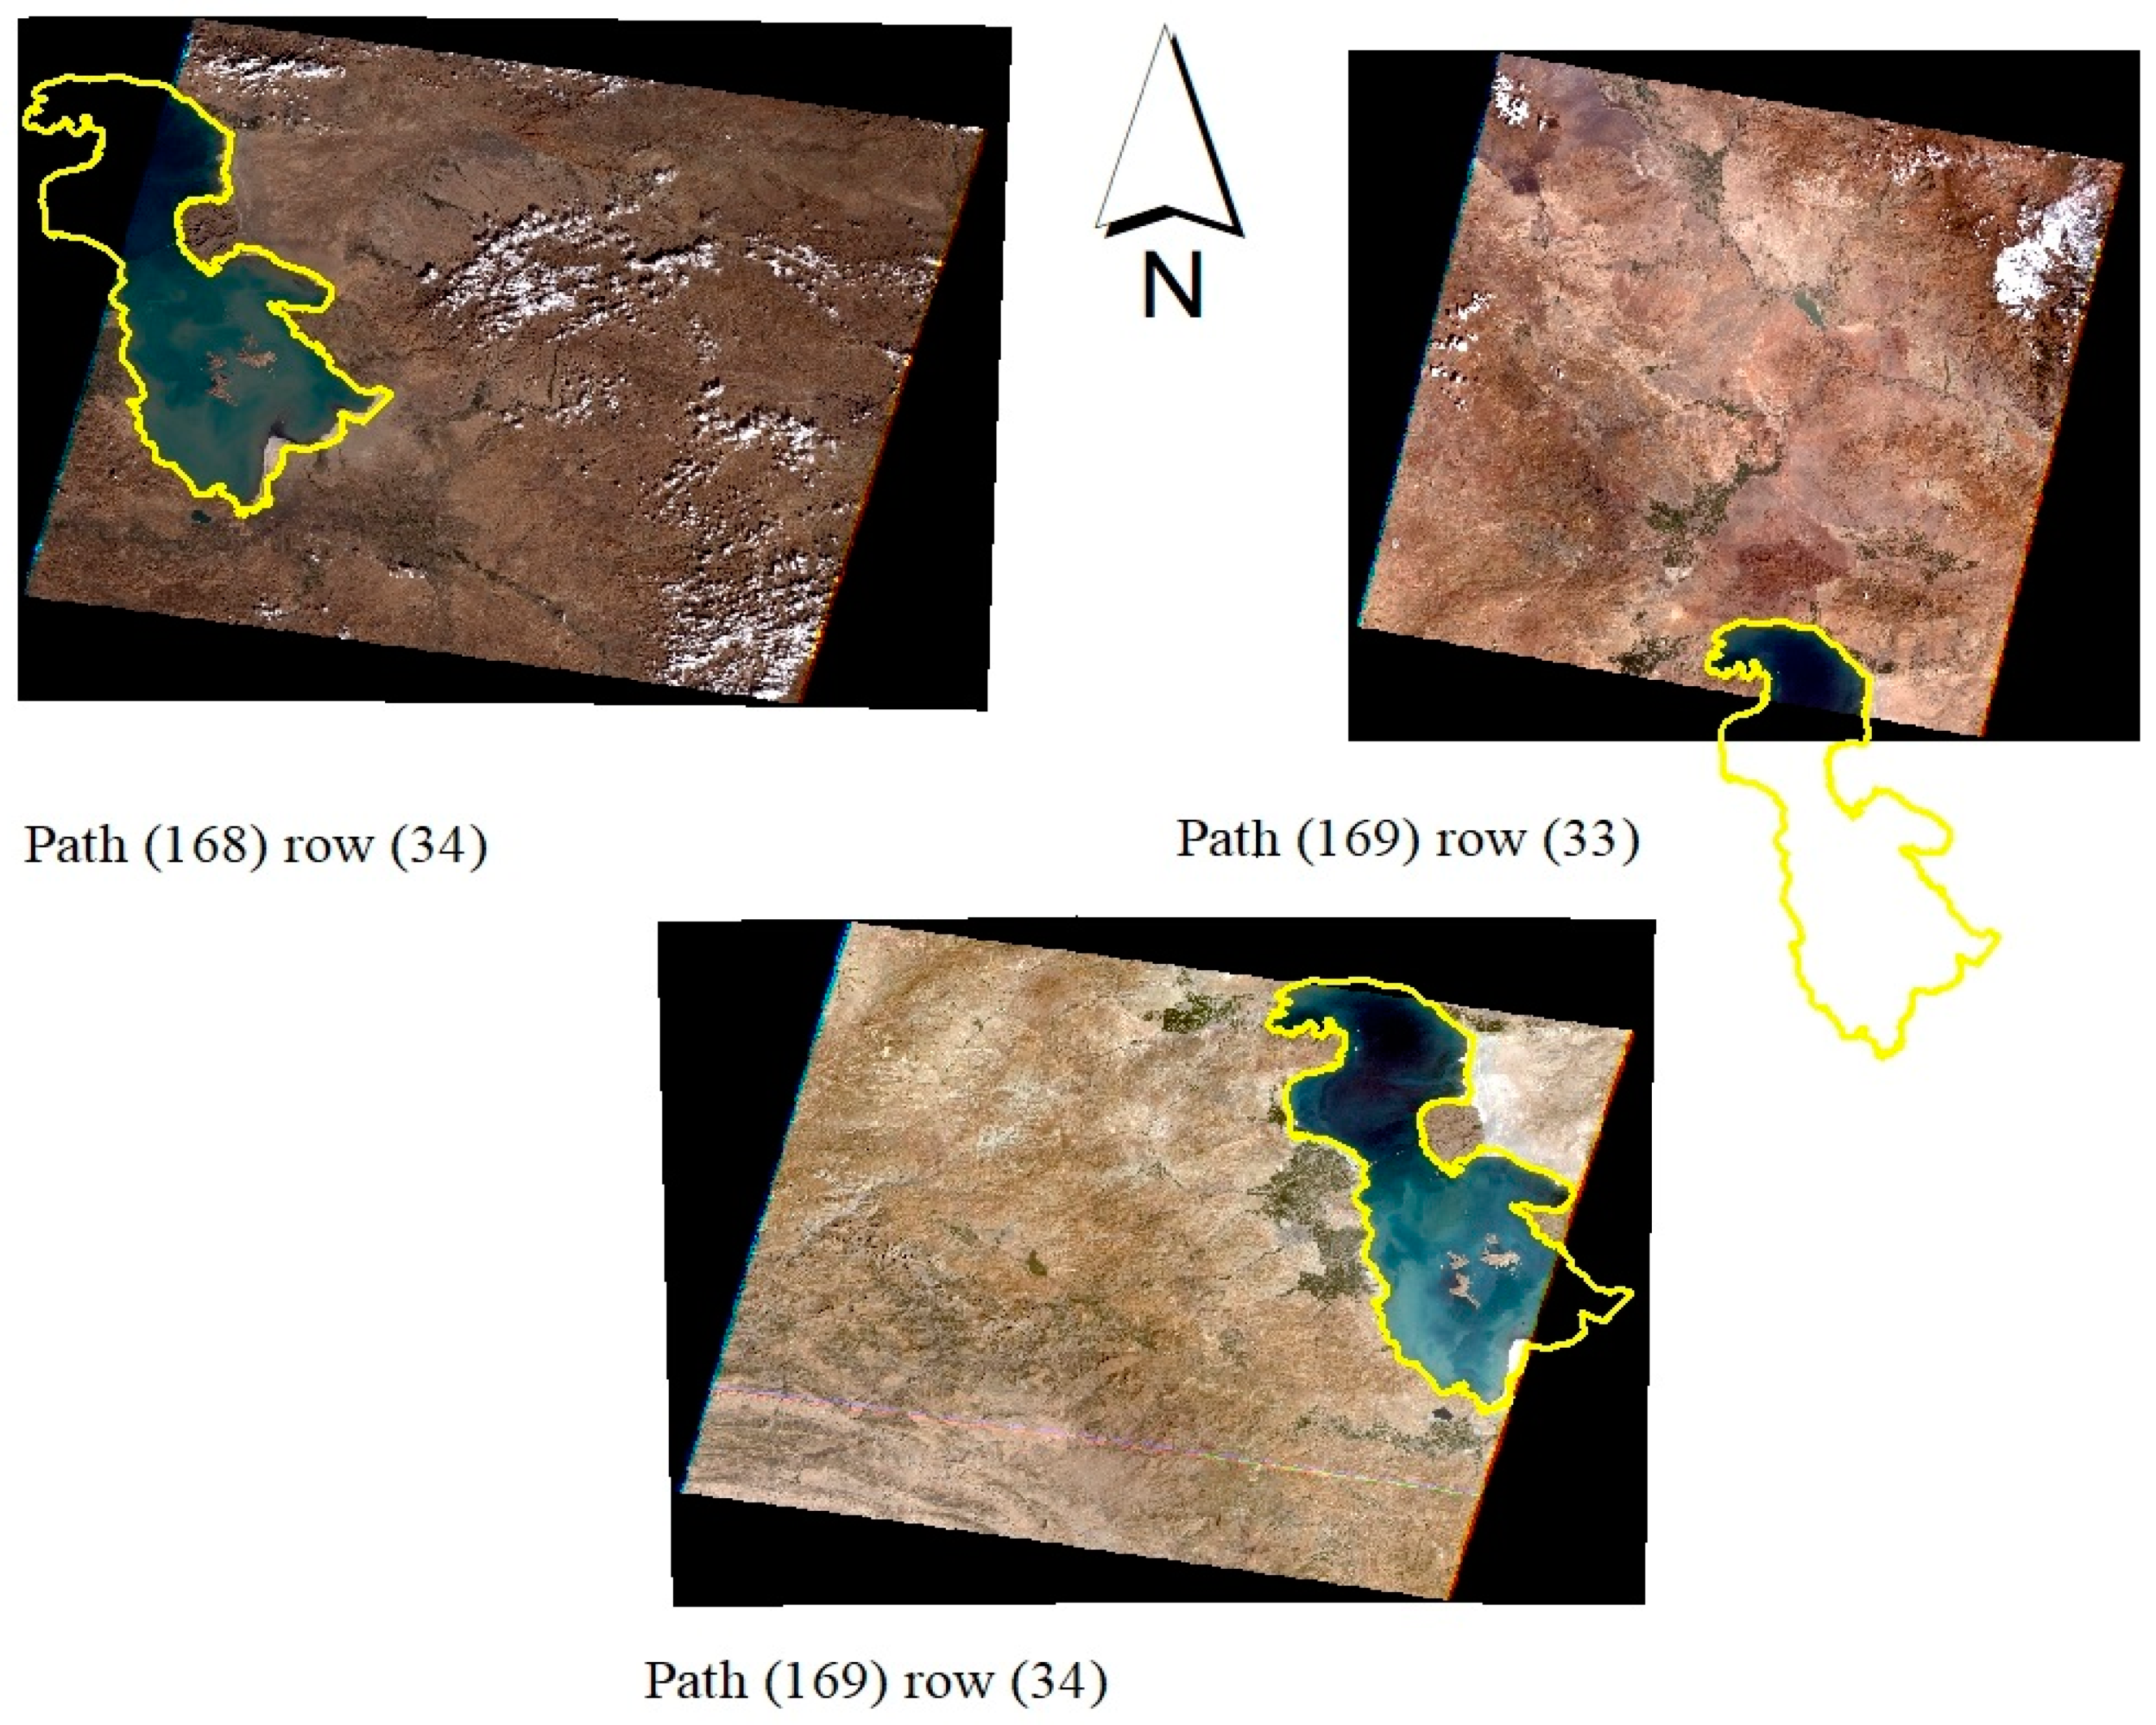
3. Materials and Methods
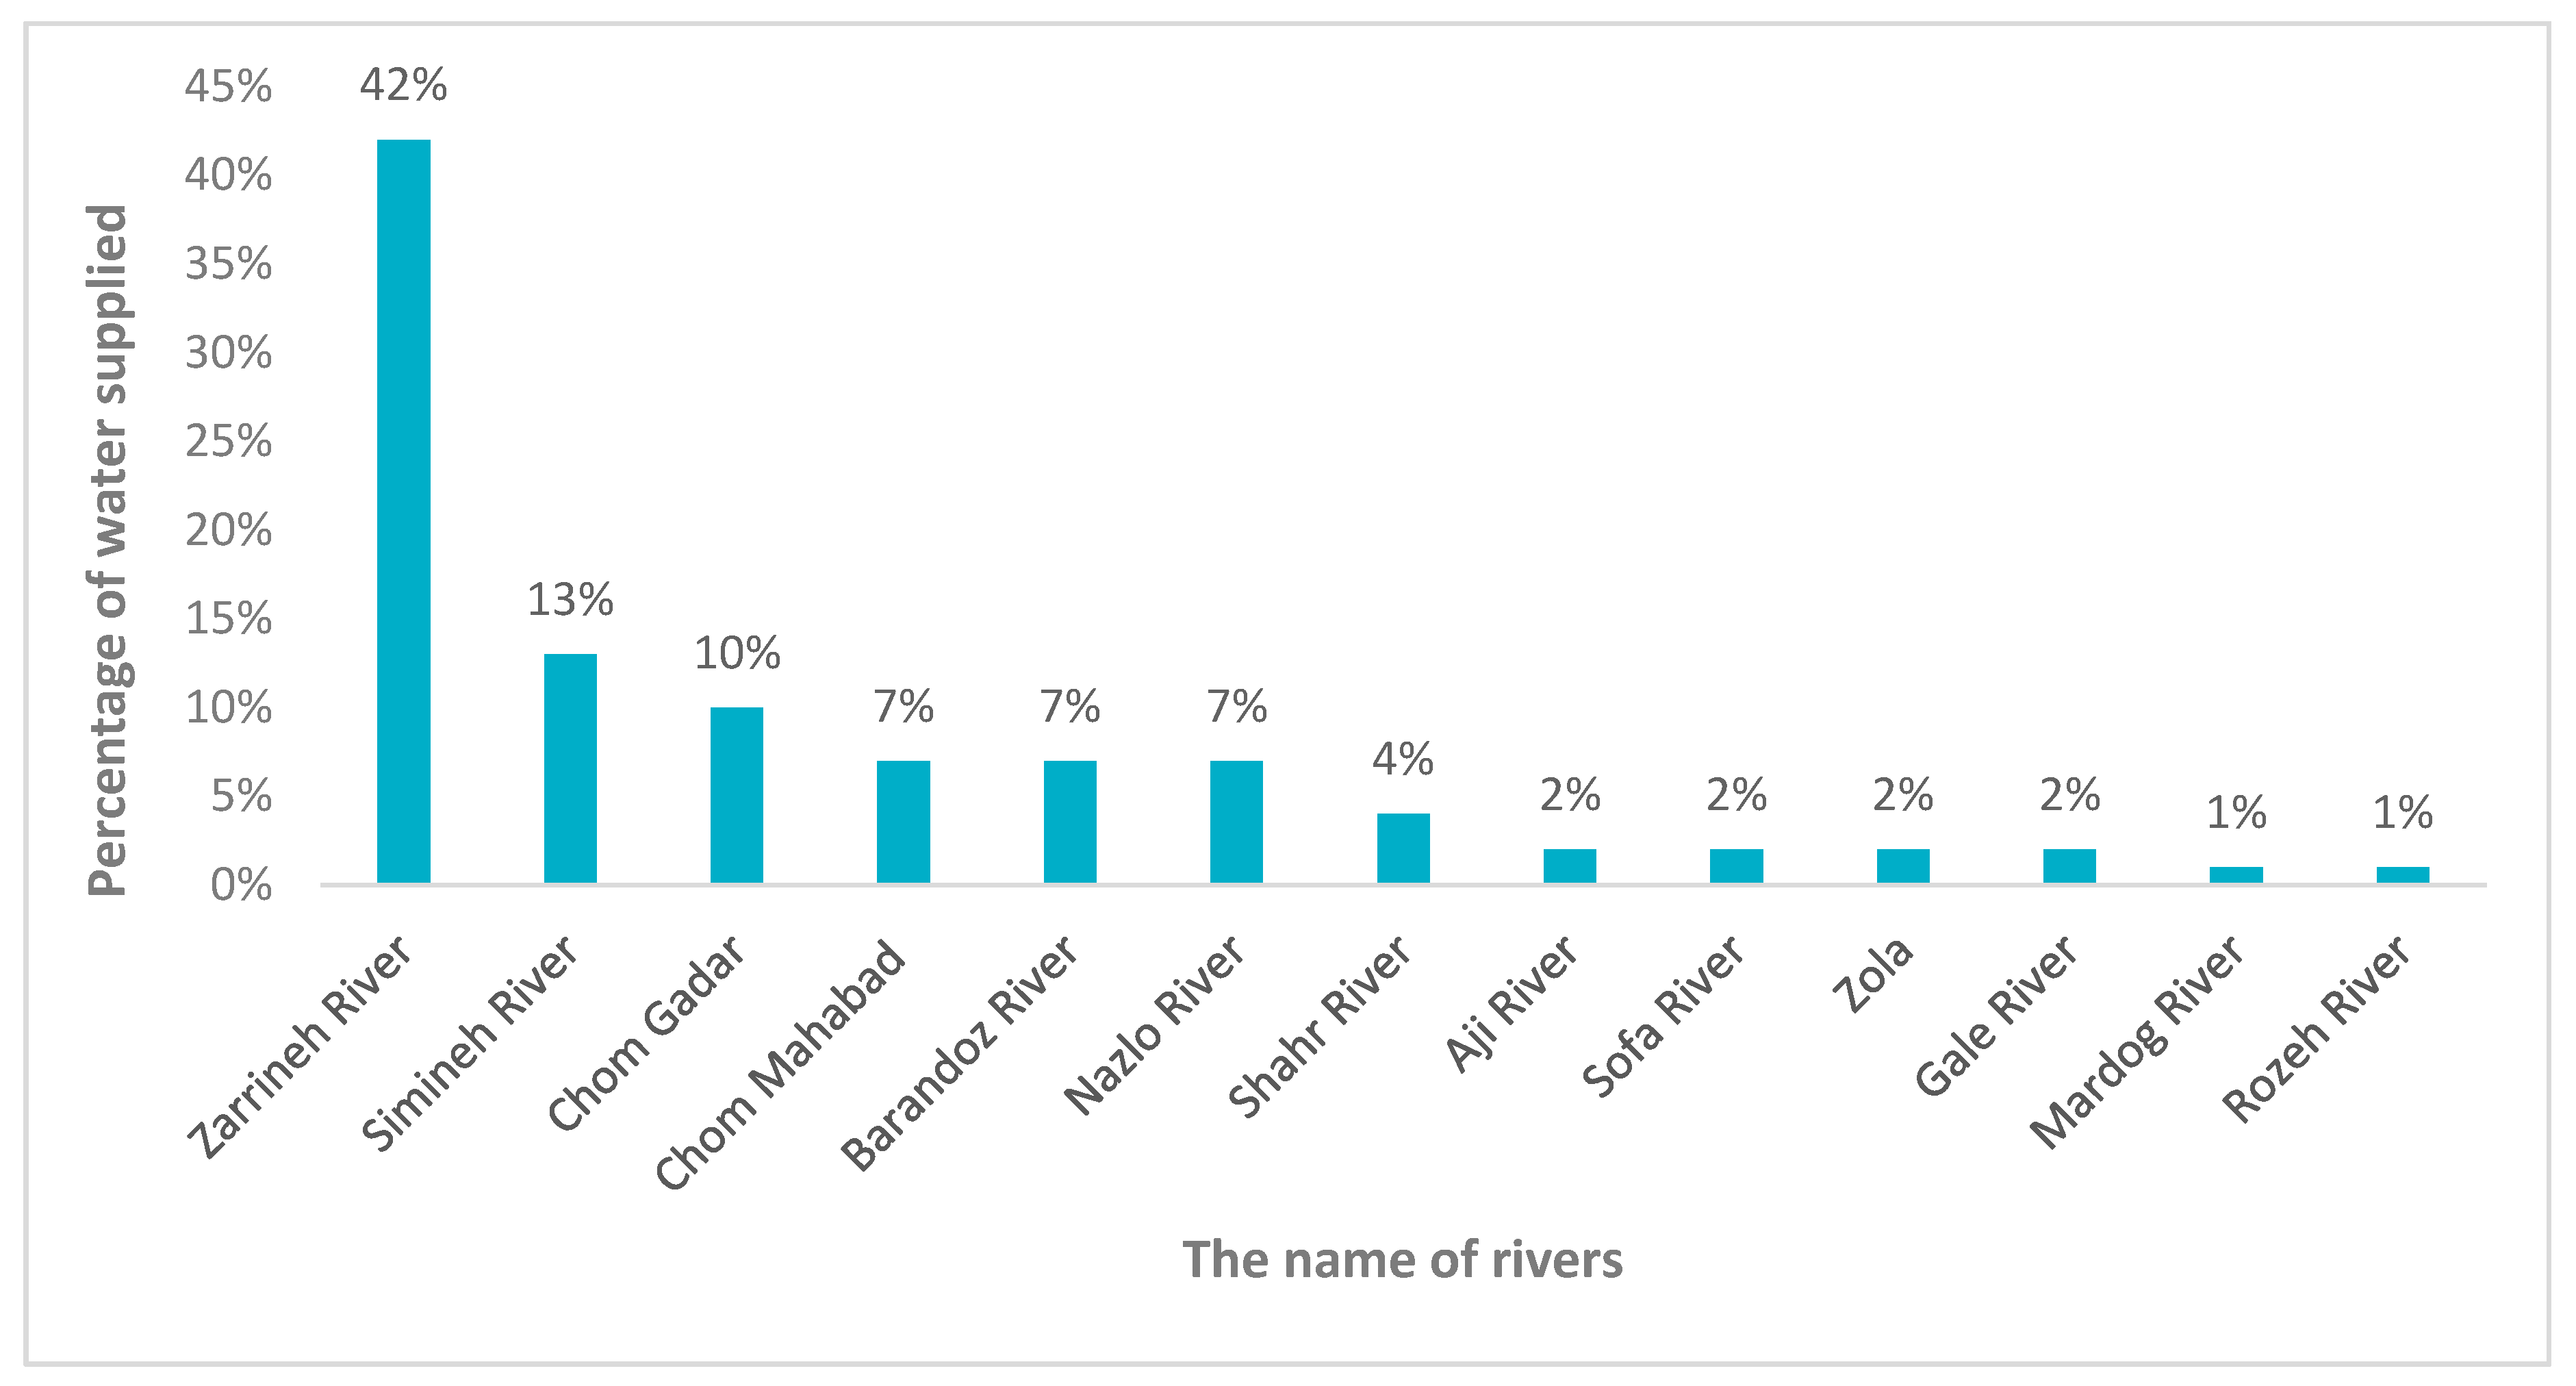
3.1. Dam, River, Precipitation, and Temperature Data
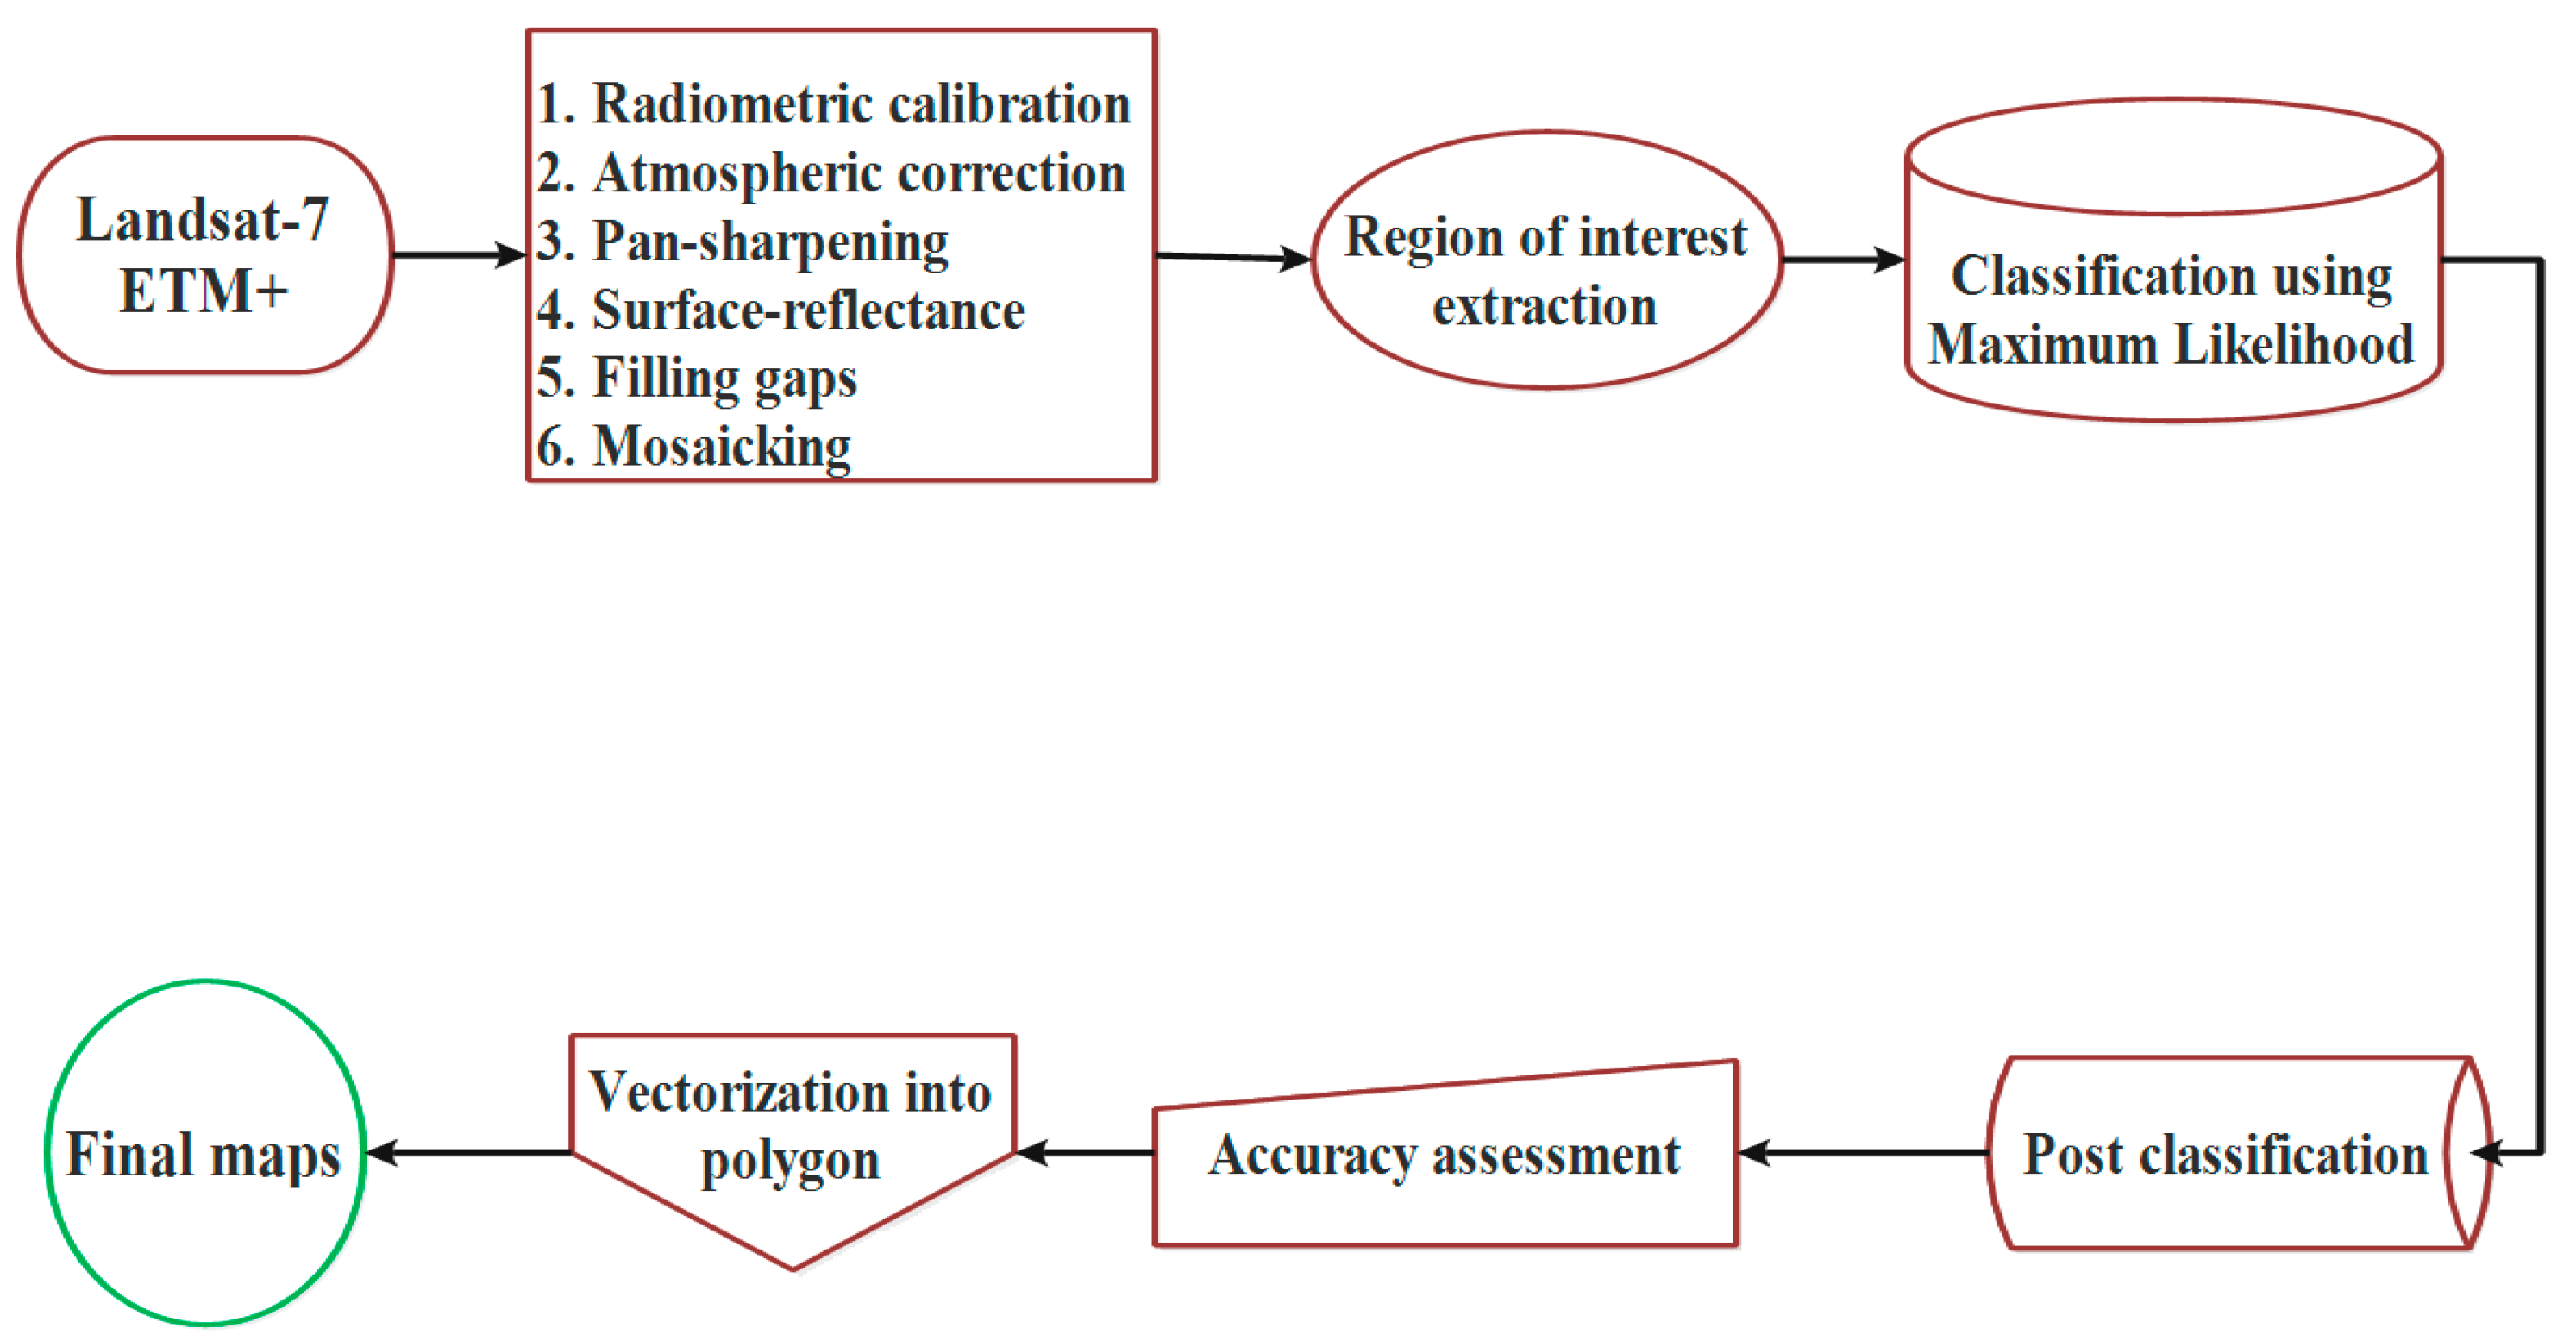
3.2. Methodology
Maximum Likelihood Method
3.3. Accuracy Assessment
4. Results and Analysis
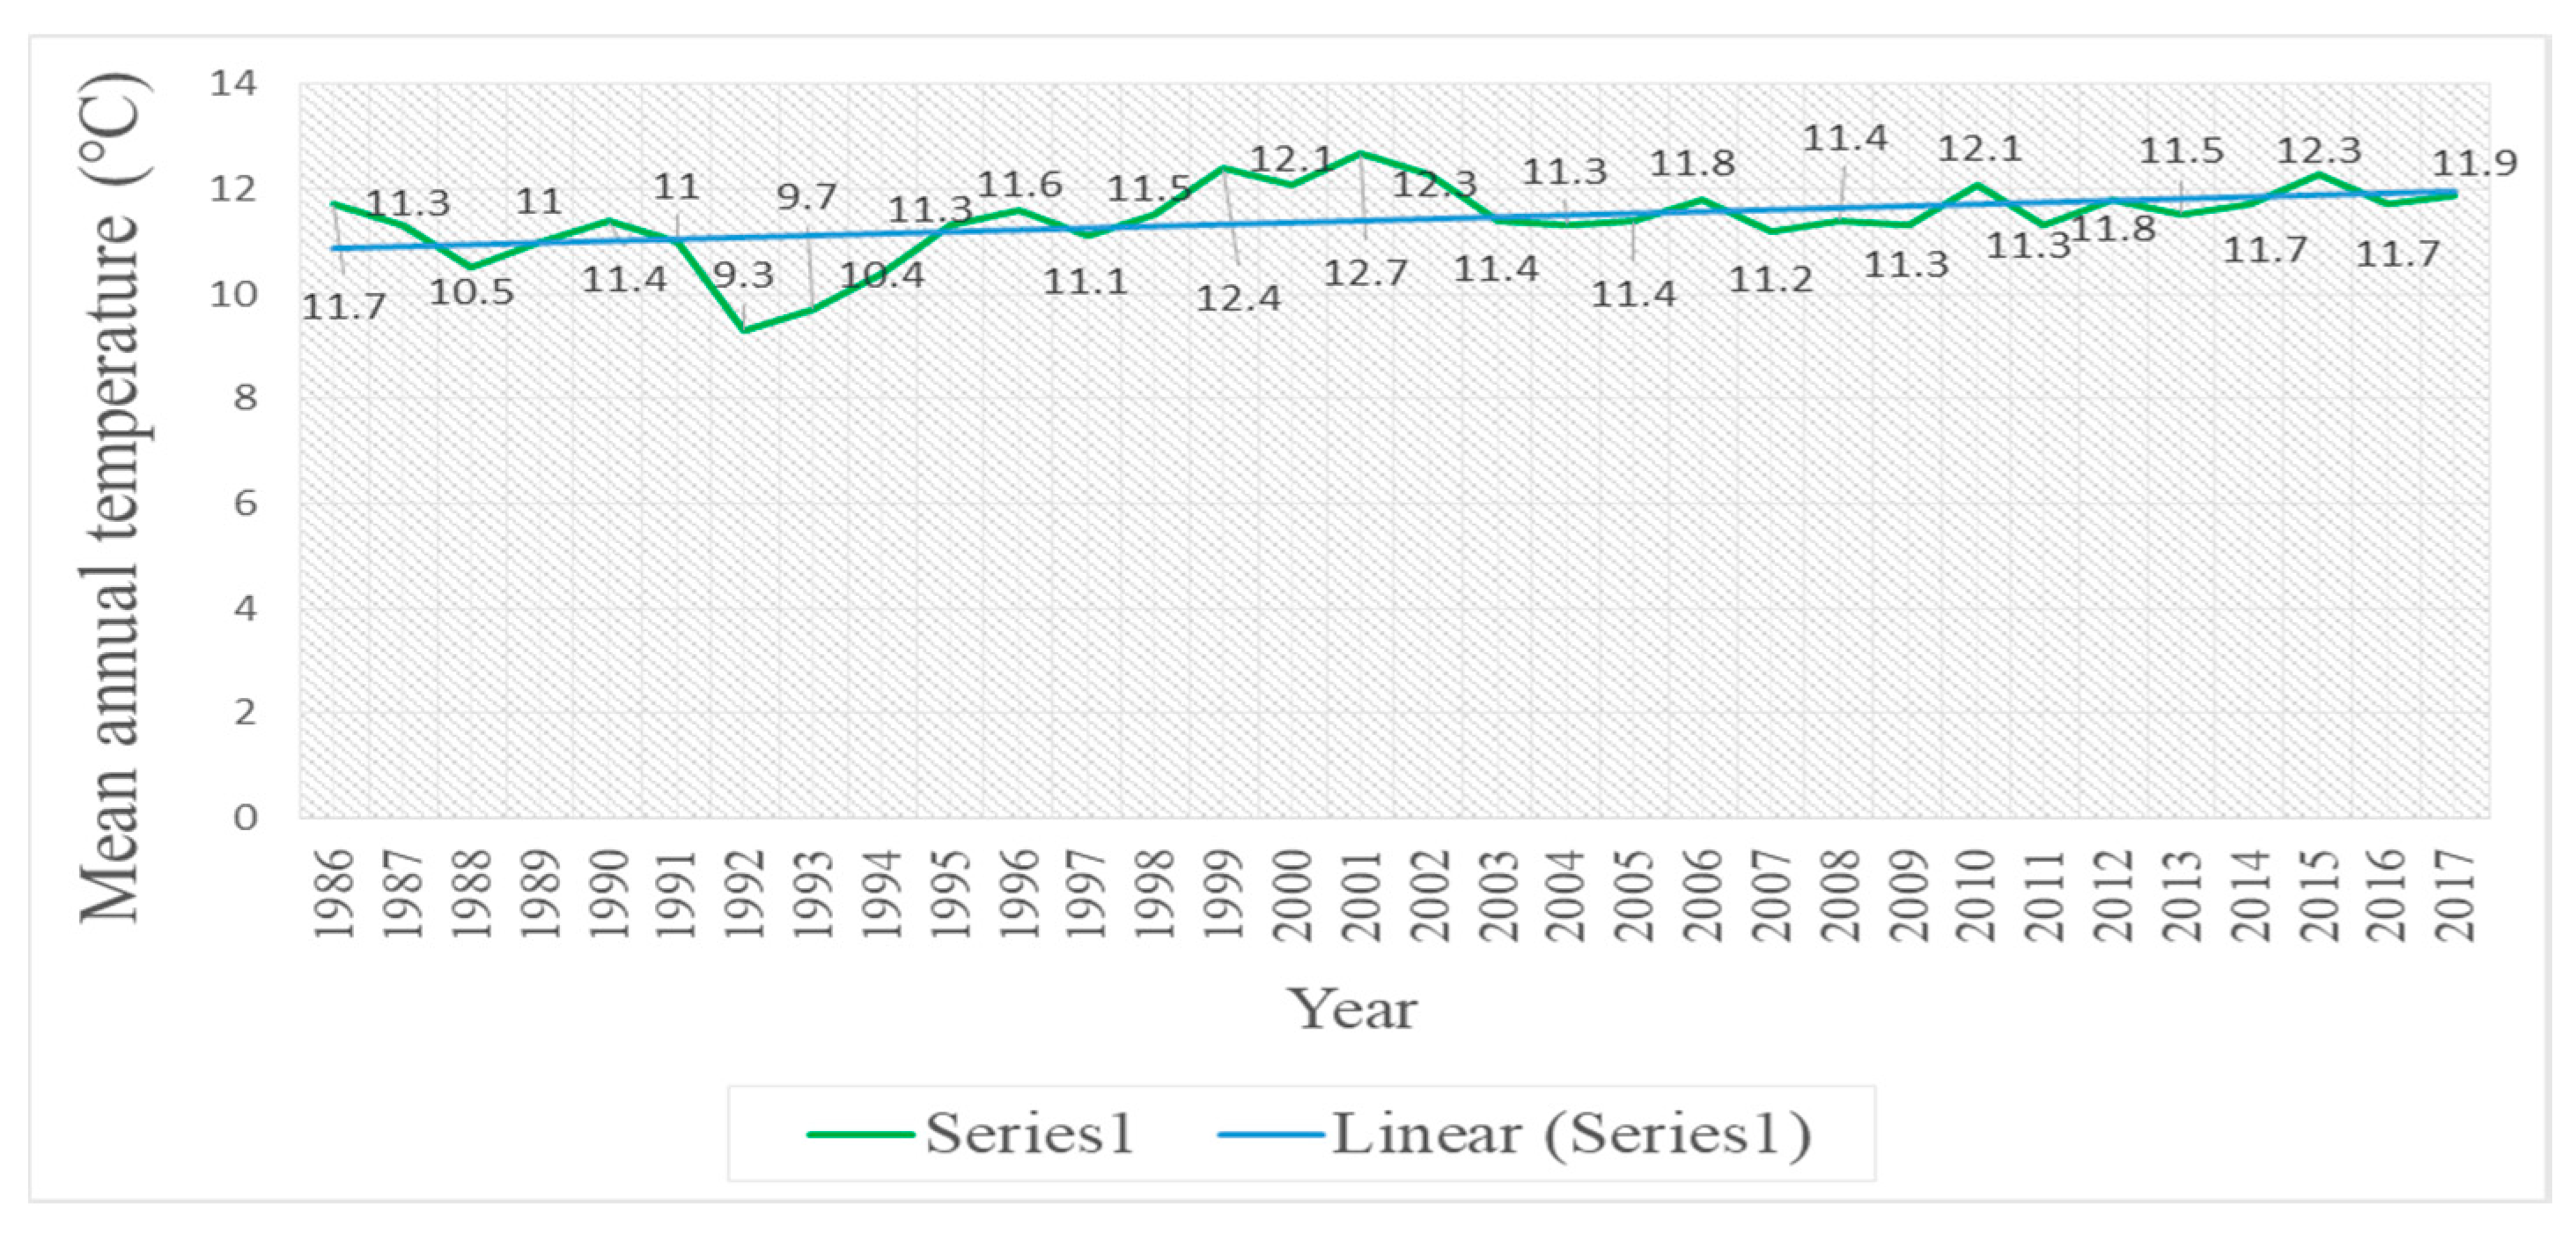
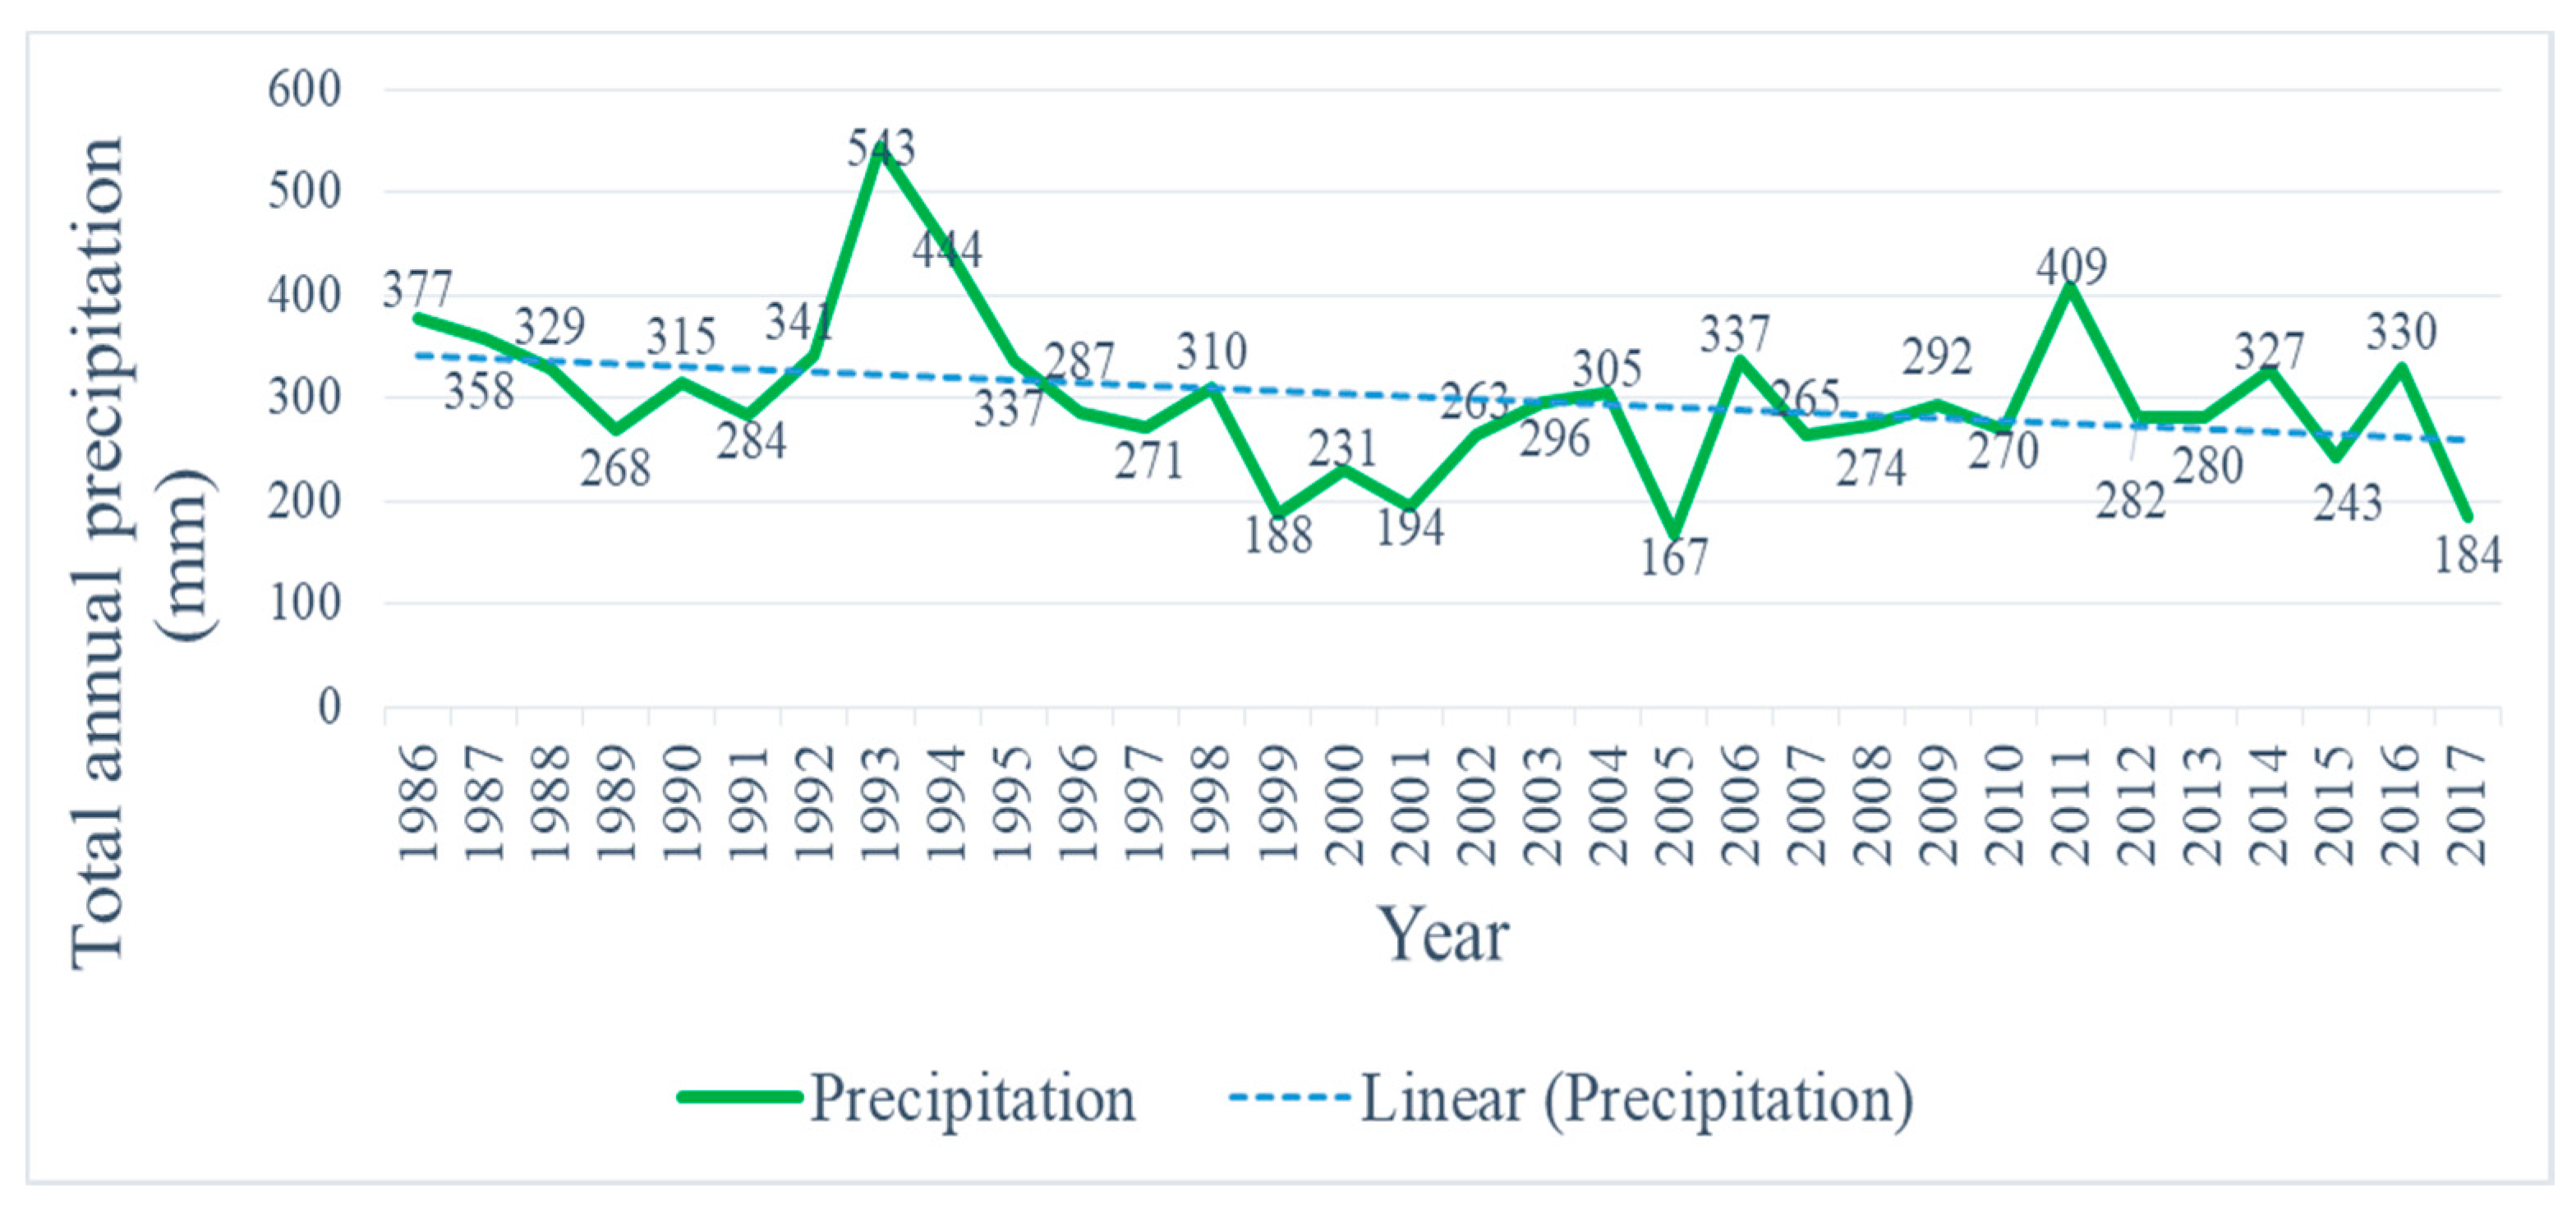
4.1. Climate Change (Temperature and Precipitation)
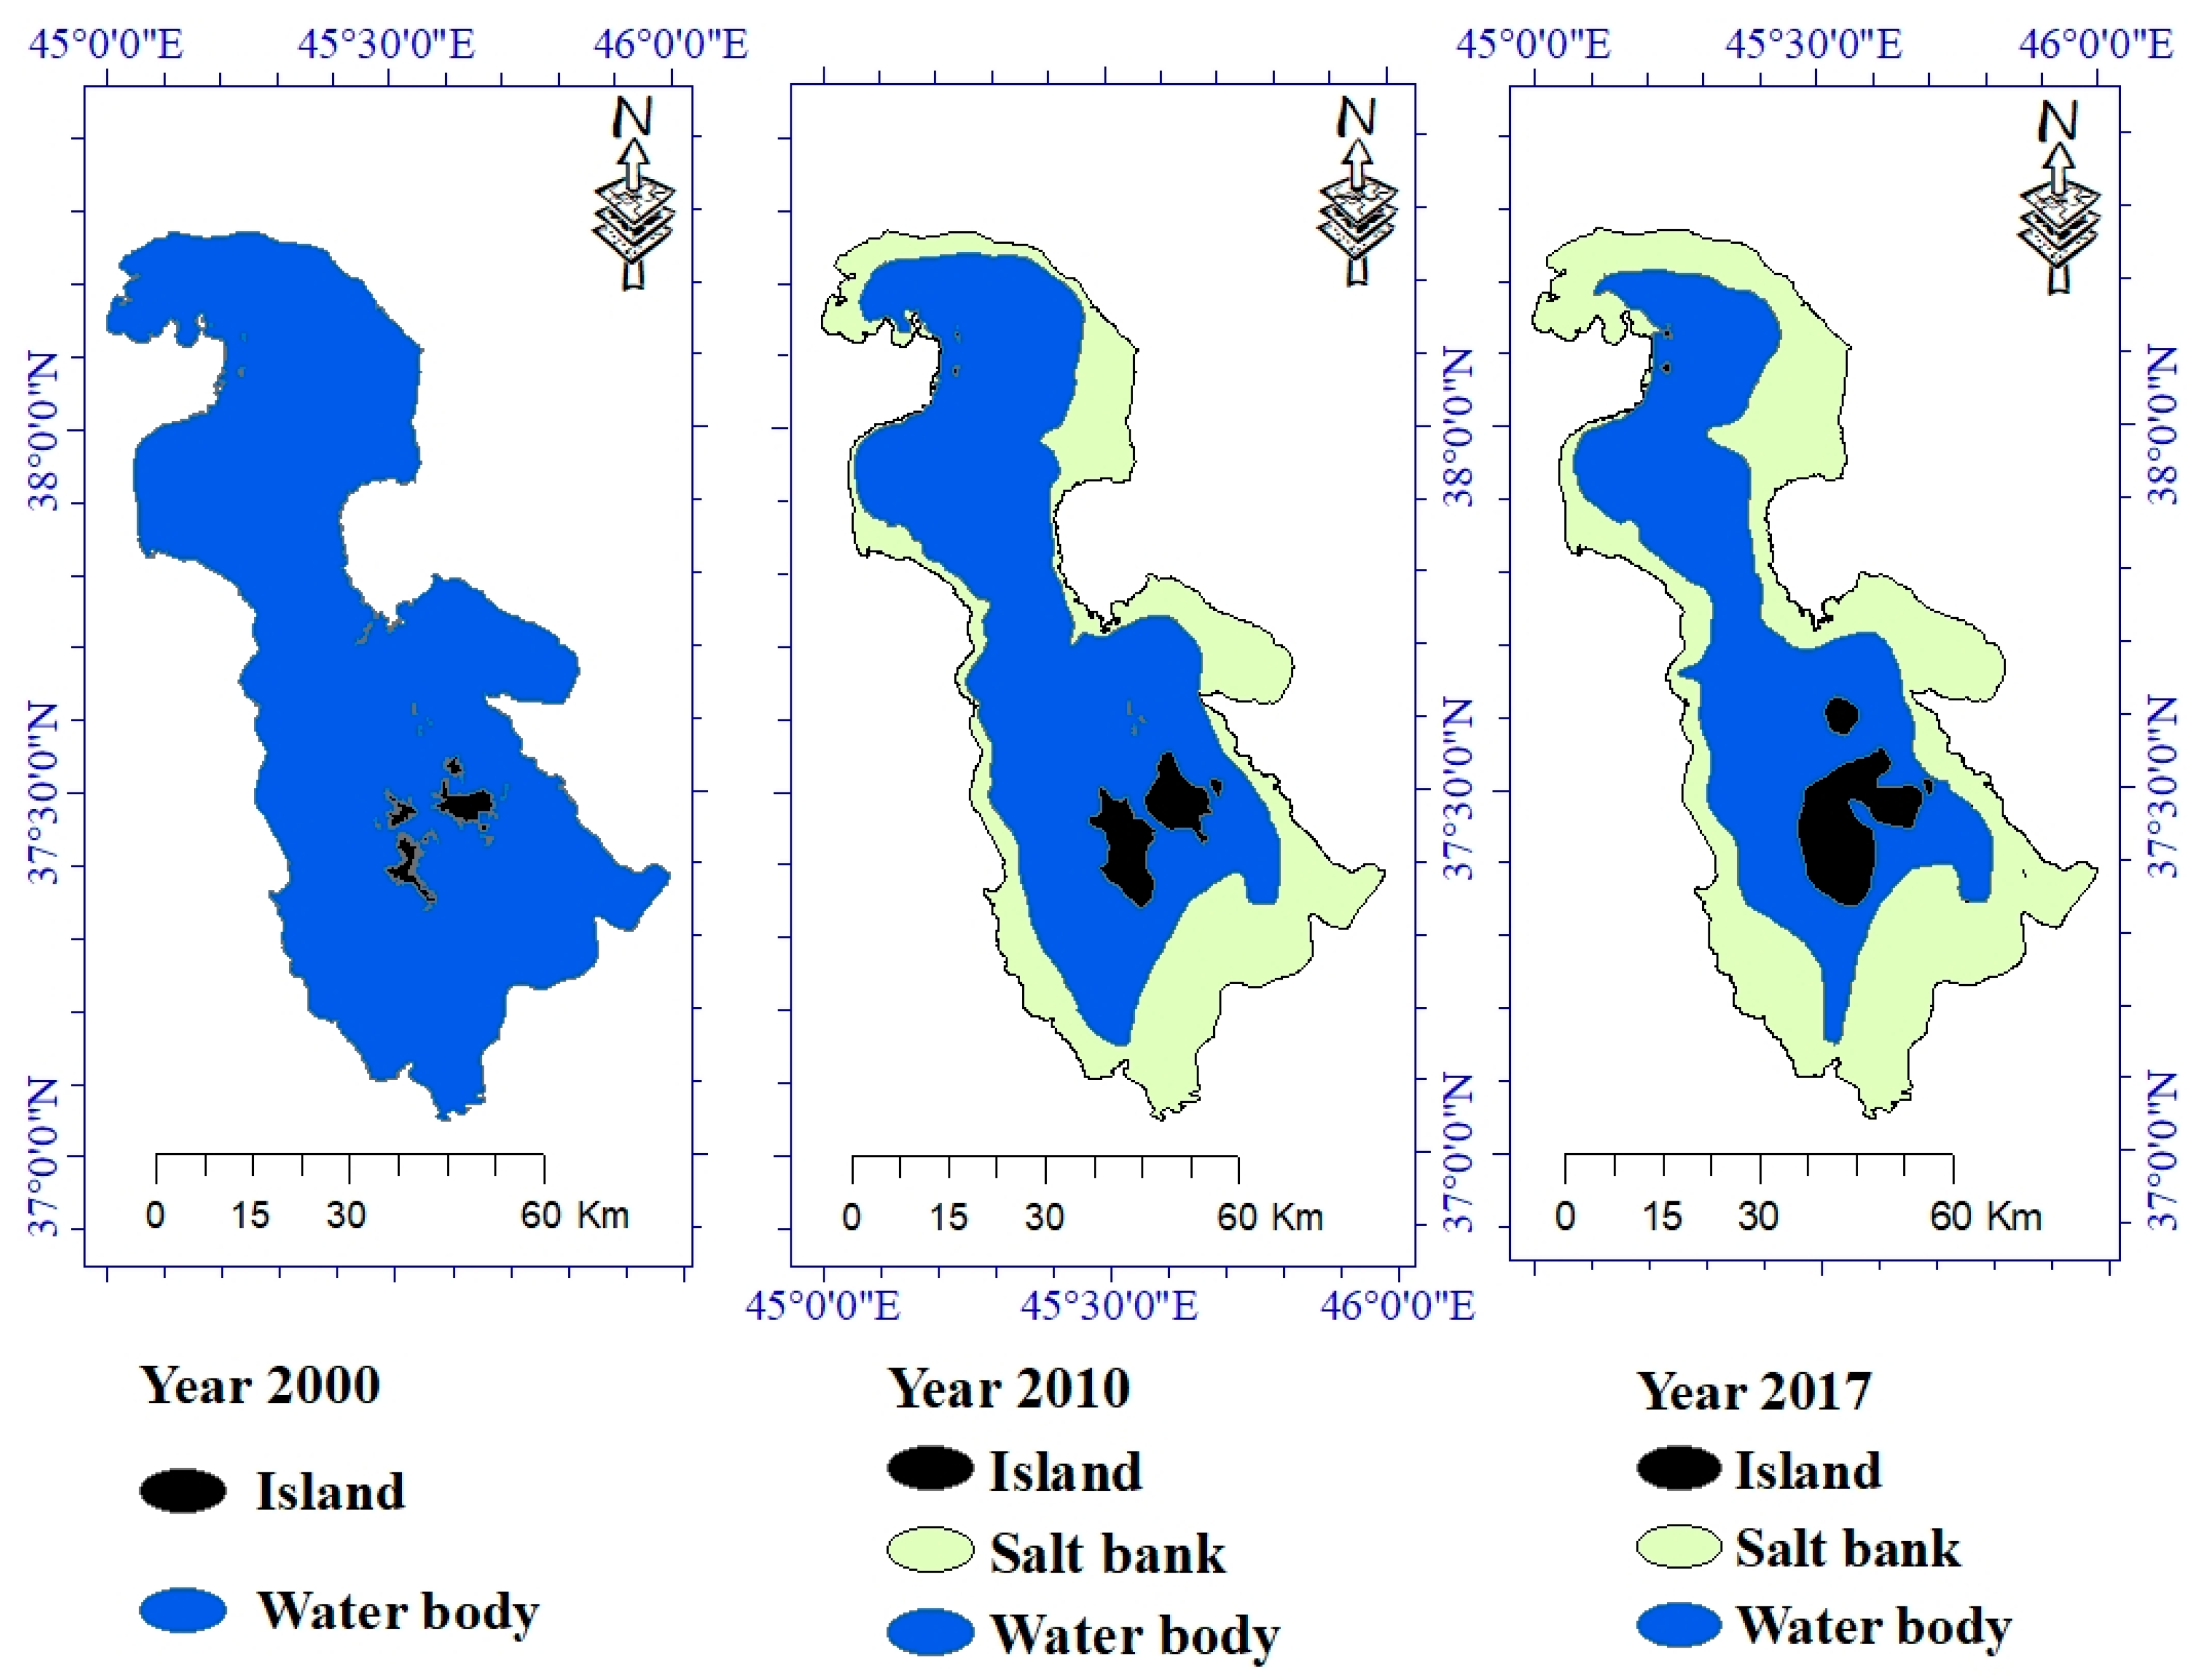
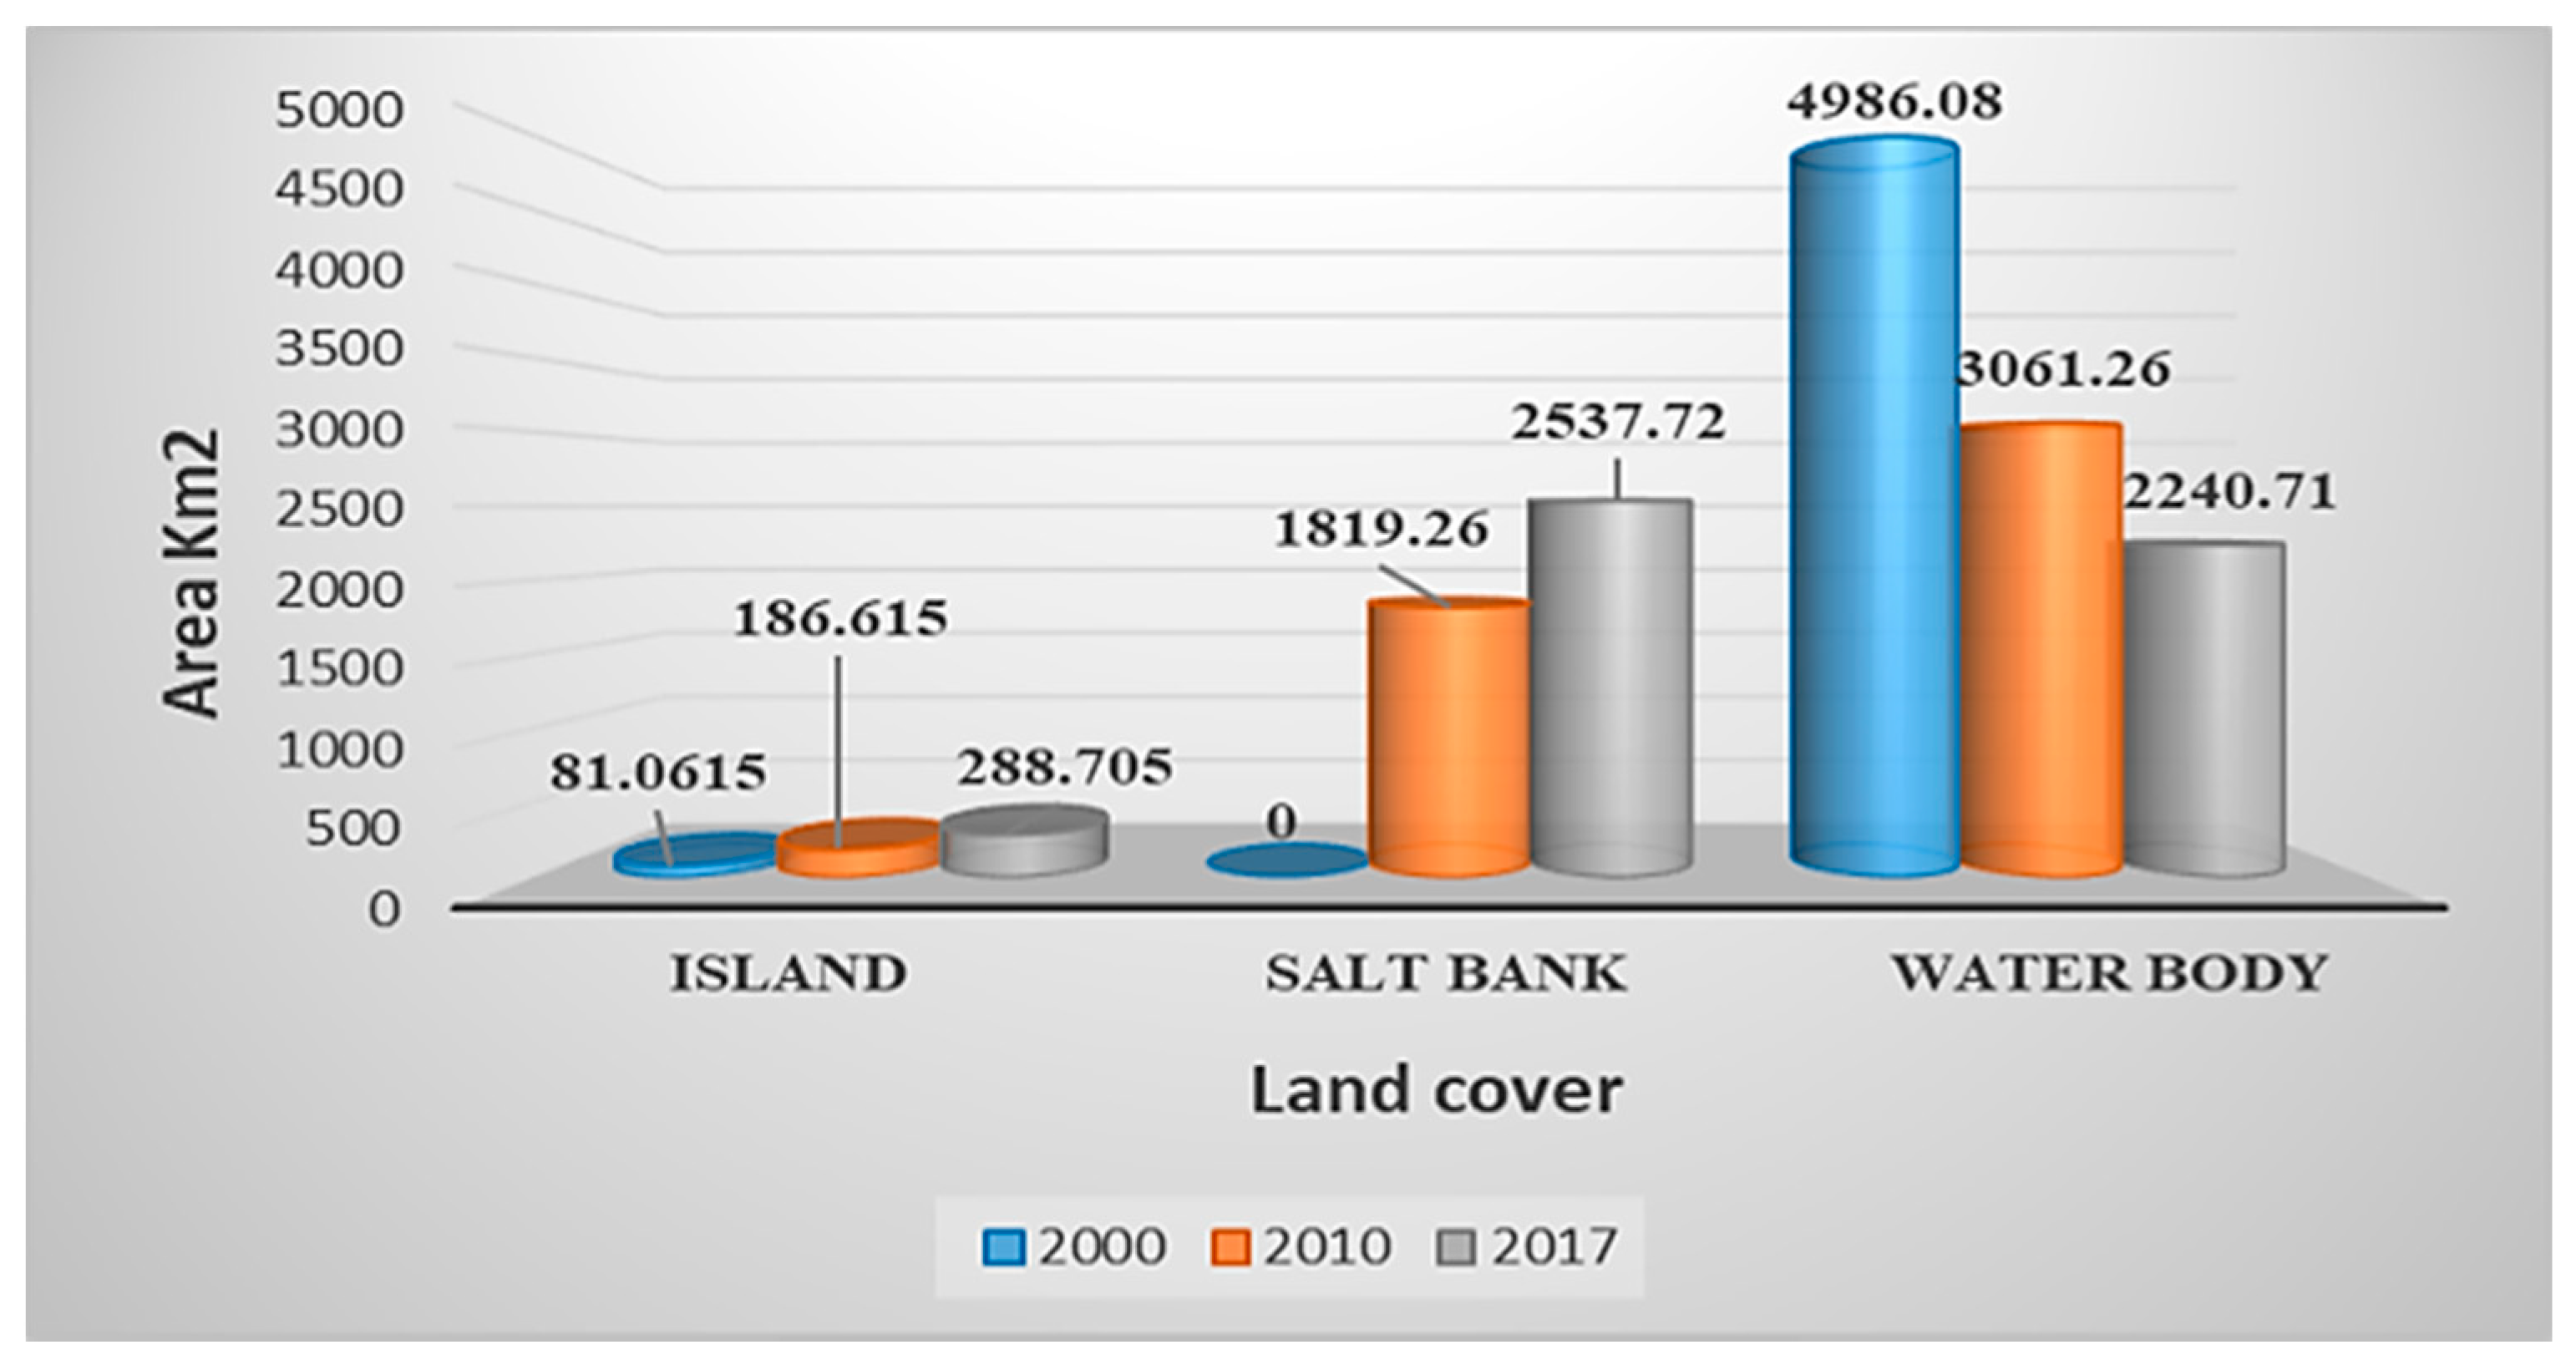
4.2. Extracting Water Level in the Years 2000, 2010, and 2017
4.3. Validation
5. Discussion
5.1. Causes of the Lake Shrinking
5.2. The Consequences of Shrinking of Lake Urmia
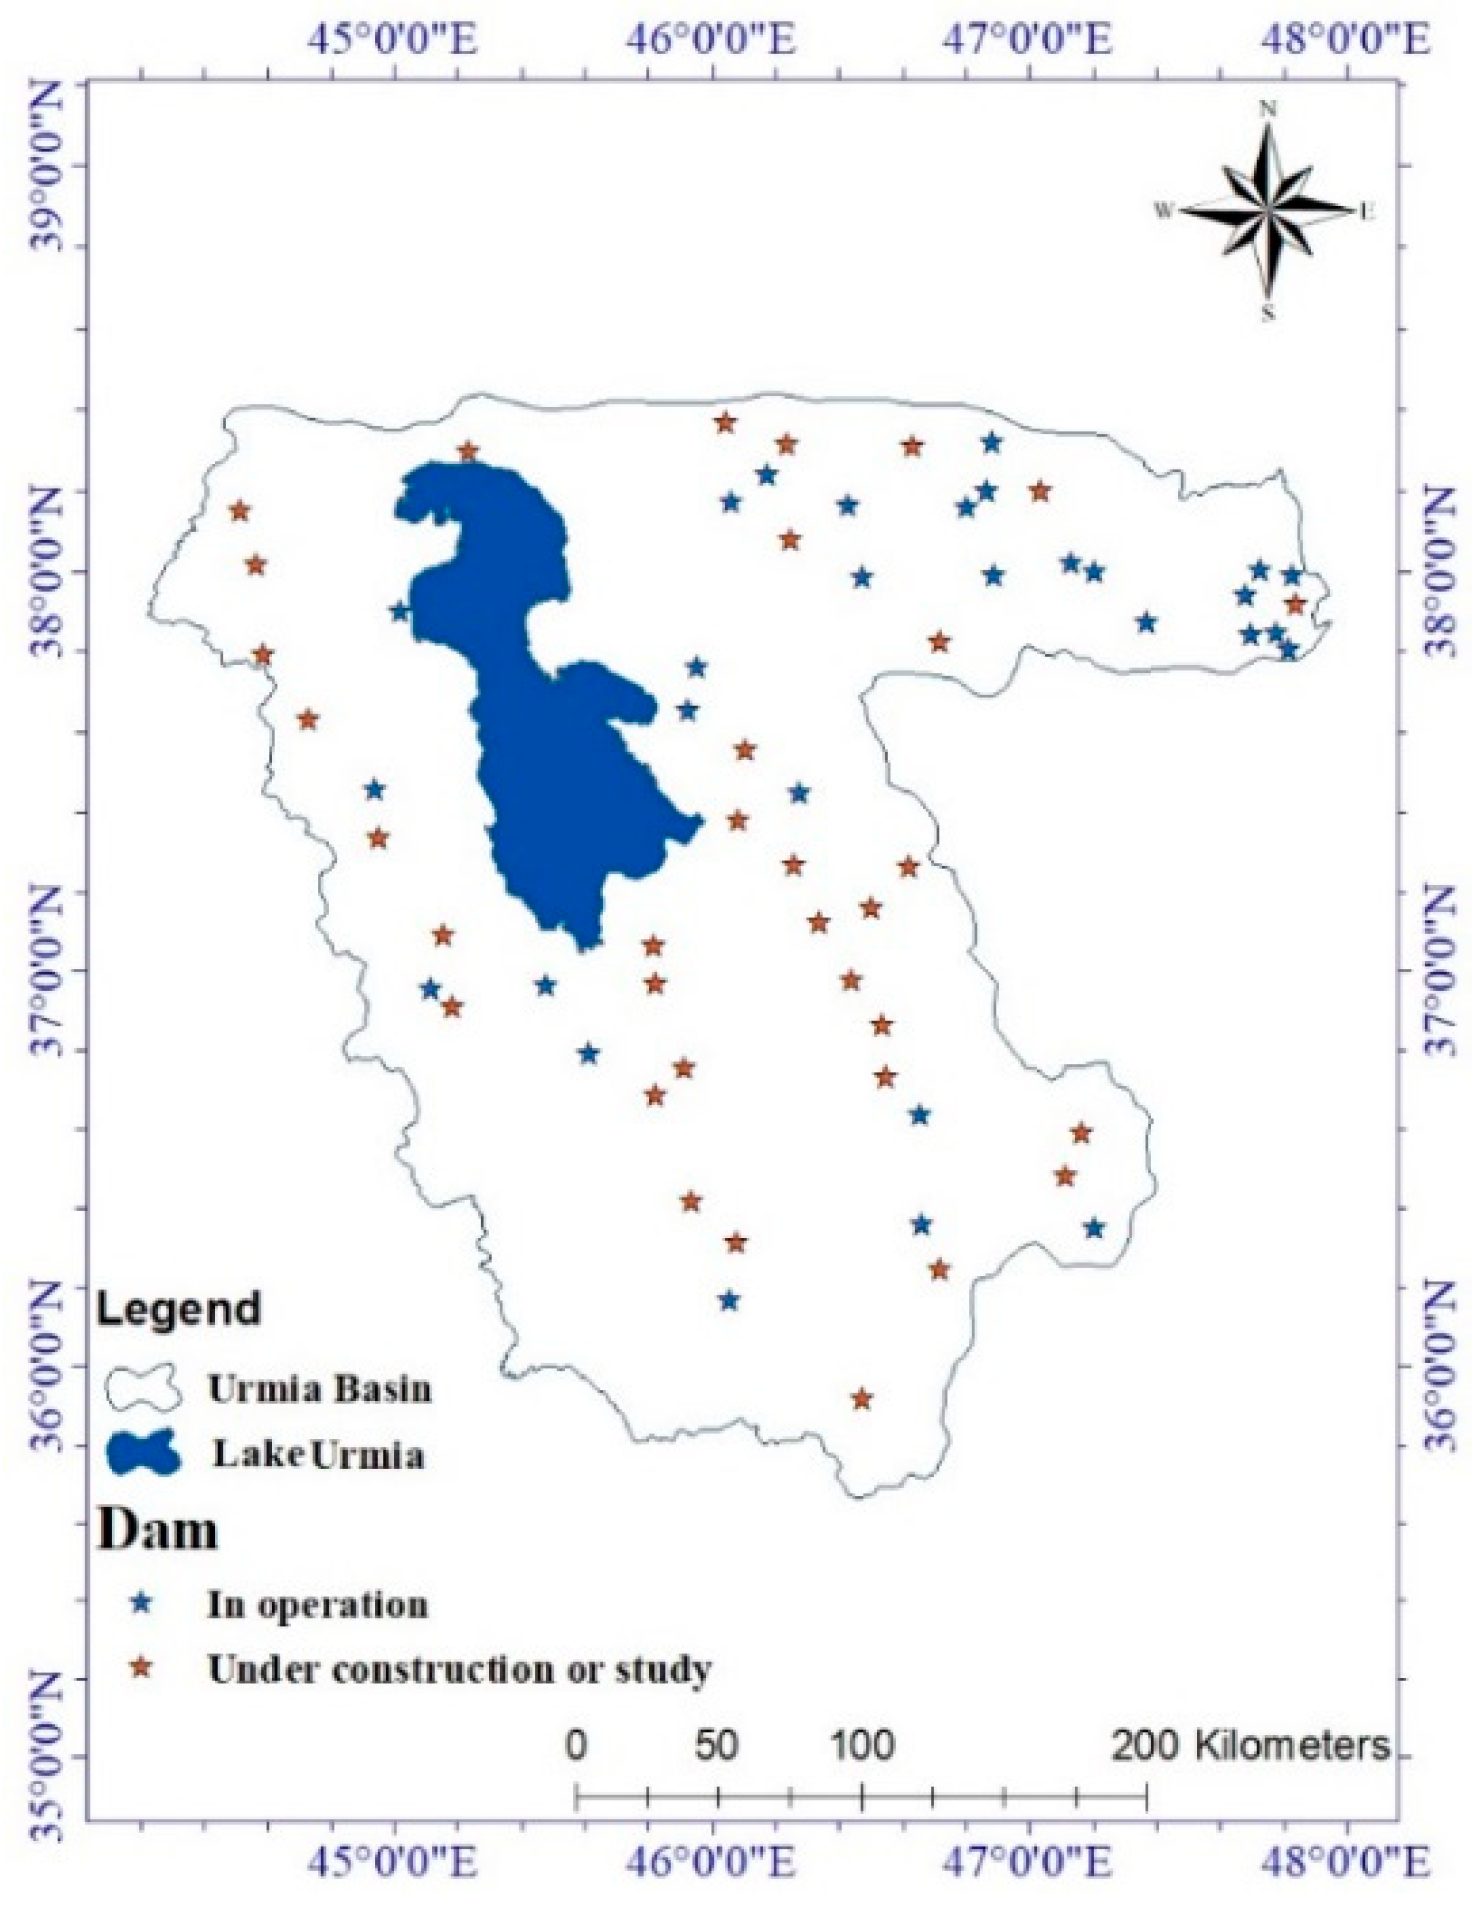
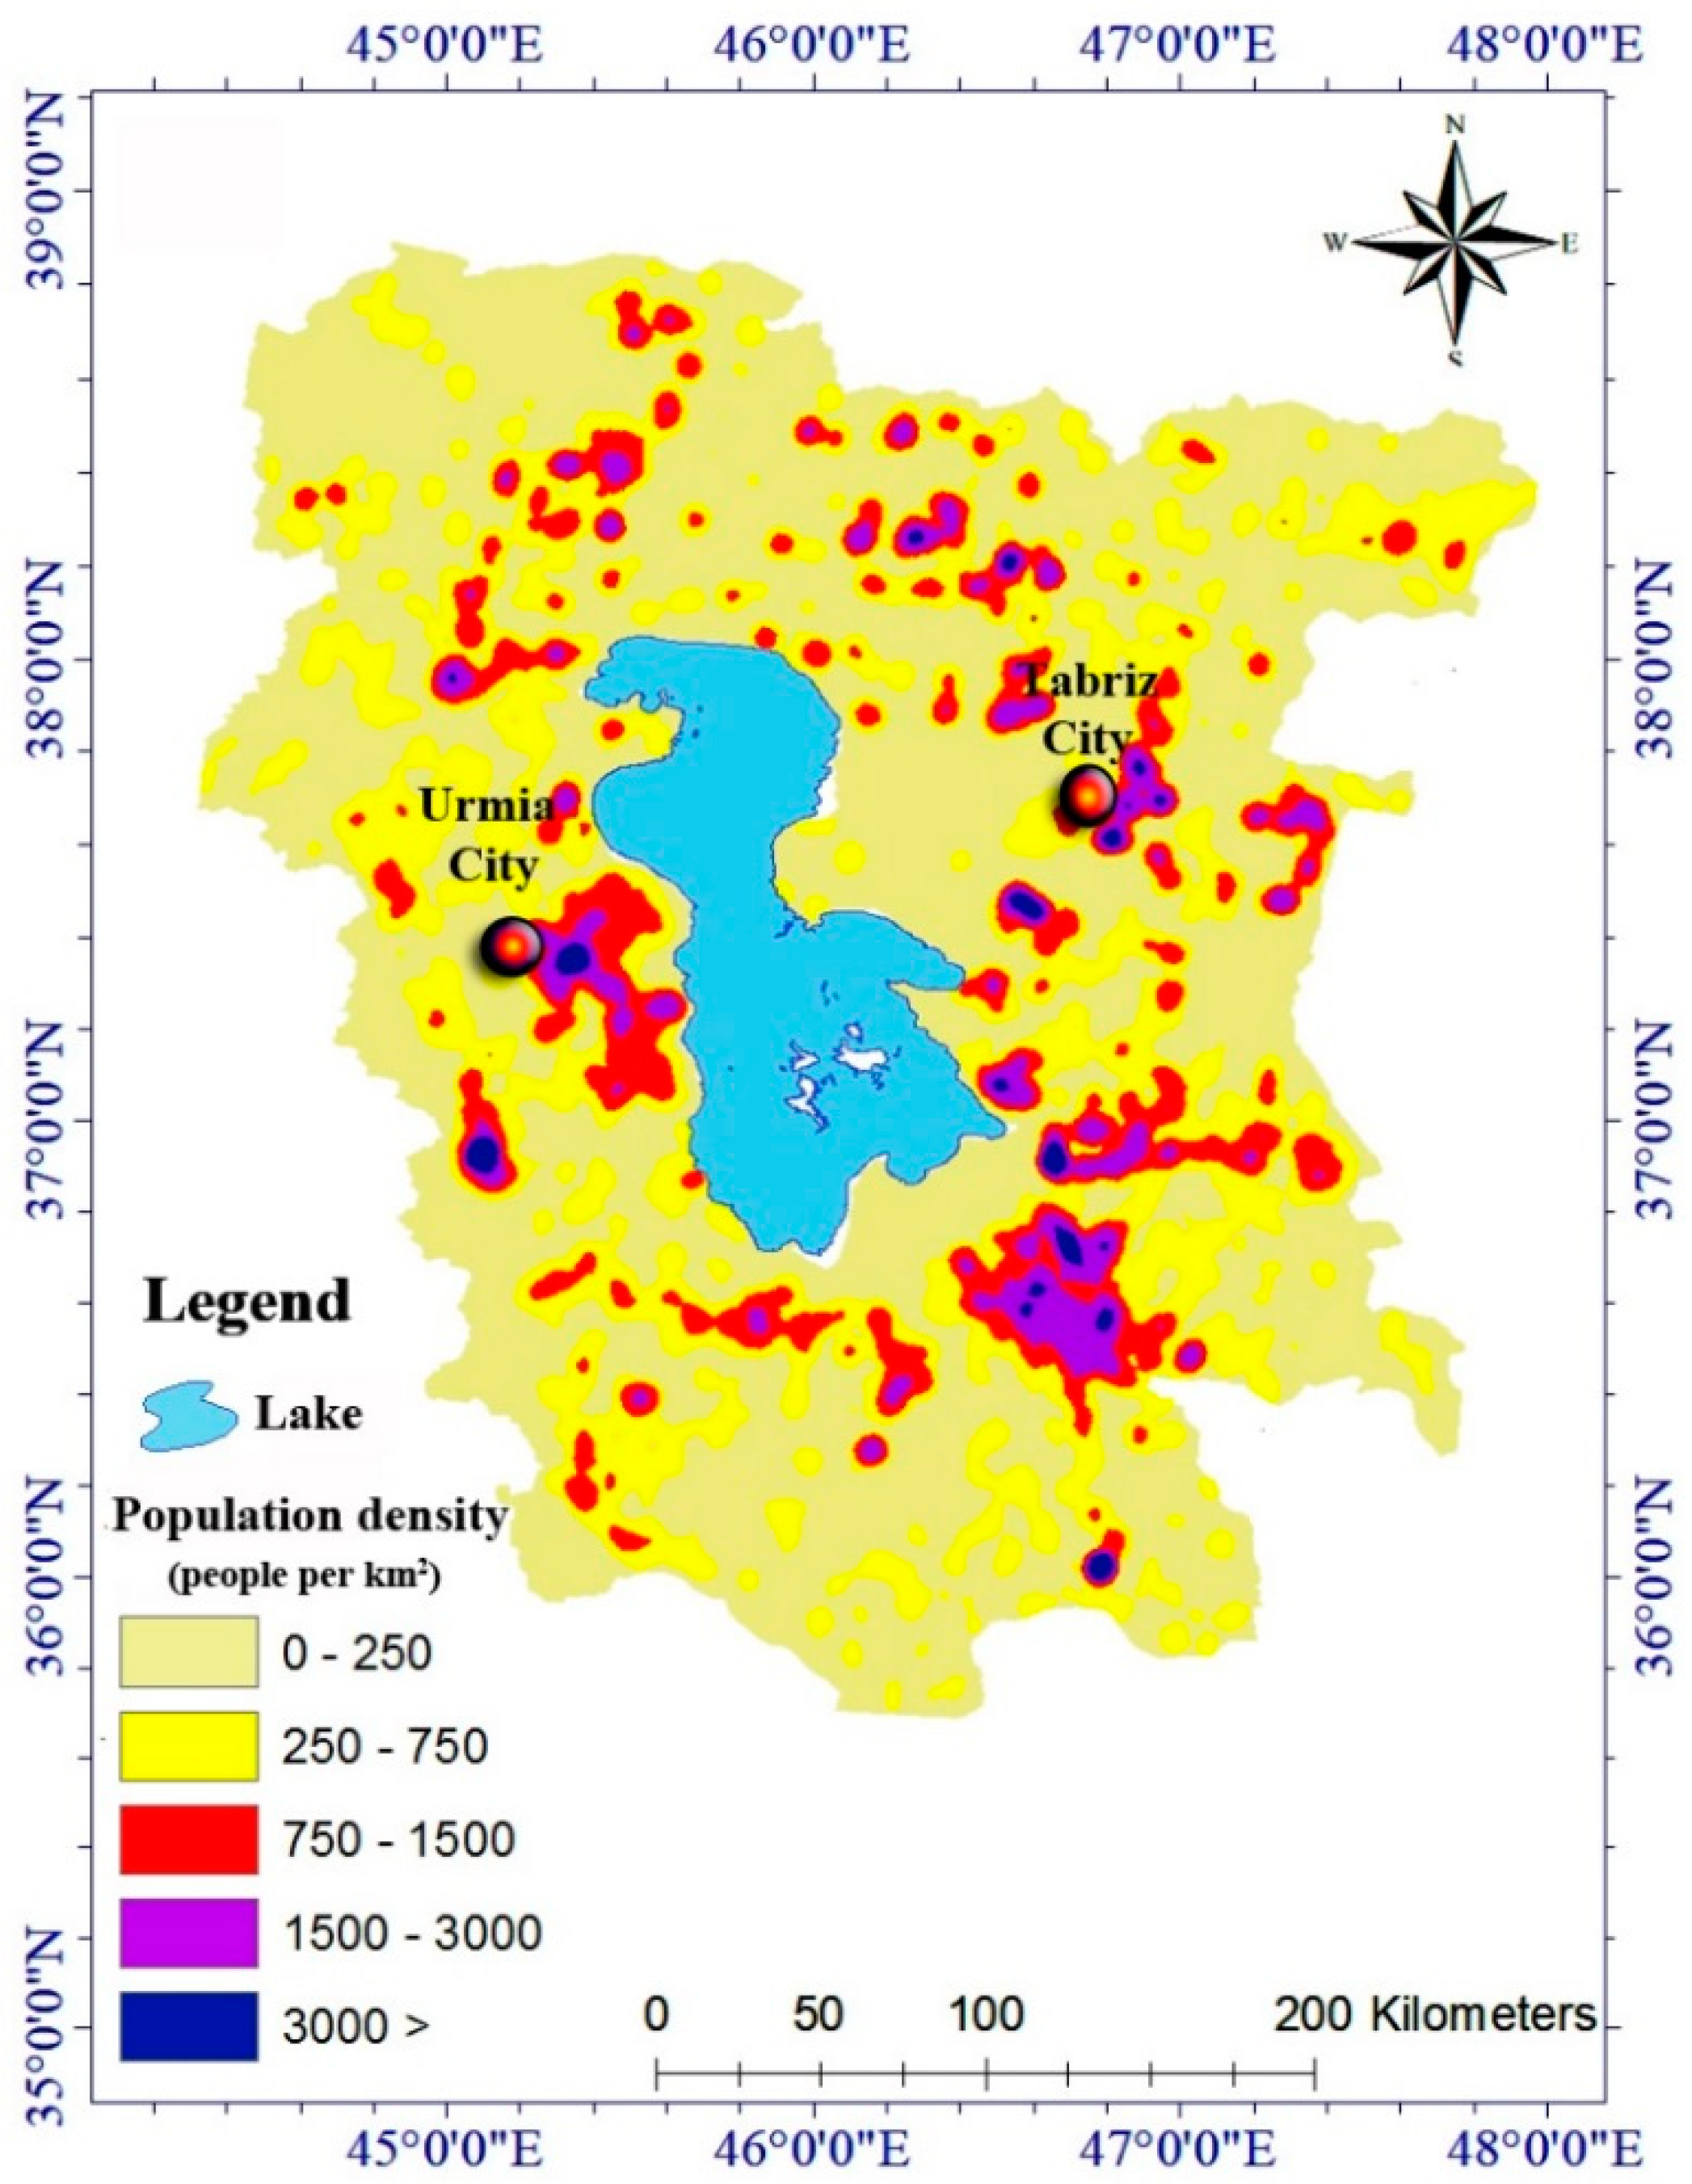
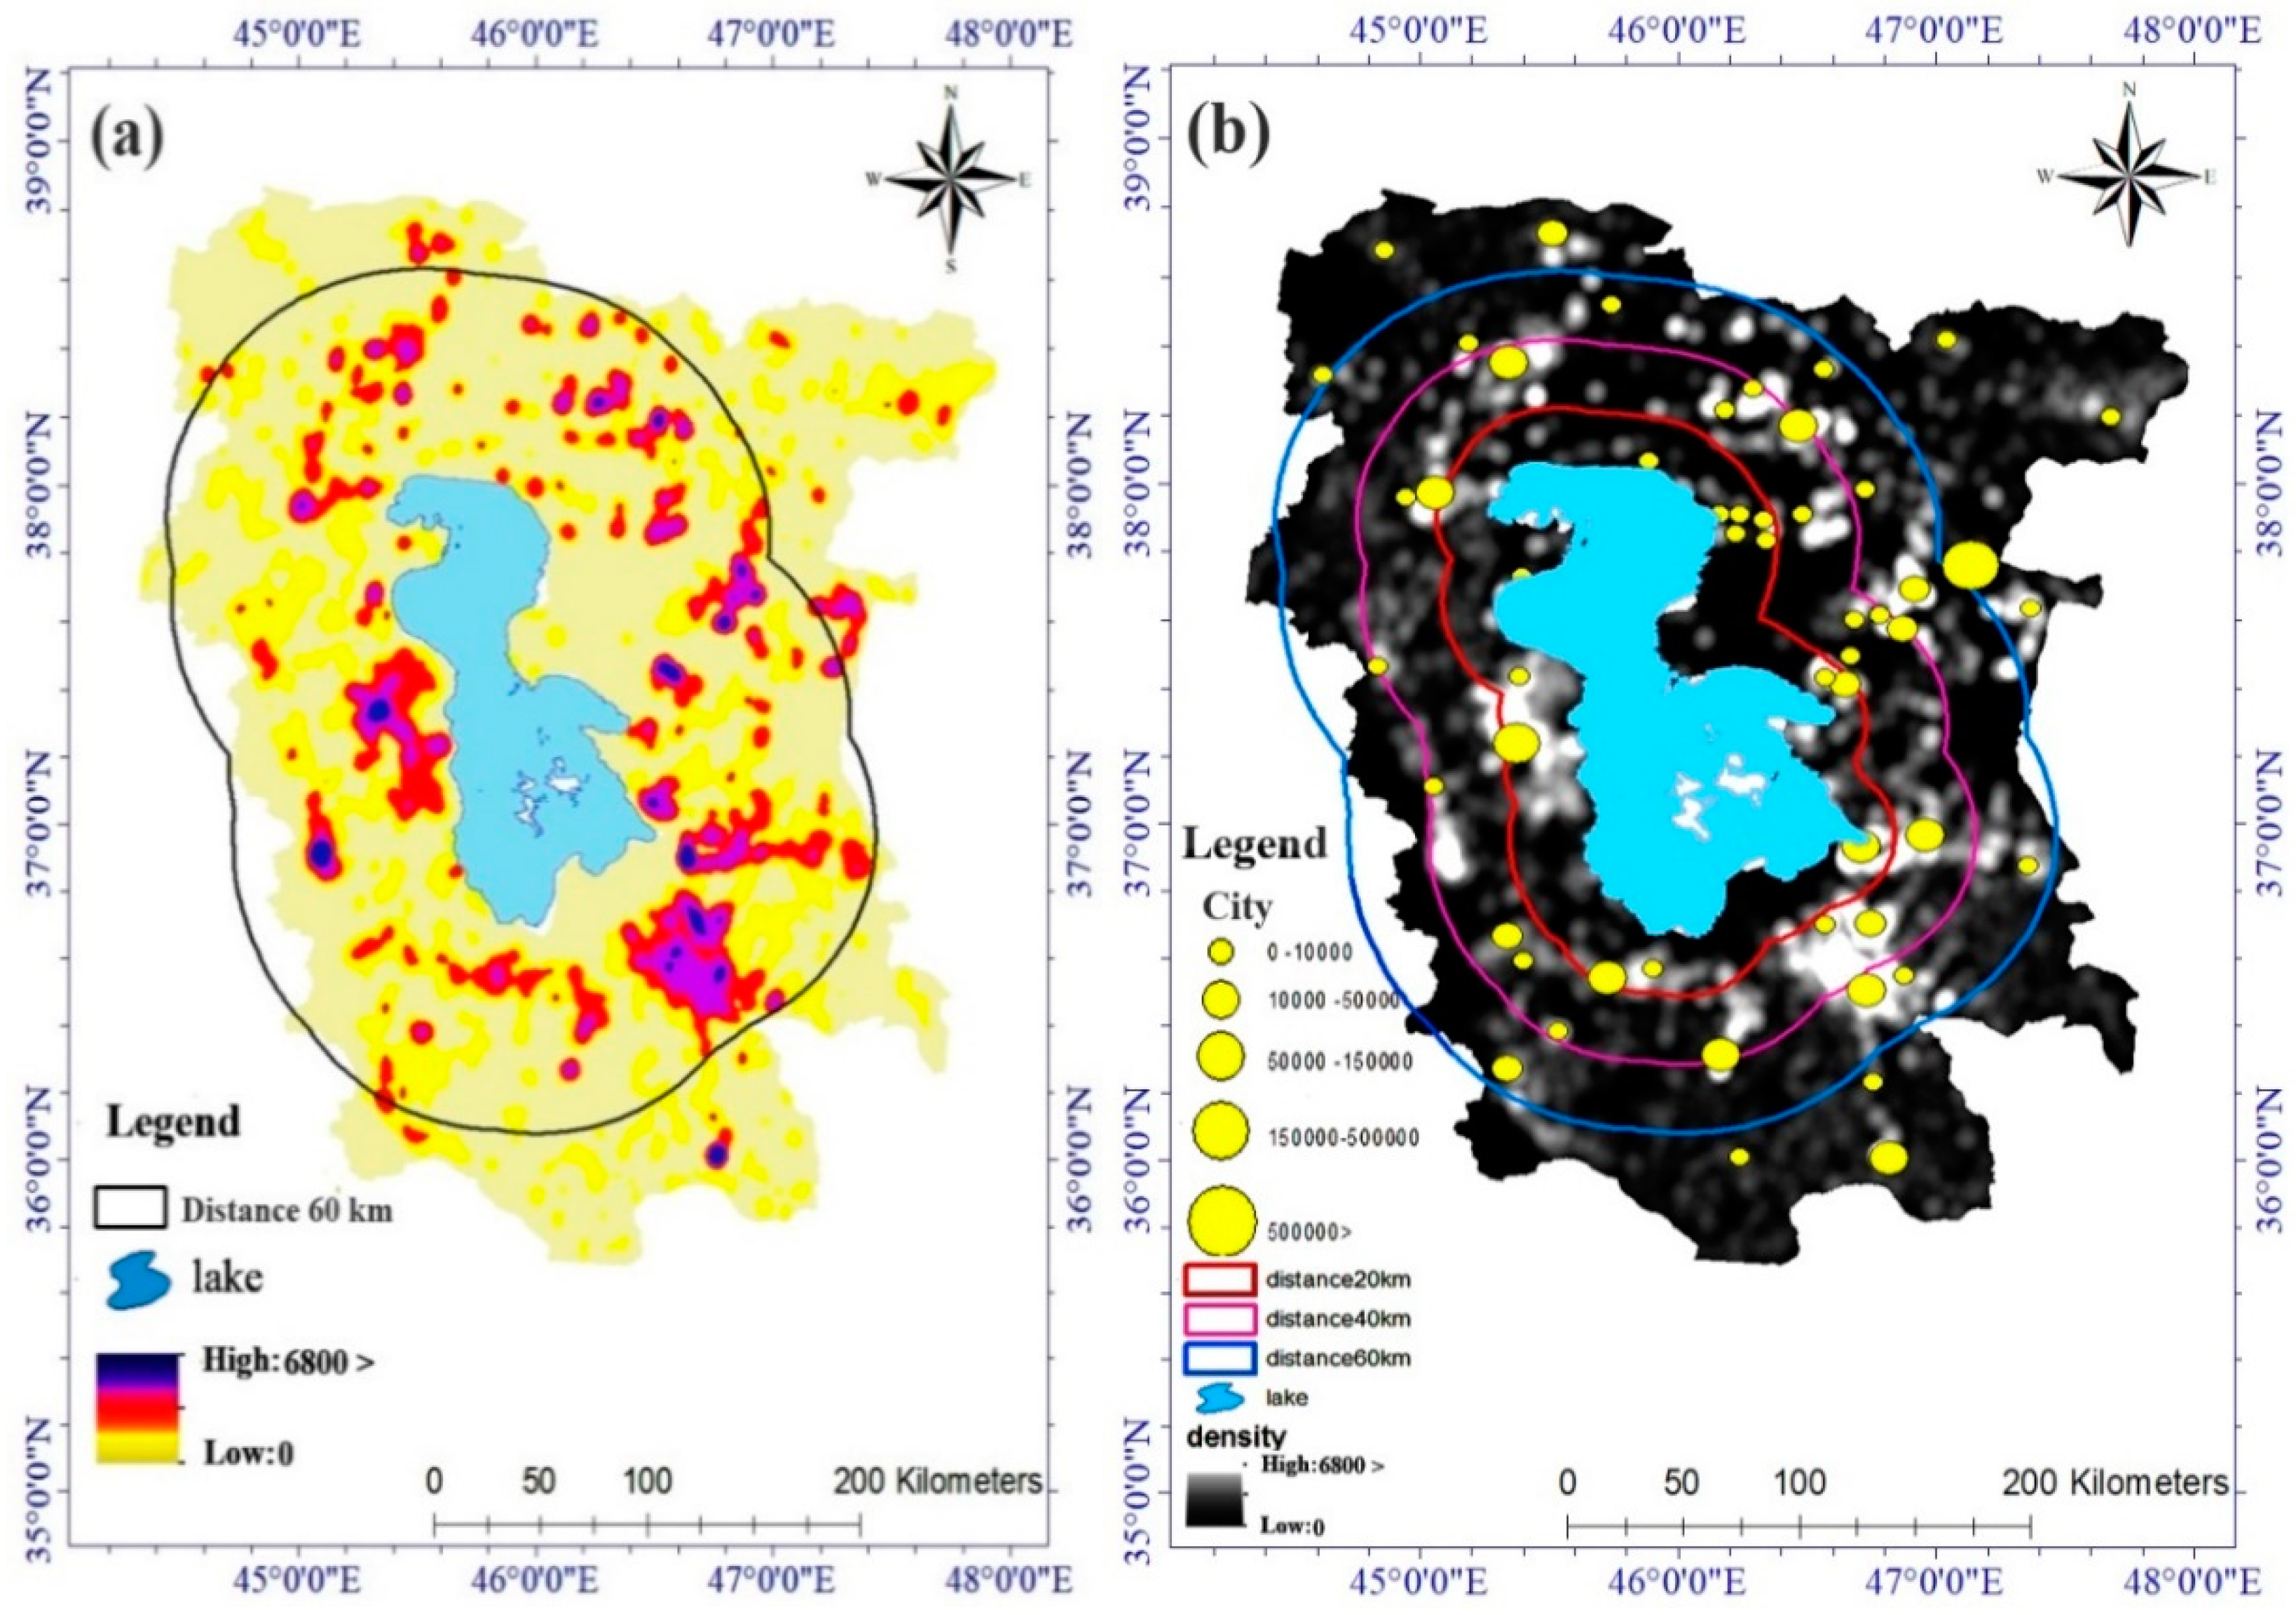
5.2.1. Effects on Human Population
5.2.2. Effects on Climatology
5.2.3. Effects on the Economy
6. Conclusions
Author Contributions
Funding
Conflicts of Interest
References
- Aurrocoechea, I.; Pethick, J. The coastline its physical and legal definition. Int. J. Estuar. Coast. Law 1986, 1, 29–42. [Google Scholar] [CrossRef]
- Duan, Z.; Bastiaanssen, W. Estimating water volume variations in lakes and reservoirs from four operational satellite altimetry databases and satellite imagery data. Remote Sens. Environ. 2013, 134, 403–416. [Google Scholar] [CrossRef]
- Hwang, C.; Cheng, Y.-S.; Han, J.; Kao, R.; Huang, C.-Y.; Wei, S.-H.; Wang, H. Multi-Decadal Monitoring of Lake Level Changes in the Qinghai-Tibet Plateau by the TOPEX/Poseidon-Family Altimeters: Climate Implication. Remote Sens. 2016, 8, 446. [Google Scholar] [CrossRef] [Green Version]
- Talebizadeh, M.; Moridnejad, A. Uncertainty analysis for the forecast of lake level fluctuations using ensembles of ANN and ANFIS models. Expert Syst. Appl. 2011, 38, 4126–4135. [Google Scholar] [CrossRef]
- Khan, M.S.; Coulibaly, P. Application of support vector machine in lake water level prediction. J. Hydrol. Eng. 2006, 11, 199–205. [Google Scholar] [CrossRef]
- Haghighi, A.T.; Kløve, B. A sensitivity analysis of lake water level response to changes in climate and river regimes. Limnol. Ecol. Manag. Inland Waters 2015, 51, 118–130. [Google Scholar] [CrossRef]
- Godwin, P.M.; Pan, Y.; Xiao, H.; Afzal, M.T. Progress in Preparation and Application of Modified Biochar for Improving Heavy Metal Ion Removal From Wastewater. J. Bioresour. Bioprod. 2019, 4, 31–42. [Google Scholar] [CrossRef]
- Zhu, J.-J.; Yu, L.-Z.; Wei, X.; Yang, K. Comparison of water quality in two catchments with different forest types in the headwater region of the Hun River, Northeast China. J. For. Res. 2019, 30, 565–576. [Google Scholar] [CrossRef]
- Yuan, T.; Lee, H.; Jung, H.C. Toward estimating wetland water level changes based on hydrological sensitivity analysis of PALSAR backscattering coefficients over different vegetation fields. Remote Sens. 2015, 7, 3153–3183. [Google Scholar] [CrossRef] [Green Version]
- Jalili, S.; Hamidi, S.A.; Namdar Ghanbari, R. Climate variability and anthropogenic effects on Lake Urmia water level fluctuations, northwestern Iran. Hydrol. Sci. J. 2016, 61, 1759–1769. [Google Scholar] [CrossRef] [Green Version]
- Eimanifar, A.; Mohebbi, F. Urmia Lake (northwest Iran): A brief review. Saline Syst. 2007, 3, 5. [Google Scholar] [CrossRef] [PubMed] [Green Version]
- Farajzadeh, J.; Fard, A.F.; Lotfi, S. Modeling of monthly rainfall and runoff of Urmia lake basin using “feed-forward neural network” and “time series analysis” model. Water Resour. Ind. 2014, 7, 38–48. [Google Scholar] [CrossRef] [Green Version]
- Lu, S.; Ouyang, N.; Wu, B.; Wei, Y.; Tesemma, Z. Lake water volume calculation with time series remote-sensing images. Int. J. Remote Sens. 2013, 34, 7962–7973. [Google Scholar] [CrossRef]
- Ahmadaali, J.; Barani, G.-A.; Qaderi, K.; Hessari, B. Analysis of the Effects of Water Management Strategies and Climate Change on the Environmental and Agricultural Sustainability of Urmia Lake Basin, Iran. Water 2018, 10, 160. [Google Scholar] [CrossRef] [Green Version]
- da Costa, M.R.A.; Attayde, J.L.; Becker, V. Effects of water level reduction on the dynamics of phytoplankton functional groups in tropical semi-arid shallow lakes. Hydrobiologia 2016, 778, 75–89. [Google Scholar] [CrossRef]
- Wantzen, K.M.; Rothhaupt, K.-O.; Mörtl, M.; Cantonati, M.; László, G.; Fischer, P. Ecological effects of water-level fluctuations in lakes: An urgent issue. Hydrobiologia 2008, 613, 1–4. [Google Scholar] [CrossRef] [Green Version]
- Ramos, O.E.R.; Cáceres, L.F.; Munoz, M.R.O.; Bhattacharya, P.; Quino, I.; Quintanilla, J.; Sracek, O.; Thunvik, R.; Bundschuh, J.; García, M.E. Sources and behavior of arsenic and trace elements in groundwater and surface water in the Poopó Lake Basin, Bolivian Altiplano. Environ. Earth Sci. 2012, 66, 793–807. [Google Scholar] [CrossRef]
- Leira, M.; Cantonati, M. Effects of water-level fluctuations on lakes: An annotated bibliography. In Ecological Effects of Water-Level Fluctuations in Lakes; Springer: Berlin, Germany, 2008; pp. 171–184. [Google Scholar]
- Khatami, S.; Berndtsson, R. Urmia Lake watershed restoration in Iran: Short-and long-term perspectives. In Proceedings of the 6th International Perspective on Water Resources & the Environment (IPWE), Izmir, Turkey, 7–9 January 2013. [Google Scholar]
- Medina, C.E.; Gomez-Enri, J.; Alonso, J.J.; Villares, P. Water level fluctuations derived from ENVISAT Radar Altimeter (RA-2) and in-situ measurements in a subtropical waterbody: Lake Izabal (Guatemala). Remote Sens. Environ. 2008, 112, 3604–3617. [Google Scholar] [CrossRef]
- Zarghami, M. Effective watershed management; case study of Urmia Lake, Iran. Lake Reserv. Manag. 2011, 27, 87–94. [Google Scholar] [CrossRef]
- Asem, A.; Mohebbi, F.; Ahmadi, R. Drought in Urmia Lake, the largest natural habitat of brine shrimp Artemia. World Aquac. 2012, 43, 36–38. [Google Scholar]
- Farzin, S.; Ifaei, P.; Farzin, N.; Hassanzadeh, Y.; Aalami, M. An investigation on changes and prediction of Urmia Lake water surface evaporation by chaos theory. Int. J. Environ. Res. 2012, 6, 815–824. [Google Scholar]
- Hassanzadeh, E.; Zarghami, M.; Hassanzadeh, Y. Determining the main factors in declining the Urmia Lake level by using system dynamics modeling. Water Resour. Manag. 2012, 26, 129–145. [Google Scholar] [CrossRef]
- Jalili, S.; Kirchner, I.; Livingstone, D.M.; Morid, S. The influence of large-scale atmospheric circulation weather types on variations in the water level of Lake Urmia, Iran. Int. J. Climatol. 2012, 32, 1990–1996. [Google Scholar] [CrossRef]
- Fathian, F.; Morid, S.; Kahya, E. Identification of trends in hydrological and climatic variables in Urmia Lake basin, Iran. Theor. Appl. Climatol. 2015, 119, 443–464. [Google Scholar] [CrossRef]
- Tan, C.; Ma, M.; Kuang, H. Spatial-temporal characteristics and climatic responses of water level fluctuations of global major lakes from 2002 to 2010. Remote Sens. 2017, 9, 150. [Google Scholar] [CrossRef] [Green Version]
- Chapi, K.; Rudra, R.P.; Ahmed, S.I.; Khan, A.A.; Gharabaghi, B.; Dickinson, W.T.; Goel, P.K. Spatial-temporal dynamics of runoff generation areas in a small agricultural watershed in southern Ontario. J. Water Resour. Prot. 2015, 7, 14. [Google Scholar] [CrossRef] [Green Version]
- Tien Bui, D.; Khosravi, K.; Li, S.; Shahabi, H.; Panahi, M.; Singh, V.P.; Chapi, K.; Shirzadi, A.; Panahi, S.; Chen, W. New hybrids of anfis with several optimization algorithms for flood susceptibility modeling. Water 2018, 10, 1210. [Google Scholar] [CrossRef] [Green Version]
- Kisi, O.; Shiri, J.; Karimi, S.; Shamshirband, S.; Motamedi, S.; Petković, D.; Hashim, R. A survey of water level fluctuation predicting in Urmia Lake using support vector machine with firefly algorithm. Appl. Math. Comput. 2015, 270, 731–743. [Google Scholar] [CrossRef]
- Karimi, S.; Shiri, J.; Kisi, O.; Makarynskyy, O. Forecasting water level fluctuations of Urmieh Lake using gene expression programming and adaptive neuro-fuzzy inference system. Int. J. Ocean Clim. Syst. 2012, 3, 109–125. [Google Scholar] [CrossRef] [Green Version]
- Karimi, S.; Kisi, O.; Shiri, J.; Makarynskyy, O. Neuro-fuzzy and neural network techniques for forecasting sea level in Darwin Harbor, Australia. Comput. Geosci. 2013, 52, 50–59. [Google Scholar] [CrossRef]
- Berrocoso, M.; Torrecillas, C.; Jigena, B.; Fernández-Ros, A. Determination of geomorphological and volumetric variations in the 1970 land volcanic craters area (Deception Island, Antarctica) from 1968 using historical and current maps, remote sensing and GNSS. Antarct. Sci. 2012, 24, 367–376. [Google Scholar] [CrossRef]
- Ouria, M.; Sevinc, H. The role of dams in drying up lake Urmia and its environmental impacts on Azerbaijani districts of Iran. SAUSSUREA 2016, 6, 54–65, ISSN: 0373-2525. [Google Scholar]
- Delju, A.; Ceylan, A.; Piguet, E.; Rebetez, M. Observed climate variability and change in Urmia Lake Basin, Iran. Theor. Appl. Climatol. 2013, 111, 285–296. [Google Scholar] [CrossRef] [Green Version]
- Marjani, A.; Jamali, M. Role of exchange flow in salt water balance of Urmia Lake. Dyn. Atmos. Oceans 2014, 65, 1–16. [Google Scholar] [CrossRef]
- Emdadi, A.; Gikas, P.; Farazaki, M.; Emami, Y. Salinity gradient energy potential at the hyper saline Urmia Lake–ZarrinehRud River system in Iran. Renew. Energy 2016, 86, 154–162. [Google Scholar] [CrossRef]
- Alipour, S. Hydrogeochemistry of seasonal variation of Urmia Salt Lake. Chin. J. Geochem. 2006, 25, 193–194. [Google Scholar] [CrossRef]
- Fazeli, M.; Tofighi, H.; Samadi, N.; Jamalifar, H. Effects of salinity on β-carotene production by Dunaliella tertiolecta DCCBC26 isolated from the Urmia salt lake, north of Iran. Bioresour. Technol. 2006, 97, 2453–2456. [Google Scholar] [CrossRef]
- Hamzehpour, N.; Bogaert, P. Improved spatiotemporal monitoring of soil salinity using filtered kriging with measurement errors: An application to the West Urmia Lake, Iran. Geoderma 2017, 295, 22–33. [Google Scholar] [CrossRef] [Green Version]
- Belward, A.S.; Skøien, J.O. Who launched what, when and why; trends in global land-cover observation capacity from civilian earth observation satellites. ISPRS J. Photogramm. Remote Sens. 2015, 103, 115–128. [Google Scholar] [CrossRef]
- El-Kawy, O.A.; Rød, J.; Ismail, H.; Suliman, A. Land use and land cover change detection in the western Nile delta of Egypt using remote sensing data. Appl. Geogr. 2011, 31, 483–494. [Google Scholar] [CrossRef]
- Ma, L.; Li, M.; Ma, X.; Cheng, L.; Du, P.; Liu, Y. A review of supervised object-based land-cover image classification. ISPRS J. Photogramm. Remote Sens. 2017, 130, 277–293. [Google Scholar] [CrossRef]
- Markham, B.L.; Storey, J.C.; Williams, D.L.; Irons, J.R. Landsat sensor performance: History and current status. IEEE Trans. Geosci. Remote Sens. 2004, 42, 2691–2694. [Google Scholar] [CrossRef]
- Richards, J.A.; Richards, J. Remote Sensing Digital Image Analysis; Springer: Berlin, Germany, 1999; Volume 3. [Google Scholar]
- Congalton, R.G. A review of assessing the accuracy of classifications of remotely sensed data. Remote Sens. Environ. 1991, 37, 35–46. [Google Scholar] [CrossRef]
- Story, M.; Congalton, R.G. Accuracy assessment: A user’s perspective. Photogramm. Eng. Remote Sens. 1986, 52, 397–399. [Google Scholar]
- Mather, P.; Tso, B. Classification Methods for Remotely Sensed Data; CRC Press: Boca Raton, FL, USA, 2016. [Google Scholar]
- Pontius, R.G., Jr.; Millones, M. Death to Kappa: Birth of quantity disagreement and allocation disagreement for accuracy assessment. Int. J. Remote Sens. 2011, 32, 4407–4429. [Google Scholar] [CrossRef]
- Landis, J.R.; Koch, G.G. An application of hierarchical kappa-type statistics in the assessment of majority agreement among multiple observers. Biometrics 1977, 363–374. [Google Scholar] [CrossRef]
- Chapi, K.; Singh, V.P.; Shirzadi, A.; Shahabi, H.; Bui, D.T.; Pham, B.T.; Khosravi, K. A novel hybrid artificial intelligence approach for flood susceptibility assessment. Environ. Model. Softw. 2017, 95, 229–245. [Google Scholar] [CrossRef]
- Bokaie, M.; Zarkesh, M.K.; Arasteh, P.D.; Hosseini, A. Assessment of urban heat island based on the relationship between land surface temperature and land use/land cover in Tehran. Sustain. Cities Soc. 2016, 23, 94–104. [Google Scholar] [CrossRef]
- Shadkam, S.; Ludwig, F.; van Oel, P.; Kirmit, Ç.; Kabat, P. Impacts of climate change and water resources development on the declining inflow into Iran’s Urmia Lake. J. Great Lakes Res. 2016, 42, 942–952. [Google Scholar] [CrossRef] [Green Version]
- Mehrian, M.R.; Hernandez, R.P.; Yavari, A.R.; Faryadi, S.; Salehi, E. Investigating the causality of changes in the landscape pattern of Lake Urmia basin, Iran using remote sensing and time series analysis. Environ. Monit. Assess. 2016, 188, 462. [Google Scholar] [CrossRef]
- Mardi, A.H.; Khaghani, A.; MacDonald, A.B.; Nguyen, P.; Karimi, N.; Heidary, P.; Karimi, N.; Saemian, P.; Sehatkashani, S.; Tajrishy, M. The Lake Urmia environmental disaster in Iran: A look at aerosol pollution. Sci. Total Environ. 2018, 633, 42–49. [Google Scholar] [CrossRef] [PubMed]
- Sabzehee, F.; Nafisia, V.; Pour, S.I. Investigation on the urmia lake drought using satellite altimetry and weather reanalysis products. Int. Arch. Photogramm. Remote Sens. Spat. Inf. Sci. 2017, 42, W4. [Google Scholar] [CrossRef] [Green Version]
- Alizadeh-Choobari, O.; Ahmadi-Givi, F.; Mirzaei, N.; Owlad, E. Climate change and anthropogenic impacts on the rapid shrinkage of Lake Urmia. Int. J. Climatol. 2016, 36, 4276–4286. [Google Scholar] [CrossRef]
- Gholampour, A.; Nabizadeh, R.; Hassanvand, M.S.; Taghipour, H.; Nazmara, S.; Mahvi, A.H. Characterization of saline dust emission resulted from Urmia Lake drying. J. Environ. Health Sci. Eng. 2015, 13, 82. [Google Scholar] [CrossRef] [Green Version]
- Asem, A.; Eimanifar, A.; Djamali, M.; De los Rios, P.; Wink, M. Biodiversity of the hypersaline Urmia Lake national park (NW Iran). Diversity 2014, 6, 102–132. [Google Scholar] [CrossRef] [Green Version]
- Asem, A.; Eimanifar, A.; Wink, M. Update of “Biodiversity of the Hypersaline Urmia Lake National Park (NW Iran)”. Diversity 2016, 8, 6. [Google Scholar] [CrossRef] [Green Version]
- Abbaspour, M.; Nazaridoust, A. Determination of environmental water requirements of Lake Urmia, Iran: An ecological approach. Int. J. Environ. Stud. 2007, 64, 161–169. [Google Scholar] [CrossRef]
- Agh, N.; Van Stappen, G.; Bossier, P.; Sepehri, H.; Lofti, V.; Rouhani, S.R.; Sorgeloos, P. Effects of salinity on survival, growth, reproductive and life span characteristics of Artemia populations from Urmia Lake and neighboring lagoons. Pak. J. Biol. Sci. 2008, 11, 164–172. [Google Scholar] [CrossRef] [Green Version]
- Golabian, H. Urumia Lake: Hydro-ecological stabilization and permanence. In Macro-Engineering Seawater in Unique Environments; Springer: Berlin, Germany, 2010; pp. 365–397. [Google Scholar]
- Wada, Y.; van Beek, L.P.; van Kempen, C.M.; Reckman, J.W.; Vasak, S.; Bierkens, M.F. Global depletion of groundwater resources. Geophys. Res. Lett. 2010, 37, 1–5. [Google Scholar] [CrossRef] [Green Version]
- Reveshty, M.; Maruyama, Y. Study of Uremia Lake Level Fluctuations and Predict Probable Changes Using Multi-Temporal Satellite Images and Ground Truth Data Period (1976–2010). Map Asia 2010, 179–194. [Google Scholar]


| Year Path & Row | 2000 | 2010 | 2017 |
|---|---|---|---|
| Path 168, row 34 | 18/10/2000 | 11/08/2010 | 01/10/2017 |
| Path 169, row 33 | 22/08/2000 | 18/08/2010 | 08/10/2017 |
| Path 169, row 34 | 22/08/2000 | 18/08/2010 | 08/10/2017 |
| Model | OA (%) | Kappa | Island | Salt Bank | Water Body |
|---|---|---|---|---|---|
| SVM | 95.729 | 0.951 | 97.200 | 0.000 | 94.348 |
| MD | 93.232 | 0.932 | 94.301 | 0.000 | 91.638 |
| SAM | 88.631 | 0.881 | 87.621 | 0.000 | 89.312 |
| NN | 94.040 | 0.946 | 91.233 | 0.000 | 98.93 |
| ML | 97.918 | 0.963 | 98.231 | 0.000 | 97.436 |
| Model | OA (%) | Kappa | Island | Salt Bank | Water Body |
|---|---|---|---|---|---|
| SVM | 95.719 | 0.951 | 93.200 | 95.420 | 98.348 |
| MD | 93.232 | 0.932 | 94.301 | 90.519 | 96.638 |
| SAM | 88.633 | 0.881 | 90.621 | 85.223 | 89.312 |
| NN | 94.047 | 0.946 | 93.233 | 92.852 | 97.93 |
| ML | 97.620 | 0.957 | 97.131 | 96.562 | 98.436 |
| Model | OA (%) | Kappa | Island | Salt Bank | Water Body |
|---|---|---|---|---|---|
| SVM | 94.793 | 0.922 | 91.200 | 97.420 | 95.348 |
| MD | 89.320 | 0.912 | 85.801 | 88.913 | 92.838 |
| SAM | 87.631 | 0.801 | 80.621 | 90.223 | 91.312 |
| NN | 95.042 | 0.916 | 91.233 | 96.852 | 98.930 |
| ML | 96.302 | 0.938 | 96.021 | 97.185 | 97.326 |
| Accuracy Assessment | Year 2000 | Year 2010 | Year 2017 |
|---|---|---|---|
| Kappa | 0.9634 | 0.9574 | 0.9384 |
| Overall accuracy | 97.9187% | 97.6198% | 96.3021% |
© 2020 by the authors. Licensee MDPI, Basel, Switzerland. This article is an open access article distributed under the terms and conditions of the Creative Commons Attribution (CC BY) license (http://creativecommons.org/licenses/by/4.0/).
Share and Cite
Nhu, V.-H.; Mohammadi, A.; Shahabi, H.; Shirzadi, A.; Al-Ansari, N.; Ahmad, B.B.; Chen, W.; Khodadadi, M.; Ahmadi, M.; Khosravi, K.; et al. Monitoring and Assessment of Water Level Fluctuations of the Lake Urmia and Its Environmental Consequences Using Multitemporal Landsat 7 ETM+ Images. Int. J. Environ. Res. Public Health 2020, 17, 4210. https://0-doi-org.brum.beds.ac.uk/10.3390/ijerph17124210
Nhu V-H, Mohammadi A, Shahabi H, Shirzadi A, Al-Ansari N, Ahmad BB, Chen W, Khodadadi M, Ahmadi M, Khosravi K, et al. Monitoring and Assessment of Water Level Fluctuations of the Lake Urmia and Its Environmental Consequences Using Multitemporal Landsat 7 ETM+ Images. International Journal of Environmental Research and Public Health. 2020; 17(12):4210. https://0-doi-org.brum.beds.ac.uk/10.3390/ijerph17124210
Chicago/Turabian StyleNhu, Viet-Ha, Ayub Mohammadi, Himan Shahabi, Ataollah Shirzadi, Nadhir Al-Ansari, Baharin Bin Ahmad, Wei Chen, Masood Khodadadi, Mehdi Ahmadi, Khabat Khosravi, and et al. 2020. "Monitoring and Assessment of Water Level Fluctuations of the Lake Urmia and Its Environmental Consequences Using Multitemporal Landsat 7 ETM+ Images" International Journal of Environmental Research and Public Health 17, no. 12: 4210. https://0-doi-org.brum.beds.ac.uk/10.3390/ijerph17124210