Effect of a Single Nutritional Intervention Previous to a Critical Period of Fat Gain in University Students with Overweight and Obesity: A Randomized Controlled Trial

 ,
,  ,
,  ,
,  and
and 
Abstract
:1. Introduction
2. Materials and Methods
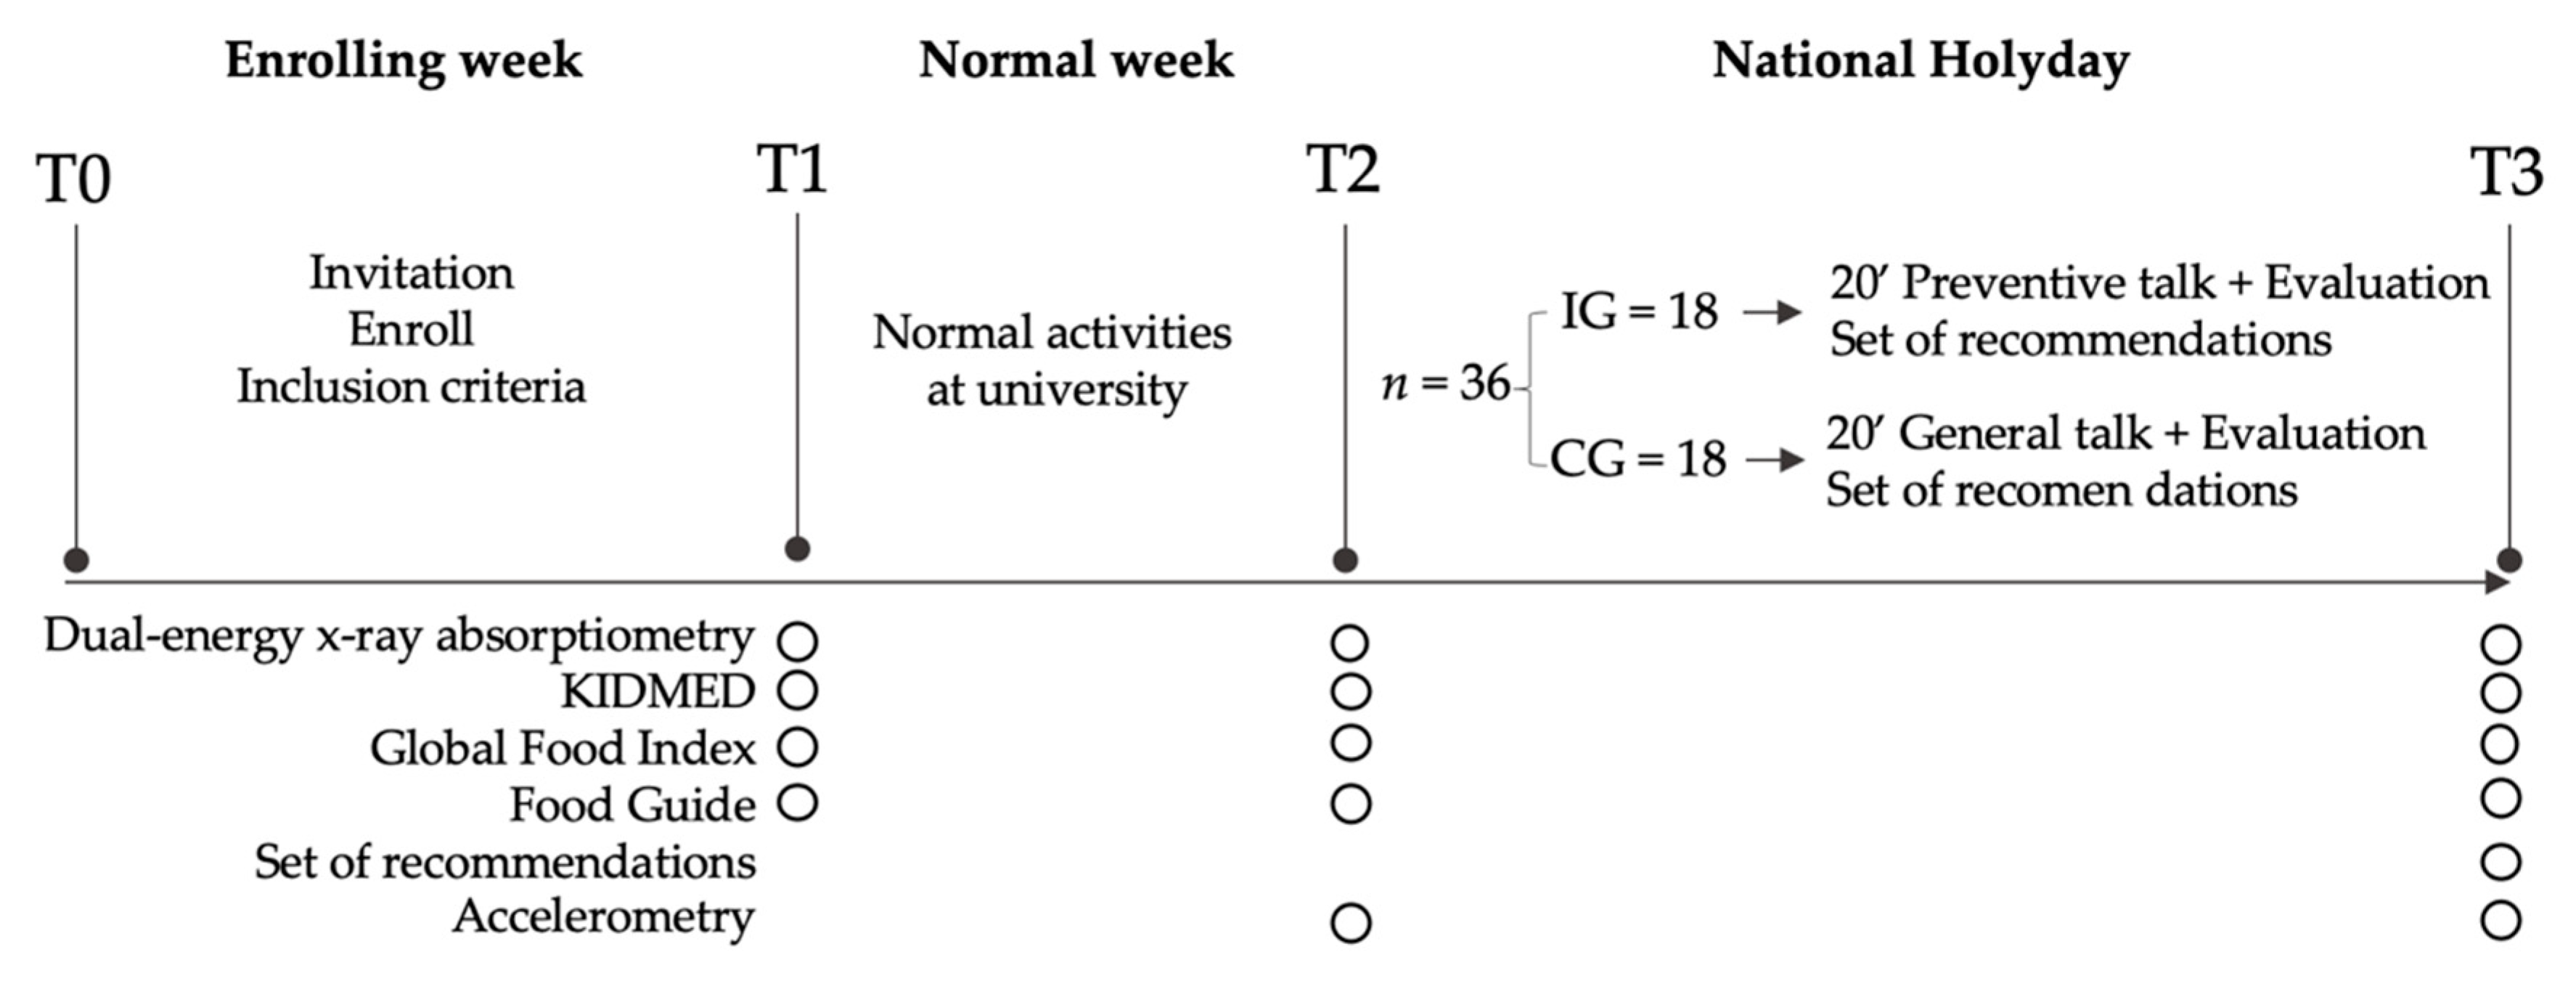
2.1. Study Design
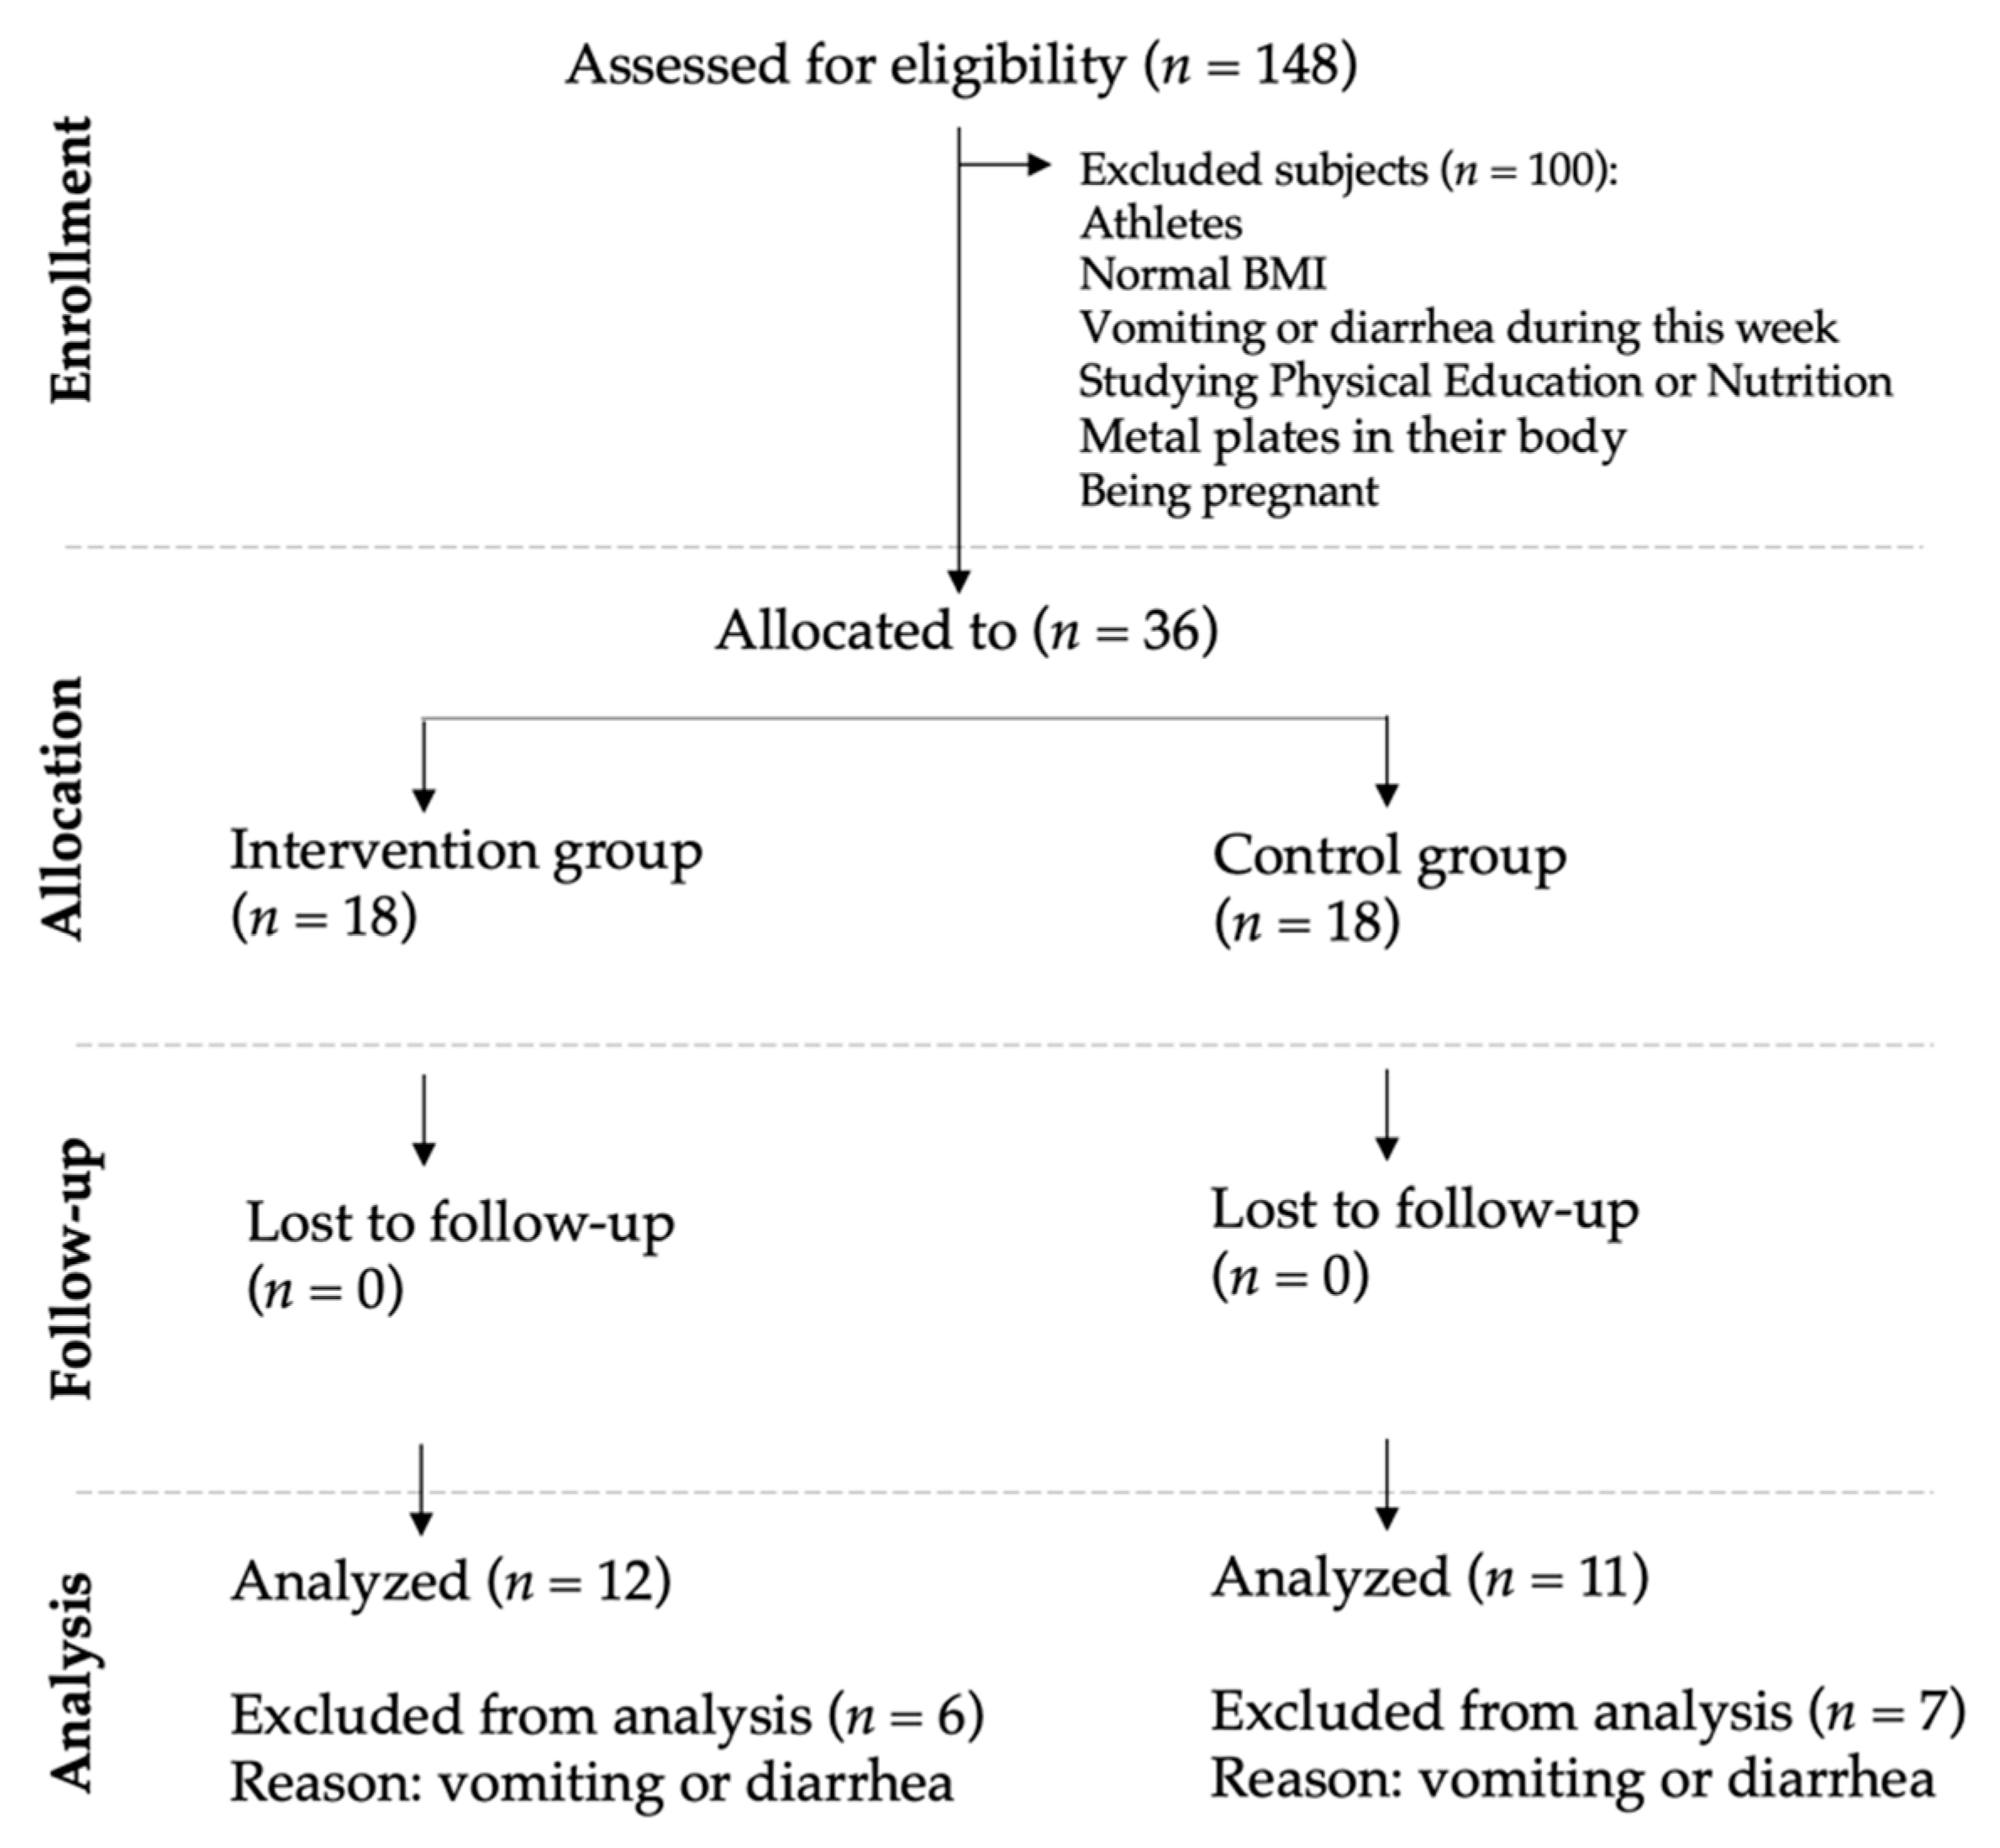
2.2. Participants
2.3. Procedures and Instrumentation
2.4. Body Composition Measurements: Primary Outcome
2.5. Feeding Questionnaires and Food Guide Recommendations: Secondary Outcome
2.6. Physical Activity Level: Seconday Outcome
2.7. Intervention
2.8. Statistical Analysis
3. Results
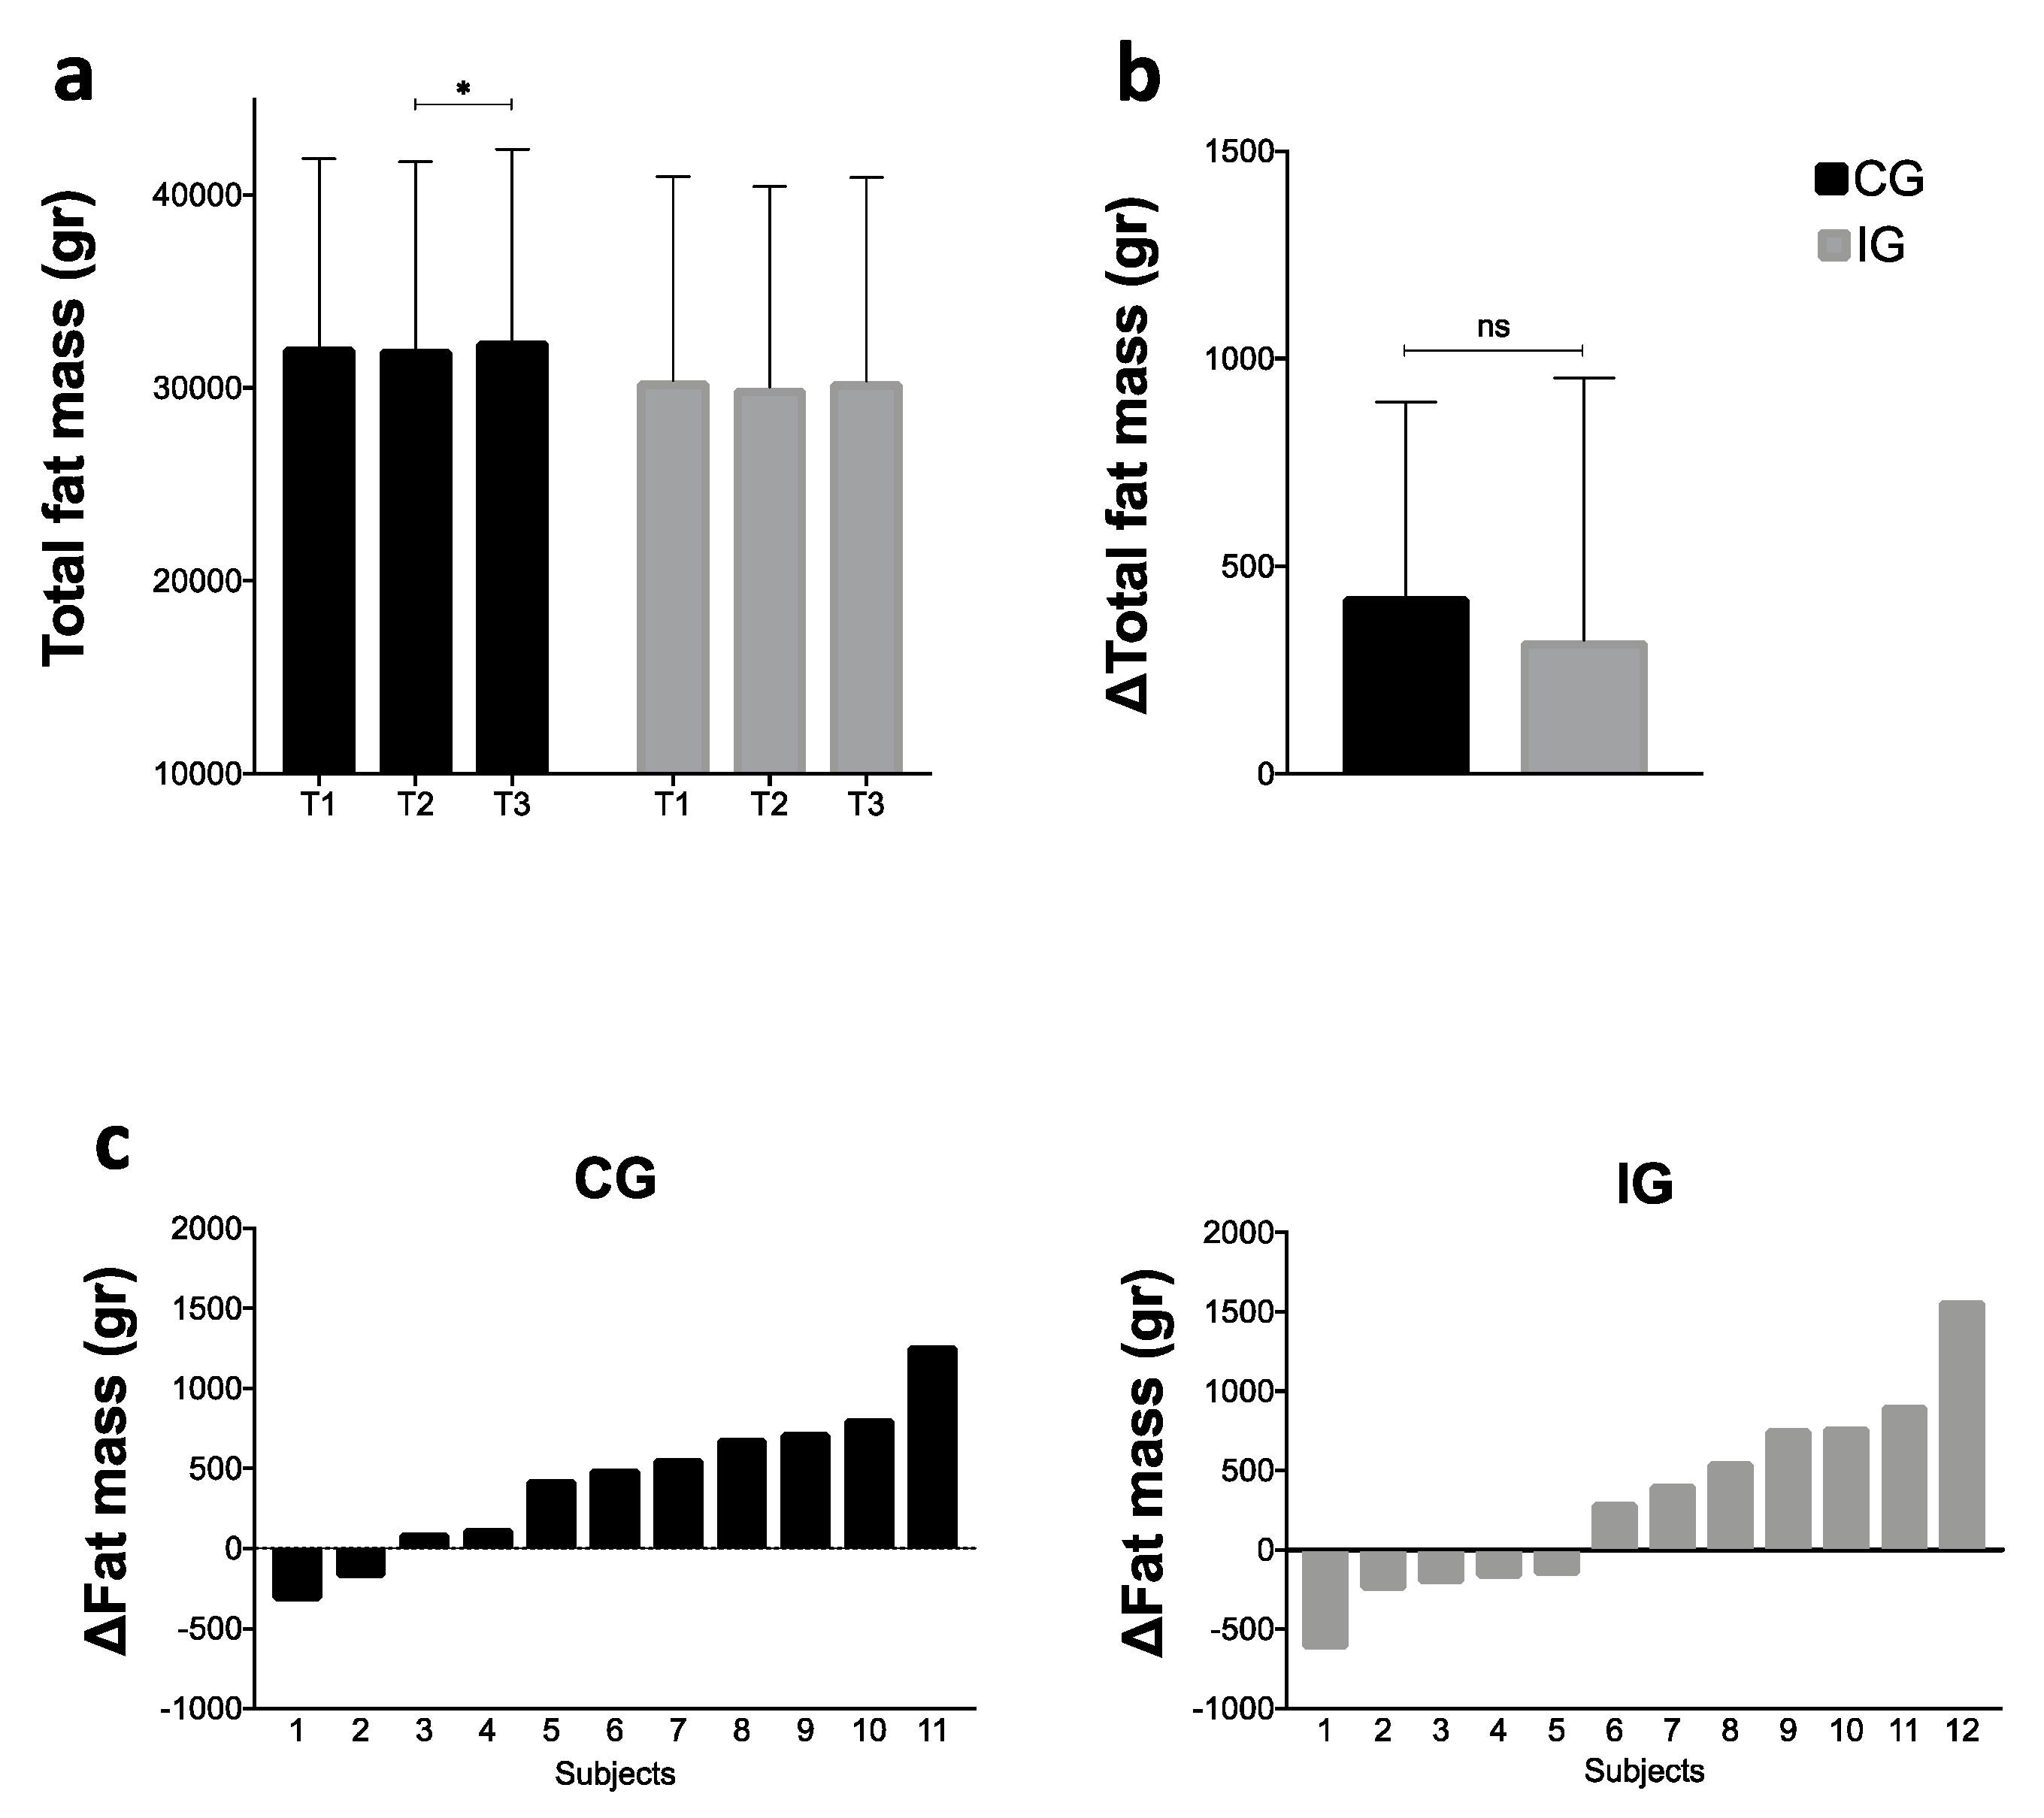
3.1. Fat Mass
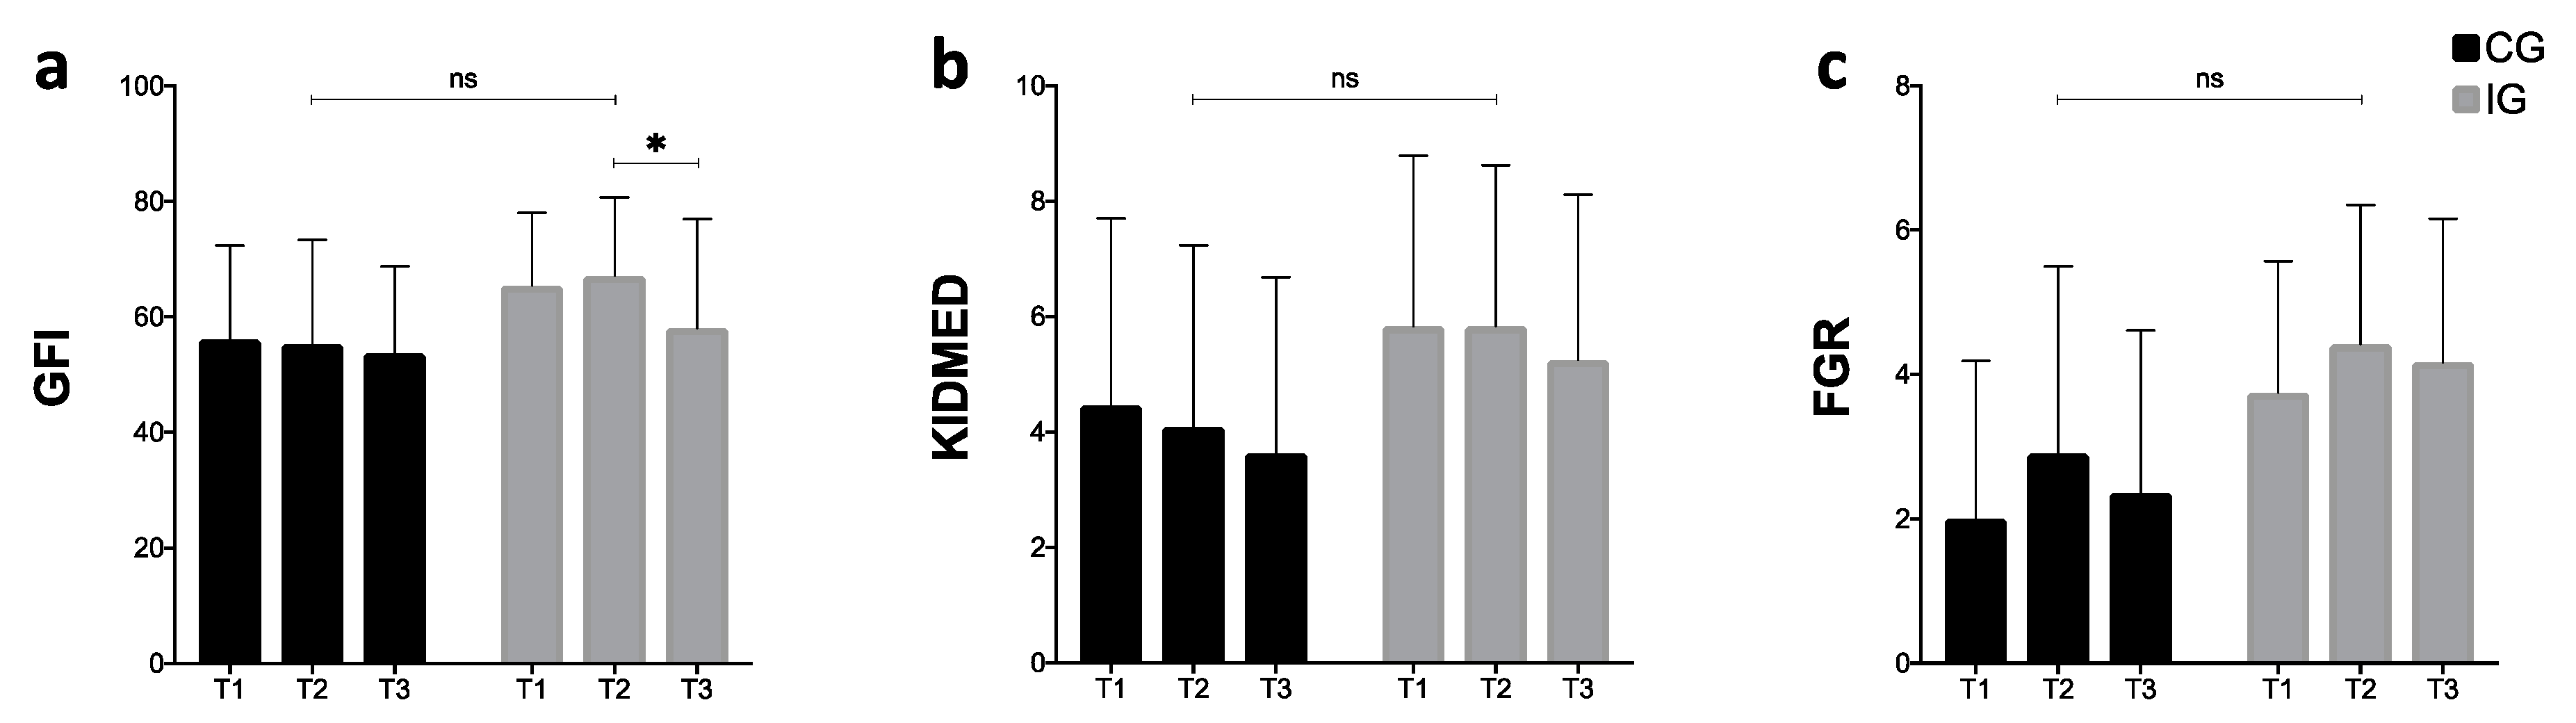
3.2. Nutritional Questionnaires
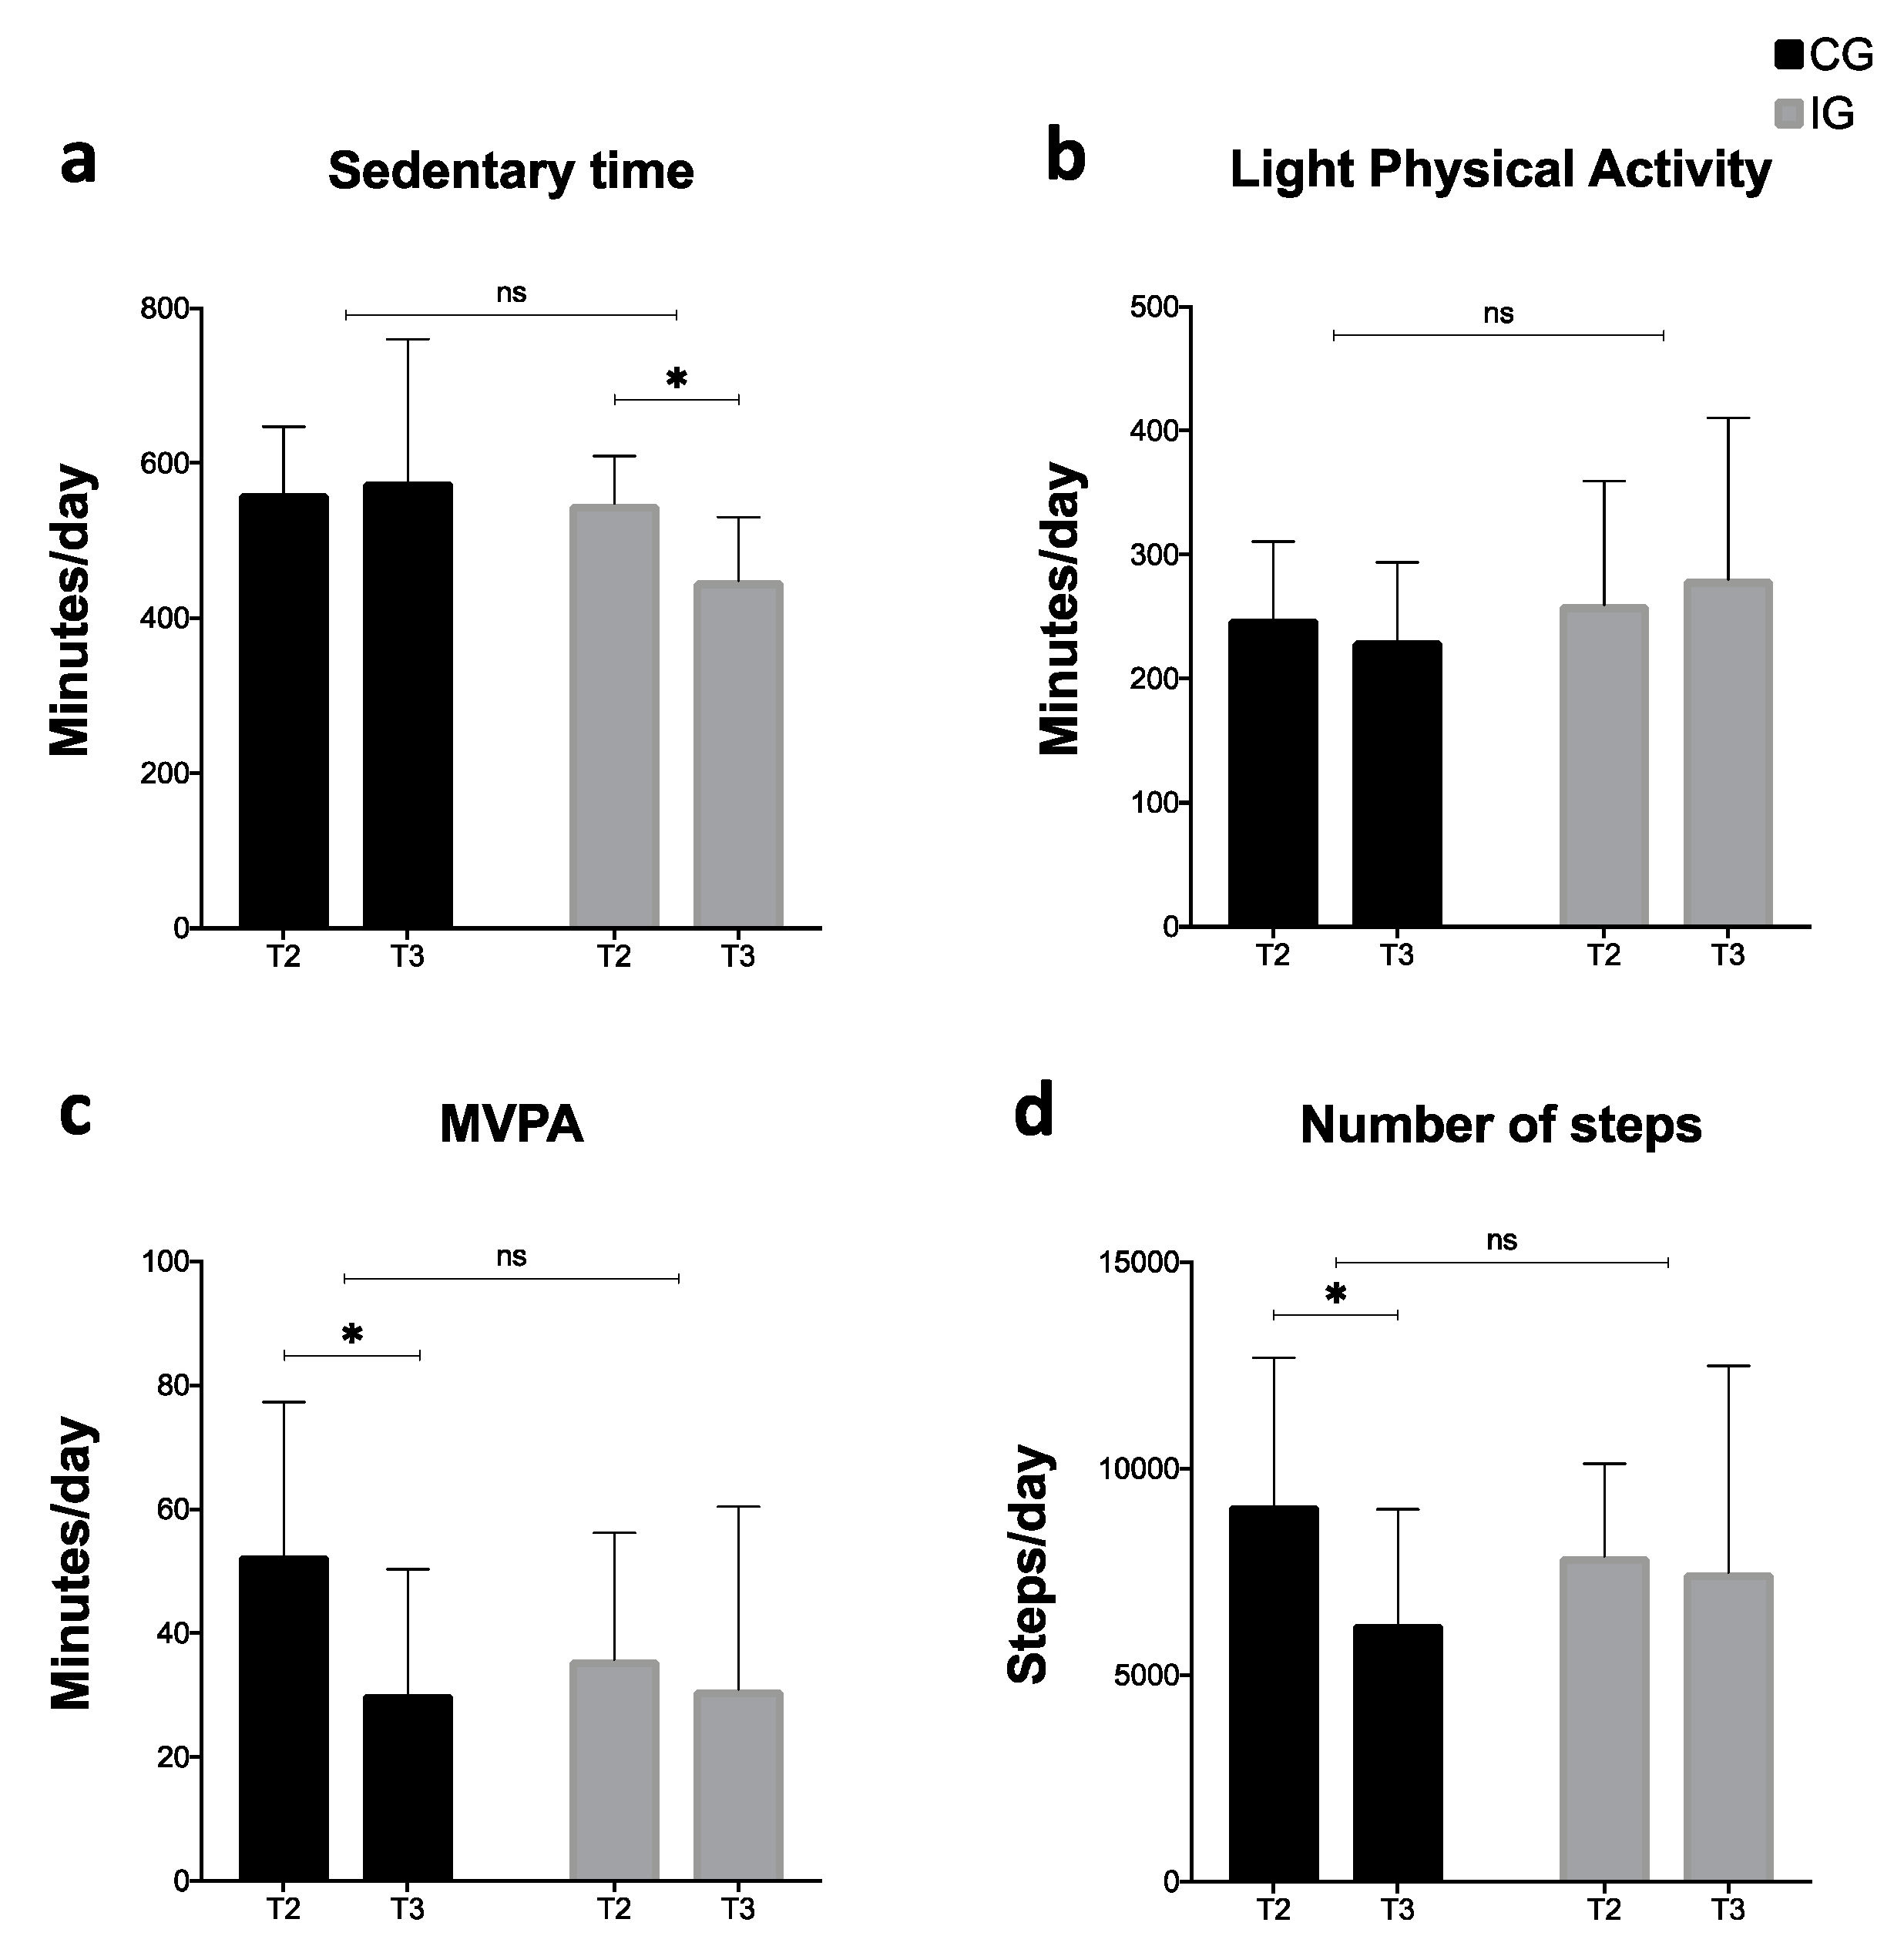
3.3. Accelerometry
4. Discussion
Strengths and Limitations
5. Conclusions
Supplementary Materials
Author Contributions
Funding
Acknowledgments
Conflicts of Interest
References
- World Health Organization Obesity and Overweight. Available online: https://www.who.int/news-room/fact-sheets/detail/obesity-and-overweight (accessed on 20 March 2020).
- Abarca-Gómez, L.; Abdeen, Z.A.; Hamid, Z.A.; Abu-Rmeileh, N.M.; Acosta-Cazares, B.; Acuin, C.; Adams, R.J.; Aekplakorn, W.; Afsana, K.; Aguilar-Salinas, C.A.; et al. Worldwide trends in body-mass index, underweight, overweight, and obesity from 1975 to 2016: A pooled analysis of 2416 population-based measurement studies in 128·9 million children, adolescents, and adults. Lancet 2017, 390, 2627–2642. [Google Scholar] [CrossRef] [Green Version]
- Hruby, A.; Manson, J.E.; Qi, L.; Malik, V.S.; Rimm, E.B.; Sun, Q.; Willett, W.C.; Hu, F.B. Determinants and Consequences of Obesity. Am. J. Public Health 2016, 106, 1656–1662. [Google Scholar] [CrossRef]
- Avila, C.; Holloway, A.C.; Hahn, M.K.; Morrison, K.M.; Restivo, M.; Anglin, R.; Taylor, V.H. An Overview of Links Between Obesity and Mental Health. Curr. Obes. Rep. 2015, 4, 303–310. [Google Scholar] [CrossRef]
- McCuen-Wurst, C.; Ruggieri, M.; Allison, K.C. Disordered eating and obesity: Associations between binge-eating disorder, night-eating syndrome, and weight-related comorbidities. Ann. N. Y. Acad. Sci. 2018, 1411, 96–105. [Google Scholar] [CrossRef]
- Collaborators, G.B.D. 2017 R.F. Global, regional, and national comparative risk assessment of 84 behavioural, environmental and occupational, and metabolic risks or clusters of risks for 195 countries and territories, 1990–2017: A systematic analysis for the Global Burden of Disease Stu. Lancet 2018, 392, 1923–1994. [Google Scholar]
- Verheggen, R.J.H.M.; Maessen, M.F.H.; Green, D.J.; Hermus, A.R.M.M.; Hopman, M.T.E.; Thijssen, D.H.T. A systematic review and meta-analysis on the effects of exercise training versus hypocaloric diet: Distinct effects on body weight and visceral adipose tissue. Obes. Rev. 2016, 17, 664–690. [Google Scholar] [CrossRef] [PubMed]
- Lara, M.; Amigo, H. ¿Qué tipo de intervención tiene mejores resultados en la disminución de peso en adultos con sobrepeso u obesidad? Revisión Sistemática y Metaanálisis. Arch. Latinoam. Nutr. 2011, 61, 45–54. [Google Scholar]
- Hull, H.R.; Hester, C.N.; Fields, D.A. The effect of the holiday season on body weight and composition in college students. Nutr. Metab. 2006, 3, 44. [Google Scholar] [CrossRef] [Green Version]
- Rodríguez-Rodríguez, F.; Cristi-Montero, C.; Villa-González, E.; Solís-Urra, P.; Chillón, P. Comparación de los niveles de actividad física durante la vida universitaria. Rev. Med. Chile 2018, 146, 442–450. [Google Scholar] [CrossRef] [Green Version]
- Fedewa, M.V.; Das, B.M.; Evans, E.M.; Dishman, R.K. Change in Weight and Adiposity in College Students: A Systematic Review and Meta-Analysis. Am. J. Prev. Med. 2014, 47, 641–652. [Google Scholar] [CrossRef]
- Aránguiz, A.H.; García, G.V.; Rojas, D.S.; Salas, B.C.; Martínez, R.R.; Mac Millan, K.N. Descriptive, comparative and correlational study of nutritional and cardio-respiratory condition of Chilean universitary students. Rev. Chil. Nutr. 2010, 37, 70–78. [Google Scholar]
- Yumuk, V.; Frühbeck, G.; Oppert, J.M.; Woodward, E.; Toplak, H. An EASO Position Statement on Multidisciplinary Obesity Management in Adults. Obes. Facts 2014, 7, 96–101. [Google Scholar] [CrossRef] [PubMed]
- Plotnikoff, R.C.; Costigan, S.A.; Williams, R.L.; Hutchesson, M.J.; Kennedy, S.G.; Robards, S.L.; Allen, J.; Collins, C.E.; Callister, R.; Germov, J. Effectiveness of interventions targeting physical activity, nutrition and healthy weight for university and college students: A systematic review and meta-analysis. Int. J. Behav. Nutr. Phys. Act. 2015, 12, 45. [Google Scholar] [CrossRef] [PubMed] [Green Version]
- Ernersson, Å.; Nystrom, F.H.; Lindström, T. Long-term increase of fat mass after a four week intervention with fast food based hyper-alimentation and limitation of physical activity. Nutr. Metab. 2010, 7, 68. [Google Scholar] [CrossRef] [PubMed] [Green Version]
- Cristi-Montero, C. National holidays ahoy! Basic rationale and considerations to prevent weight gain in schoolchildren. Rev. Med. Chile 2017, 145, 136–138. [Google Scholar] [CrossRef] [Green Version]
- Organization for Economic Cooperation an Development, Estudios de la OCDE Sobre Salud Pública: Chile. Hacia un Futuro Más Sano; Ministerio de Salud de Chile: Santiago, Chile, 2019.
- Ministry of Health Encuesta Nacional de Salud 2016–2017: Primeros Resultados; Ministry of Health of Chile: Santiago, Chile, 2017.
- Cristi-Montero, C. ¿Son efectivas las charlas para prevenir el aumento del peso en escolares? Rev. Int. Med. y Ciencias la Act. Fis. y del Deport. 2012. [Google Scholar]
- Moher, D.; Hopewell, S.; Schulz, K.F.; Montori, V.; Gøtzsche, P.C.; Devereaux, P.J.; Elbourne, D.; Egger, M.; Altman, D.G. CONSORT 2010 explanation and elaboration: Updated guidelines for reporting parallel group randomised trials. Int. J. Surg. 2012, 10, 28–55. [Google Scholar] [CrossRef] [PubMed] [Green Version]
- Ratner, R.; Hernández, P.; Martel, J.; Atalah, E. Propuesta de un nuevo índice de calidad global de la alimentación. Rev. Chil. Nutr. 2017, 44, 33–38. [Google Scholar] [CrossRef] [Green Version]
- Štefan, L.; Prosoli, R.; Juranko, D.; Čule, M.; Milinović, I.; Novak, D.; Sporiš, G. The Reliability of the Mediterranean Diet Quality Index (KIDMED) Questionnaire. Nutrients 2017, 9, 419. [Google Scholar] [CrossRef] [Green Version]
- Ministry of Health. Aprueba Norma General Técnica N° 148 sobre Guías Alimentarias para la Población. Resolución Exenta N° 260; Ministry of Health of Chile: Santiago, Chile, 2013.
- Freedson, P.S.; Melanson, E.; Sirard, J. Calibration of the Computer Science and Applications, Inc. accelerometer. Med. Sci. Sport. Exerc. 1998, 30, 777–781. [Google Scholar] [CrossRef]
- Migueles, J.H.; Cadenas-Sanchez, C.; Ekelund, U.; Delisle Nyström, C.; Mora-Gonzalez, J.; Löf, M.; Labayen, I.; Ruiz, J.R.; Ortega, F.B. Accelerometer Data Collection and Processing Criteria to Assess Physical Activity and Other Outcomes: A Systematic Review and Practical Considerations. Sport. Med. 2017, 47, 1821–1845. [Google Scholar] [CrossRef]
- Cohen, J. A power primer. Psychol. Bull. 1992, 112, 155–159. [Google Scholar] [CrossRef] [PubMed]
- Consejo Nacional de Educación Tendencias de Matrícula de Pregrado Educación Superior; MINEDUC: Santiago, Chile, 2019.
- Trofholz, A.; Tate, A.; Fulkerson, J.A.; Hearst, M.O.; Neumark-Sztainer, D.; Berge, J.M. Description of the home food environment in Black, White, Hmong, Latino, Native American and Somali homes with 5–7-year-old children. Public Health Nutr. 2019, 22, 882–893. [Google Scholar] [CrossRef]
- Durán Agüero, S.; Araneda, J.; Ahumada, D.; Silva Rojas, J.; Bonacich, R.B.; Caichac, A.; Salamanca, M.F.; Villarroel, P.; Fernandez, E.; Pacheco, V.; et al. A Multicenter Study Evaluating the Stages of Change in Food Consumption with Warning Labels among Chilean University Students. Biomed. Res. Int. 2020, 2020, 2317929. [Google Scholar] [CrossRef] [PubMed]
- Kelley, C.P.; Sbrocco, G.; Sbrocco, T. Behavioral Modification for the Management of Obesity. Prim. Care Clin. Off. Pract. 2016, 43, 159–175. [Google Scholar] [CrossRef] [PubMed] [Green Version]
- Jensen, M.D.; Ryan, D.H.; Donato, K.A.; Apovian, C.M.; Ard, J.D.; Comuzzie, A.G.; Hu, F.B.; Hubbard, V.S.; Jakicic, J.M.; Kushner, R.F.; et al. Executive summary: Guidelines (2013) for the management of overweight and obesity in adults. Obesity 2014, 22, S5–S39. [Google Scholar]
- Bhutani, S.; Wells, N.; Finlayson, G.; Schoeller, D.A. Change in eating pattern as a contributor to energy intake and weight gain during the winter holiday period in obese adults. Int. J. Obes. 2020, 4, 1586–1595. [Google Scholar] [CrossRef]
- Durá Travé, T.; Castroviejo Gandarias, A. Adherencia a la dieta mediterránea en la población universitaria. Nutr. Hosp. 2011, 26, 602–608. [Google Scholar]
- Rodriguez, F.; Palma, X.; Romo, A.; Escobar, D.; Aragu, B.; Espinoza, L.; McMillan, N.; Galvez, J. Eating habits, physical activity and socioeconomic level in university students of Chile. Nutr. Hosp. 2013, 28, 447–455. [Google Scholar]
- Crovetto, M.M.; Uauy, R. Changes in the consumption of dairy products, sugary drinks and processed juices in the Chilean population. Rev. Med. Chile 2014, 142, 1530–1539. [Google Scholar] [CrossRef] [Green Version]
- Kemmler, W.; von Stengel, S.; Kohl, M.; Bauer, J. Impact of exercise changes on body composition during the college years - a five year randomized controlled study. BMC Public Health 2016, 16, 50. [Google Scholar] [CrossRef] [Green Version]
- Bowden Davies, K.A.; Sprung, V.S.; Norman, J.A.; Thompson, A.; Mitchell, K.L.; Halford, J.C.G.; Harrold, J.A.; Wilding, J.P.H.; Kemp, G.J.; Cuthbertson, D.J. Short-term decreased physical activity with increased sedentary behaviour causes metabolic derangements and altered body composition: Effects in individuals with and without a first-degree relative with type 2 diabetes. Diabetologia 2018, 61, 1282–1294. [Google Scholar] [CrossRef] [PubMed] [Green Version]
- Al-Zamil, H.; Alhakbany, M.; Alfadda, N.; Almusallam, S.; Al-Hazzaa, H. A Profile of Physical Activity, Sedentary Behaviors, Sleep, and Dietary Habits of Saudi College Female Students. J. Fam. Community Med. 2019, 26, 1. [Google Scholar]
- Brazendale, K.; Beets, M.W.; Weaver, R.G.; Pate, R.R.; Turner-McGrievy, G.M.; Kaczynski, A.T.; Chandler, J.L.; Bohnert, A.; von Hippel, P.T. Understanding differences between summer vs. school obesogenic behaviors of children: The structured days hypothesis. Int. J. Behav. Nutr. Phys. Act. 2017, 14, 100. [Google Scholar] [CrossRef] [PubMed]
- Vega-Robledo, G.B.; Rico-Rosillo, M.G. Adipose tissue: Immune function and alterations caused by obesity. Rev. Alerg. Mex. 2019, 66, 340–353. [Google Scholar] [PubMed] [Green Version]
- León-Pedroza, J.I.; González-Tapia, L.A.; del Olmo-Gil, E.; Castellanos-Rodríguez, D.; Escobedo, G.; González-Chávez, A. Inflamación sistémica de grado bajo y su relación con el desarrollo de enfermedades metabólicas: De la evidencia molecular a la aplicación clínica. Cir. Cir. 2015, 83, 543–551. [Google Scholar] [CrossRef] [Green Version]
- Anderson, D.A.; Shapiro, J.R.; Lundgren, J.D. The freshman year of college as a critical period for weight gain: An initial evaluation. Eat. Behav. 2003, 4, 363–367. [Google Scholar] [CrossRef]


| Variables | All (n = 23) | CG (n = 11) | IG (n = 12) | p-Value |
|---|---|---|---|---|
| Age (years) | 20.91 ± 2.52 | 20.00 ± 1.41 | 21.75 ± 3.05 | 0.097 |
| Weight (kg) | 84.88 ± 14.88 | 85.04 ± 12.95 | 84.74 ± 17.03 | 0.963 |
| Height (cm) | 167.18 ± 10.18 | 165.15 ± 7.50 | 169.04 ± 12.18 | 0.372 |
| BMI (kg/m2) | 30.31 ± 4.26 | 31.14 ± 4.11 | 29.55 ± 4.42 | 0.383 |
| Fat mass (kg) | 31.20 ± 9.99 | 32.10 ± 9.78 | 30.37 ± 10.55 | 0.687 |
| Global Food Index | 60.98 ± 14.88 | 56.14 ± 16.23 | 65.42 ± 12.60 | 0.139 |
| KIDMED | 5.17 ± 3.10 | 4.46 ± 3.24 | 5.83 ± 2.95 | 0.297 |
| FGR | 2.91 ± 2.15 | 2.00 ± 2.19 | 3.75 ± 1.82 | 0.049 * |
| Accelerometry | All (n = 17) | CG (n = 10) | IG (n = 7) | |
| Sedentary time (min/day) | 555.48 ± 75.32 | 560.83 ± 86.39 | 547.84 ± 61.79 | 0.739 |
| LIPA (min/day) | 253.15 ± 77.05 | 248.50 ± 62.28 | 259.80 ± 99.63 | 0.777 |
| MVPA (min/day) | 45.62 ± 23.97 | 52.52 ± 24.78 | 35.76 ± 20.46 | 0.162 |
| Steps (steps/day) | 8606 ± 3073 | 9118 ± 3568 | 7875 ± 2241 | 0.429 |
| Recommendations | CG | IG | p-Value | ||
|---|---|---|---|---|---|
| No | Yes | No | Yes | ||
| Decrease food intake. | 4 | 7 | 4 | 8 | 1.000 † |
| Decrease sugary drinks and liquor. | 7 | 4 | 8 | 4 | 1.000 † |
| Increase the level of physical activity. | 10 | 1 | 3 | 9 | 0.003 †,* |
| Do not add mayonnaise, ketchup, mustard, etc. | 3 | 8 | 8 | 4 | 0.059 ‡ |
| Eat one typical food per day. | 4 | 7 | 2 | 10 | 0.371 † |
| Increase salad intake. | 2 | 9 | 7 | 5 | 0.089 † |
© 2020 by the authors. Licensee MDPI, Basel, Switzerland. This article is an open access article distributed under the terms and conditions of the Creative Commons Attribution (CC BY) license (http://creativecommons.org/licenses/by/4.0/).
Share and Cite
Hernández-Jaña, S.; Huber-Pérez, T.; Palma-Leal, X.; Guerrero-Ibacache, P.; Campos-Nuñez, V.; Zavala-Crichton, J.P.; Jorquera-Aguilera, C.; Sadarangani, K.P.; Rodríguez-Rodríguez, F.; Cristi-Montero, C. Effect of a Single Nutritional Intervention Previous to a Critical Period of Fat Gain in University Students with Overweight and Obesity: A Randomized Controlled Trial. Int. J. Environ. Res. Public Health 2020, 17, 5149. https://0-doi-org.brum.beds.ac.uk/10.3390/ijerph17145149
Hernández-Jaña S, Huber-Pérez T, Palma-Leal X, Guerrero-Ibacache P, Campos-Nuñez V, Zavala-Crichton JP, Jorquera-Aguilera C, Sadarangani KP, Rodríguez-Rodríguez F, Cristi-Montero C. Effect of a Single Nutritional Intervention Previous to a Critical Period of Fat Gain in University Students with Overweight and Obesity: A Randomized Controlled Trial. International Journal of Environmental Research and Public Health. 2020; 17(14):5149. https://0-doi-org.brum.beds.ac.uk/10.3390/ijerph17145149
Chicago/Turabian StyleHernández-Jaña, Sam, Tamara Huber-Pérez, Ximena Palma-Leal, Paola Guerrero-Ibacache, Valentina Campos-Nuñez, Juan Pablo Zavala-Crichton, Carlos Jorquera-Aguilera, Kabir P. Sadarangani, Fernando Rodríguez-Rodríguez, and Carlos Cristi-Montero. 2020. "Effect of a Single Nutritional Intervention Previous to a Critical Period of Fat Gain in University Students with Overweight and Obesity: A Randomized Controlled Trial" International Journal of Environmental Research and Public Health 17, no. 14: 5149. https://0-doi-org.brum.beds.ac.uk/10.3390/ijerph17145149