Enhanced Biodegradation of Phthalic Acid Esters’ Derivatives by Plasticizer-Degrading Bacteria (Burkholderia cepacia, Archaeoglobus fulgidus, Pseudomonas aeruginosa) Using a Correction 3D-QSAR Model


Abstract
:1. Introduction
2. Materials and Methods
2.1. Data Source
2.2. Construction of the Comparative Molecular Similarity Index Analysis (CoMSIA) Model of the Comprehensive Biodegradability of PAEs
2.3. Evaluation of Functionality and Environmental Friendliness of DEP Derivatives Based on Density Functional Theory (DFT)
3. Results and Discussion
3.1. Construction and Evaluation of the CoMSIA Model for the Comprehensive Biodegradability of the PAEs by Plasticizer-Degrading Bacteria
3.1.1. Calculation of the Comprehensive Biodegradation Values of the PAEs by Three Plasticizer-Degrading Bacteria of PAE Molecules
3.1.2. Construction of the CoMSIA Model for the Comprehensive Biodegradability of the PAE Molecules by Three Plasticizer-Degrading Bacteria
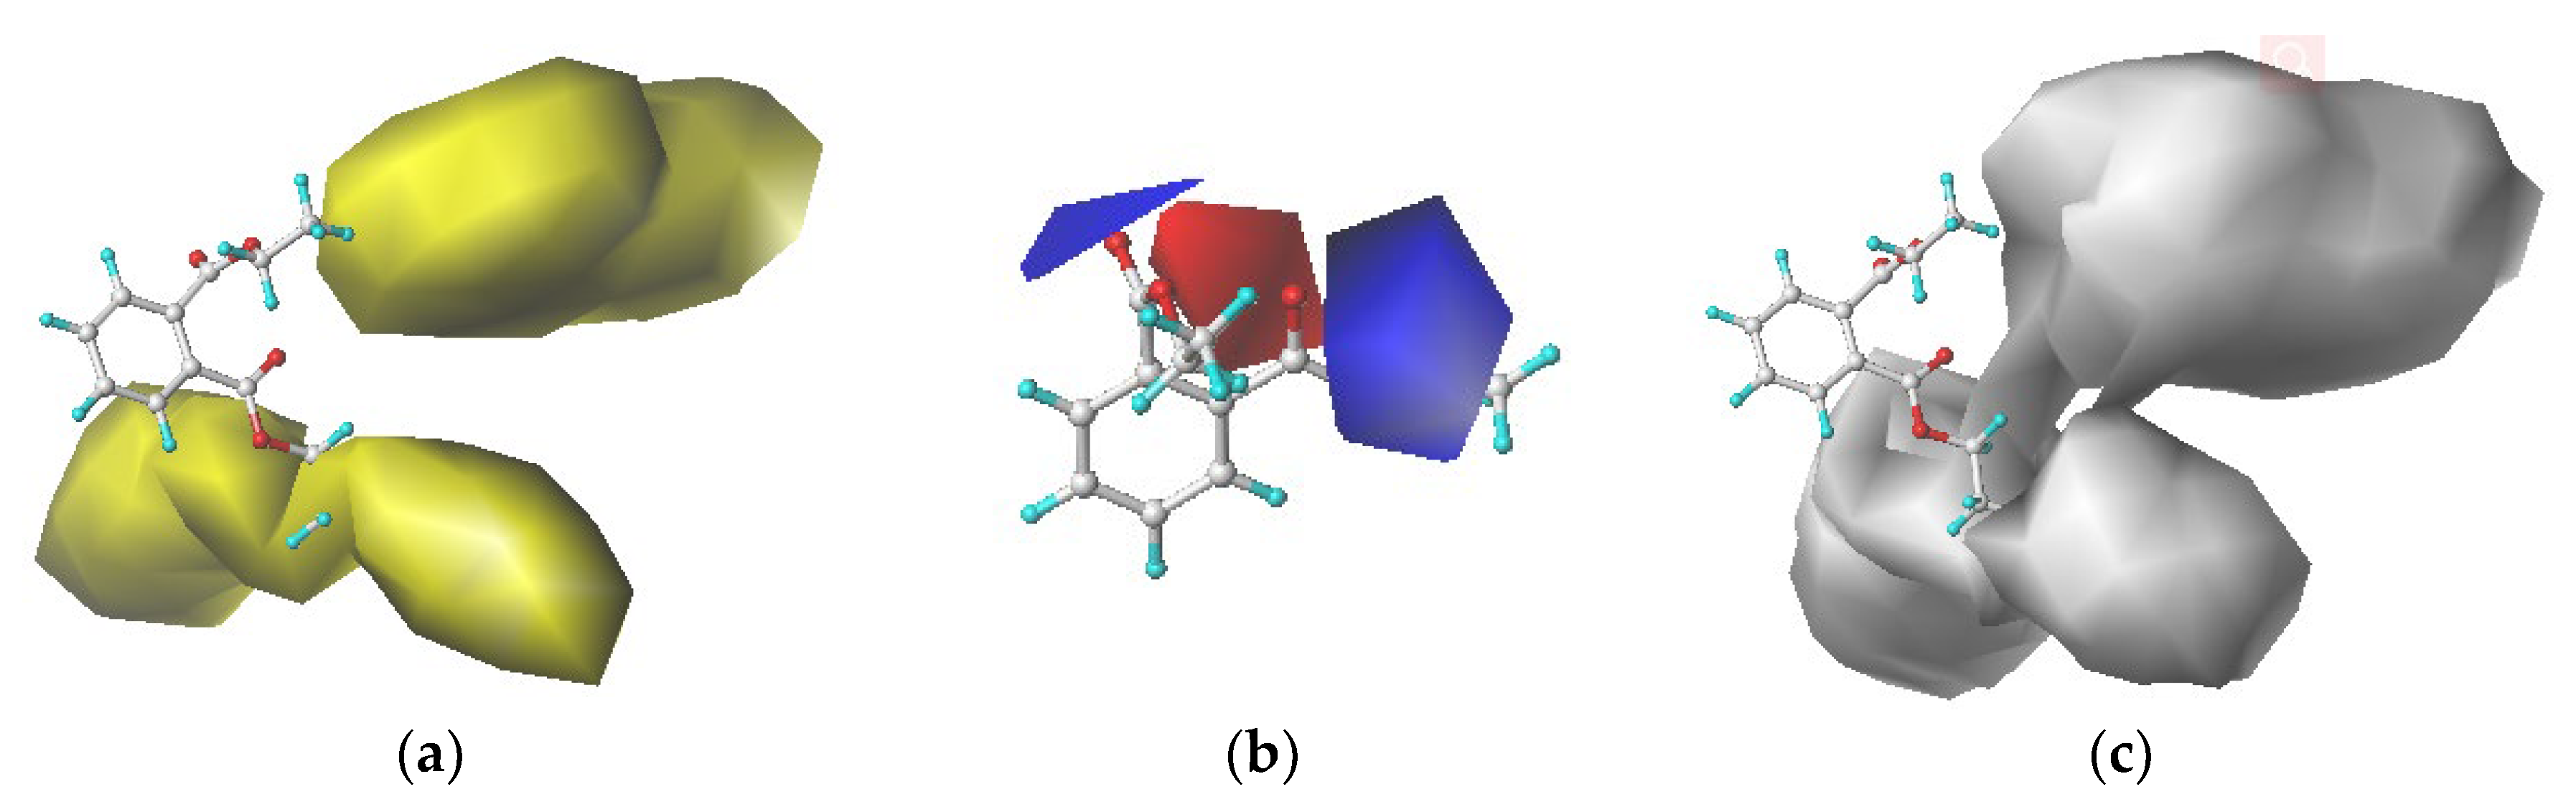
3.1.3. Contour Map Analysis of the CoMSIA Model
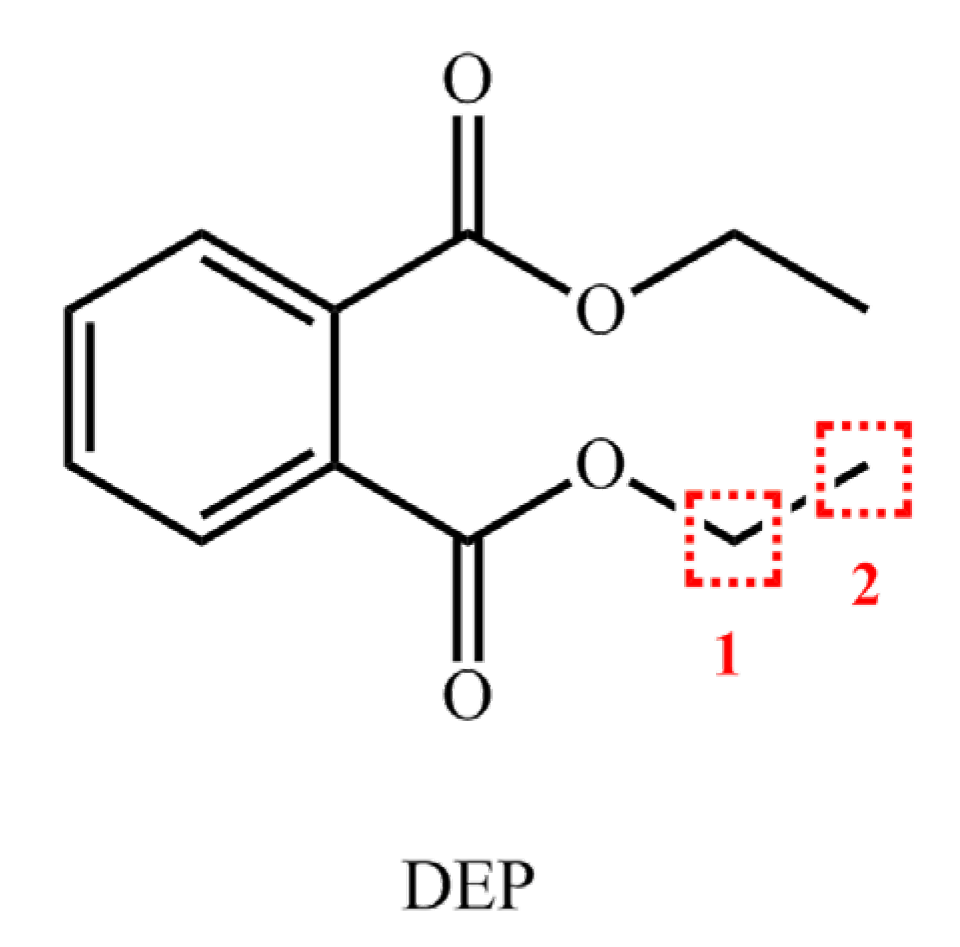
3.2. Molecular Modification of DEP for Enhanced Biodegradability Based on the CoMSIA Model
3.2.1. Molecular Modification and Prediction of Comprehensive Biodegradability of DEP
3.2.2. Verification of the CoMSIA Model for the Comprehensive Biodegradability of PAEs Molecules
3.2.3. Evaluation of the Functionality and Environmental Friendliness of DEP Derivatives
3.3. Analysis of the Microbial Degradation Mechanism of DEP and Its Derivatives Based on a Microbial Degradation Path Simulation
3.3.1. Simulation of Microbial Degradation of DEP and Its Derivative Molecules
3.3.2. Calculation of the Reaction Energy Barrier for Microbial Degradation Transformation Paths of DEP and Its Derivatives
3.3.3. Simulation and Verification of the Molecular Dynamics of the Microbial Degradation of DEP and Its Derivatives
4. Conclusions
Author Contributions
Funding
Conflicts of Interest
References
- Staples, C.A.; Peterson, D.R.; Parkerton, T.F.; Adams, W.J. The environmental fate of phthalate esters: A literature review. Chemosphere 1997, 35, 667–749. [Google Scholar] [CrossRef]
- Net, S.; Sempéré, R.; De lmont, A.; Paluselli, A.; Ouddane, B. Occurrence, fate, behavior and ecotoxicological state of phthalates in different environmental matrice. Environ. Sci. Technol. 2015, 49, 4019–4035. [Google Scholar] [CrossRef]
- Sayyad, G.; Price, G.W.; Sharifi, M.; Khosravi, K. Fate and transport modeling of phthalate esters from biosolid amended soil under corn cultivation. J. Hazard. Mater. 2017, 323, 264–273. [Google Scholar] [CrossRef]
- Wang, J.; Luo, Y.; Teng, Y.; Ma, W.; Christie, P.; Li, Z. Soil contamination by phthalate esters in Chinese intensive vegetable production systems with different modes of use of plastic film. Environ. Pollut. 2013, 180, 265–273. [Google Scholar] [CrossRef]
- Wei, L.Y.; Li, Z.H.; Sun, J.T.; Zhu, L.Z. Pollution characteristics and health risk assessment of phthalate esters in agricultural soil and vegetables in the Yangtze River Delta of China. Sci. Total Environ. 2020, 726, 1–8. [Google Scholar] [CrossRef]
- Hashizume, K.; Nanya, J.; Toda, C.; Yasui, T.; Nagano, H.; Kojima, N. Phthalate esters detected in various water samples and biodegradation of the phthalates by microbes isolated from river water. Biol. Pharm. Bull. 2002, 25, 209–214. [Google Scholar] [CrossRef] [PubMed] [Green Version]
- Yang, G.C.; Yen, C.H.; Wang, C.L. Monitoring and removal of residual phthalate esters and pharmaceuticals in the drinking water of Kaohsiung City, Taiwan. J. Hazard. Mater. 2014, 277, 53–61. [Google Scholar] [CrossRef]
- Petersen, J.H.; Breindahl, T. Plasticizers in total diet samples, baby food and infant formulae. Food Addit. Contam. 2000, 17, 133–141. [Google Scholar] [CrossRef] [PubMed]
- Gibson, R.W.; Wang, M.J.; Padgett, E.; Lopez-Real, J.M.; Back, A.J. Impact of drying and composting procedures on the concentrations of 4-nonylphenols, di-(2-ethylhexyl)phthalate and polychlorinated biphenyls in anaerobically digested sewage sludge. Chemosphere 2007, 68, 1352–1358. [Google Scholar] [CrossRef] [PubMed]
- Huang, M.; Li, Y.; Gu, G. The effects of hydraulic retention time and sludge retention time on the fate of di-(2-ethylhexyl) phthalate in a laboratory-scale anaerobic-anoxic-aerobic activated sludge system. Bioresour. Technol. 2008, 99, 8107–8111. [Google Scholar] [CrossRef]
- Xu, G.; Li, F.; Wang, Q. Occurrence and degradation characteristics of dibutyl phthalate (DBP) and di-(2-ethylhexyl) phthalate (DEHP) in typical agricultural soils of China. Sci. Total Environ. 2008, 393, 333–340. [Google Scholar] [CrossRef] [PubMed]
- Peterson, J.C.; Freeman, D.H. Phthalate ester concentration variations in dated sediment cores from Chesapeake Bay. Environ. Sci. Technol. 1982, 16, 464–469. [Google Scholar] [CrossRef]
- Buszka, P.M.; Yeskis, D.J.; Kolpin, D.W.; Furlong, E.T.; Zaugg, S.D.; Meyer, M.T. Waste-Indicator and Pharmaceutical Compounds in Landfill-Leachate-Affected Ground Water near Elkhart, Indiana, 2000–2002. Bull. Environ. Contam. Toxicol. 2009, 82, 653–659. [Google Scholar] [CrossRef] [PubMed]
- Lin, X.T.; Wang, X.Y.; Ren, R. Environmental endocrine disruptors—A study of phthalate esters. Environ. Pollut. Control 2003, 25, 286–288. [Google Scholar] [CrossRef]
- Piersma, A.H.; Verhoefa, A.; Biesebeeka, J.; Pietersa, M.N.; Sloba, W. Developmental toxicity of butyl benzyl phthalate in the rat using a multiple dose study design. Reprod. Toxicol. 2000, 14, 417–425. [Google Scholar] [CrossRef]
- Li, J.X.; Gu, J.D.; Yao, J.H. Degradation of dimethyl terephthalate by Pasteurella multocida Sa and Sphingomonas paucimobills Sy isolated from mangrove sediment. Int. Biodeterior. Biodegrad. 2005, 56, 158–165. [Google Scholar] [CrossRef]
- Fang, C.R.; Yao, J.; Zheng, Y.G.; Jiang, C.J.; Hu, L.F.; Wu, Y.Y.; Shen, D.S. Dibutyl phthalate degradation by Enterobacter. sp. T5 isolated from municipal solid waste in landfill bioreactor. Int. Biodeterior. Biodegrad. 2010, 64, 442–446. [Google Scholar] [CrossRef]
- Hoellein, T.; Rojas, M.; Pink, A.; Gasior, J.; Kelly, J. Anthropogenic litter in urban freshwater ecosystems: Distribution and microbial interactions. PLoS ONE 2014, 9, 98485. [Google Scholar] [CrossRef]
- Jonsson, S.; Ejlertssin, J.; Bo, H.S. Behaviour of mono- and diesters of o–phthalic acid in leachates released during digestion of municipal solid waste under landfill conditions. Adv. Environ. Res. 2003, 7, 429–440. [Google Scholar] [CrossRef]
- Sugatt, R.H.; O’Grady, D.P.; Banerjee, S. Toxicity of organic mixtures saturated in waster to Daphnia magna. Effect of compositional changes. Chemosphere 1984, 13, 11–18. [Google Scholar] [CrossRef]
- Wu, X.L.; Wang, Y.Y.; Liang, R.X.; Dai, Q.Y.; Jin, D.C.; Chao, W.L. Biodegradation of an endocrine-disrupting chemical di-n-butyl phthalate by newly isolated Agrobacterium sp. and the biochemical pathway. Process Biochem. 2011, 46, 1090–1094. [Google Scholar] [CrossRef]
- Fang, Y. Biodegradation Characteristics of Phthalates Degrading Strain Acinetobacter sp.LMB-5 and Properties Analysis of the Esterase. Ph.D. Thesis, East China University of Science and Technology, Shanghai, China, 2017. [Google Scholar]
- Lu, Y.; Tang, F.; Wang, Y.; Zhao, J.; Zeng, X.; Luo, Q.; Wang, L. Biodegradation of dimethyl phthalate, diethyl phthalate and di-n-butyl phthalate by Rhodococcus sp. L4 isolated from activated sludge. J. Hazard. Mater. 2009, 168, 939–943. [Google Scholar] [CrossRef] [PubMed]
- Zhu, Y.; Tian, D.; Yan, F. Effectiveness of Entropy Weight Method in Decision-Making. Math. Probl. Eng. 2020, 2020, 1–5. [Google Scholar] [CrossRef]
- Kumar, V.; Sharma, N.; Maitra, S.S. Comparative study on the degradation of dibutyl phthalate by two newly isolated Pseudomonas sp.V21b and Comamonas sp.51F. Biotechnol. Rep. 2017, 15, 1–10. [Google Scholar] [CrossRef] [PubMed]
- Chu, Z.H.; Li, Y. Designing modified polybrominated diphenyl ether BDE-47, BDE-99, BDE-100, BDE-183, and BDE-209 molecules with decreased estrogenic activities using 3D-QSAR, pharmacophore models coupled with resolution V of the 2(10-3) fractional factorial design and molecular docking. J. Hazard. Mater. 2018, 364, 151–162. [Google Scholar] [CrossRef]
- Zhao, X.H.; Zhao, Y.Y.; Ren, Z.X.; Li, Y. Combined QSAR/QSPR and molecular docking study on fluoroquinolones to reduce biological enrichment. Comput. Biol. Chem. 2019, 79, 177–184. [Google Scholar] [CrossRef]
- Hong, H.K.; Liao, H.P.; Li, T.; Yang, J.; Xie, D.T. Analysis of spatio-temporal patterns of rural space function based on entropy value method and Dagum Gini coefficient. Trans. Chin. Soc. Agric. Eng. 2016, 32, 240–248. [Google Scholar] [CrossRef]
- Liang, X.B.; Liang, W.; Zhang, L.B.; Guo, X.Y. Risk assessment for long-distance gas pipelines in coal mine gobs based on structure entropy weight method and multi-step backward cloud transformation algorithm based on sampling with replacement. J. Clean. Prod. 2019, 227, 218–228. [Google Scholar] [CrossRef]
- Qu, R.J.; Liu, H.X.; Feng, M.B.; Yang, X.; Wang, Z.Y. Investigation on intramolecular hydrogen bond and some thermodynamic properties of polyhydroxylated anthraquinones. J. Chem. Eng. Data 2012, 57, 2442–2455. [Google Scholar] [CrossRef]
- Zeng, X.L.; Qu, R.J.; Feng, M.B.; Chen, J.; Wang, L.S.; Wang, Z.Y. Photodegradation of Polyfluorinated Dibenzo-p-Dioxins (PFDDs) in Organic Solvents: Experimental and Theoretical Studies. Environ. Sci. Technol. 2016, 50, 8128–8134. [Google Scholar] [CrossRef]
- Chen, Y.; Cai, X.Y.; Jiang, L. Prediction of octanol-air partition coefficients for Polychlorinated biphenyls (PCBs) using 3D-QSAR models. Ecotoxicol. Environ. Saf. 2016, 124, 202–212. [Google Scholar] [CrossRef] [PubMed]
- Ren, Z.X.; Wang, Y.W.; Xu, H.H.; Li, Y.F.; Han, S. Fuzzy Comprehensive Evaluation Assistant 3D-QSAR of Environmentally Friendly FQs to Reduce ADRs. Int. J. Environ. Res. Public Health 2019, 16, 3161. [Google Scholar] [CrossRef] [PubMed] [Green Version]
- Zhao, X.H.; Wang, X.L.; Li, Y. Combined HQSAR method and molecular docking study on genotoxicity mechanism of quinolones with higher genotoxicity. Environ. Sci. Pollut. Res. 2019, 26, 34830–34853. [Google Scholar] [CrossRef] [PubMed]
- Zhang, W.H.; Sun, R.H.; Hou, Y.L.; Qiu, Y.L.; Li, Y. Investigation of the potential environmental risks of phthalate derivatives designed to be environmentally friendly. Environ. Toxicol. Chem. 2020, 39, 1138–1148. [Google Scholar] [CrossRef] [PubMed]
- Qiu, Y.L.; Jiang, L.; Zhang, S.J.; Li, Y. Molecular design of lower-estrogen-activity phthalate esters with high fluorescence intensity using pharmacophore model. Int. J. Environ. Anal. Chem. 2019, 1–16. [Google Scholar] [CrossRef]
- Liao, S.Y.; Qian, L.; Miao, T.F.; Lu, H.L.; Zheng, K.C. CoMFA and docking studies of 2-phenylindole derivatives with anticancer activity. Eur. J. Med. Chem. 2009, 44, 2822–2827. [Google Scholar] [CrossRef] [PubMed]
- Li, M.; Wei, D.; Zhao, H.; Du, Y. Genotoxicity of quinolones: Substituents contribution and transformation products QSAR evaluation using 2D and 3D models. Chemosphere 2013, 95, 220–226. [Google Scholar] [CrossRef]
- Li, X.; Ye, L.; Shi, W.; Liu, H.; Liu, C.; Qian, X. In silico study on hydroxylated polychlorinated biphenyls as androgen receptor antagonists. Ecotoxicol. Environ. Saf. 2013, 92, 258–264. [Google Scholar] [CrossRef]
- Salahinejad, M.; Ghasemi, J.B. 3D-QSAR studies on the toxicity of substituted benzenes to Tetrahymena pyriformis: CoMFA, CoMSIA and VolSurf approaches. Ecotoxicol. Environ. Saf. 2014, 105, 128–134. [Google Scholar] [CrossRef]
- Pick, A.; Müller, H.; Mayer, R.; Haenisch, B.; Pajeva, I.K.; Weigt, M.; Bönisch, H.; Müller, C.E.; Wiese, M. Structure—Activity relationships of flavonoids as inhibitors of breast cancer resistance protein (BCRP). Bioorg. Med. Chem. 2011, 19, 2090–2102. [Google Scholar] [CrossRef]
- Qiu, Y.L.; Jiang, L.; Li, Y. Theoretical support for the enhancement of infrared spectrum signals by derivatization of phthalic acid esters using a pharmacophore model. Spectrosc. Lett. 2018, 51, 155–162. [Google Scholar] [CrossRef]
- Brzozowski, A.M.; Pike, A.C.; Dauter, Z.; Hubbard, R.E.; Bonn, T.; Engström, O.; Ohman, L.; Greene, G.L.; Gustafsson, J.A.; Carlquist, M. Molecular basis of agonism and antagonism in the oestrogen receptor. Nature 1997, 389, 753–758. [Google Scholar] [CrossRef] [PubMed]
- Davies, R.P.; Dobbs, A.J. The prediction of bioconcentration in fish. Water Res. 1984, 18, 1253–1262. [Google Scholar] [CrossRef]
- Chen, Y.S.; Luo, Y.M.; Zhang, H.B.; Song, J. Preliminary study on PAEs pollution of greenhouse soils. Acta Pedol. Sin. 2011, 48, 516–523. [Google Scholar]
- Hara, H.; Masai, E.; Katayama, Y.; Fukuda, M. The 4-Oxalomesaconate Hydratase Gene, involved in the Protocatechuate 4,5-Cleavage Pathway, Is Essential to Vanillate and Syringate Degradation in Sphingomonas paucimobilisSYK-6. J. Bacteriol. 2001, 182, 6950–6957. [Google Scholar] [CrossRef] [PubMed] [Green Version]
- Keyser, P.; Pujar, B.G.; Eaton, R.W. Biodegradation of the phthalates and their esters by bacteria. Environ. Health Persp. 1976, 18, 159–166. [Google Scholar] [CrossRef]
- Ren, L.; Lin, Z.; Liu, H.M.; Hu, H.Q. Bacteria-mediated phthalic acid esters degradation and related molecular mechanisms. Appl. Microbiol. Biot. 2018, 102, 1085–1096. [Google Scholar] [CrossRef]
- Li, J.; Gu, J.D. Biodegradation of dimethyl terephthalate by Pasteurella multocida Sa follows an alternative biochemical pathway. Ecotoxicology 2006, 15, 391–397. [Google Scholar] [CrossRef]
- Chang, H.K.; Zylstra, G.J. Novel Organization of the Genes for Phthalate Degradation from Burkholderia cepacia DBO1. J. Bacteriol. 1998, 180, 6529–6537. [Google Scholar] [CrossRef] [Green Version]
- Stingley, R.L. Novel organization of genes in a phthalate degradation operon of Mycobacterium vanbaalenii PYR-1. Microbiology 2004, 150, 3749–3761. [Google Scholar] [CrossRef] [Green Version]
- Drossman, H.; Johnson, H.; Mill, T. Structure activity relationships for environmental processes 1: Hydrolysis of esters and carbamates. Chemosphere 1988, 17, 1509–1530. [Google Scholar] [CrossRef]
- Westermaier, Y.; Ruiz-Carmona, S.; Theret, I.; Perron-Sierra, F.; Poissonnet, G.; Dacquet, C.; Albert- Boutin, J.; Ducrot, P.; Barril, X. Binding mode prediction and MD/MMPBSA-based free energy ranking for agonists of REV-ERBα/NCoR. J. Comput. Aid. Mol. Des. 2017, 31, 755–775. [Google Scholar] [CrossRef] [PubMed]
- Hou, Y.L.; Zhao, Y.Y.; Li, Q.; Li, Y. Highly biodegradable fluoroquinolone derivatives designed using the 3D-QSAR model and biodegradation pathways analysis. Ecotoxicol. Environ. Saf. 2020, 191. [Google Scholar] [CrossRef] [PubMed]
- Takamatsu, Y.; Sugiyama, A.; Purqon, A.; Nagao, H.; Nishikawa, K. Binding Free Energy Calculation and Structural Analysis for Antigen-Antibody Complex. Am. Inst. Phys. 2006, 832, 566–569. [Google Scholar] [CrossRef]


| Compounds | Docking Score Value of 2PIA | Converted Values of 2PIA | Docking Score Value of 2ZYI | Converted Values of 2ZYI | Docking Score Value of 3CN7 | Converted Values of 3CN7 | Comprehensive Biodegradation Values |
|---|---|---|---|---|---|---|---|
| BBP a | 7.070 | 0.509 | 1.908 | 0.100 | 5.116 | 0.380 | 0.323 |
| DAP a | 5.918 | 0.385 | 5.461 | 0.357 | 5.275 | 0.409 | 0.380 |
| DBP b | 5.754 | 0.367 | 5.551 | 0.364 | 6.047 | 0.547 | 0.408 |
| DEP a | 5.574 | 0.347 | 4.711 | 0.303 | 3.548 | 0.100 | 0.272 |
| DHP a | 7.455 | 0.551 | 7.221 | 0.485 | 6.964 | 0.711 | 0.564 |
| DIBP a | 4.824 | 0.266 | 5.081 | 0.330 | 5.006 | 0.361 | 0.313 |
| DIHP a | 8.634 | 0.679 | 10.570 | 0.727 | 7.870 | 0.872 | 0.743 |
| DIHXP | 7.462 | 0.552 | 10.548 | 0.726 | 6.660 | 0.656 | 0.643 |
| DIPP a | 6.313 | 0.427 | 5.916 | 0.390 | 6.061 | 0.549 | 0.442 |
| DIPRP a | 5.339 | 0.322 | 4.609 | 0.296 | 5.885 | 0.518 | 0.358 |
| DMEP b | 7.085 | 0.511 | 4.088 | 0.258 | 6.876 | 0.695 | 0.459 |
| DMP a | 3.293 | 0.100 | 4.624 | 0.297 | 3.940 | 0.170 | 0.191 |
| DNOP a | 10.420 | 0.873 | 4.797 | 0.309 | 8.333 | 0.955 | 0.679 |
| DPP a | 5.484 | 0.338 | 4.970 | 0.322 | 6.313 | 0.594 | 0.393 |
| DPRP b | 6.273 | 0.423 | 6.681 | 0.446 | 4.746 | 0.314 | 0.406 |
| DTDP a | 9.112 | 0.731 | 13.722 | 0.956 | 8.584 | 1.000 | 0.880 |
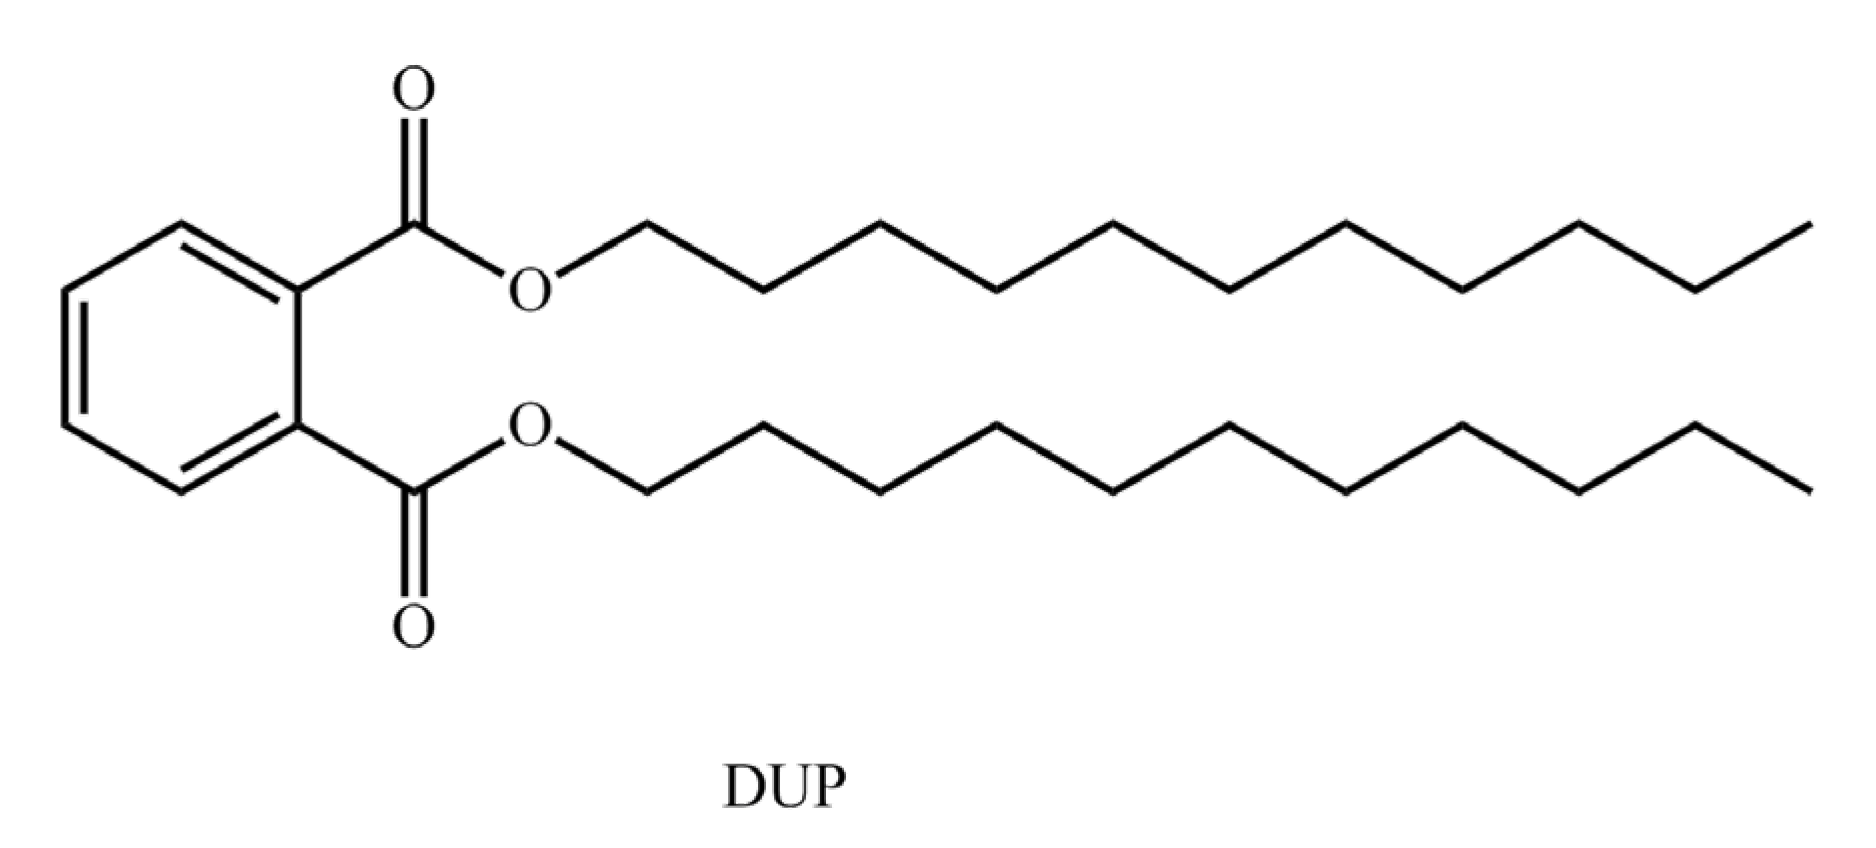
| DUP * | 11.595 | 1.000 | 14.334 | 1.000 | 8.561 | 0.996 | 0.999 |
| Ej | 1.799 | 1.792 | 1.497 | − | |||
| Hj | 0.799 | 0.792 | 0.497 | − | |||
| Wj | 38.28% | 37.93% | 23.79% | − | |||
| Model | q2 | n | SEE | R2 | F | r2pred | Q2 | cSDEP | dq2/dr2yy | S | E | H | D | A |
|---|---|---|---|---|---|---|---|---|---|---|---|---|---|---|
| CoMSIA | 0.731 | 8 | 0.013 | 0.999 | 578.738 | 0.761 | 0.385 | 0.251 | 1.488 | 34.7% | 11.1% | 46.8% | 7.4% | 0.0% |
| No. | Substituent Group | Comprehensive Biodegradation Values | Change Rate (%) | Docking Score Value of 2PIA | Change Rate (%) | Docking Score Value of 2ZYI | Change Rate (%) | Docking Score Value of 3CN7 | Change Rate (%) | Ratio |
|---|---|---|---|---|---|---|---|---|---|---|
| DEP | 0.27 | 5.57 | 4.71 | 3.55 | 38.28:37.93:23.79 | |||||
| DEP-1 | H1-CH3 | 0.293 | 8.52% | 5.637 | 1.20% | 5.232 | 11.08% | 4.319 | 21.66% | − |
| DEP-2 | H1-CH2CH3 | 0.311 | 15.19% | 5.762 | 3.45% | 5.353 | 13.65% | 4.329 | 21.94% | − |
| DEP-3 | H1-CH(CH3)2 | 0.328 | 21.48% | 5.876 | 5.49% | 5.397 | 14.59% | 4.399 | 23.92% | − |
| DEP-4 | H1-C(CH3)3 | 0.349 | 29.26% | 5.976 | 7.29% | 5.673 | 20.45% | 4.36 | 22.82% | − |
| DEP-5 | C1-CH3 | 0.269 | −0.37% | 5.500 | −1.26% | 4.827 | 2.48% | 4.262 | 20.06% | − |
| DEP-6 | C1-OH | 0.228 | −15.56% | 4.828 | −13.32% | 4.838 | 2.72% | 4.224 | 18.99% | − |
| DEP-7 | C1-H | 0.272 | 0.74% | 5.059 | −9.17% | 4.784 | 1.57% | 4.372 | 23.15% | − |
| DEP-8 | C1-CN | 0.255 | −5.56% | 5.266 | −5.46% | 4.874 | 3.48% | 4.172 | 17.52% | − |
| DEP-9 | C1-NH2 | 0.225 | −16.67% | 4.967 | −10.83% | 4.677 | −0.70% | 4.327 | 21.89% | − |
| DEP-10 | C1-CHO | 0.255 | −5.56% | 4.938 | −11.35% | 5.077 | 7.79% | 4.113 | 15.86% | − |
| DEP-11 | C2-OH | 0.249 | −7.78% | 5.658 | 1.58% | 4.594 | −2.46% | 4.29 | 20.85% | − |
| DEP-12 | C2-CHO | 0.262 | −2.96% | 5.737 | 3.00% | 4.871 | 3.42% | 4.282 | 20.62% | − |
| DEP-13 | C2-COOH | 0.269 | −0.37% | 5.892 | 5.78% | 4.921 | 4.48% | 4.312 | 21.46% | − |
| DEP-14 | C2-NH2 | 0.256 | −5.19% | 5.504 | −1.18% | 4.911 | 4.27% | 4.199 | 18.28% | − |
| DEP-15 | C2-COCH3 | 0.289 | 7.04% | 6.109 | 9.68% | 4.969 | 5.50% | 4.378 | 23.32% | − |
| DEP-16 | C2-CONH2 | 0.235 | −12.96% | 5.755 | 3.32% | 4.776 | 1.40% | 4.436 | 24.96% | − |
| DEP-17 | C2-(OH)2 | 0.267 | −1.11% | 5.484 | −1.54% | 5.495 | 16.67% | 4.170 | 17.46% | − |
| DEP-18 | C2-(CHO)2 | 0.267 | −1.11% | 5.409 | −2.89% | 5.73 | 21.66% | 4.131 | 16.37% | − |
| DEP-19 | C2-(COOH)2 | 0.284 | 5.19% | 5.621 | 0.92% | 5.826 | 23.69% | 4.119 | 16.03% | − |
| DEP-20 | C2-(NH2)2 | 0.259 | −4.07% | 5.444 | −2.26% | 5.434 | 15.37% | 4.295 | 20.99% | − |
| DEP-21 | C2-(COCH3)2 | 0.310 | 14.81% | 5.799 | 4.11% | 6.015 | 27.71% | 4.188 | 17.97% | − |
| DEP-22 | C2-(CONH2)2 | 0.261 | −3.33% | 5.362 | −3.73% | 5.946 | 26.24% | 4.175 | 17.61% | − |
| DEP-23 | H1-CH3-C2-COCH3 | 0.357 | 32.22% | 6.317 | 13.41% | 5.547 | 17.77% | 4.198 | 18.25% | 27.13:35.95:36.92 |
| DEP-24 | H1-CH2CH3-C2-COCH3 | 0.377 | 39.63% | 6.453 | 15.85% | 5.725 | 21.55% | 4.169 | 17.44% | 28.91:39.30:31.80 |
| DEP-25 | H1-CH(CH3)2-C2-COCH3 | 0.389 | 44.07% | 6.565 | 17.86% | 5.708 | 21.19% | 4.200 | 18.31% | 31.14:36.94:31.92 |
| DEP-26 | H1-C(CH3)3-C2-COCH3 | 0.406 | 50.37% | 6.725 | 20.74% | 5.787 | 22.87% | 4.282 | 20.62% | 32.29:35.60:32.11 |
| DEP-27 | H1-CH3-C2-CONH2 | 0.333 | 23.33% | 6.077 | 9.10% | 5.778 | 22.68% | 4.129 | 16.31% | 18.93:47.15:33.92 |
| DEP-28 | H1-CH2CH3-C2-CONH2 | 0.343 | 27.04% | 6.151 | 10.43% | 5.898 | 25.22% | 4.130 | 16.34% | 20.06:48.51:31.42 |
| DEP-29 | H1-CH(CH3)2-C2-CONH2 | 0.356 | 31.85% | 6.263 | 12.44% | 5.879 | 24.82% | 4.144 | 16.73% | 23.04:45.97:30.99 |
| DEP-30 | H1-C(CH3)3-C2-CONH2 | 0.370 | 37.04% | 6.382 | 14.58% | 5.953 | 26.39% | 4.230 | 19.15% | 24.25:43.89:31.86 |
| Model | 3D-QSAR | q2 | n | SEE | R2 | F | r2pred | Q2 | cSDEP | dq2/dr2yy |
|---|---|---|---|---|---|---|---|---|---|---|
| a | CoMSIA | 0.627 | 8 | 0.172 | 0.998 | 284.548 | 0.657 | 0.559 | 2.78 | 0.958 |
| b | CoMFA | 0.697 | 3 | 0.518 | 0.986 | 207.862 | 0.918 | 0.422 | 3.306 | 1.372 |
| c | CoMFA | 0.68 | 10 | 0.001 | 1 | 465107.312 | 0.618 | 0.491 | 3.021 | 0.690 |
| No. | Total Energy (a.u.) | Change Rate (%) | Energy Gap (eV) | Frequency (cm−1) | Bio-Toxicity (logLC50) | Change Rate (%) | Bioaccumulation (logBCF) | BCF | Persistence (logt1/2) | Change Rate (%) | Long-Range Migration (logKOA) | Change Rate (%) |
|---|---|---|---|---|---|---|---|---|---|---|---|---|
| DEP | −766.62 | 5.32 | 24.02 | 1.100 | 1.264 | 18.37 | 3.156 | 7.505 | ||||
| DEP-23 | −919.26 | −19.91% | 5.15 | 15.09 | 0.781 | 29.00% | 1.879 | 75.68 | 3.271 | −3.64% | 8.540 | 13.79% |
| DEP-24 | −958.57 | −25.04% | 5.16 | 18.09 | 0.744 | 32.36% | 1.992 | 98.17 | 3.250 | −2.98% | 8.546 | 13.87% |
| DEP-25 | −997.89 | −30.17% | 5.14 | 17.65 | 0.737 | 33.00% | 2.041 | 109.90 | 3.230 | −2.34% | 8.563 | 14.10% |
| DEP-26 | −1037.2 | −35.30% | 5.06 | 15.38 | 0.672 | 38.91% | 2.116 | 130.62 | 3.215 | −1.87% | 8.766 | 16.80% |
| DEP-27 | −935.32 | −22.01% | 5.00 | 19.32 | 1.070 | 2.73% | 1.569 | 37.07 | 3.386 | −7.29% | 8.329 | 10.98% |
| DEP-28 | −974.64 | −27.13% | 4.97 | 16.33 | 1.047 | 4.82% | 1.600 | 39.81 | 3.378 | −7.03% | 8.352 | 11.29% |
| DEP-29 | −1013.95 | −32.26% | 4.96 | 16.24 | 1.038 | 5.64% | 1.653 | 44.98 | 3.357 | −6.37% | 8.374 | 11.58% |
| DEP-30 | −1053.26 | −37.39% | 4.94 | 15.99 | 0.923 | 16.09% | 1.716 | 52.00 | 3.349 | −6.12% | 8.489 | 13.11% |
| DEP | Change Rate (%) | DEP-27 | Change Rate (%) | |||||||
|---|---|---|---|---|---|---|---|---|---|---|
| Path | Reactants | Reaction Products | Energy Barrier (kJ/mol) | Total Energy Barrier (kJ/mol) | Reactants | Reaction Products | Energy Barrier (kJ/mol) | Total Energy Barrier (kJ/mol) | ||
| Path1 | DEP | M0-1 | 27.57 | 127.33 | − | DEP-27 | M1-1 | 28.88 | 113.16 | −11.13 |
| M0-1 | M0-2 | 15.75 | M1-1 | M1-2 | 13.92 | |||||
| M0-2 | M0-3 | 53.82 | M1-2 | M1-3 | 56.97 | |||||
| M0-3 | M0-5 | 30.19 | M1-3 | M1-5 | 13.39 | |||||
| Path2 | DEP | M0-1 | 27.57 | 139.68 | − | DEP-27 | M1-1 | 28.88 | 127.07 | −9.02 |
| M0-1 | M0-2 | 15.75 | M1-1 | M1-2 | 13.92 | |||||
| M0-2 | M0-4 | 68.79 | M1-2 | M1-4 | 72.99 | |||||
| M0-4 | M0-5 | 27.57 | M1-4 | M1-5 | 11.29 | |||||
| Total Change rate (%) | −20.15 | |||||||||
| DEP-28 | Change Rate (%) | DEP-29 | Change Rate (%) | |||||||
| Path | Reactants | Reaction Products | Energy Barrier (kJ/mol) | Total Energy Barrier (kJ/mol) | Path | Reactants | Reaction Products | Energy Barrier (kJ/mol) | ||
| Path1 | DEP-28 | M2-1 | 24.94 | 110.98 | −12.84 | DEP-29 | M3-1 | 17.07 | 99.77 | −21.65 |
| M2-1 | M2-2 | 15.67 | M3-1 | M3-2 | 12.34 | |||||
| M2-2 | M2-3 | 56.97 | M3-2 | M3-3 | 56.97 | |||||
| M2-3 | M2-5 | 13.39 | M3-3 | M3-5 | 13.39 | |||||
| Path2 | DEP-28 | M2-1 | 24.94 | 124.90 | −10.58 | DEP-29 | M3-1 | 17.07 | 113.68 | −18.61 |
| M2-1 | M2-2 | 15.67 | M3-1 | M3-2 | 12.34 | |||||
| M2-2 | M2-4 | 72.99 | M3-2 | M3-4 | 72.99 | |||||
| M2-4 | M2-5 | 11.29 | M3-4 | M3-5 | 11.29 | |||||
| Total Change rate (%) | −23.42 | Total Change rate (%) | −30.26 | |||||||
| No. | 2PIA | 2ZYI | 3CN7 | |||
|---|---|---|---|---|---|---|
| Docking Score Value | △Gbind (kJ/mol) | Docking Score Value | △Gbind (kJ/mol) | Docking Score Value | △Gbind (kJ/mol) | |
| DEP | 5.574 | −62.400 | 4.711 | −138.694 | 3.548 | −108.742 |
| DEP-27 | 5.323↓ | −126.613↓ | 3.491↓ | −158.330↓ | 5.661↑ | −102.247↑ |
| DEP-28 | 5.793↑ | −74.505↓ | 3.993↓ | −138.588↑ | 6.139↑ | −136.861↓ |
| DEP-29 | 5.717↑ | −108.149↓ | 7.535↑ | −177.961↓ | 7.042↑ | −160.312↓ |
© 2020 by the authors. Licensee MDPI, Basel, Switzerland. This article is an open access article distributed under the terms and conditions of the Creative Commons Attribution (CC BY) license (http://creativecommons.org/licenses/by/4.0/).
Share and Cite
Zhang, H.; Zhao, C.; Na, H. Enhanced Biodegradation of Phthalic Acid Esters’ Derivatives by Plasticizer-Degrading Bacteria (Burkholderia cepacia, Archaeoglobus fulgidus, Pseudomonas aeruginosa) Using a Correction 3D-QSAR Model. Int. J. Environ. Res. Public Health 2020, 17, 5299. https://0-doi-org.brum.beds.ac.uk/10.3390/ijerph17155299
Zhang H, Zhao C, Na H. Enhanced Biodegradation of Phthalic Acid Esters’ Derivatives by Plasticizer-Degrading Bacteria (Burkholderia cepacia, Archaeoglobus fulgidus, Pseudomonas aeruginosa) Using a Correction 3D-QSAR Model. International Journal of Environmental Research and Public Health. 2020; 17(15):5299. https://0-doi-org.brum.beds.ac.uk/10.3390/ijerph17155299
Chicago/Turabian StyleZhang, Haigang, Chengji Zhao, and Hui Na. 2020. "Enhanced Biodegradation of Phthalic Acid Esters’ Derivatives by Plasticizer-Degrading Bacteria (Burkholderia cepacia, Archaeoglobus fulgidus, Pseudomonas aeruginosa) Using a Correction 3D-QSAR Model" International Journal of Environmental Research and Public Health 17, no. 15: 5299. https://0-doi-org.brum.beds.ac.uk/10.3390/ijerph17155299