Measuring the Urban Particulate Matter Island Effect with Rapid Urban Expansion


Abstract
:1. Introduction
2. Study Area and Materials
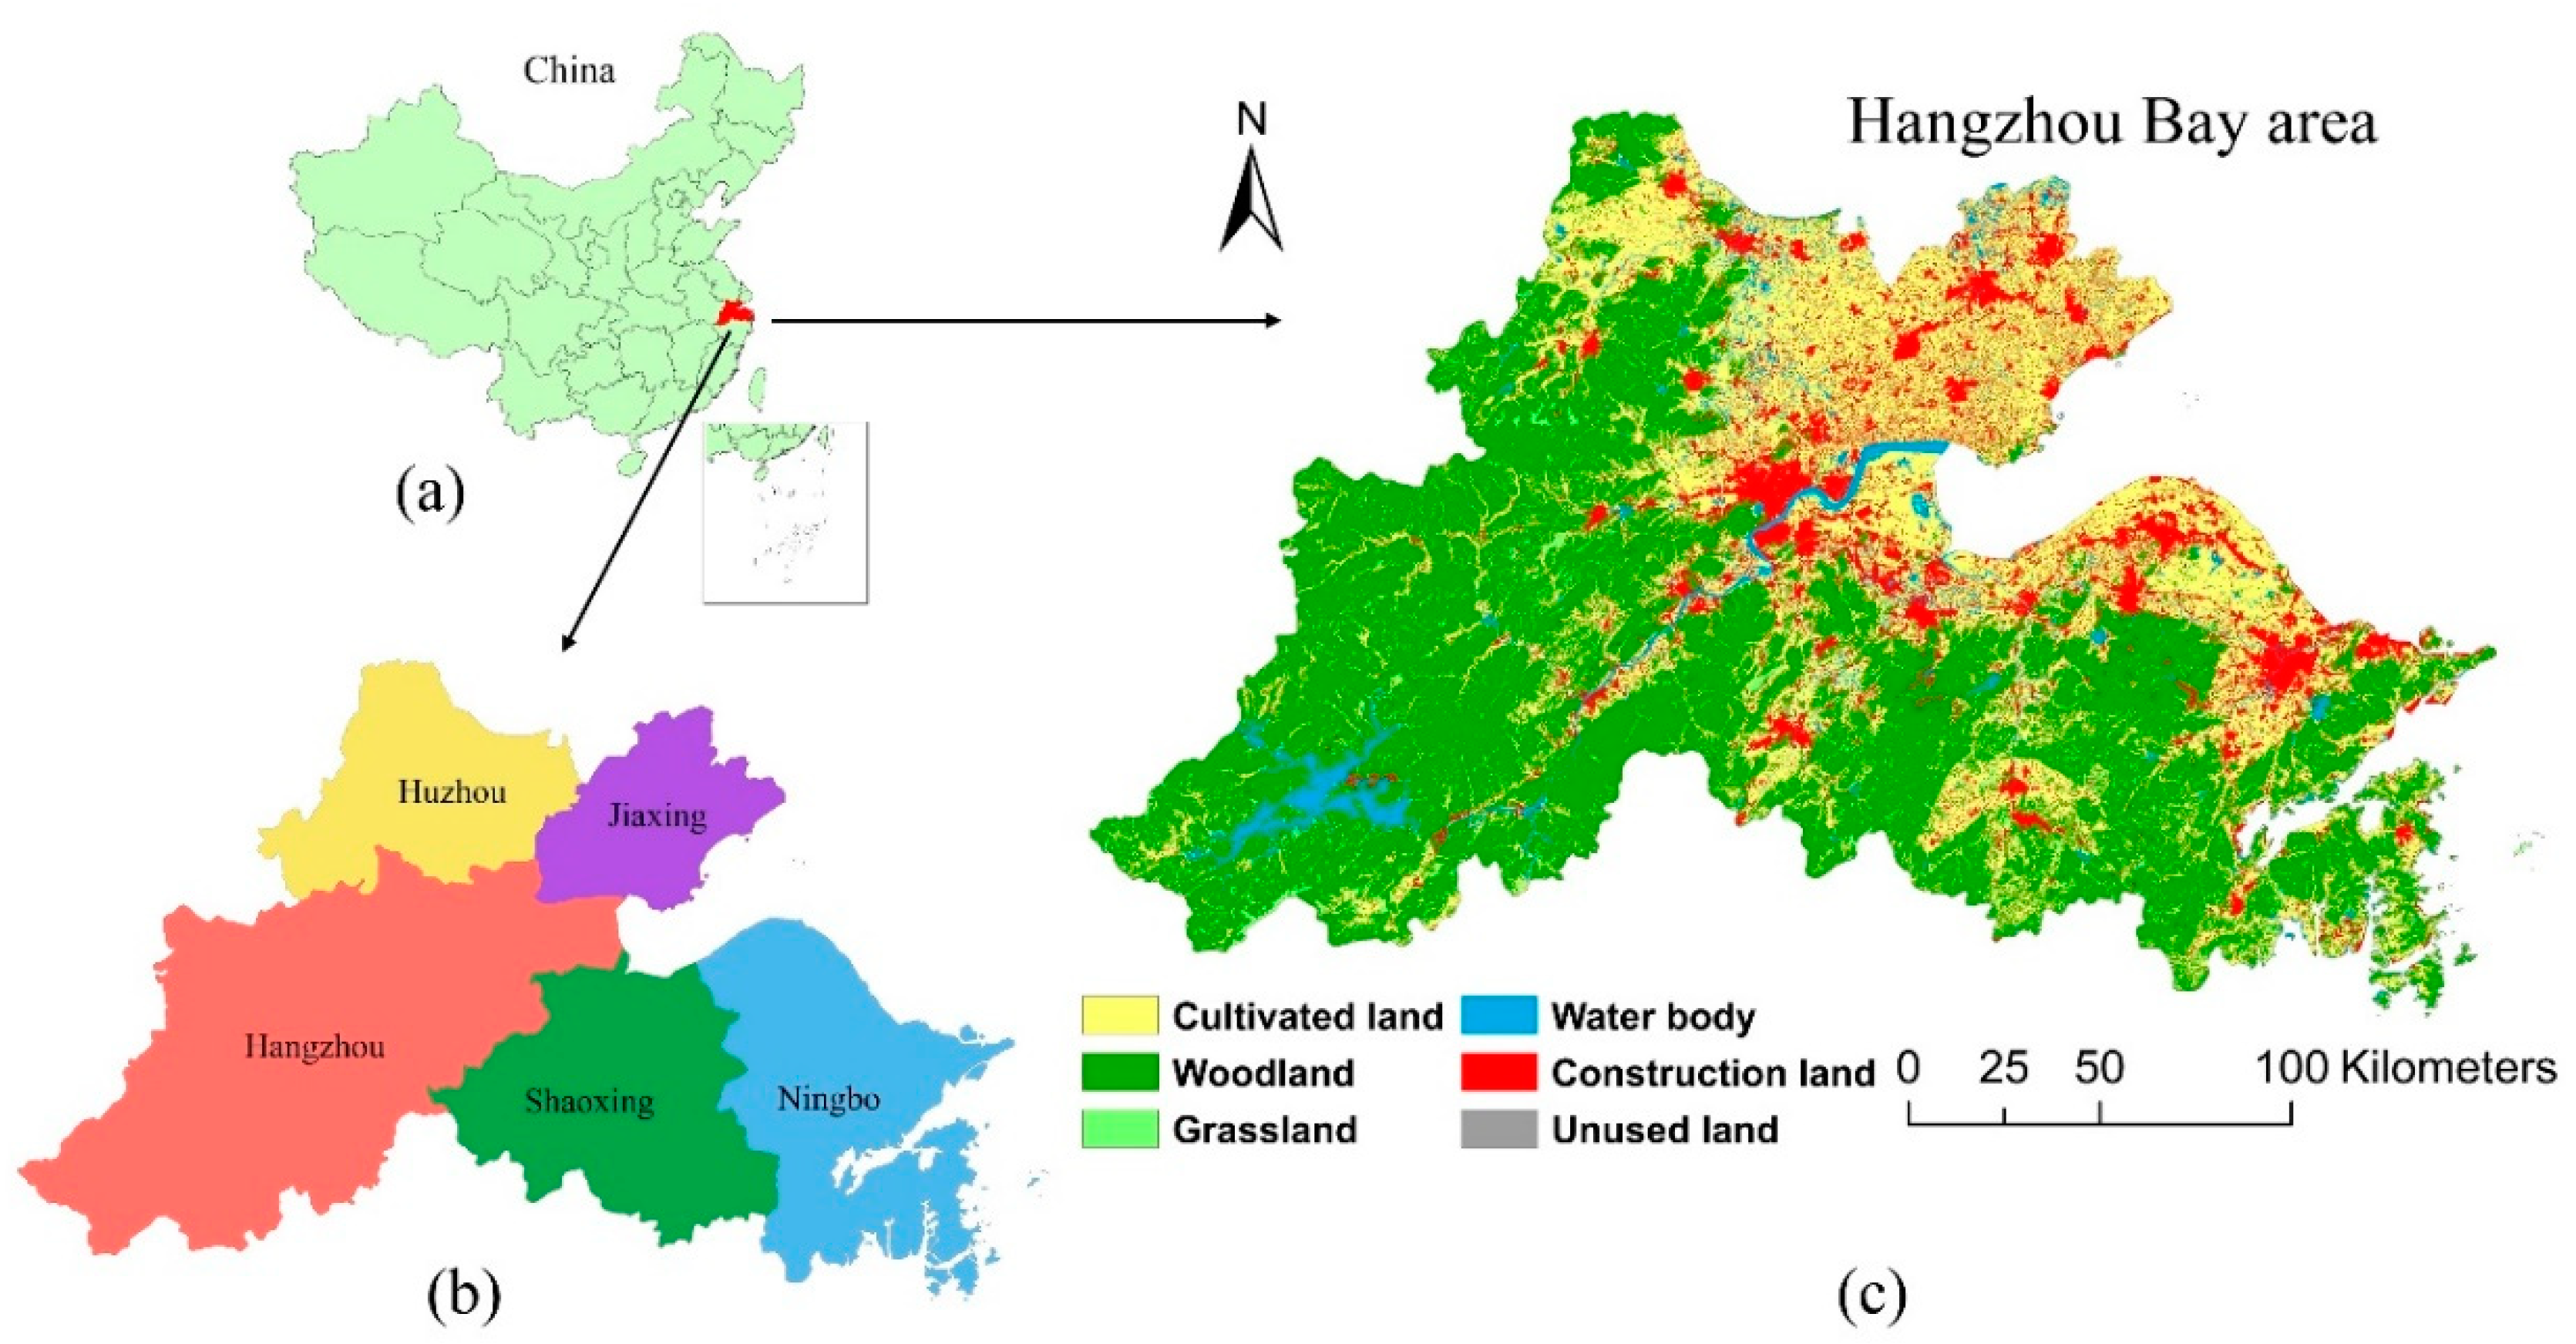
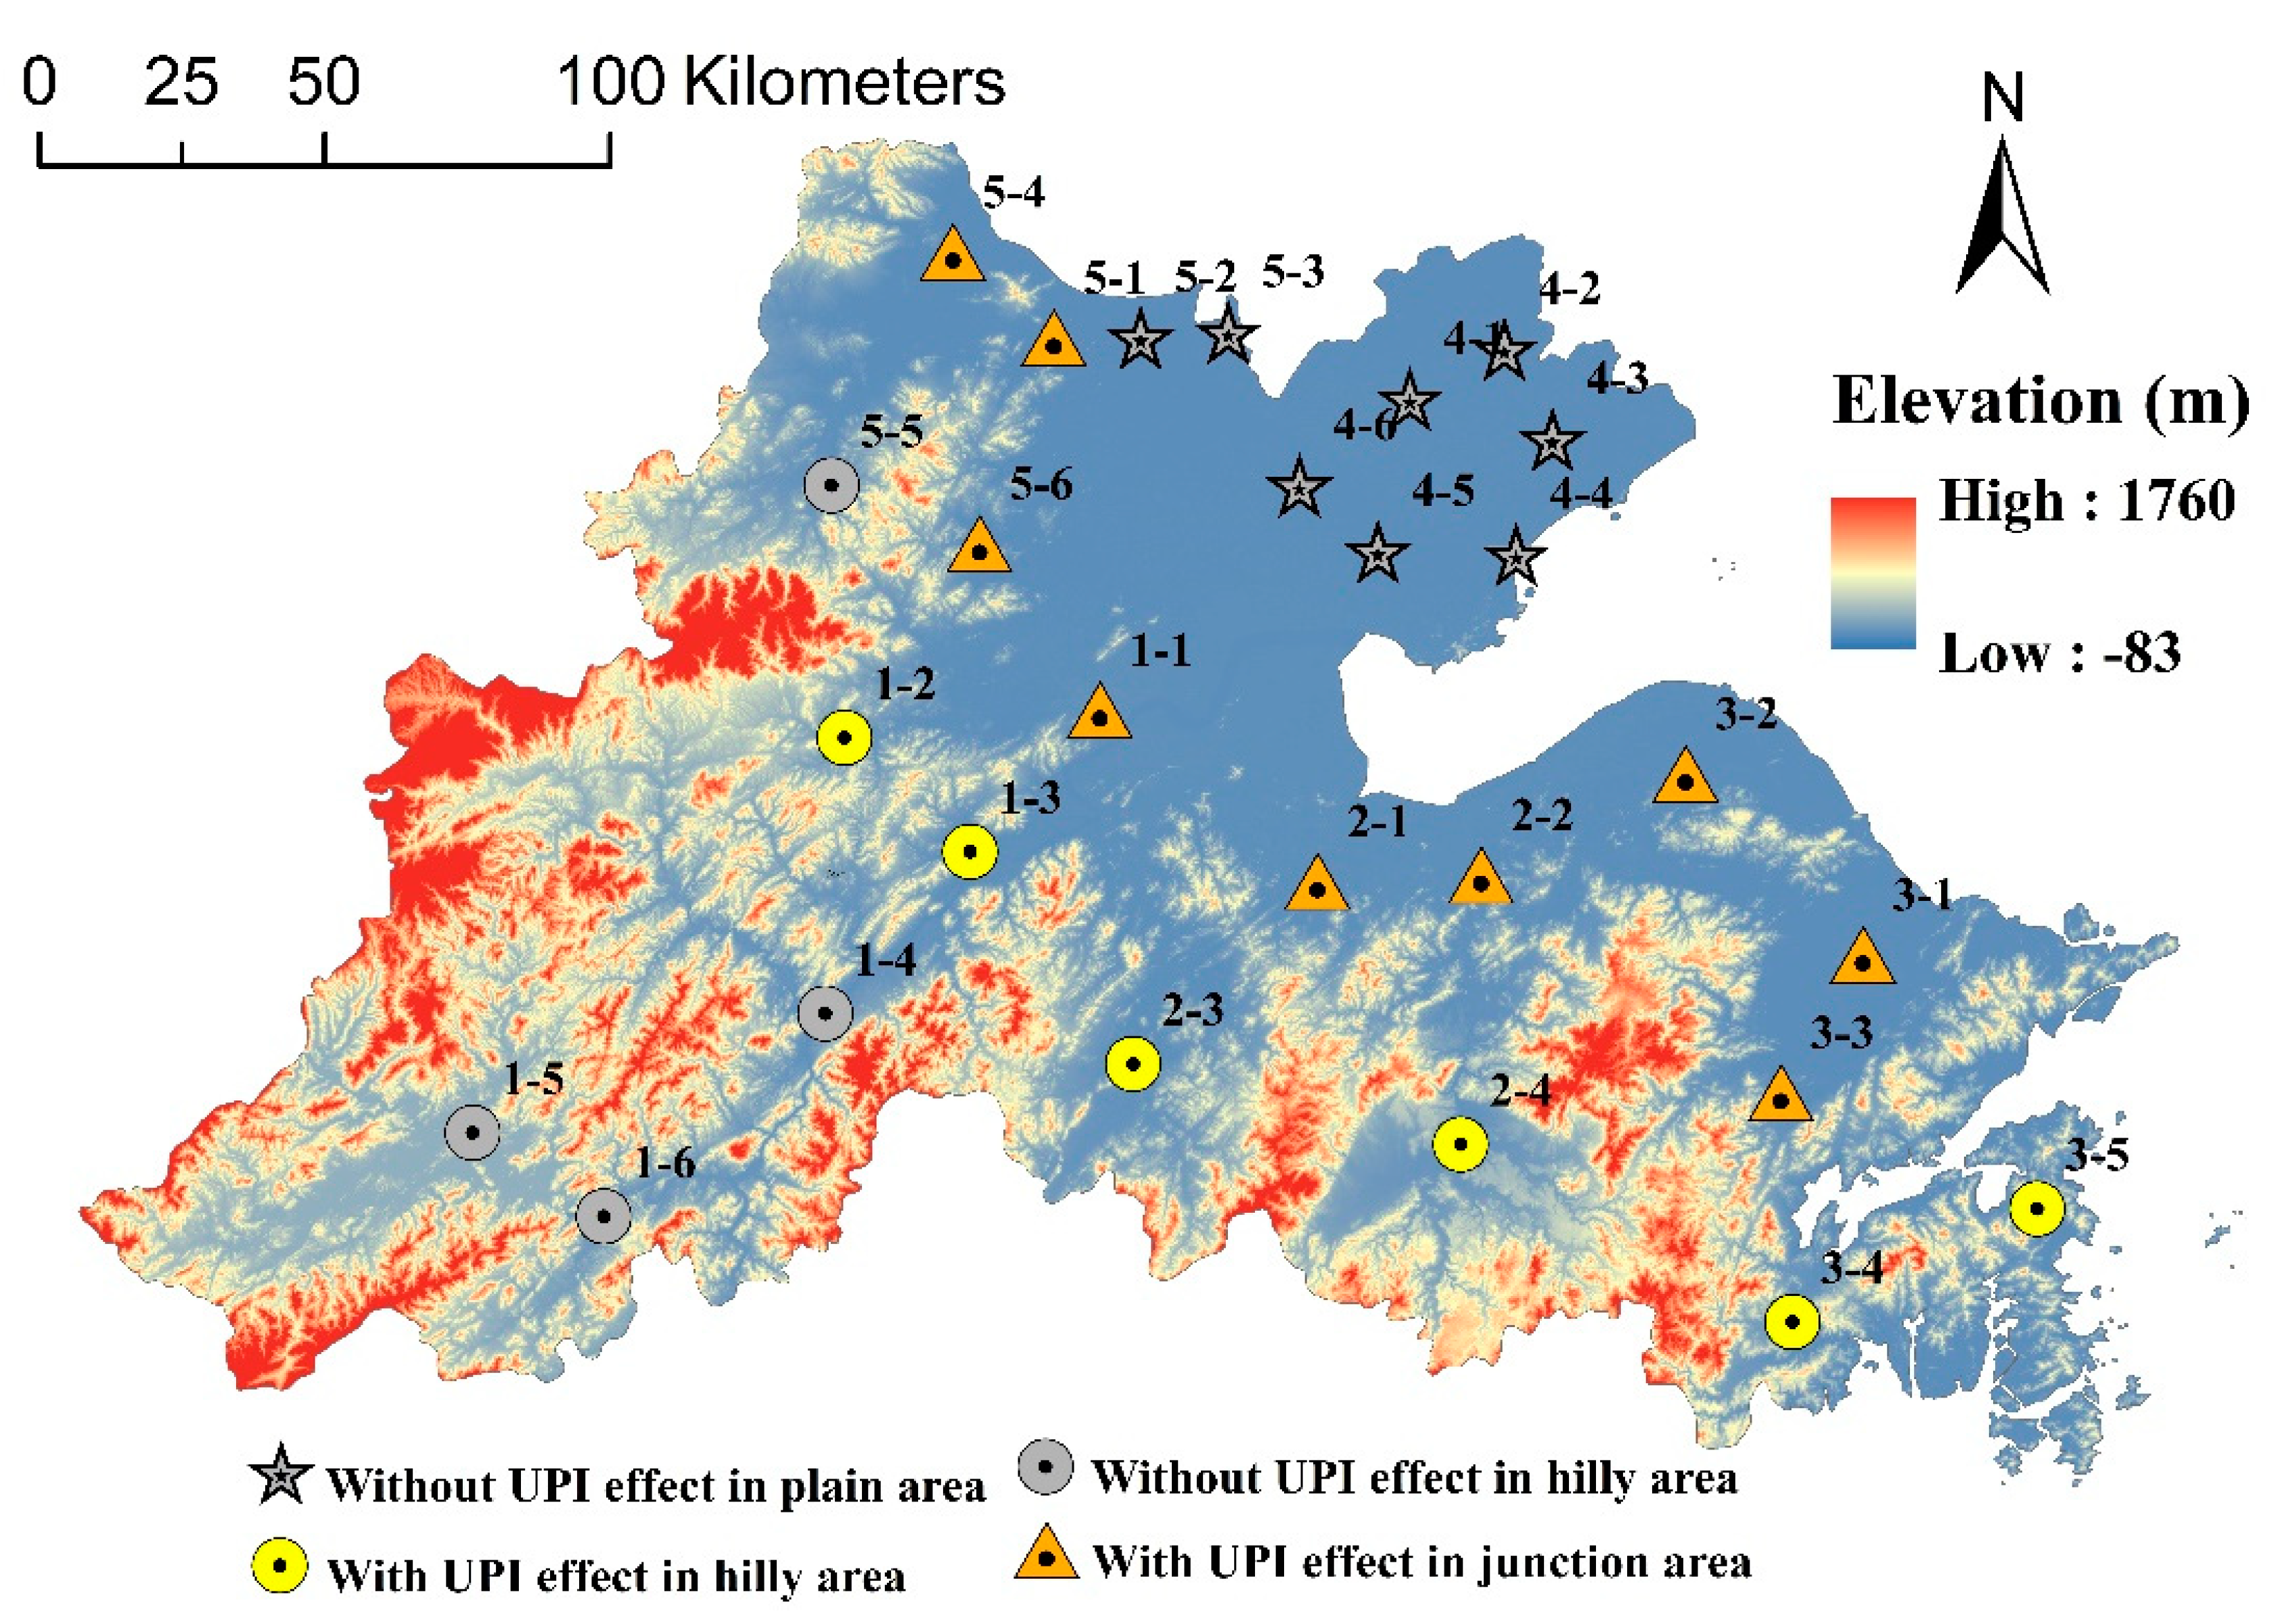
2.1. Study Area
2.2. Data Source
3. Methods
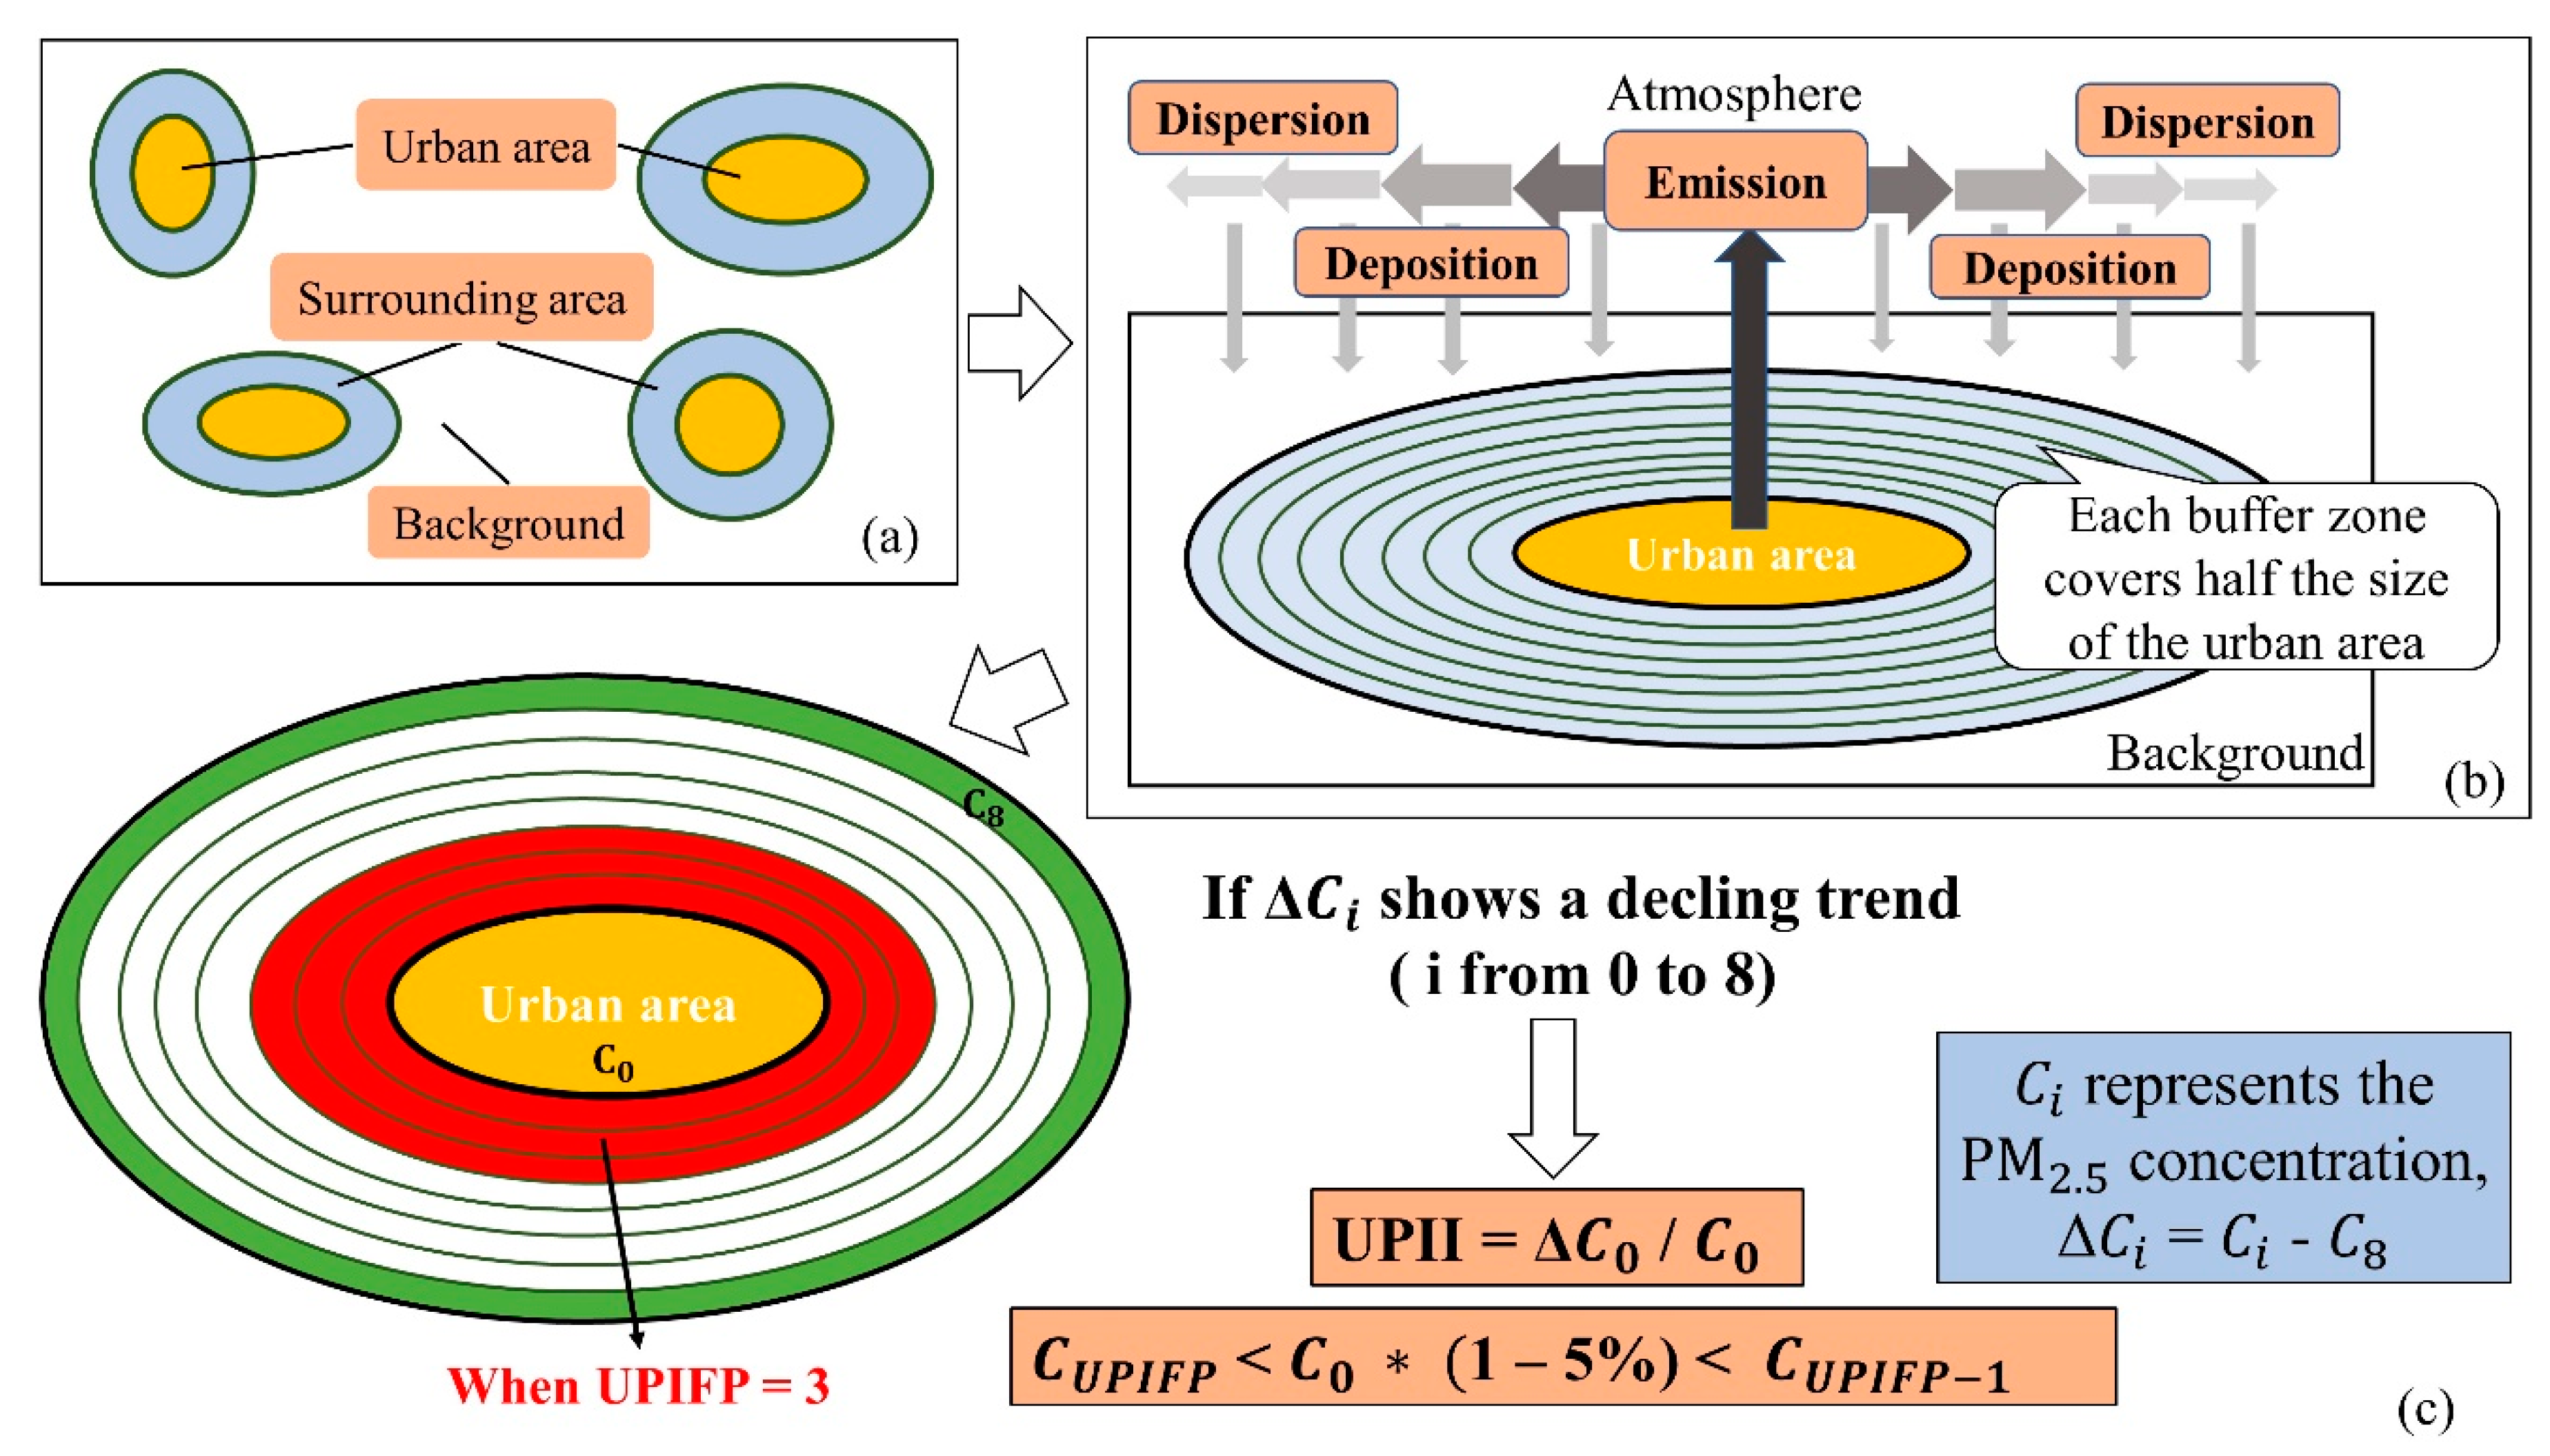
3.1. Rationale
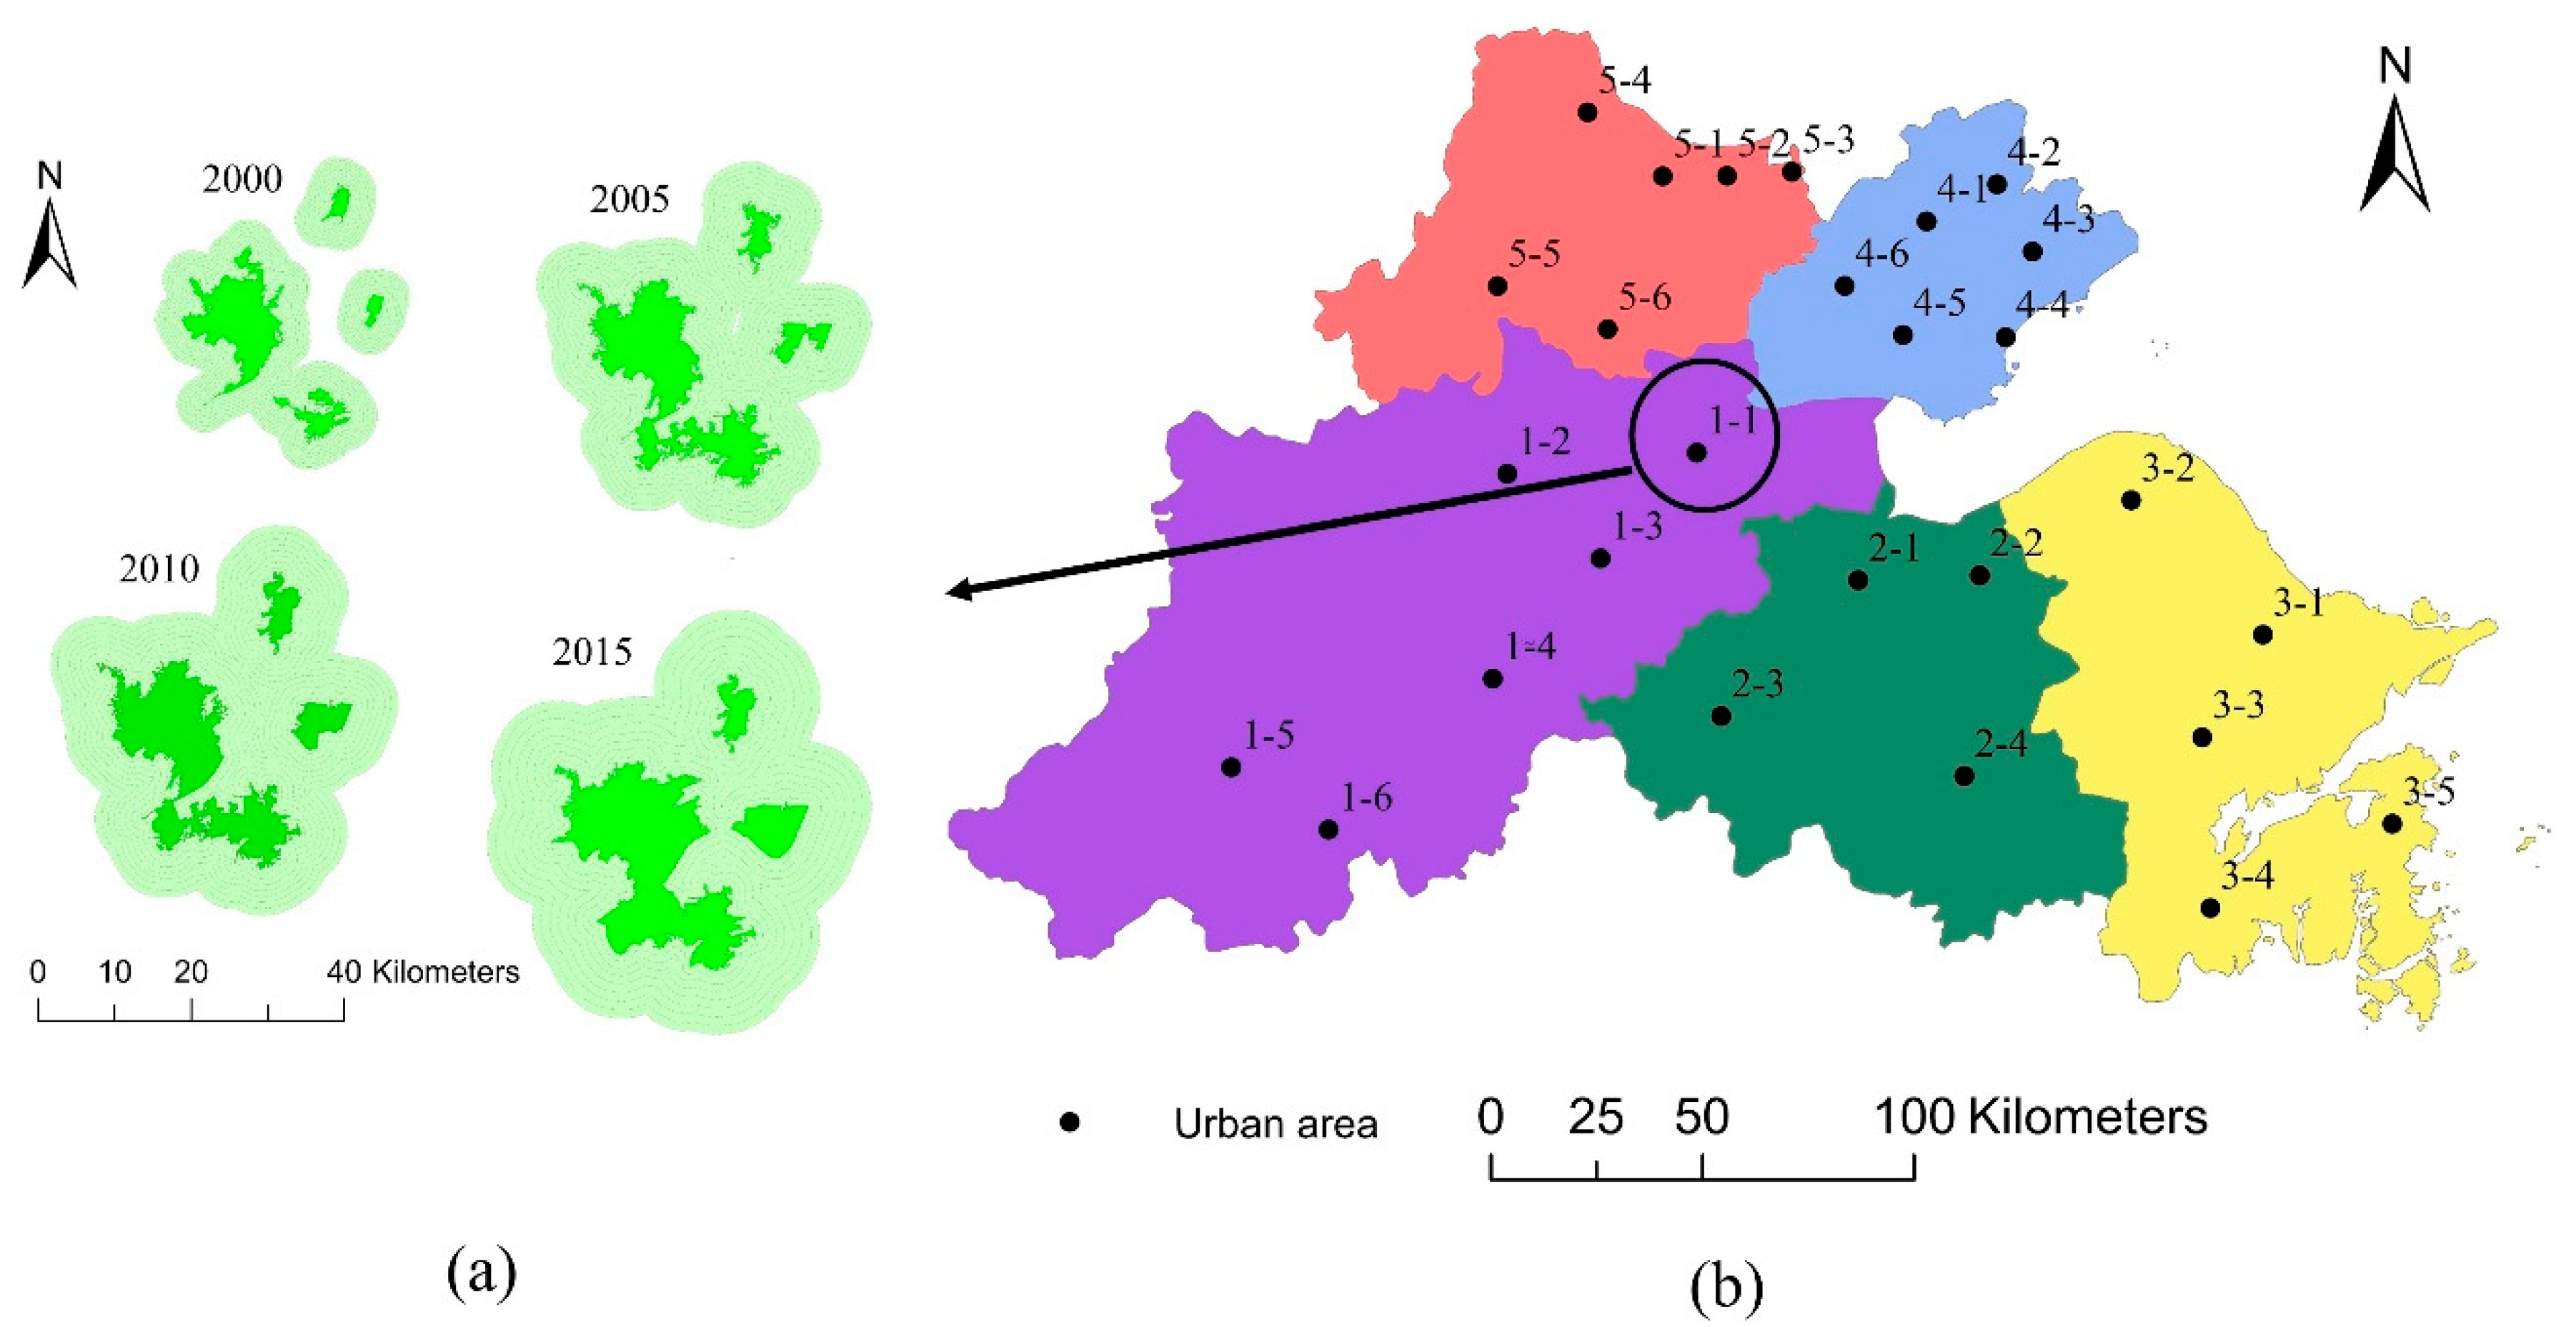
3.2. Extraction of the Urban and Surrounding Areas
3.3. Model of the UPI Effect
4. Results
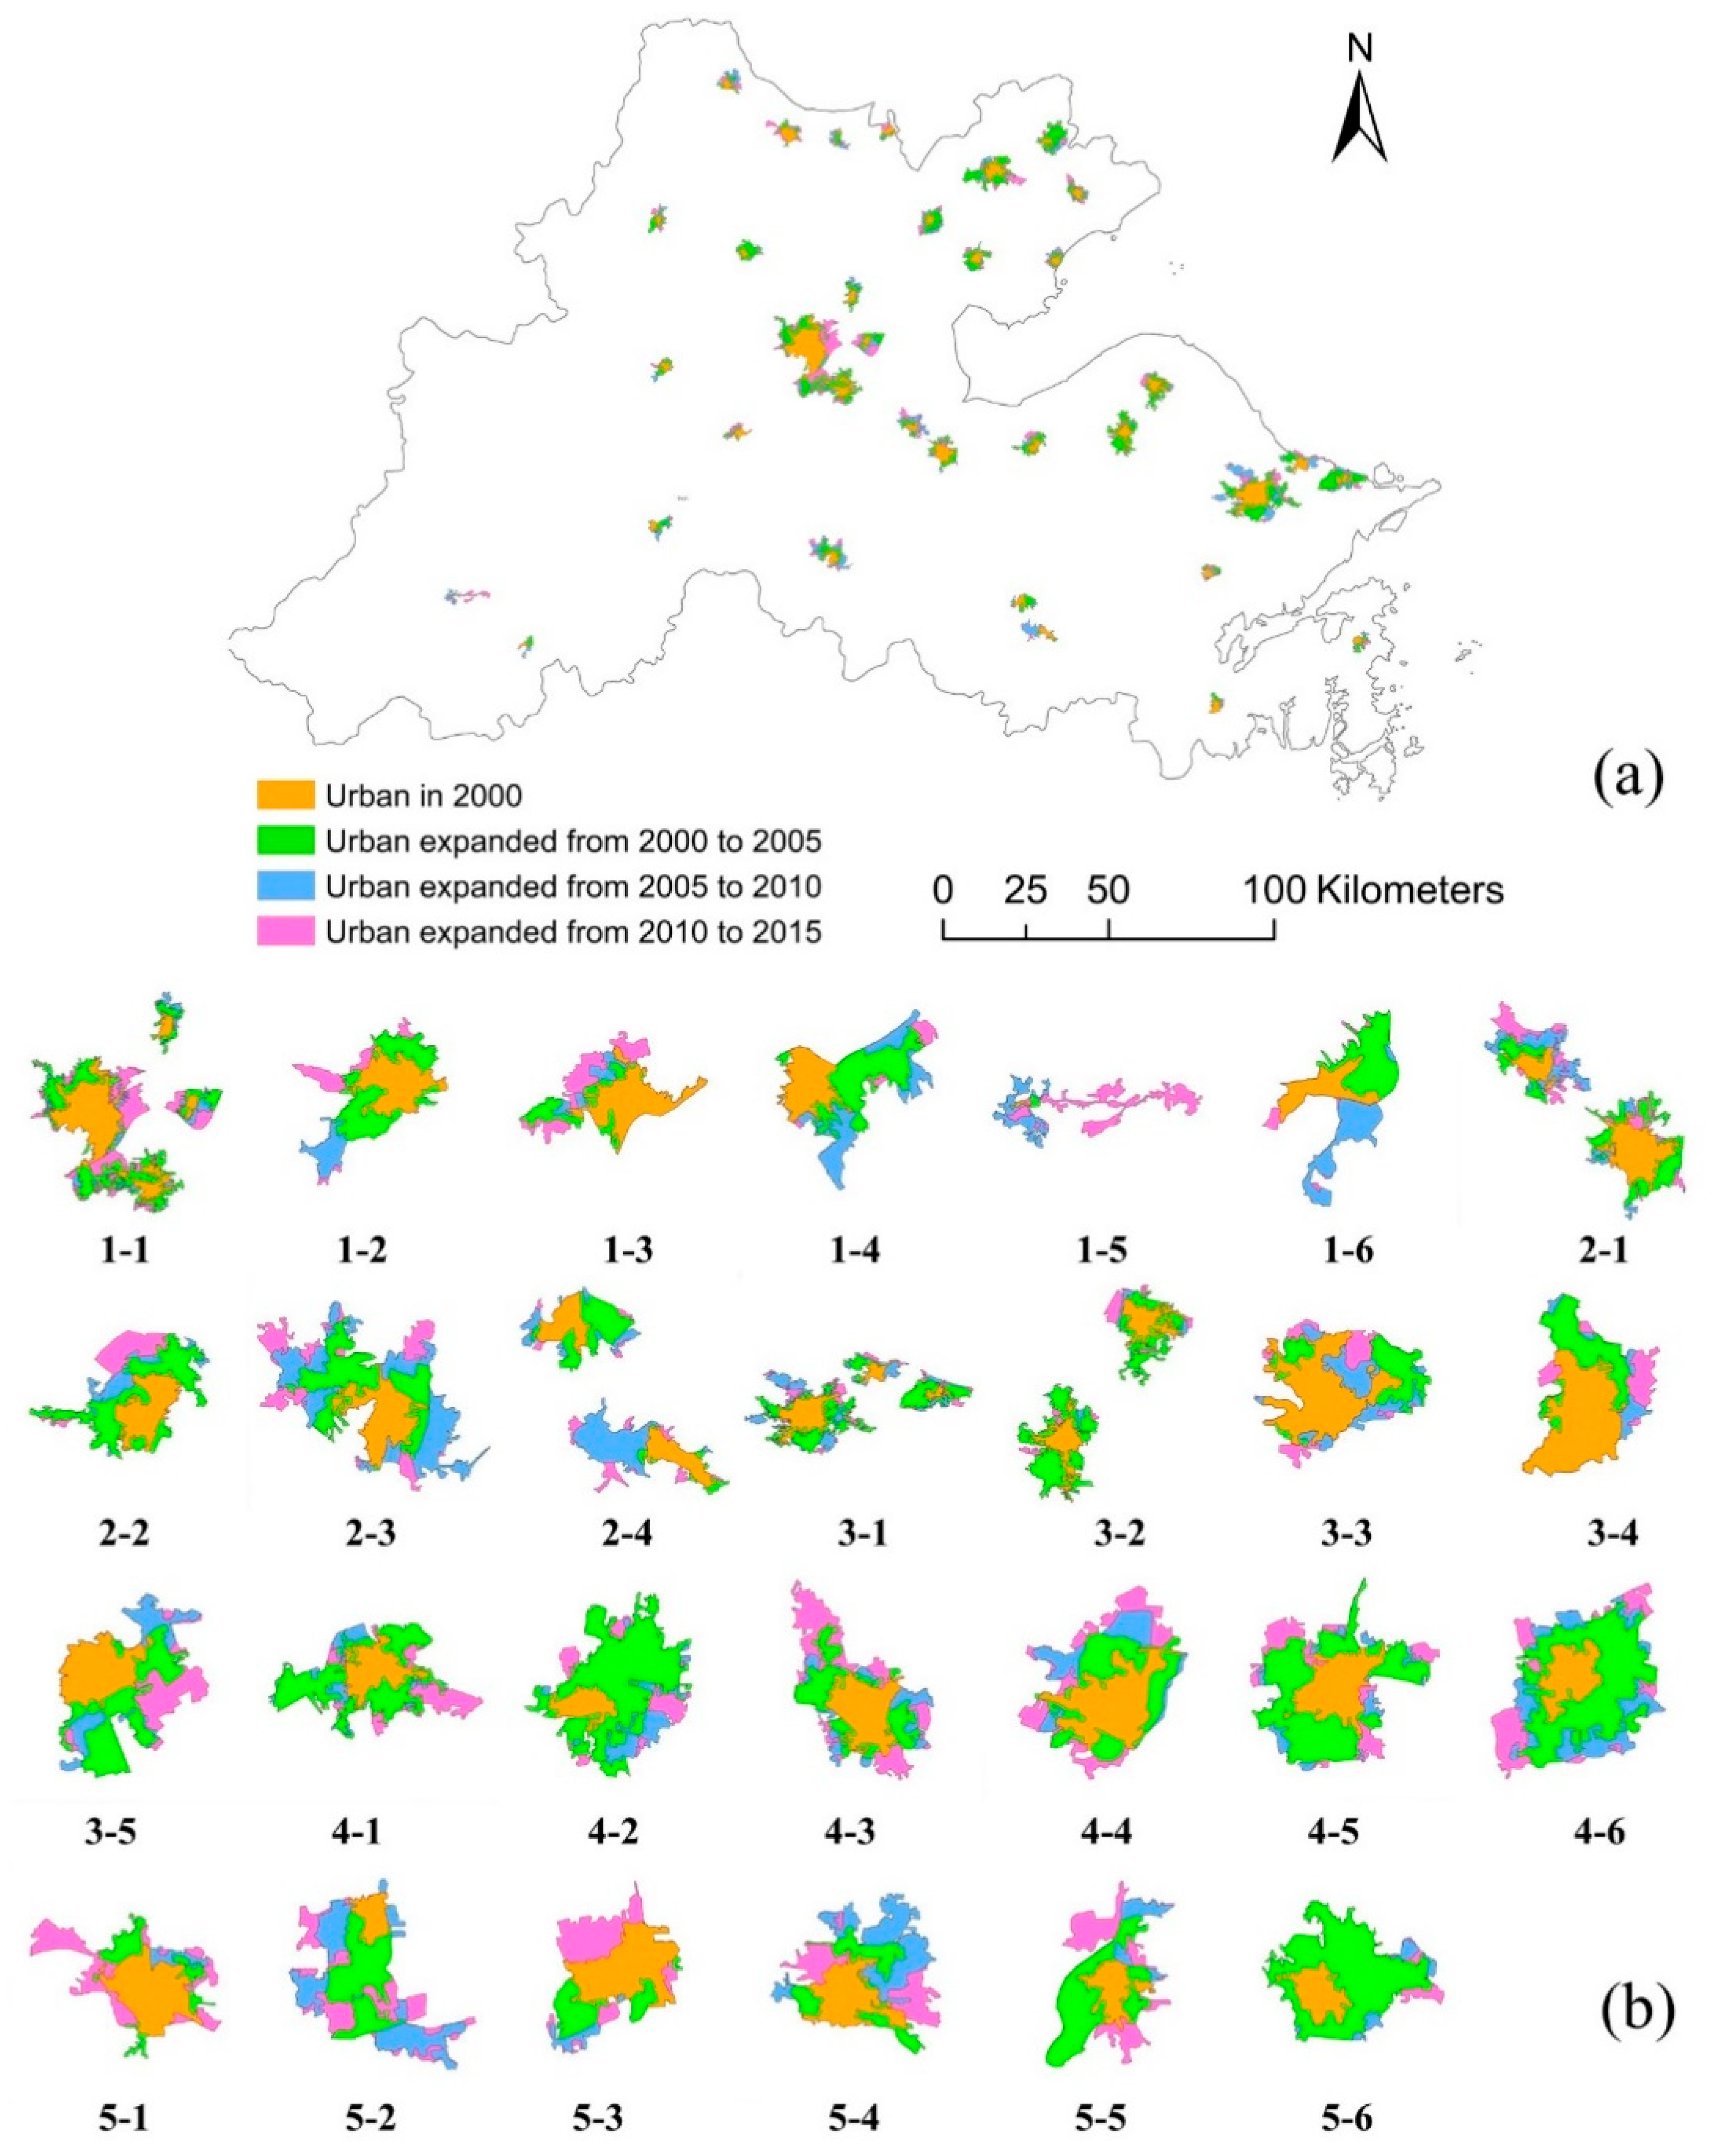
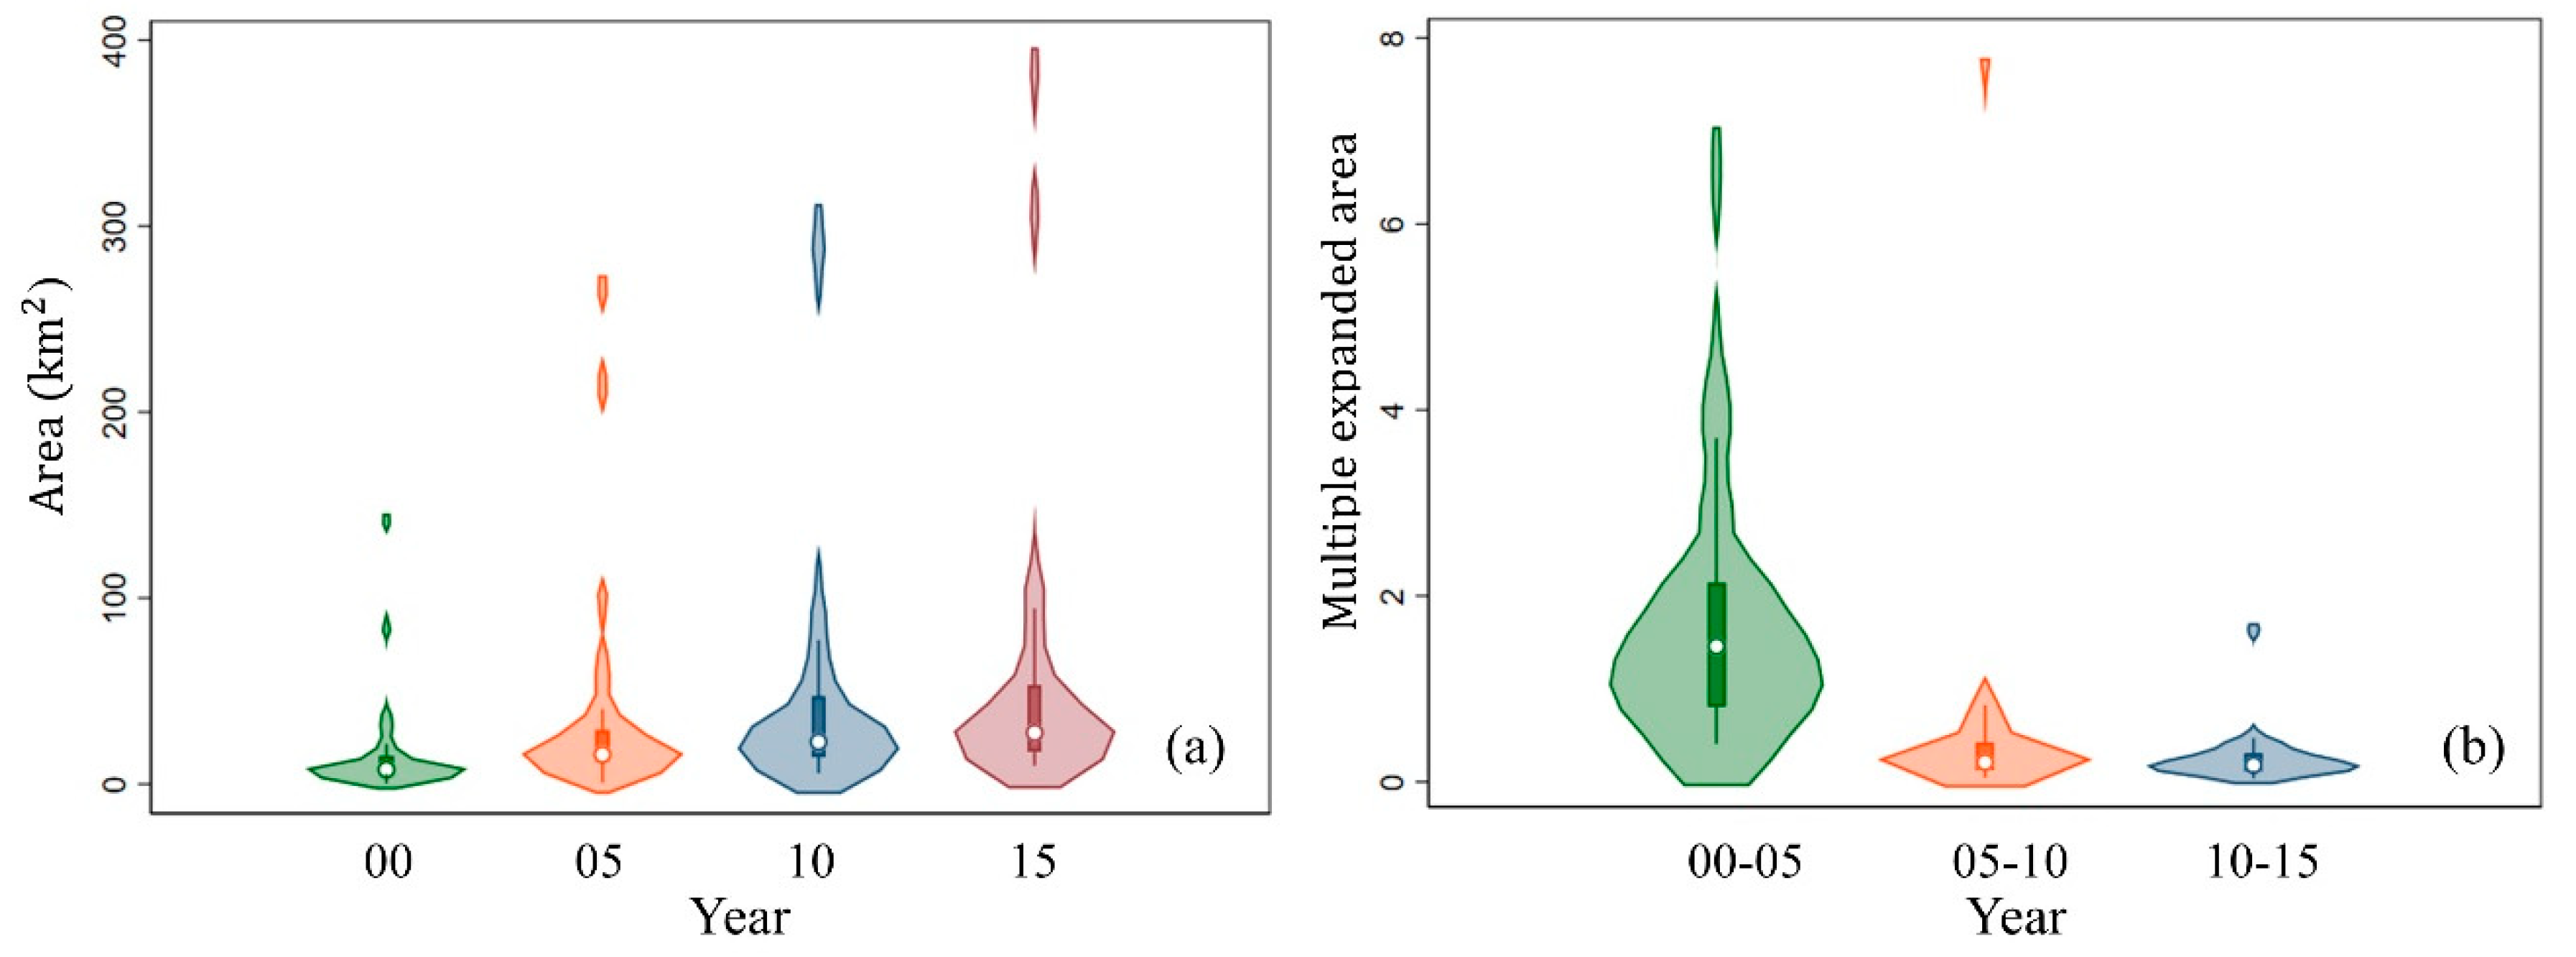
4.1. Spatial Patterns of Urban Expansion
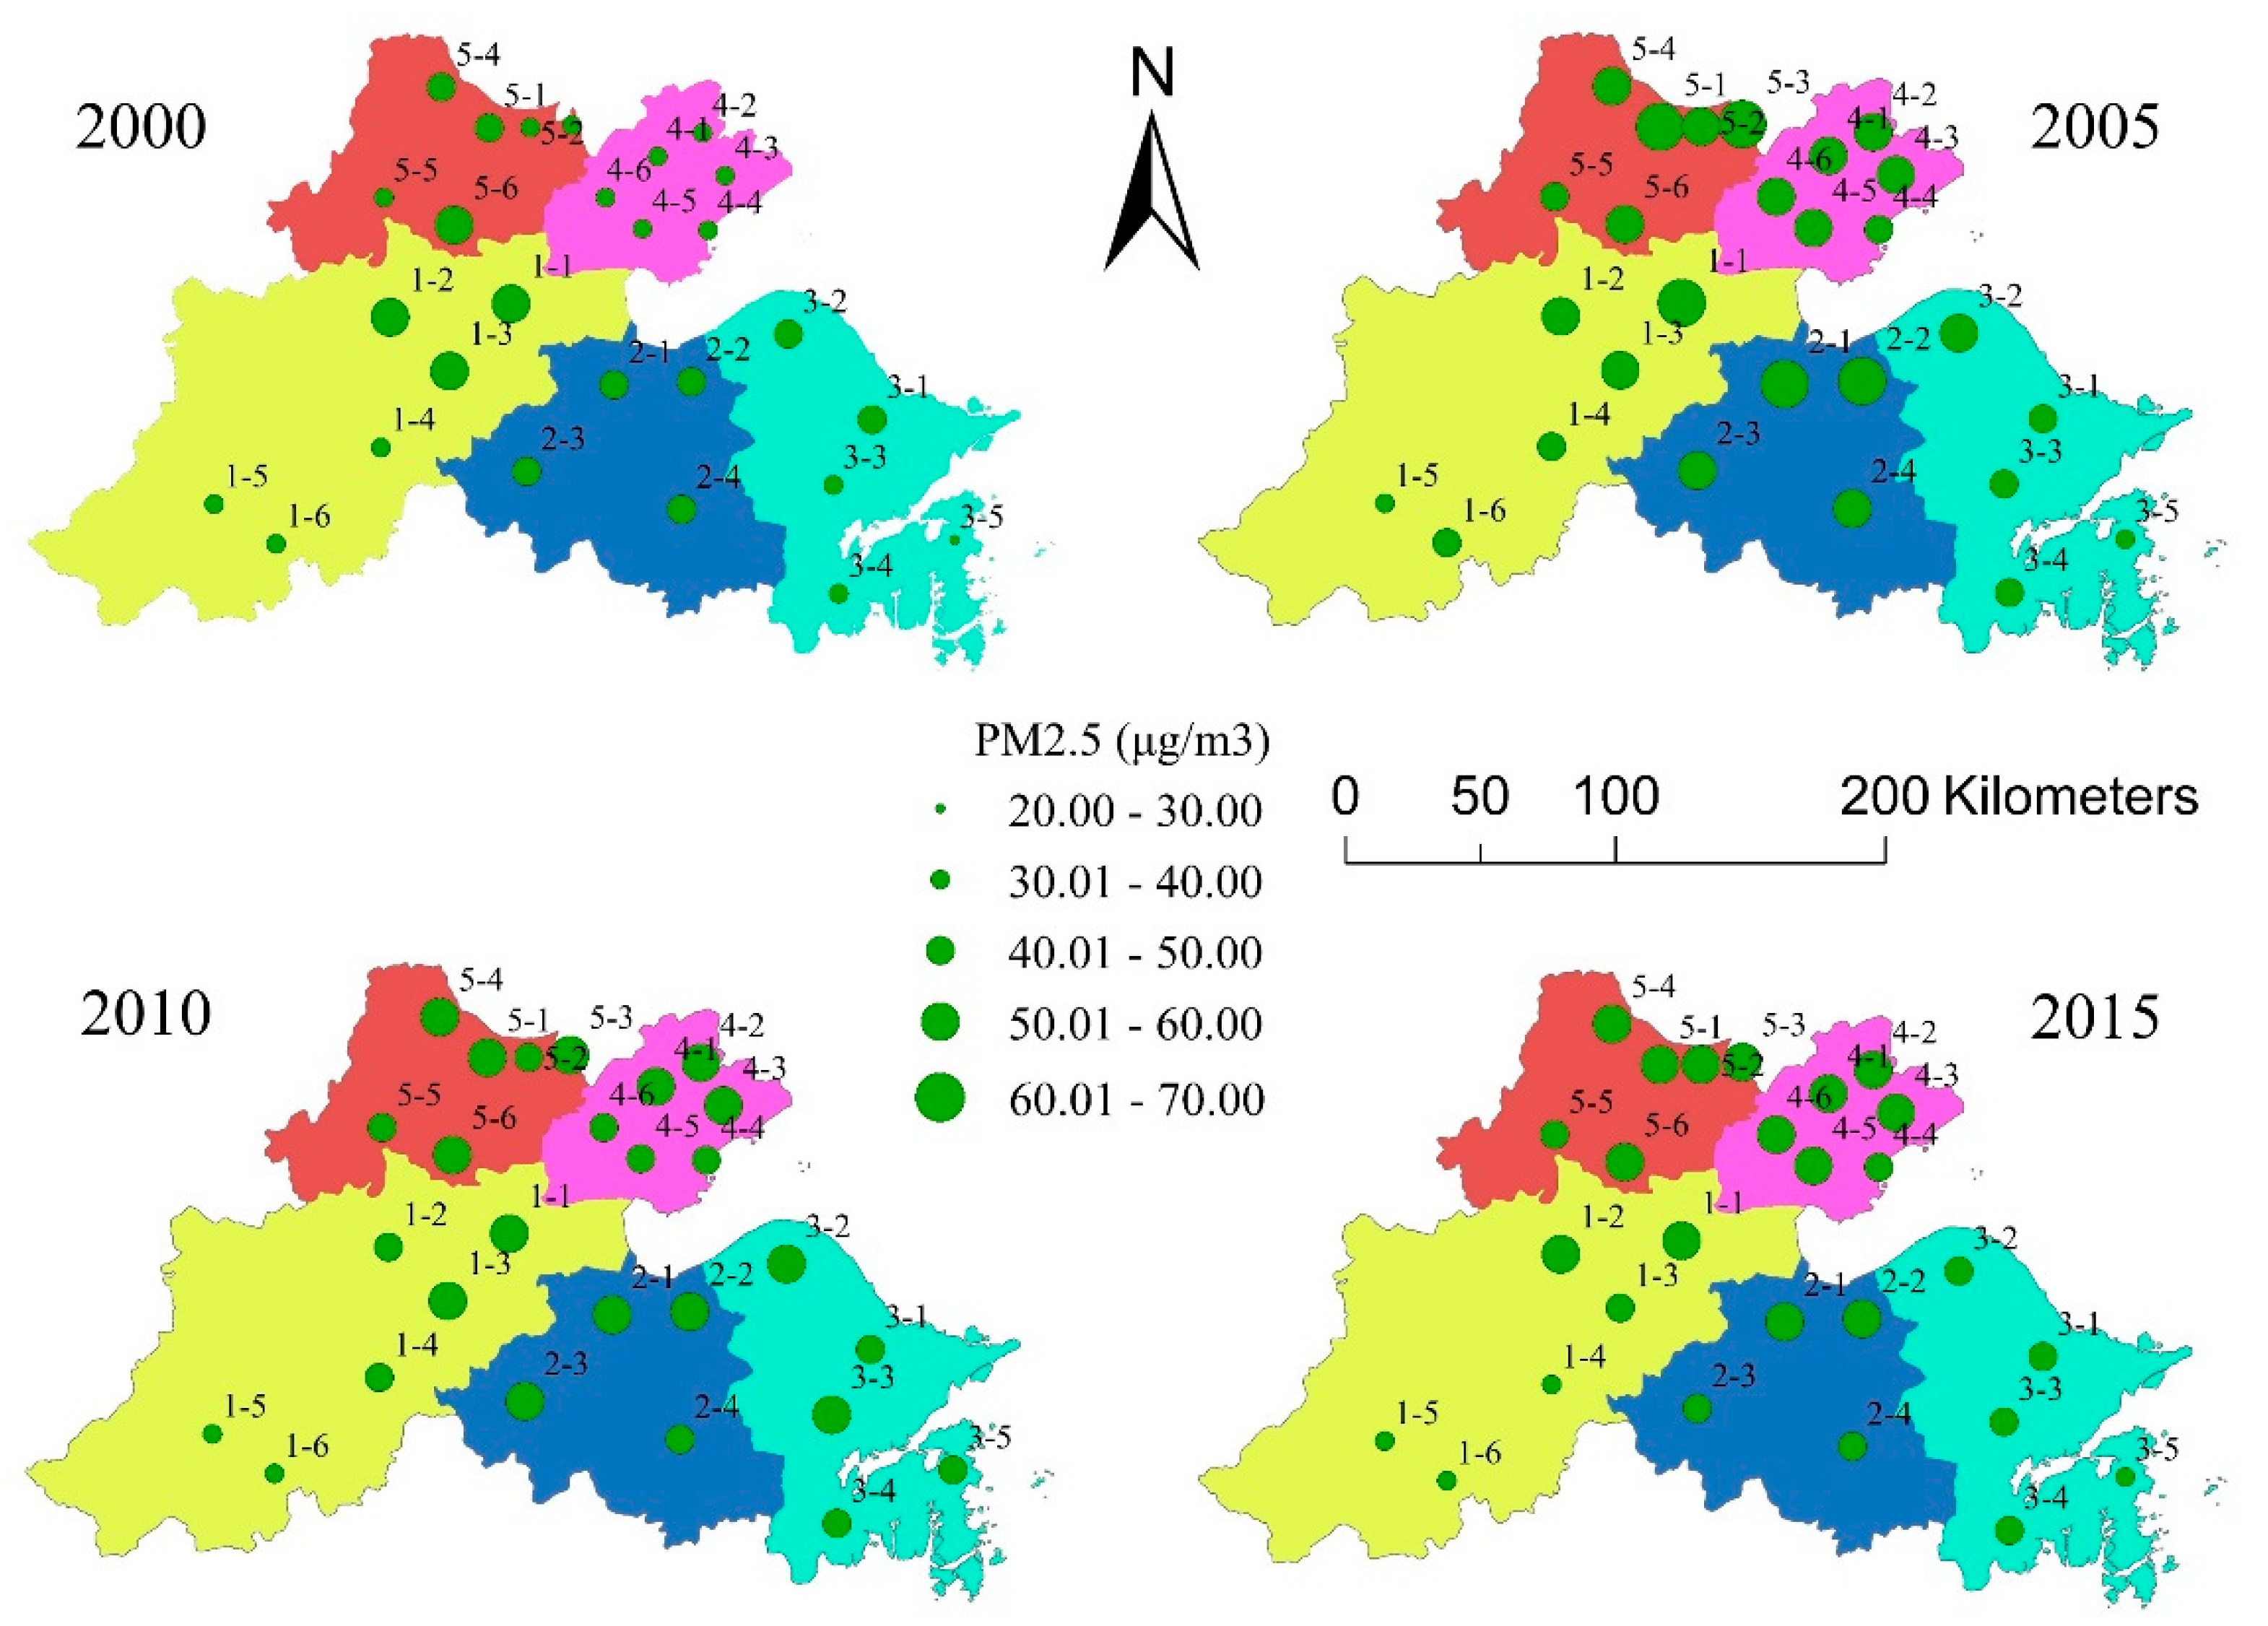
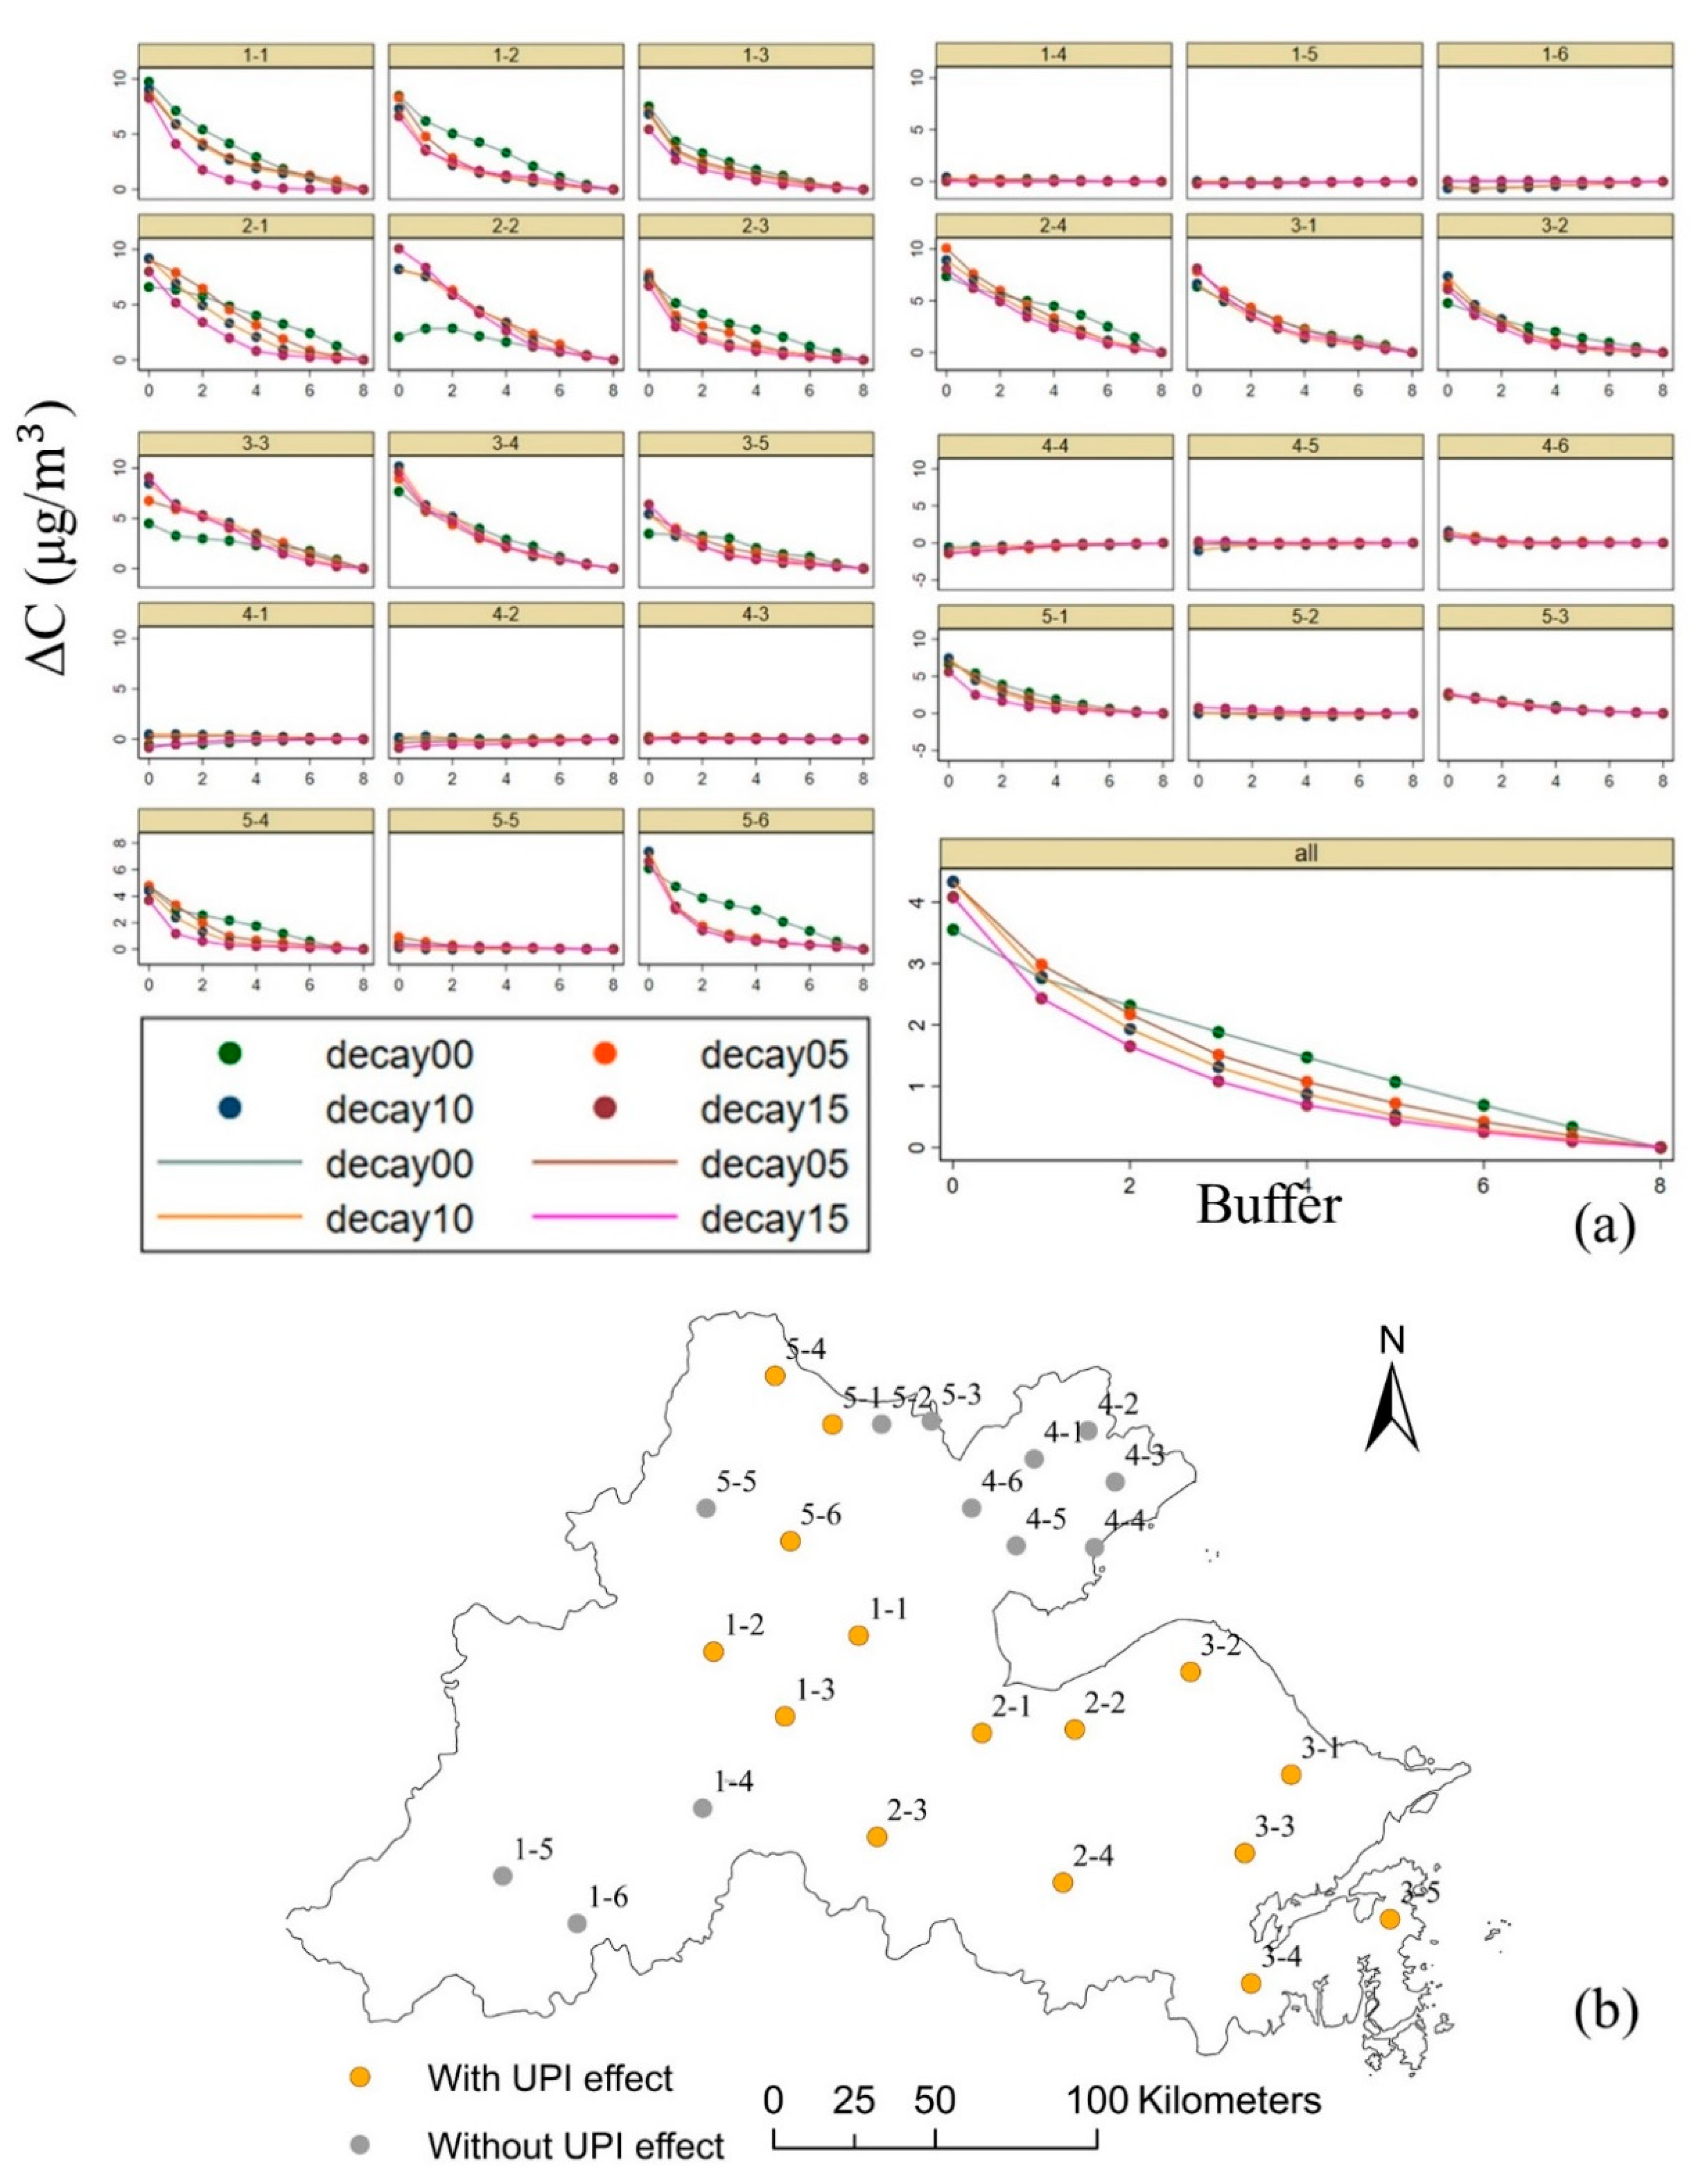
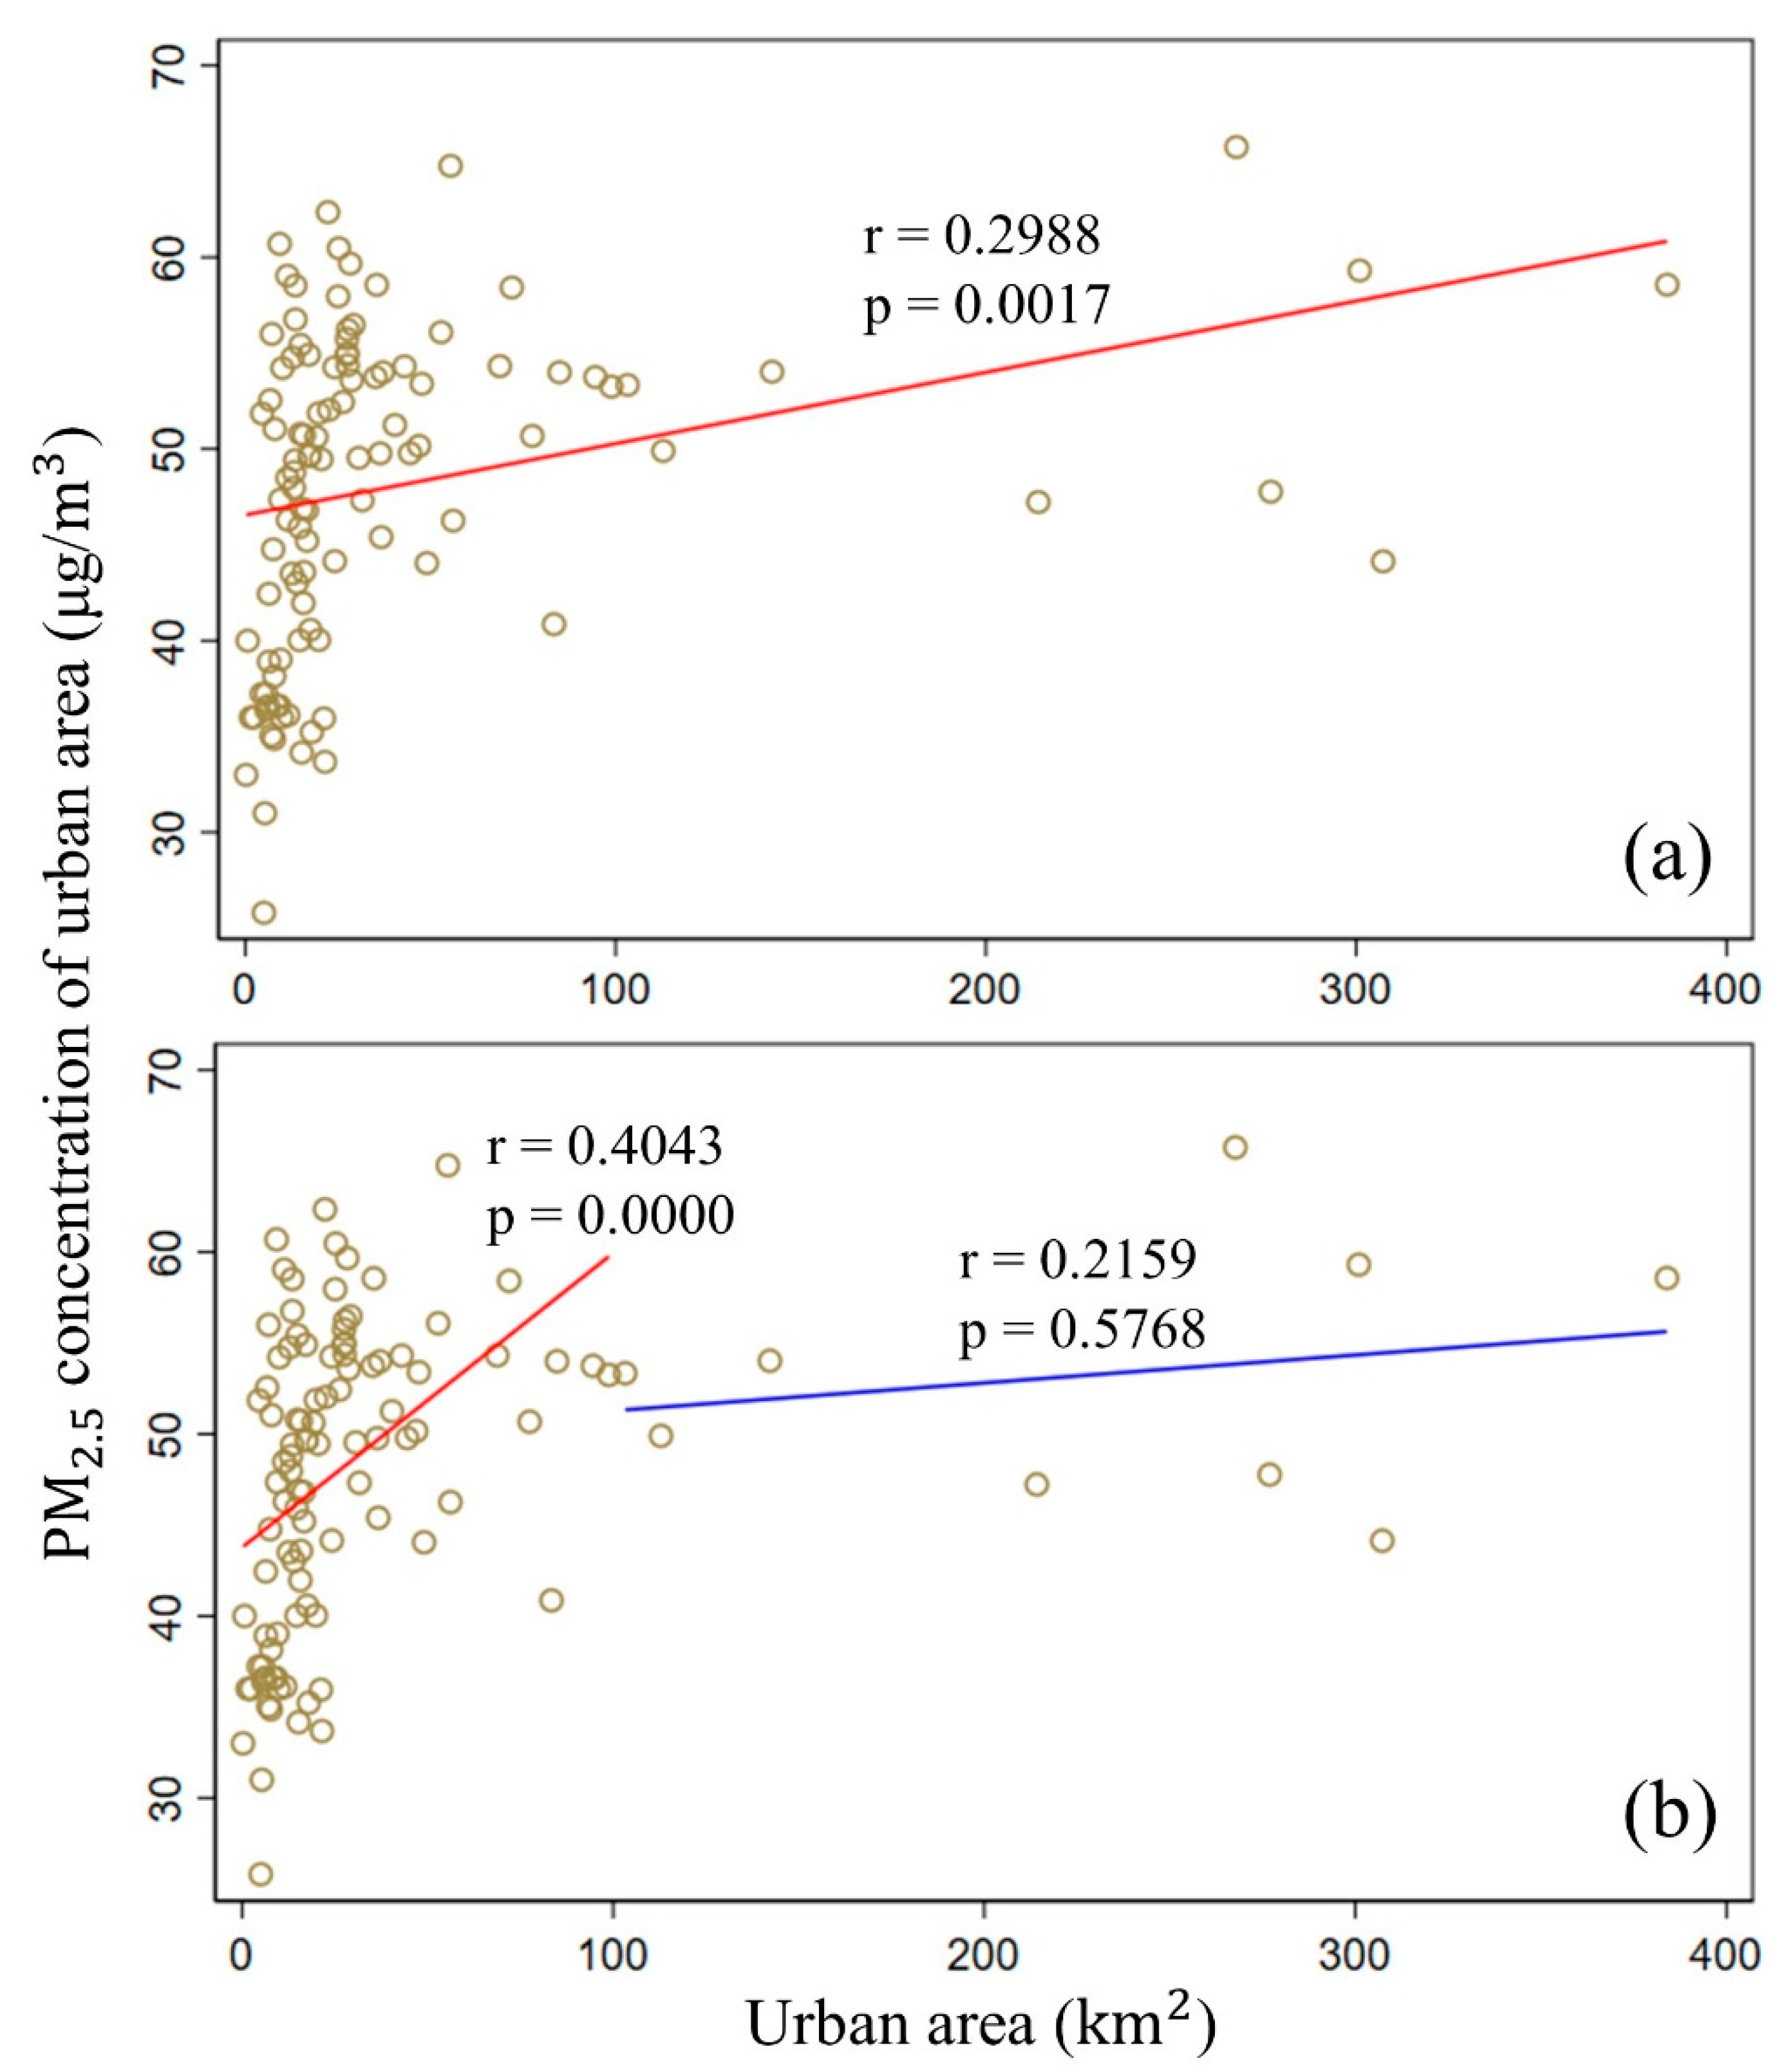
4.2. PM2.5 Concentration in the Urban Areas and Buffer Zones
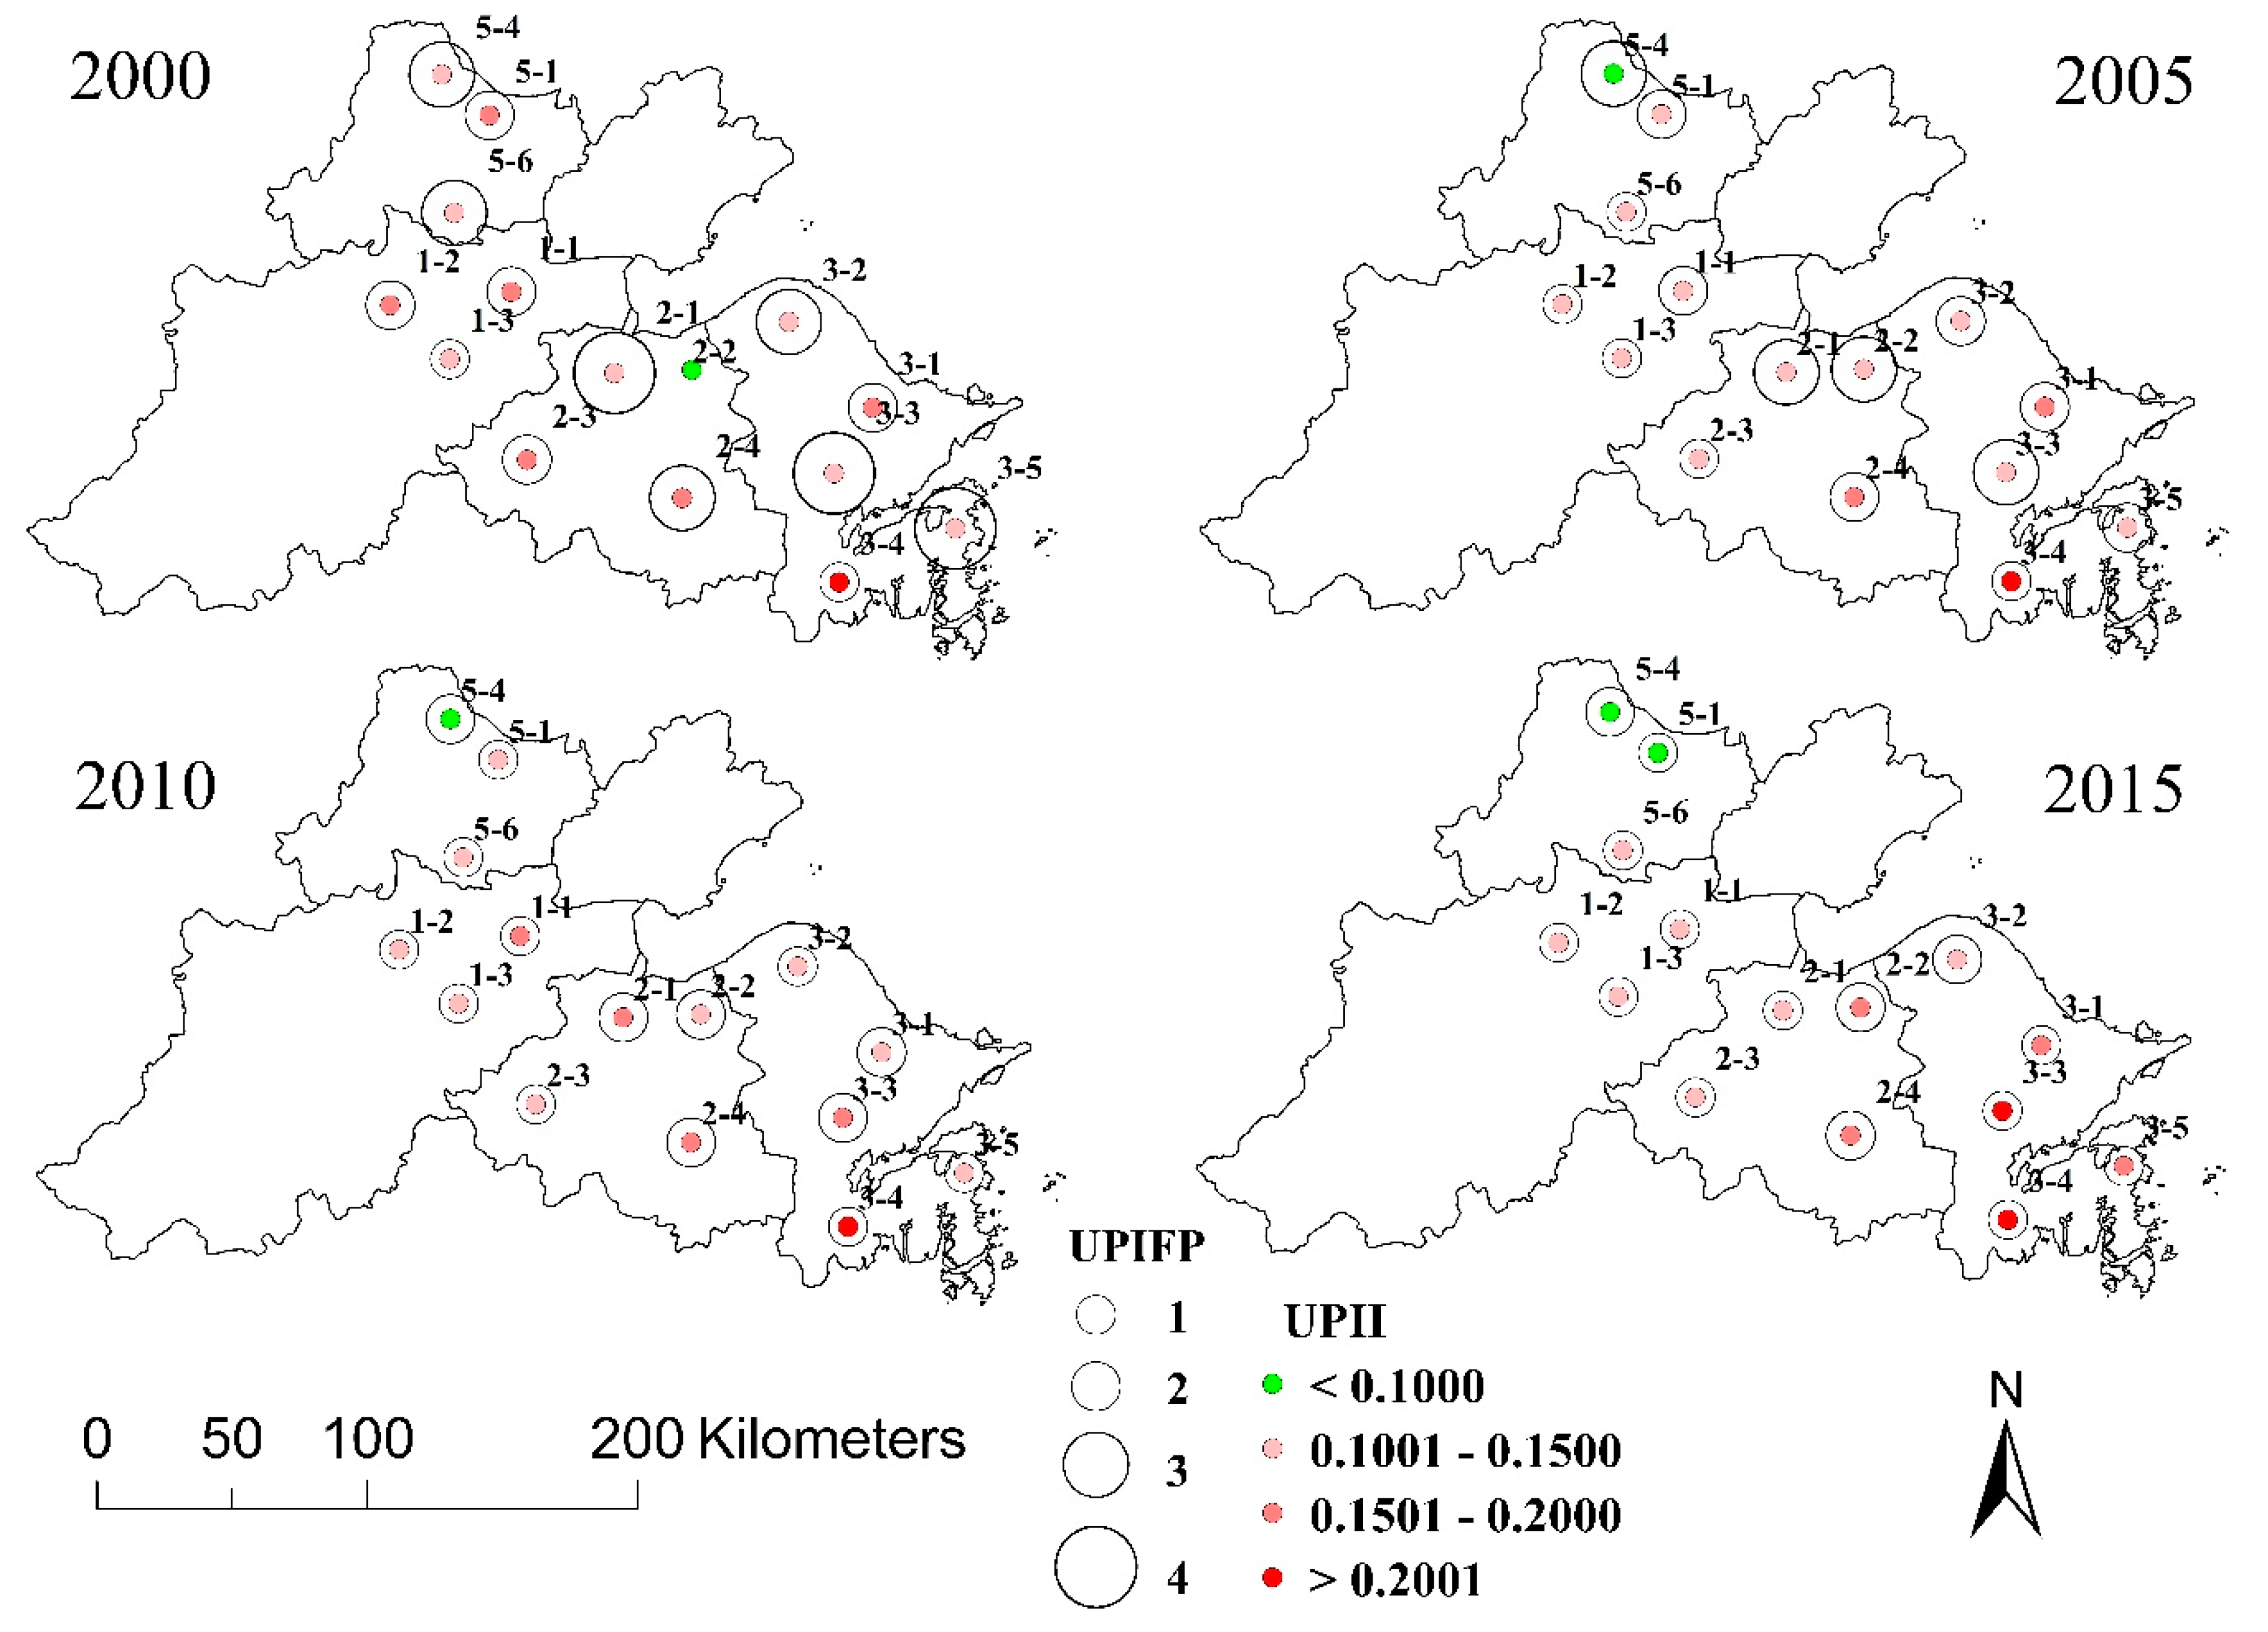
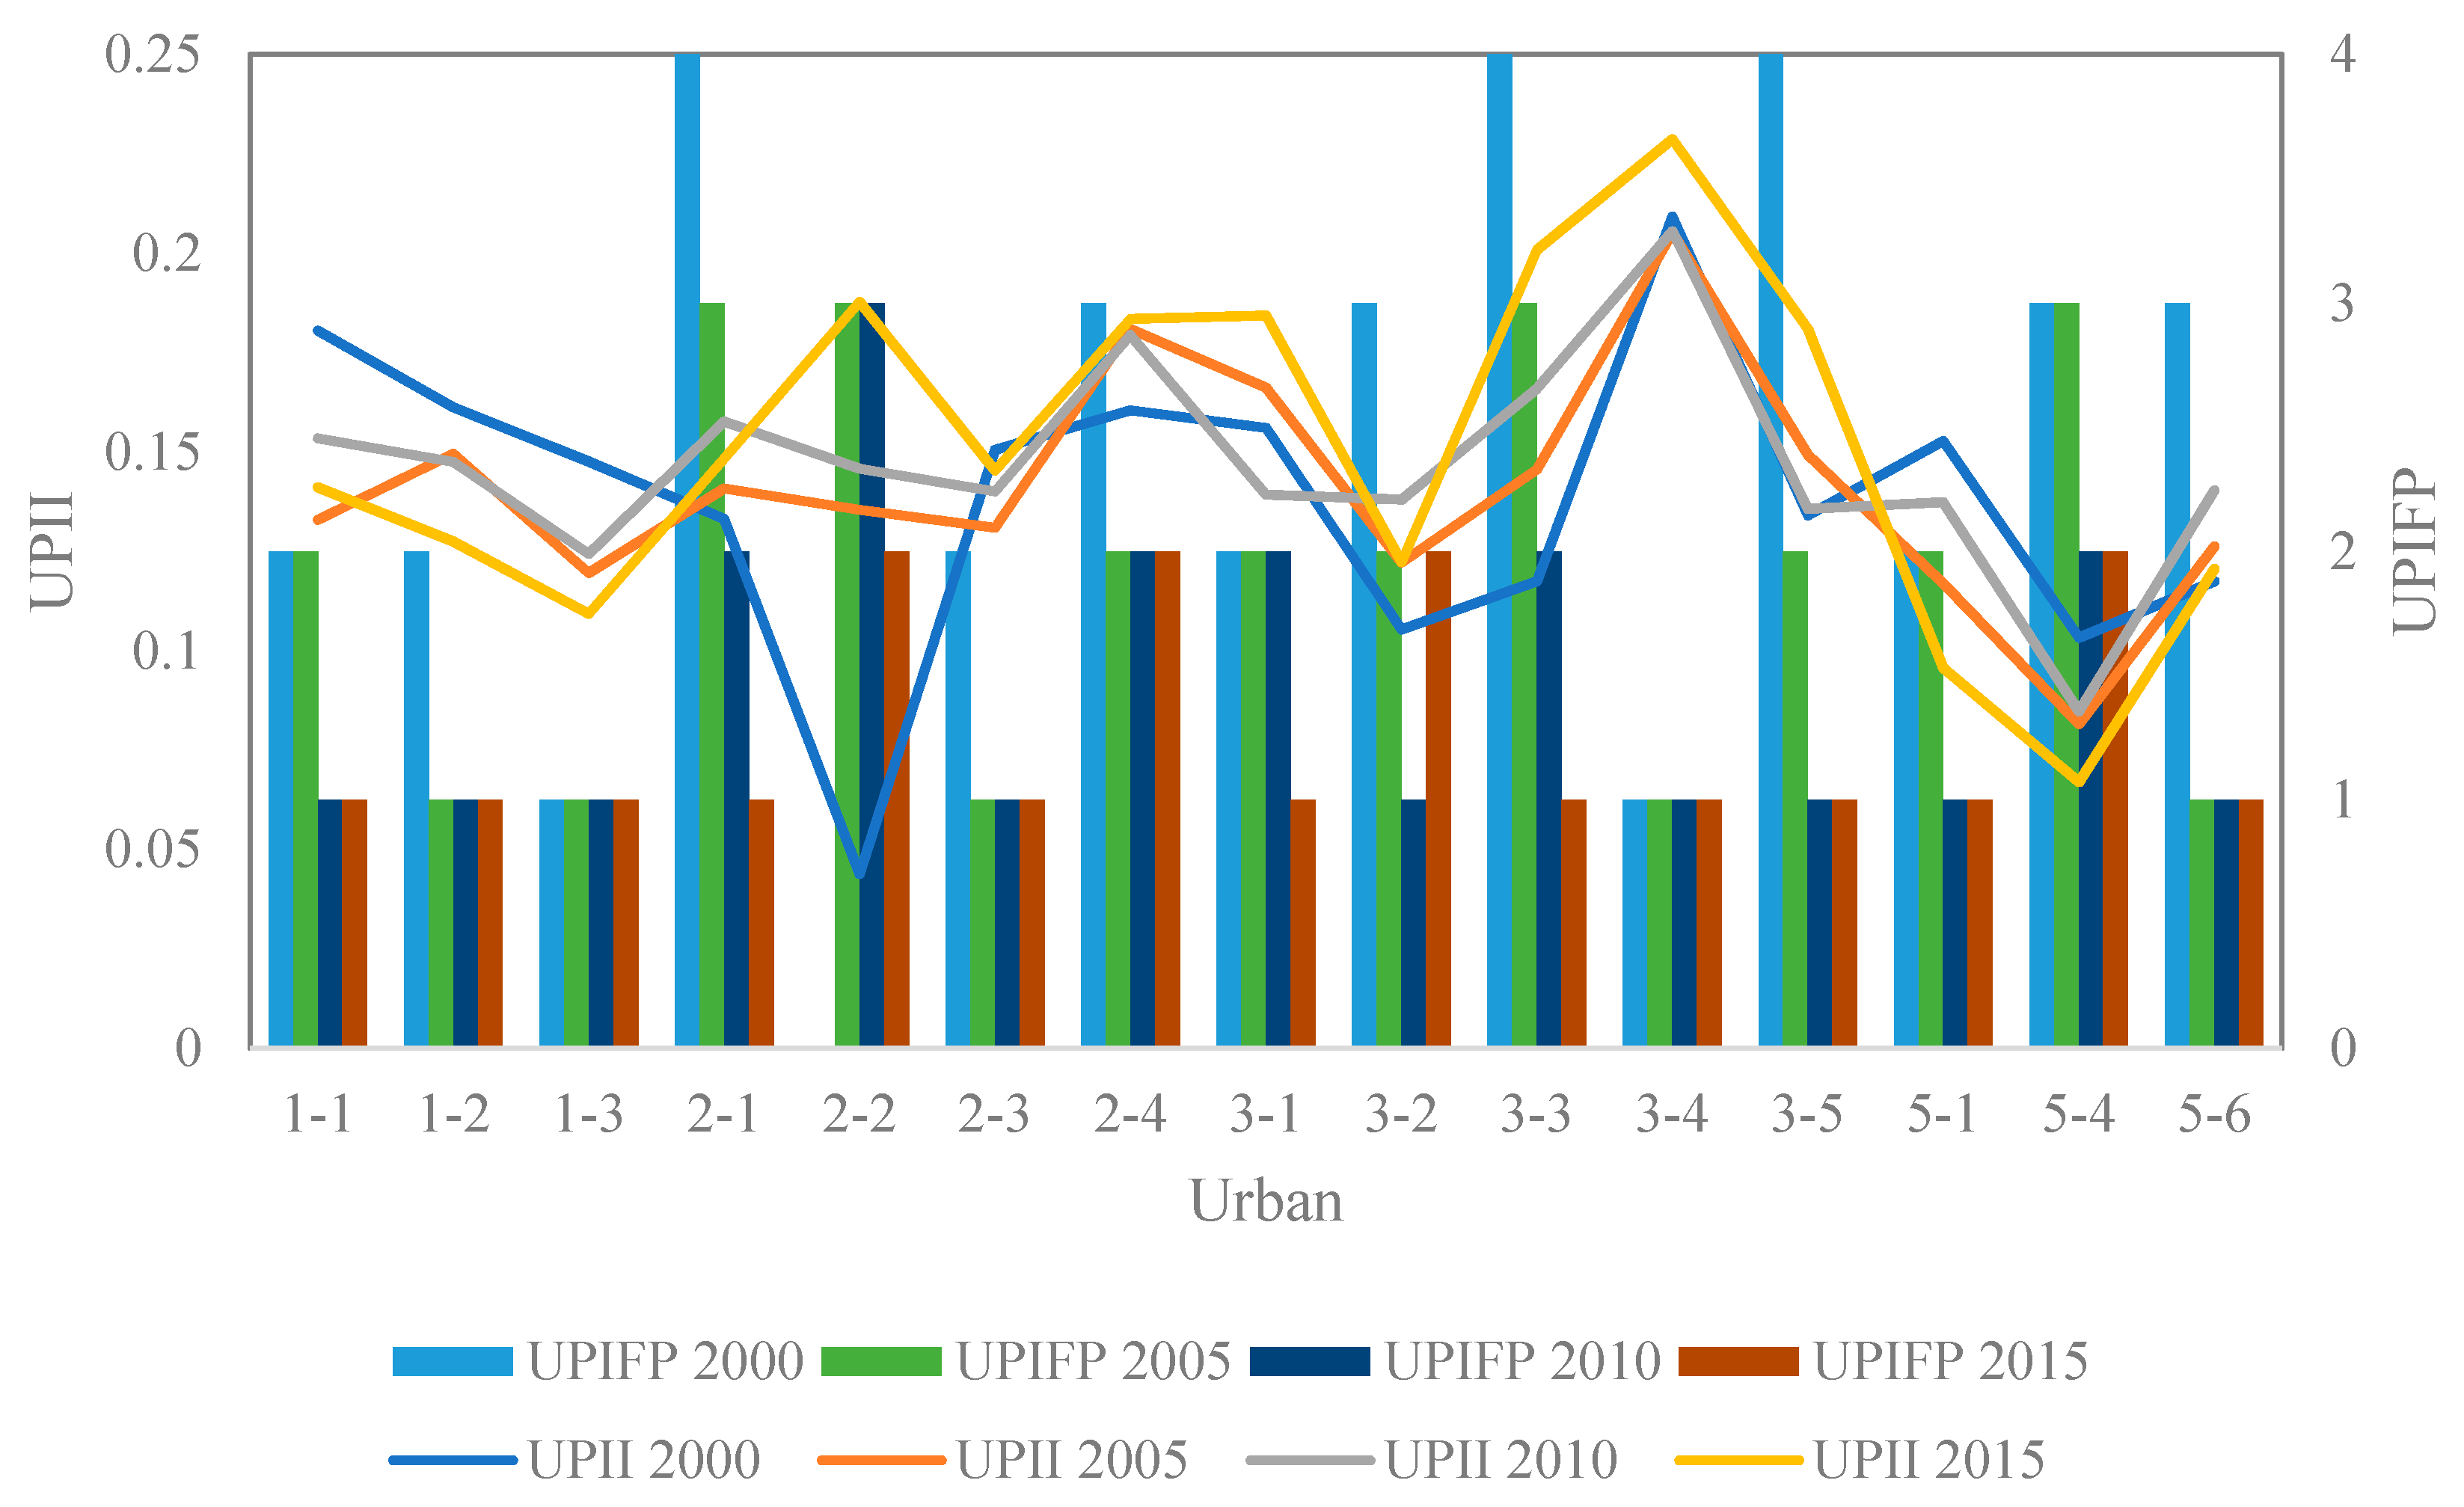
4.3. Spatiotemporal Dynamics of UPII and UPIFP
5. Discussion
5.1. Emissions
5.2. Dispersion and Deposition
5.3. Main Findings
6. Conclusions
- Every urban area in the Hangzhou Bay area experienced rapid expansion from 2000 to 2015. For most of the urban areas, 2000–2005 was the period with the most rapid expansion, and several urban areas even attained growth rates above 300%. Although the form and magnitude of urban expansion varied, single-core expansion occurred in most urban areas.
- By comparison, the PM2.5 concentrations in the urban areas in 2000 were considerably lower than that in 2005, 2010, and 2015. In addition, from the perspective of the spatial distribution, spatial heterogeneity of the PM2.5 concentrations were observed in the Hangzhou Bay area. Overall, the PM2.5 concentration in the urban area had a positive correlation with its area.
- More than half of the urban areas exhibited the UPI effect in the Hangzhou Bay area during this period. Most urban areas with the UPI effect had a relatively high and stable UPII as well. In contrast to the UPII, the UPIFP values showed a downward trend along with urban expansion.
- The urban areas could be divided into three categories according to the terrain, i.e., plain areas, hilly areas, and the junction of plains and hills, and the probability of the UPI effect for the different categories varied notably.
Author Contributions
Funding
Conflicts of Interest
References
- Angel, S.; Parent, J.; Civco, D.L.; Blei, A.; Potere, D. The dimensions of global urban expansion: Estimates and projections for all countries, 2000–2050. Progr. Plan. 2011, 75, 53–107. [Google Scholar] [CrossRef]
- Zhou, D.; Zhao, S.; Zhang, L.; Sun, G.; Liu, Y. The footprint of urban heat island effect in China. Sci. Rep. 2015, 5, 1–11. [Google Scholar] [CrossRef]
- Rajé, F.; Tight, M.; Pope, F.D. Traffic pollution: A search for solutions for a city like Nairobi. Cities 2018, 82, 100–107. [Google Scholar] [CrossRef]
- Li, X.; Zhou, Y.; Asrar, G.R.; Imhoff, M.; Li, X. The surface urban heat island response to urban expansion: A panel analysis for the conterminous United States. Sci. Total Environ. 2017, 60–606, 426–435. [Google Scholar] [CrossRef] [PubMed]
- Maheshwari, B.; Pinto, U.; Akbar, S.; Fahey, P. Is urbanisation also the culprit of climate change?–Evidence from Australian cities. Urban Clim. 2020, 31, 100581. [Google Scholar] [CrossRef]
- Loftus, C.; Yost, M.; Sampson, P.; Arias, G.; Torres, E.; Vasquez, V.B.; Bhatti, P.; Karr, C. Regional PM2.5 and asthma morbidity in an agricultural community: A panel study. Environ. Res. 2015, 136, 505–512. [Google Scholar] [CrossRef] [Green Version]
- Gong, T.; Sun, Z.; Zhang, X.; Zhang, Y.; Wang, S.; Han, L.; Zhao, D.; Ding, D.; Zheng, C. Associations of black carbon and PM2.5 with daily cardiovascular mortality in Beijing, China. Atmos. Environ. 2019, 214, 116876. [Google Scholar] [CrossRef]
- Tai, A.P.K.; Mickley, L.J.; Jacob, D.J. Correlations between fine particulate matter (PM2.5) and meteorological variables in the United States: Implications for the sensitivity of PM2.5 to climate change. Atmos. Environ. 2010, 44, 3976–3984. [Google Scholar] [CrossRef]
- Liu, W.; Guo, G.; Chen, F.; Chen, Y. Meteorological pattern analysis assisted daily PM2.5 grades prediction using SVM optimized by PSO algorithm. Atmos. Pollut. Res. 2019, 10, 1482–1491. [Google Scholar] [CrossRef]
- Wang, S.; Zhou, C.; Wang, Z.; Feng, K.; Hubacek, K. The characteristics and drivers of fine particulate matter (PM2.5) distribution in China. J. Clean Prod. 2017, 142, 1800–1809. [Google Scholar] [CrossRef]
- Xu, G.; Ren, X.; Xiong, K.; Li, L.; Bi, X.; Wu, Q. Analysis of the driving factors of PM2.5 concentration in the air: A case study of the Yangtze River Delta, China. Ecol. Indic. 2020, 110, 105889. [Google Scholar] [CrossRef]
- Seto, K.C.; Fragkias, M.; Güneralp, B.; Reilly, M.K. A meta-analysis of global urban land expansion. PLoS ONE 2011, 6, e23777. [Google Scholar] [CrossRef] [PubMed]
- Sahana, M.; Hong, H.; Sajjad, H. Analyzing urban spatial patterns and trend of urban growth using urban sprawl matrix: A study on Kolkata urban agglomeration, India. Sci. Total Environ. 2018, 628–629, 1557–1566. [Google Scholar] [CrossRef] [PubMed]
- Yue, W.; Liu, Y.; Fan, P. Measuring urban sprawl and its drivers in large Chinese cities: The case of Hangzhou. Land Use Pol. 2013, 31, 358–370. [Google Scholar] [CrossRef]
- Jiao, L.; Mao, L.; Liu, Y. Multi-order Landscape Expansion Index: Characterizing urban expansion dynamics. Landsc. Urban Plan. 2015, 137, 30–39. [Google Scholar] [CrossRef]
- Grimm, N.B.; Faeth, S.H.; Golubiewski, N.E.; Redman, C.L.; Wu, J.; Bai, X.; Briggs, J.M. Global Change and the Ecology of Cities. Science 2008, 319, 756–760. [Google Scholar] [CrossRef] [Green Version]
- Huang, X.; Cai, Y.; Li, J. Evidence of the mitigated urban particulate matter island (UPI) effect in China during 2000–2015. Sci. Total Environ. 2019, 660, 1327–1337. [Google Scholar] [CrossRef]
- Gupta, P.; Christopher, S.A. Seven year particulate matter air quality assessment from surface and satellite measurements. Atmos. Chem. Phys. 2008, 8, 3311–3324. [Google Scholar] [CrossRef] [Green Version]
- Lee, H.J.; Franklin, S.A.; Turkel, J.E.; Goetz, A.R.; Woods, D.W. Facilitated attentional disengagement from hair-related cues among individuals diagnosed with trichotillomania: An investigation based on the exogenous cueing paradigm. J. Obsessive-Compuls. Relat. Disord. 2012, 1, 8–15. [Google Scholar] [CrossRef]
- Chudnovsky, A.; Lyapustin, A.; Wang, Y.; Tang, C.; Schwartz, J.; Koutrakis, P. High resolution aerosol data from MODIS satellite for urban air quality studies. Cent. Eur. J. Geosci. 2014, 6, 17–26. [Google Scholar] [CrossRef] [Green Version]
- Chelani, A.B. Estimating PM2.5 concentration from satellite derived aerosol optical depth and meteorological variables using a combination model. Atmos. Pollut. Res. 2019, 10, 847–857. [Google Scholar] [CrossRef]
- Yeganeh, B.; Hewson, M.G.; Clifford, S.; Knibbs, L.D.; Morawska, L. A satellite-based model for estimating PM2.5 concentration in a sparsely populated environment using soft computing techniques. Environ. Modell. Softw. 2017, 88, 84–92. [Google Scholar] [CrossRef] [Green Version]
- He, Q.; Huang, B. Satellite-based high-resolution PM2.5 estimation over the Beijing-Tianjin-Hebei region of China using an improved geographically and temporally weighted regression model. Environ. Pollut. 2018, 236, 1027–1037. [Google Scholar] [CrossRef] [PubMed]
- Gui, K.; Che, H.; Wang, Y.; Wang, H.; Zhang, L.; Zhao, H.; Zheng, Y.; Sun, T.; Zhang, X. Satellite-derived PM2.5 concentration trends over Eastern China from 1998 to 2016: Relationships to emissions and meteorological parameters. Environ. Pollut. 2019, 247, 1125–1133. [Google Scholar] [CrossRef] [PubMed]
- Xiao, R.; Lin, M.; Fei, X.; Li, Y.; Zhang, Z.; Meng, Q. Exploring the interactive coercing relationship between urbanization and ecosystem service value in the Shanghai–Hangzhou Bay Metropolitan Region. J. Clean. Prod. 2020, 253, 119803. [Google Scholar] [CrossRef]
- Van Donkelaar, A.; Martin, R.V.; Brauer, M.; Boys, B.L. Use of satellite observations for long-term exposure assessment of global concentrations of fine particulate matter. Environ. Health Perspect. 2015, 123, 135–143. [Google Scholar] [CrossRef] [Green Version]
- Van Donkelaar, A.; Martin, R.V.; Li, C.; Burnett, R.T. Regional Estimates of Chemical Composition of Fine Particulate Matter Using a Combined Geoscience-Statistical Method with Information from Satellites, Models, and Monitors. Environ. Sci. Technol. 2019, 53, 2595–2611. [Google Scholar] [CrossRef] [Green Version]
- Van Donkelaar, A.; Martin, R.V.; Brauer, M.; Hsu, N.C.; Kahn, R.A.; Levy, R.C.; Lyapustin, A.; Sayer, A.M.; Winker, D.M. Global Estimates of Fine Particulate Matter using a Combined Geophysical-Statistical Method with Information from Satellites, Models, and Monitors. Environ. Sci. Technol. 2016, 50, 3762–3772. [Google Scholar] [CrossRef]
- Liu, Y.; Wu, J.; Yu, D.; Ma, Q. The relationship between urban form and air pollution depends on seasonality and city size. Environ. Sci. Pollut. Res. 2018, 25, 15554–15567. [Google Scholar] [CrossRef]
- Zhou, J.; Xing, Z.; Deng, J.; Du, K. Characterizing and sourcing ambient PM2.5 over key emission regions in China I: Water-soluble ions and carbonaceous fractions. Atmos. Environ. 2016, 135, 20–30. [Google Scholar] [CrossRef]
- Li, G.; Fang, C.; Wang, S.; Sun, S. The Effect of Economic Growth, Urbanization, and Industrialization on Fine Particulate Matter (PM2.5) Concentrations in China. Environ. Sci. Technol. 2016, 50, 11452–11459. [Google Scholar] [CrossRef] [PubMed]
- Łowicki, D. Landscape pattern as an indicator of urban air pollution of particulate matter in Poland. Ecol. Indic. 2019, 97, 17–24. [Google Scholar] [CrossRef]
- Zhang, R.; Wang, G.; Guo, S.; Zamora, M.L.; Ying, Q.; Lin, Y.; Wang, W.; Hu, M.; Wang, Y. Formation of Urban Fine Particulate. Matter. Chem. Rev. 2015, 115, 3803–3855. [Google Scholar] [CrossRef] [PubMed]
- Grossman, G.M.; Krueger, A.B. Economic Growth and the Environment. Quat. J. Econ. 1995, 110, 353–377. [Google Scholar] [CrossRef] [Green Version]
- Shen, Y.; Lisa Ahlers, A. Local environmental governance innovation in China: Staging ‘triangular dialogues’ for industrial air pollution control. J. Chin. Gov. 2018, 3, 351–369. [Google Scholar] [CrossRef]
- Li, F.; Zhou, T. Effects of urban form on air quality in China: An analysis based on the spatial autoregressive model. Cities 2019, 89, 130–140. [Google Scholar] [CrossRef]
- Xu, L.; Batterman, S.; Chen, F.; Li, J.; Zhong, X.; Feng, Y.; Rao, Q.; Chen, F. Spatiotemporal characteristics of PM2.5 and PM10 at urban and corresponding background sites in 23 cities in China. Sci. Total Environ. 2017, 599–600, 2074–2084. [Google Scholar] [CrossRef]
- Han, L.; Zhou, W.; Li, W.; Li, L. Impact of urbanization level on urban air quality: A case of fine particles (PM2.5) in Chinese cities. Environ. Pollut. 2014, 194, 163–170. [Google Scholar] [CrossRef]
- Liu, C.; Henderson, B.H.; Wang, D.; Yang, X.; Peng, Z. A land use regression application into assessing spatial variation of intra-urban fine particulate matter (PM2.5) and nitrogen dioxide (NO2) concentrations in City of Shanghai, China. Sci. Total Environ. 2016, 565, 607–615. [Google Scholar] [CrossRef]
- Zhao, X.; Zhang, X.; Xu, X.; Xu, J.; Meng, W.; Pu, W. Seasonal and diurnal variations of ambient PM2.5 concentration in urban and rural environments in Beijing. Atmos. Environ. 2009, 43, 2893–2900. [Google Scholar] [CrossRef]
- Nowak, D.J.; Hirabayashi, S.; Bodine, A.; Greenfield, E. Tree and forest effects on air quality and human health in the United States. Environ. Pollut. 2014, 193, 119–129. [Google Scholar] [CrossRef] [PubMed] [Green Version]
- Lin, Y.; Yuan, X.; Zhai, T.; Wang, J. Effects of land-use patterns on PM2.5 in China’s developed coastal region: Exploration and solutions. Sci. Total Environ. 2020, 703, 135602. [Google Scholar] [CrossRef] [PubMed]


| Data | Data Description | Source |
|---|---|---|
| PM2.5 data | Annual mean PM2.5 concentration in China with a spatial resolution of 0.01° × 0.01° in 2000–2015 | http://fizz.phys.dal.ca/~atmos/martin/ |
| Land use data | Land use data in 2000, 2005, 2010, and 2015 with a spatial resolution of 30 m × 30 m | http://nnu.geodata.cn:8008/ |
| Administrative boundaries | Shape files of prefectures and counties in Zhejiang Province | http://www.resdc.cn/ |
| Historical Google Earth images | Google Earth images of the Hangzhou Bay area in 2000, 2005, 2010, and 2015 | Download the software from https://www.google.com/earth/versions/#earth-pro and install it, then follow these instructions: https://support.google.com/earth/answer/148094?hl=en/ |
| Digital elevation model (DEM) data | ASTER (Advanced Spaceborne Thermal Emission and Reflection Radiometer) GDEM (Global Digital Elevation Model) data with a spatial resolution of 30 m × 30 m | https://lpdaac.usgs.gov/ |
© 2020 by the authors. Licensee MDPI, Basel, Switzerland. This article is an open access article distributed under the terms and conditions of the Creative Commons Attribution (CC BY) license (http://creativecommons.org/licenses/by/4.0/).
Share and Cite
Cao, Y.; Fang, X.; Wang, J.; Li, G.; Cao, Y.; Li, Y. Measuring the Urban Particulate Matter Island Effect with Rapid Urban Expansion. Int. J. Environ. Res. Public Health 2020, 17, 5535. https://0-doi-org.brum.beds.ac.uk/10.3390/ijerph17155535
Cao Y, Fang X, Wang J, Li G, Cao Y, Li Y. Measuring the Urban Particulate Matter Island Effect with Rapid Urban Expansion. International Journal of Environmental Research and Public Health. 2020; 17(15):5535. https://0-doi-org.brum.beds.ac.uk/10.3390/ijerph17155535
Chicago/Turabian StyleCao, Yu, Xiaoqian Fang, Jiayi Wang, Guoyu Li, Yu Cao, and Yan Li. 2020. "Measuring the Urban Particulate Matter Island Effect with Rapid Urban Expansion" International Journal of Environmental Research and Public Health 17, no. 15: 5535. https://0-doi-org.brum.beds.ac.uk/10.3390/ijerph17155535