Figure 1.
The defined Cartesian system for veer-off modeling in
Table 1.
Figure 1.
The defined Cartesian system for veer-off modeling in
Table 1.
Figure 2.
Risk modeling process in ACRP Report 3.
Figure 2.
Risk modeling process in ACRP Report 3.
Figure 3.
Research flow chart.
Figure 3.
Research flow chart.
Figure 4.
Runway Safety Area (RSA).
Figure 4.
Runway Safety Area (RSA).
Figure 5.
X-Y origin for LDOR accidents.
Figure 5.
X-Y origin for LDOR accidents.
Figure 6.
Y origin for LDVO accidents.
Figure 6.
Y origin for LDVO accidents.
Figure 7.
OR incidents model.
Figure 7.
OR incidents model.
Figure 8.
VO incidents model.
Figure 8.
VO incidents model.
Figure 9.
Modeling approach for OR accidents consequences.
Figure 9.
Modeling approach for OR accidents consequences.
Figure 10.
Modeling consequences.
Figure 10.
Modeling consequences.
Figure 11.
The impact of obstacle lateral location in accident consequences.
Figure 11.
The impact of obstacle lateral location in accident consequences.
Figure 12.
Modeling the possibility which an aircraft collides with an obstacle with severe consequences.
Figure 12.
Modeling the possibility which an aircraft collides with an obstacle with severe consequences.
Figure 13.
Initial forms for collecting and recording accidents, aircraft, airport, and weather conditions information.
Figure 13.
Initial forms for collecting and recording accidents, aircraft, airport, and weather conditions information.
Figure 14.
Mehrabad International Airport-Runways plan.
Figure 14.
Mehrabad International Airport-Runways plan.
Figure 15.
Hasheminejad International Airport-Runways plan.
Figure 15.
Hasheminejad International Airport-Runways plan.
Figure 16.
The events distribution (based on the type of RE accident).
Figure 16.
The events distribution (based on the type of RE accident).
Figure 17.
LDOR distribution in the X direction (Horizontal axis shows the distance (meter) from runway end).
Figure 17.
LDOR distribution in the X direction (Horizontal axis shows the distance (meter) from runway end).
Figure 18.
x curve versus for LDOR.
Figure 18.
x curve versus for LDOR.
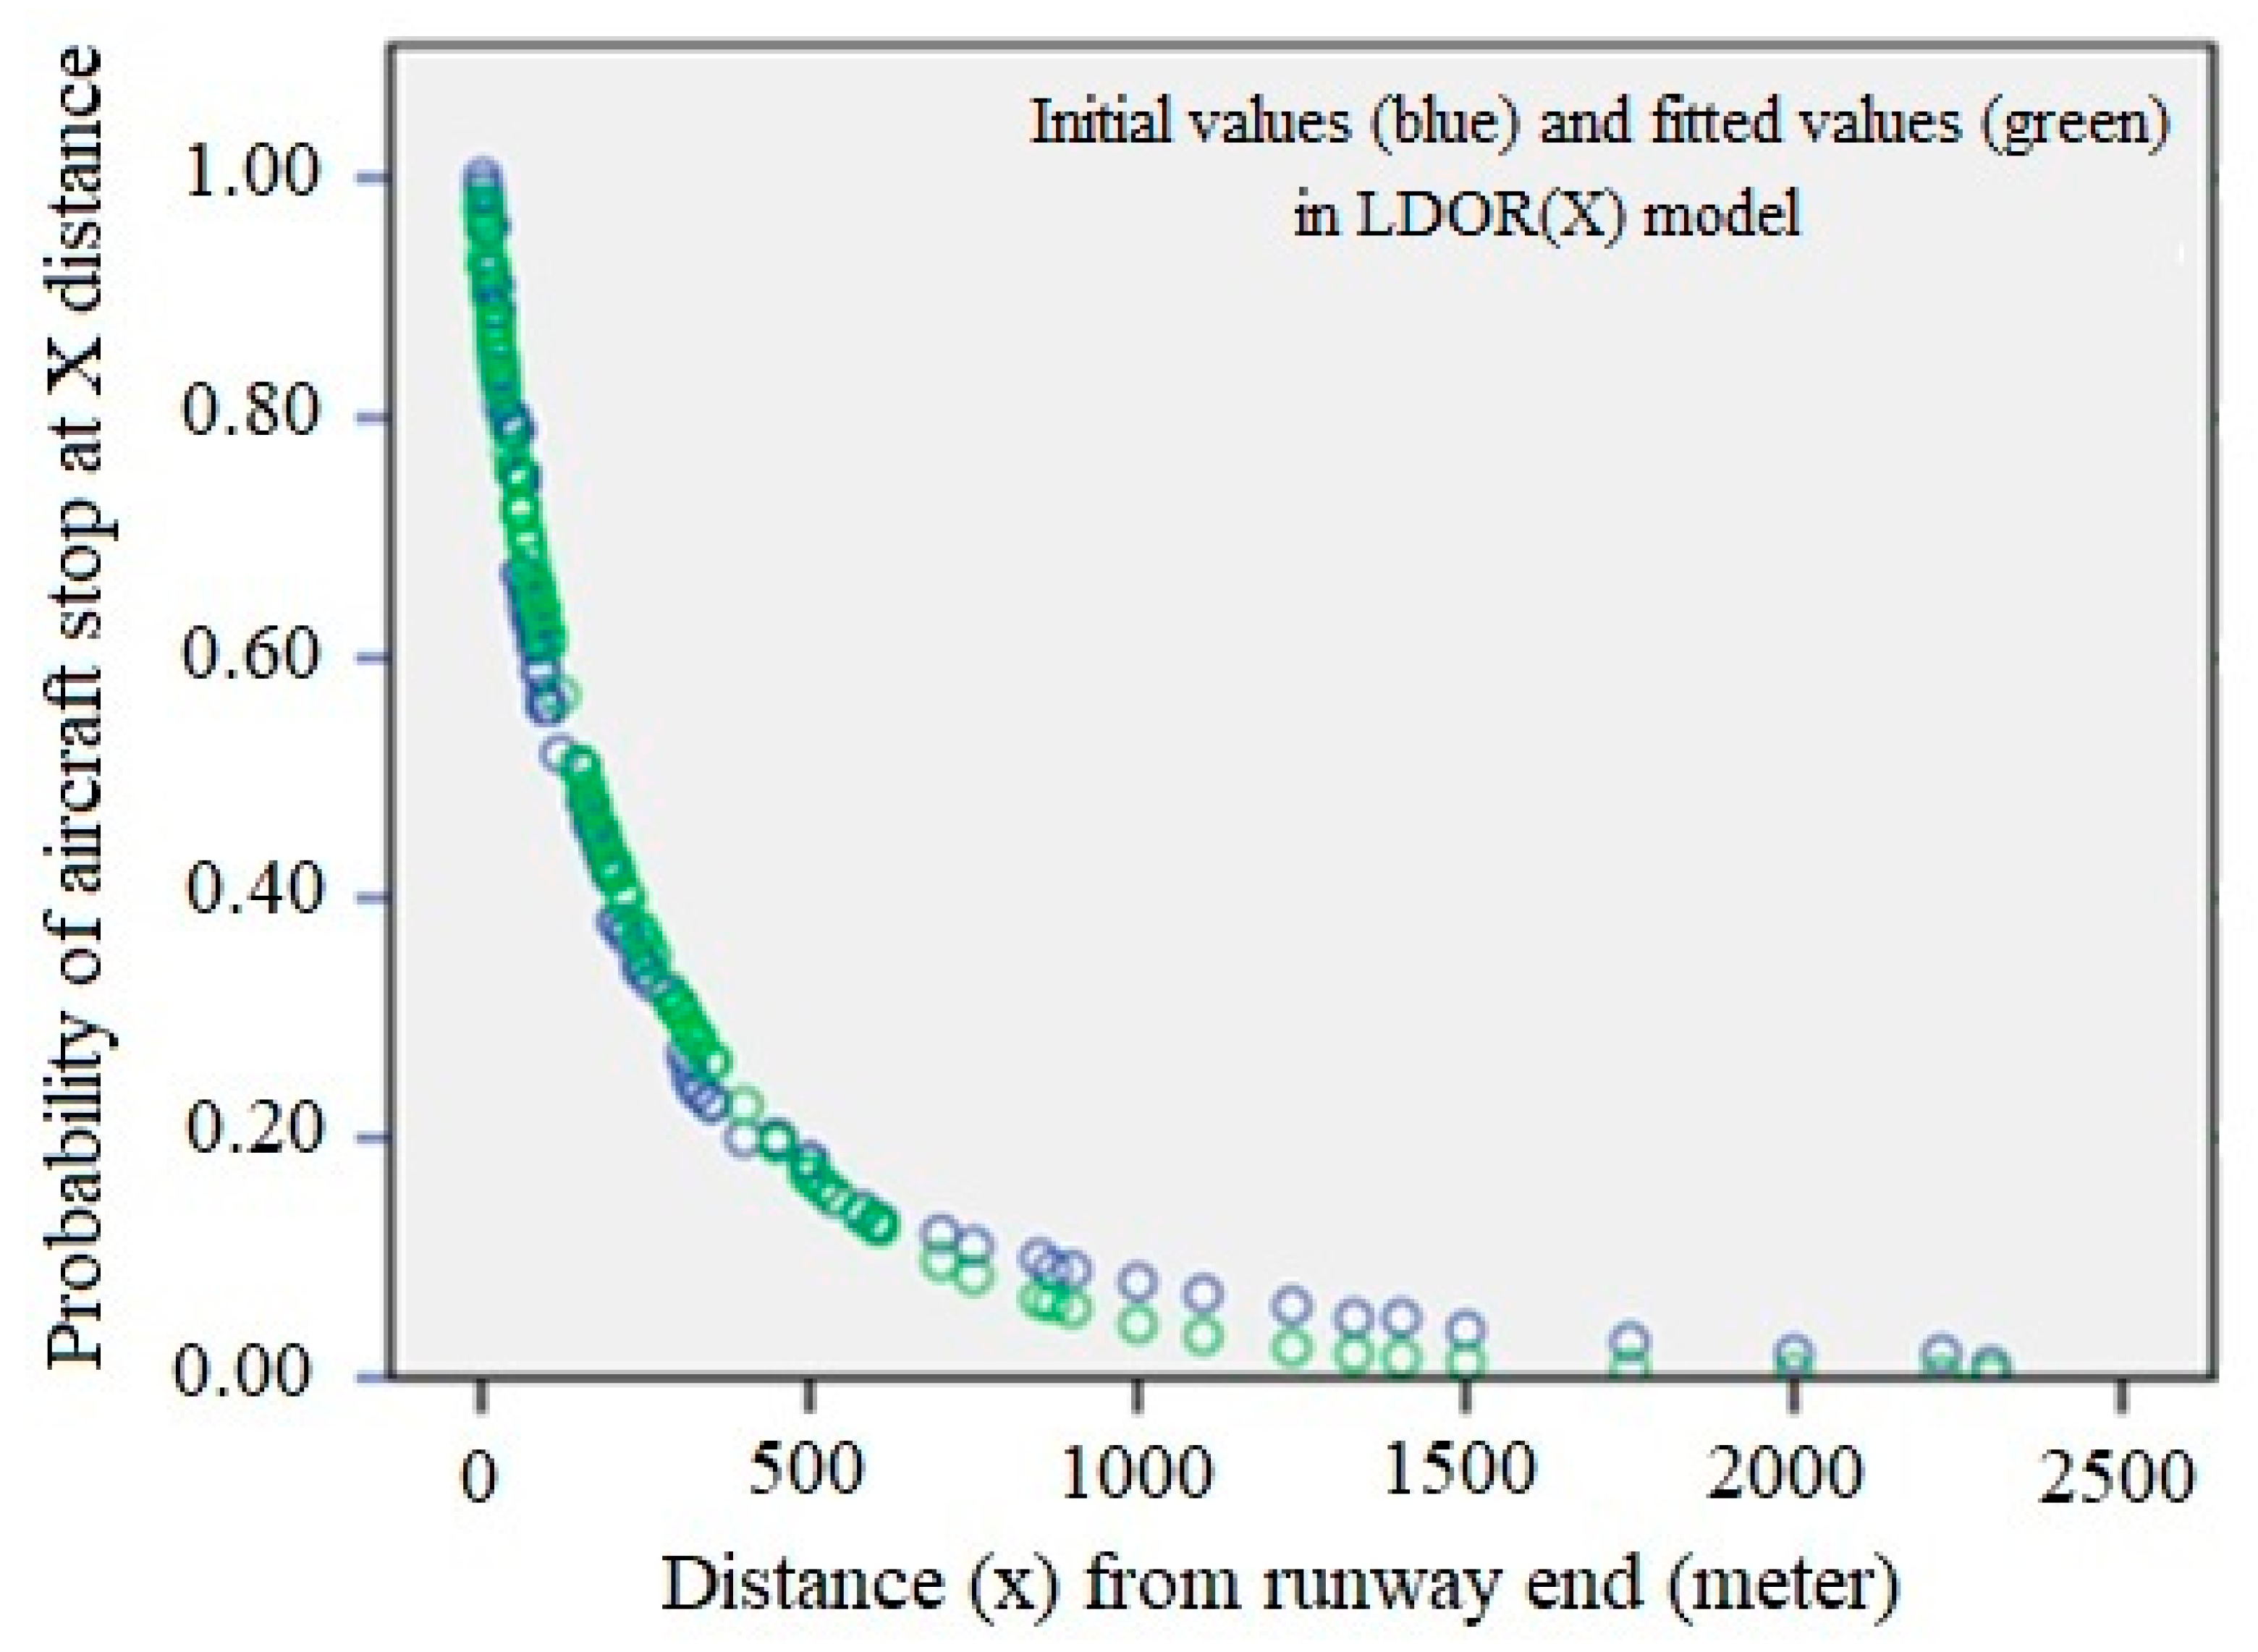
Figure 19.
LDOR longitudinal regression curve in the location accident model.
Figure 19.
LDOR longitudinal regression curve in the location accident model.
Figure 20.
x scatter plot versus the residuals for the LDOR model in the X-direction.
Figure 20.
x scatter plot versus the residuals for the LDOR model in the X-direction.
Figure 21.
LDOR distribution in the Y direction (Horizontal axis shows the distance (meter) from runway centerline).
Figure 21.
LDOR distribution in the Y direction (Horizontal axis shows the distance (meter) from runway centerline).
Figure 22.
y curve versus for LDOR.
Figure 22.
y curve versus for LDOR.
Figure 23.
LDOR transverse regression curve in the location accident model.
Figure 23.
LDOR transverse regression curve in the location accident model.
Figure 24.
y scatter plot versus the residuals for the LDOR model in the Y direction.
Figure 24.
y scatter plot versus the residuals for the LDOR model in the Y direction.
Figure 25.
Location distribution of LDVO accidents (Horizontal axis shows the distance (meter) from runway edge).
Figure 25.
Location distribution of LDVO accidents (Horizontal axis shows the distance (meter) from runway edge).
Figure 26.
y curve versus for LDVO.
Figure 26.
y curve versus for LDVO.
Figure 27.
LDVO regression curve in the location accident model.
Figure 27.
LDVO regression curve in the location accident model.
Figure 28.
y scatter plot versus the residuals for the LDVO model.
Figure 28.
y scatter plot versus the residuals for the LDVO model.
Figure 29.
Interference of Can river with Mehrabad Airport runways.
Figure 29.
Interference of Can river with Mehrabad Airport runways.
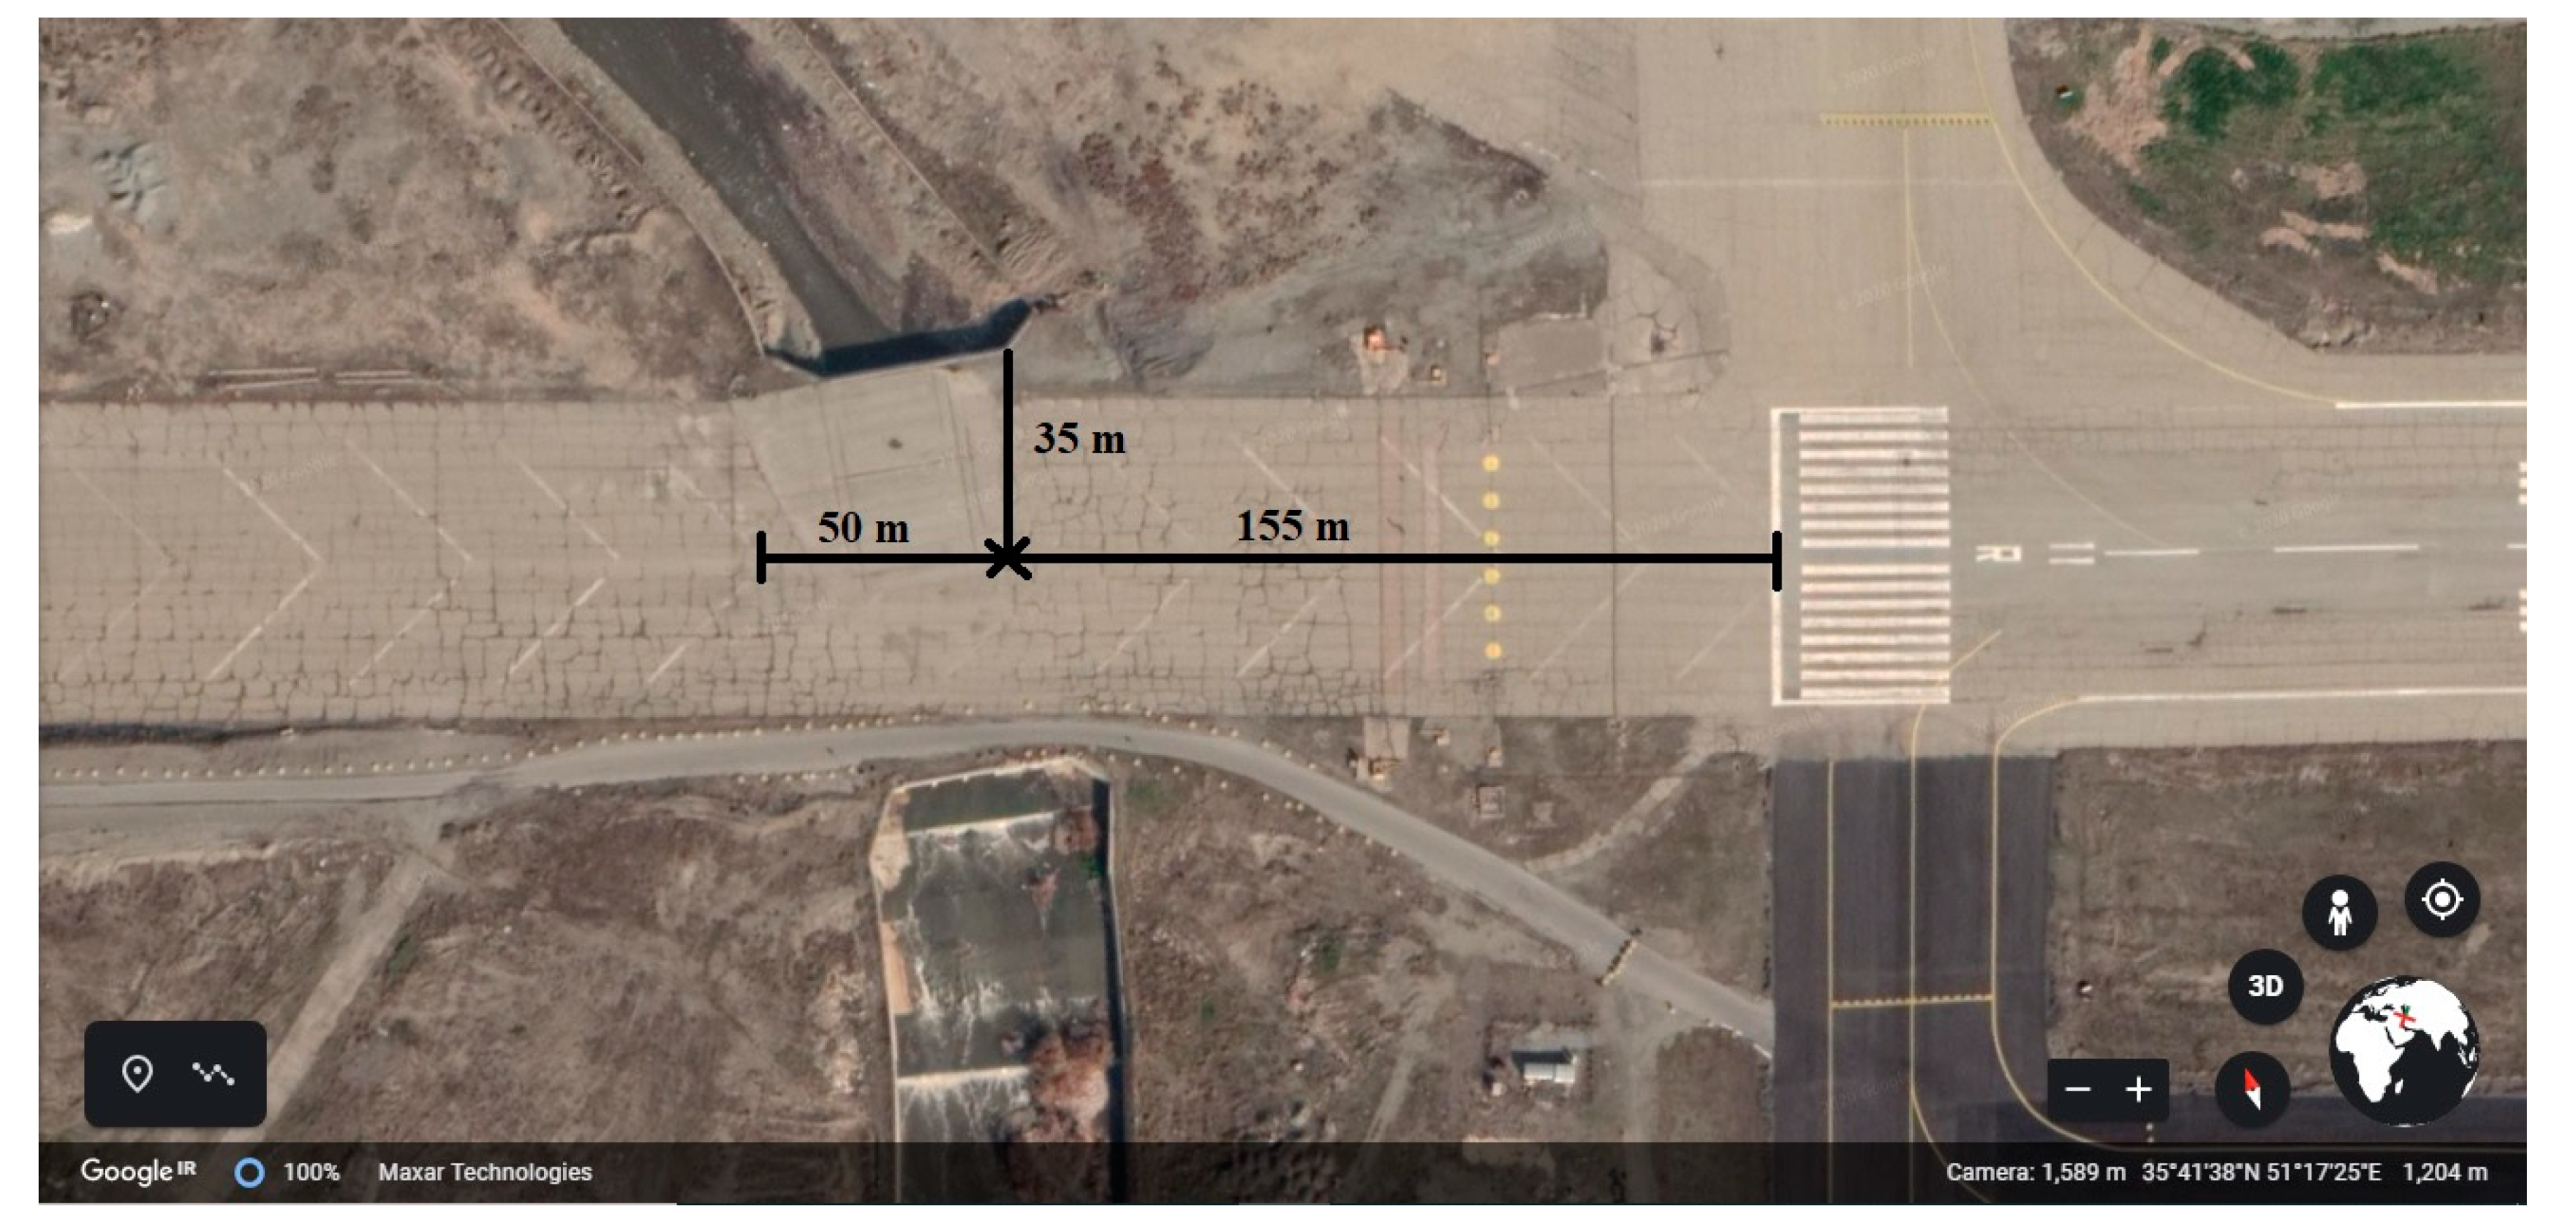
Figure 30.
The exact location of the runway 11R and the river can interference.
Figure 30.
The exact location of the runway 11R and the river can interference.
Figure 31.
Radio antenna between runways 31L and 31R in Hasheminejad airport.
Figure 31.
Radio antenna between runways 31L and 31R in Hasheminejad airport.
Figure 32.
The exact location of the Radio antenna relative to runway 31L.
Figure 32.
The exact location of the Radio antenna relative to runway 31L.
Figure 33.
Dimensions of aircraft MD-88.
Figure 33.
Dimensions of aircraft MD-88.
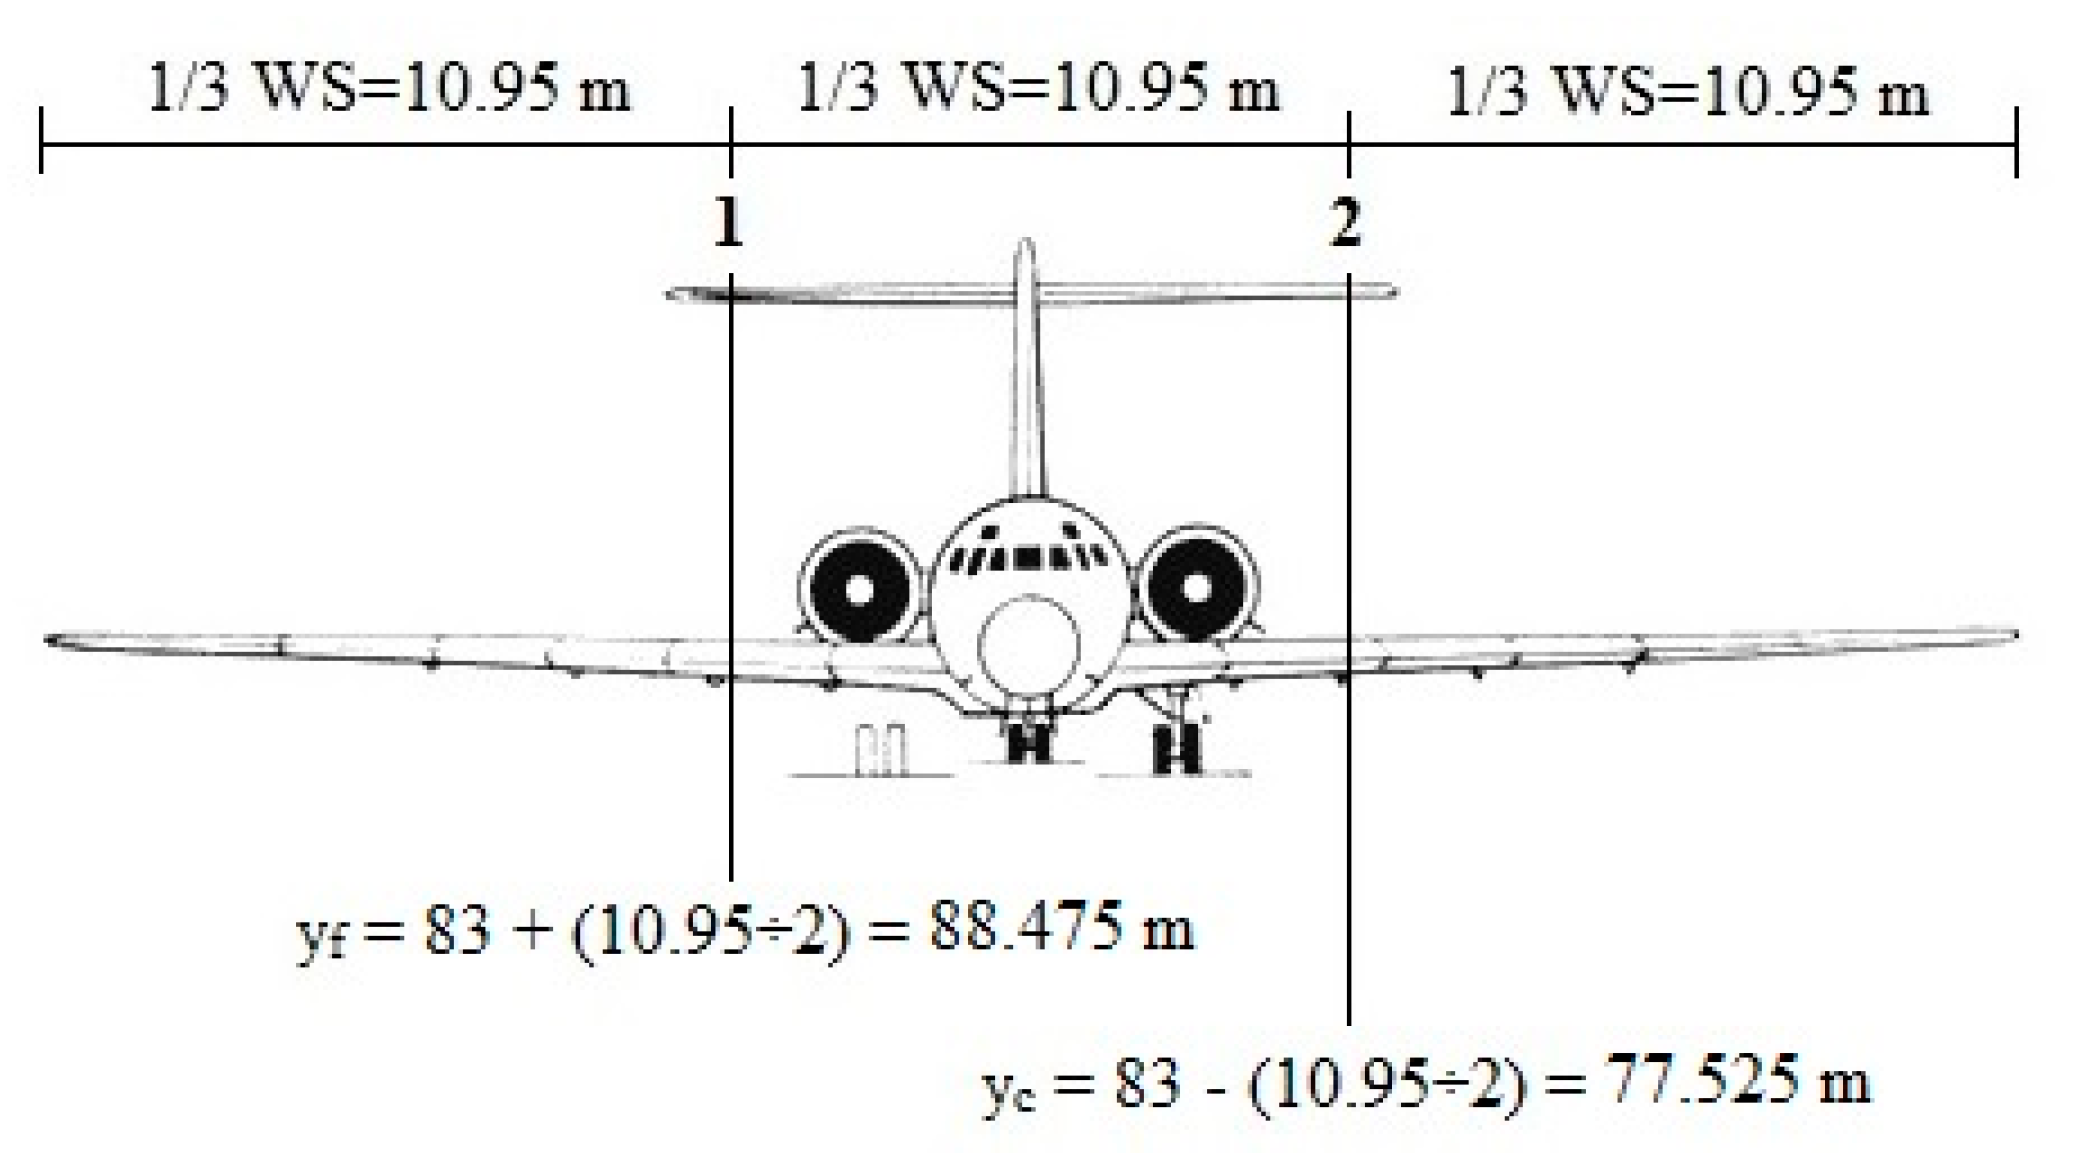
Figure 34.
Determination of critical aircraft location for consequences model. Note: Distance from radio antenna to runway axis is 83 m (See
Figure 32). Also, when the obstacle is at positions 1 and 2, distance from nose wheel to runway axis names y
f and y
c, respectively.
Figure 34.
Determination of critical aircraft location for consequences model. Note: Distance from radio antenna to runway axis is 83 m (See
Figure 32). Also, when the obstacle is at positions 1 and 2, distance from nose wheel to runway axis names y
f and y
c, respectively.
Table 1.
Veer-off modeling.
Table 1.
Veer-off modeling.
| Model | Model Application |
|---|
| valid for landings on instrument runways |
| valid for landings on non-instrument runways |
| valid for take-offs from instrument runways |
| valid for take-offs non-instrument runways |
Table 2.
The proposed methodology for risk assessment of runway landing overruns.
Table 2.
The proposed methodology for risk assessment of runway landing overruns.
| Model | Formula | Description |
|---|
| A. Modeling the probability of an overrun |
| P is the probability of an overrun, D is either the percent of excess distance available or percent of maximum allowable weight, m and n are constants to be determined. |
| B. Modeling the wreckage location | L = 15 + 1.05 E | L is the normalized wreckage location relative to the end of the normalized required landing distance expressed as a percentage of the required landing distance, E is the excess distance between the end of the required landing distance and the runway end expressed as a percentage of the required landing distance. |
| C. Modeling the damage consequences of overruns * |
| P(sd) is the probability of the aircraft suffering substantial damage or being destroyed, P(nm) is the probability of the aircraft suffering no damage or minor damage, B signifies if the aircraft strikes an obstacle beyond the runway end (yes = 1, no = 0), g and h are parameters. |
| P(d) is the probability of the aircraft being destroyed, P(s) is the probability of the aircraft being seriously damaged, B2 signifies if the aircraft struck a second obstacle beyond the runway end (yes = 1, no = 0), S is the runway exit speed in meters per second, and i, j, and k are parameters. |
Table 3.
Coefficients of accident location model.
Table 3.
Coefficients of accident location model.
| Type of Accident | Type of Data | Model | R2 |
|---|
| LDOR | X | | 0.998 |
| Y | | 0.939 |
| LDUS | X | | 0.987 |
| Y | | 0.986 |
| LDVO | Y | | 0.915 |
| TOOR | X | | 0.992 |
| Y | | 0.987 |
| TOVO | Y | | 0.942 |
Table 4.
Advanced location model.
Table 4.
Advanced location model.
| Type of Accident | Type of Data | Model | R2 |
|---|
| LDOR | X | | 0.998 |
| Y | | 0.942 |
| LDUS | X | | 0.986 |
| Y | | 0.989 |
| LDVO | Y | | 0.994 |
| TOOR | X | | 0.989 |
| Y | | 0.991 |
| TOVO | Y | | 0.943 |
Table 5.
Independent variables (Xi) in the accident probability model.
Table 5.
Independent variables (Xi) in the accident probability model.
| Independent Variables (Xi) | Levels of Variable |
|---|
| User Class | Commercial (C) (Base level *) |
| Cargo (F) |
| General Aviation (GA) |
| Taxi/Commuter (T/C) |
| Equipment Class based on Maximum Takeoff Weight (MTOW) | Large Jet (B737, A320, etc.) (C) (Base level) |
| Heavy Jet (B777, A340, etc.) (AB) |
| Large Commuter (Regional Jets, ERJ-190, CRJ-900, ATR42, etc.) (D) |
| Medium Aircraft (Biz Jets, Embraer120, Learjet35, etc.) (E) |
| Small Aircraft (Beech-90, Cessna Caravan, etc.) (F) |
| Engine Type | Jet (Base level) |
| Turboprop |
| Foreign Origin/Destination (Foreign O/D) | Domestic |
| Foreign |
| Ceiling Height | More than 2500 ft (Base level) |
| Less than 200 ft |
| Between 200 ft to 1000 ft |
| Between 1000 ft to 2500 ft |
| Visibility | Visibility is more than 8 miles (Base level) |
| Visibility is less than 2 miles |
| Visibility is between 2 miles and 4 miles |
| Visibility is between 4 miles and 8 miles |
| Crosswind (Xwind) | Less than 2 knots (Base level) |
| Between 2 knit and 5 knots |
| Between 5 knit and 12 knots |
| More than 12 knots |
| Tailwind | Less than 5 knots (Base level) |
| Between 5 knit and 12 knots |
| More than 12 knots |
| Air Temperature | Between 15 °C to 25 °C (Base level) |
| Less than 5 °C |
| Between 5 °C to 15 °C |
| More than 25 °C |
| Gust | Non-existence (Base level) |
| Existence |
| Thunderstorm | Non-existence (Base level) |
| Existence |
| Rain | Non-existence (Base level) |
| Existence |
| Snow | Non-existence (Base level) |
| Existence |
| Fog | Non-existence (Base level) |
| Existence |
| Icing Condition | Non-existence (Base level) |
| Existence |
| Frozen Precipitation | Non-existence (Base level) |
| Existence |
| Hub/Non-Hub Airport | Hub Airport (Base level) |
| Non-Hub Airport |
| Log Criticality Factor | CF < 0 (Base level) |
| CF > 0 |
| Night Condition | It is not night (Base level) |
| It is night |
Table 6.
Values of bi coefficients for the accident probability model.
Table 6.
Values of bi coefficients for the accident probability model.
| Variable | LDOR | LDVO | LDUS | TOOR | TOVO |
|---|
| Adjusted Constant | −13.065 | −13.088 | −15.378 | −14.293 | −15.612 |
| User Class F | - | - | 1.693 | 1.266 | - |
| User Class G | 1.539 | 1.682 | 1.288 | - | 2.094 |
| User Class T/C | −0.498 | - | 0.017 | - | - |
| Aircraft Class A/B | −1.013 | −0.770 | −0.778 | −1.150 | −0.852 |
| Aircraft Class D/E/F | 0.935 | −0.252 | 0.138 | −2.108 | −0.091 |
| Ceiling less than 200 ft | −0.019 | - | 0.07 | 0.792 | - |
| Ceiling 200 to 1000 ft | −0.772 | - | −1.144 | −0.114 | - |
| Ceiling 1000 to 2500 ft | −0.345 | - | −0.721 | - | - |
| Visibility less than 2 SM | 2.881 | 2.143 | 3.096 | 1.364 | 2.042 |
| Visibility from 2 to 4 SM | 1.532 | - | 1.824 | −0.334 | 0.808 |
| Visibility from 4 to 8 SM | 0.2 | - | 0.416 | 0.652 | −1.500 |
| Xwind from 5 to 12 kt | −0.913 | 0.653 | −0.295 | −0.695 | 0.102 |
| Xwind from 2 to 5 kt | −1.342 | −0.091 | −0.698 | −1.045 | - |
| Xwind more than 12 kt | −0.921 | 2.192 | −1.166 | 0.219 | 0.706 |
| Tailwind from 5 to 12 kt | - | 0.066 | - | - | - |
| Tailwind more than 12 kt | 0.786 | 0.98 | - | - | - |
| Temp less than 5 C | 0.043 | 0.558 | 0.197 | 0.269 | 0.988 |
| Temp from 5 to 15 C | −0.019 | −0.453 | −0.710 | −0.544 | −0.420 |
| Temp more than 25 C | −1.067 | 0.291 | −0.463 | 0.315 | −0.921 |
| Icing Condition | 2.007 | 2.67 | 2.703 | 3.324 | - |
| Rain | - | −0.126 | 0.991 | 0.355 | −1.541 |
| Snow | 0.449 | 0.548 | −0.250 | 0.721 | 0.963 |
| Frozen Precipitation | - | −0.103 | - | - | - |
| Gusts | - | −0.036 | 0.041 | 0.006 | - |
| Fog | - | 1.74 | - | - | - |
| Thunderstorm | −1.344 | - | - | - | - |
| Turboprop | - | −2.517 | - | 0.56 | 1.522 |
| Foreign OD | 0.929 | −0.334 | 1.354 | - | −0.236 |
| Hub/Non−Hub Airport | 1.334 | - | - | - | −0.692 |
| Log Criticality Factor | 9.237 | 4.318 | 1.629 | - | 1.707 |
| Night Condition | - | −1.360 | - | - | - |
Table 7.
Air accident rates based on IATA zoning (per one million operations).
Table 7.
Air accident rates based on IATA zoning (per one million operations).
| Zone | Air accident Rates in 2013 | Air Accident Rates in 2014 | Average Air Accident Rates (2009–2013) |
|---|
| AFI | 11.18 | 7.12 | 12.45 |
| ASPAC | 2.57 | 2.90 | 2.76 |
| CIS | 2.19 | 3.14 | 5.92 |
| EUR | 1.35 | 2.75 | 2.03 |
| LATAM | 2.73 | 1.98 | 3.36 |
| MENA | 3.47 | 3.05 | 5.43 |
| NAM | 1.00 | 1.55 | 1.38 |
| NASIA | 0.95 | 0.53 | 0.82 |
Table 8.
List of selected countries and the number of data usable from each country.
Table 8.
List of selected countries and the number of data usable from each country.
| MENA | Number of Data | CIS | Number of Data | LATAM | Number of Data | ASPAC | Number of Data |
|---|
| Iran | 13 | Russia | 65 | Brazil | 21 | Indonesia | 47 |
| Afghanistan | 4 | Ukraine | 8 | Colombia | 11 | India | 13 |
| Sudan | 3 | Kazakhstan | 5 | Argentina | 8 | Japan | 8 |
| Morocco | 2 | Tajikistan | 2 | Bolivia | 6 | Malaysia | 7 |
| Tunisia | 2 | Uzbekistan | 2 | Ecuador | 6 | Philippines | 6 |
| UAE. | 2 | Armenia | 1 | Mexico | 6 | Australia | 5 |
| Yemen | 2 | Georgia | 1 | Venezuela | 3 | Bangladesh | 4 |
| Algeria | 1 | Kyrgyzstan | 1 | Guatemala | 2 | Nepal | 4 |
| Iraq | 1 | | | Honduras | 2 | Pakistan | 4 |
| Saudi Arabia | 1 | | | Nicaragua | 2 | Singapore | 4 |
| | | | | Peru | 2 | New Guinea | 2 |
| | | | | The Bahamas | 1 | South Korea | 2 |
| | | | | Belize | 1 | Thailand | 2 |
| | | | | Chile | 1 | Vietnam | 2 |
| | | | | Cuba | 1 | Brunei | 1 |
| | | | | Dominican Republic | 1 | Laos | 1 |
| | | | | Guyana | 1 | Maldives | 1 |
| | | | | Haiti | 1 | New Zealand | 1 |
| | | | | Jamaica | 1 | Sri Lanka | 1 |
| | | | | Panama | 1 | | |
| SUM | 31 | SUM | 85 | SUM | 78 | SUM | 115 |
Table 9.
Physical characteristics of Mehrabad International Airport runways.
Table 9.
Physical characteristics of Mehrabad International Airport runways.
| Runway | Dimensions (m) | Pavement Type | Stopway | Strip | RESA |
|---|
| 11L | 3989 × 45 | Asphalt | 122 × 45 | - | 226 × 150 |
| 29R | 3989 × 45 | Asphalt | 194 × 45 | - | - |
| 11R | 4030 × 60 | Asphalt | 87 × 45 | - | - |
| 29L | 4030 × 60 | Asphalt | - | - | - |
Table 10.
Physical characteristics of Hasheminejad International Airport runways.
Table 10.
Physical characteristics of Hasheminejad International Airport runways.
| Runway | Dimensions (m) | Pavement Type | Stopway | Strip | RESA |
|---|
| 13L | 3810 × 45 | Asphalt | 302 × 45 | - | - |
| 31R | 3810 × 45 | Asphalt | 303 × 45 | - | - |
| 13R | 3920 × 45 | Asphalt | 300 × 45 | - | - |
| 31L | 3920 × 45 | Asphalt | 296 × 45 | - | - |
Table 11.
Estimation of unknown parameters of the LDOR model in the X-direction.
Table 11.
Estimation of unknown parameters of the LDOR model in the X-direction.
| Unknown Parameter | Estimated Value | Standard Error of the Mean (SE) | 95% Confidence Interval |
|---|
| Lower Bound | Upper Bound |
|---|
| b0 | 0.012 | 0.001 | 0.011 | 0.014 |
| b1 | 0.804 | 0.011 | 0.781 | 0.827 |
Table 12.
Analysis of Variance (ANOVA) for the LDOR model in the X-direction.
Table 12.
Analysis of Variance (ANOVA) for the LDOR model in the X-direction.
| Source of Variations | Sum of Squares | Degree of Freedom (df) | Mean Squares |
|---|
| Regression | 44.340 | 2 | 22.170 |
| Residual | 0.095 | 126 | 0.001 |
| Uncorrected Total | 44.434 | 128 | - |
| Corrected Total | 10.876 | 127 | - |
Table 13.
Estimation of unknown parameters of the LDOR model in the Y-direction.
Table 13.
Estimation of unknown parameters of the LDOR model in the Y-direction.
| Unknown Parameter | Estimated Value | Standard Error of the Mean (SE) | 95% Confidence Interval |
|---|
| Lower Bound | Upper Bound |
|---|
| b0 | 0.932 | 0.018 | 0.897 | 0.966 |
| b1 | 0.275 | 0.005 | 0.264 | 0.286 |
Table 14.
Analysis of Variance (ANOVA) for the LDOR model in the Y-direction.
Table 14.
Analysis of Variance (ANOVA) for the LDOR model in the Y-direction.
| Source of Variations | Sum of Squares | Degree of Freedom (df) | Mean Squares |
|---|
| Regression | 123.142 | 2 | 61.571 |
| Residual | 0.001 | 141 | 0.000 |
| Uncorrected Total | 123.143 | 143 | - |
| Corrected Total | 14.767 | 142 | - |
Table 15.
Estimation of unknown parameters of the LDVO model.
Table 15.
Estimation of unknown parameters of the LDVO model.
| Unknown Parameter | Estimated Value | Standard Error of the Mean (SE) | 95% Confidence Interval |
|---|
| Lower Bound | Upper Bound |
|---|
| b0 | 0.048 | 0.006 | 0.036 | 0.061 |
| b1 | 0.821 | 0.039 | 0.743 | 0.898 |
Table 16.
Analysis of Variance (ANOVA) for the LDVO model.
Table 16.
Analysis of Variance (ANOVA) for the LDVO model.
| Source of Variations | Sum of Squares | Degree of Freedom (df) | Mean Squares |
|---|
| Regression | 17.461 | 2 | 8.731 |
| Residual | 0.118 | 47 | 0.003 |
| Uncorrected Total | 17.579 | 49 | - |
| Corrected Total | 4.078 | 48 | - |
Table 17.
Summarize of accident location model.
Table 17.
Summarize of accident location model.
| Accident Type | Point Model | Interval Model | R2 |
|---|
| LDOR (X) | | | 0.991 |
| LDOR (Y) | | | 1.00 |
| LDVO | | | 0.971 |
Table 18.
Accident consequence model.
Table 18.
Accident consequence model.
| Accident Type | Interval Model |
|---|
| LDOR | |
| LDVO | |
Table 19.
Selected flight specifications at Mehrabad Airport.
Table 19.
Selected flight specifications at Mehrabad Airport.
| Origin | Mashhad |
|---|
| Destination | Tehran |
| Date | 02.12.2016 |
| Landing time in the destination | 18:58 |
| Flight number | 2807 |
| Airline | Meraj |
| Aircraft type | Airbus 320 |
Table 20.
Variables related to the probability model of RE accidents for flight 2807.
Table 20.
Variables related to the probability model of RE accidents for flight 2807.
| Variable | Value or Type | Description |
|---|
| User Class | C | Commercial |
| Maximum Takeoff Weight (MTOW) | C | Large Jet (B737, A320, etc.) |
| Equipment Class | Jet | - |
| Foreign Origin/Destination | Domestic | - |
| Ceiling Height | +2500 | More than 2500 ft |
| Visibility | +8 | More than 8 miles |
| Crosswind | Between 2 and 5 | 3 knots |
| Tailwind | Less than 5 | 3 knots |
| Air Temperature | Between 5 and 15 | 6 ºC |
| Gust | Do not exist | - |
| Thunderstorm | Do not exist | - |
| Rain | Do not exist | - |
| Snow | Do not exist | - |
| Fog | Do not exist | - |
| Icing Condition | Do not exist | - |
| Frozen Precipitation | Do not exist | - |
| Hub/Non-Hub Airport | Hub | - |
| Log Criticality Factor | CF > 0 | Needed length is 6049 ft |
| Night Condition | It is night | - |
Table 21.
Selected flight specifications at Hasheminejad Airport.
Table 21.
Selected flight specifications at Hasheminejad Airport.
| Origin | Tehran |
|---|
| Destination | Mashhad |
| Date | 02.13.2016 |
| Landing time in the destination | 20:03 |
| Flight number | 6254 |
| Airline | Taban |
| Aircraft type | McDonnell Douglas MD-88 |
Table 22.
Variables related to the probability model of RE accidents for flight 6254.
Table 22.
Variables related to the probability model of RE accidents for flight 6254.
| Variable | Value or Type | Description |
|---|
| User Class | C | Commercial |
| Maximum Takeoff Weight (MTOW) | C | Large Jet (B737, A320, etc.) |
| Equipment Class | Jet | - |
| Foreign Origin/Destination | Domestic | - |
| Ceiling Height | +2500 | More than 2500 ft |
| Visibility | Between 5 and 15 | 3.72 miles |
| Crosswind | Less than 2 | 1 knot |
| Tailwind | Less than 5 | 4 knots |
| Air Temperature | Less than 5 | −2 °C |
| Gust | Do not exist | - |
| Thunderstorm | Do not exist | - |
| Rain | Do not exist | - |
| Snow | Do not exist | - |
| Fog | Do not exist | - |
| Icing Condition | Do not exist | - |
| Frozen Precipitation | Do not exist | - |
| Hub/Non-Hub Airport | Hub | - |
| Log Criticality Factor | CF > 0 | Needed length is 5813 ft |
| Night Condition | It is night | - |


 ,
, 


